private debt: key post- pandemic secular trends and
TRANSCRIPT

Private Debt: Key Post-Pandemic Secular Trends and Investment Themes

2020 - a stressful year to remember
Private Debt as an asset class performed quite well through 2020’s pandemic stress test. At the height of the pandemic’s “stay-at-home” business shutdown-related fallout in 2Q20, U.S. real GDP plummeted a record 31% on a SAAR basis and revolver draws surged as borrowers took precautionary measures to preserve liquidity. Credit rating agencies forecasted dire case scenarios of leveraged loan default rates peaking at over 10% by April 2021 — levels not seen since the global financial crisis in October 2009. However, as it turned out, massive central bank liquidity and promising vaccines soon came to the rescue, with agile sponsors infusing capital, cutting costs and adapting business sourcing and product/market strategies as needed. Default rates ended up rising to a peak of only ~4% in September 2020 based on S&P/LCD data and have since fallen to ~3% as of March 2021 — a level close to their long run average. Likewise, while performance among direct lenders has varied widely, the average Business Development Company (BDC) non-accrual rate has likewise fallen from a peak of near 6% in 2Q20 to just over 3% as of 4Q20 according to Refinitiv LPC data. For our part, the experience certainly reinforced our preference for sponsor-backed borrowers, high diversification, high seniority in the capital structure and our biases on industry exposure. Given the challenges, we were pleased that our losses net of recoveries ended 2020 at low levels consistent with our historical average.
So where are we now?
As Exhibit 1 shows, the read on various key middle market debt metrics is mixed but generally favorable on balance. Although leverage multiples are at historically high levels, equity contributions have risen even more to support record purchase price multiples, leaving loan-to-value ratios looking reasonably attractive. Likewise, very low interest rates have left debt service coverage ratios at manageable levels despite higher leverage. All-in spread to leverage ratios have declined in early 2021 from their high/attractive H2 2020 levels back to pre-Covid levels. However, middle market yield premiums are high relative to the broadly syndicated market where spread pressures have been more acute of late.
Exhibit 1: Middle Market Thermometer – Early 2021 vs 2007 Peak
Sources: Refinitiv LPC and LCD S&P Global Market Intelligence. Statistics based on middle market cohorts as defined as <$500MM deal and revenue size by LPC and <$50MM EBITDA by LCD.

Interest rates – lower for longer drives hunger for yield premium
1

Looking forward, as the impact of the pandemic ebbs, what secular trends and investment themes are key to consider when assessing the outlook for private debt and in particular, direct lending to sponsored-backed middle market companies?
Key private debt post-pandemic secular trends and investment themes.
Interest rates – lower for longer drives hunger for yield premium
In its last policy meeting, the U.S. Federal Reserve reiterated its intention to keep its benchmark short-term interest rate near zero through at least 2023. Thus, ultra-low interest rates are likely to remain a key challenge for institutional investors looking to balance their portfolios with assets that can meet current income needs on a favorable risk-adjusted basis. As depicted in Exhibit 2, institutional middle market loans continue to offer a favorable yield premium over broadly syndicated loans, with other forms of private debt (e.g. unitranche) typically offering even higher yield premiums. Exchanging trading liquidity for yield premium will likely continue to be an attractive proposition for many investors, particularly those sensitive to higher pricing volatility prevalent in more liquid debt instruments (i.e. the buy and hold nature of middle market loans tends to make them less susceptible to price volatility — see Exhibit 3). Yield premiums and lower volatility/loss drawdowns account for private debt’s historical and prospective attractive risk-adjusted returns relative to many other asset classes (see Exhibit 4).
Exhibit 2: Institutional Middle Market Yield Premium
Exhibit 3: Standard deviation of daily price changes: HY Bonds vs LSTA Loan Index vs. Middle Market (20-day moving avg)
1

Exhibit 4: Cliffwater LLC Analysis of Historical and Expected Asset Class Returns shows Private Debt as offering attractive returns for the level of risk1
* Returns for Diversified Private Equity, Energy Funds, Infrastructure, Private Debt (UL), Private RE Partnerships, Private Real Estate (UL) are lagged by one quarter.** 10-year risk values are adjusted for smoothing where appropriateSource: Bloomberg Barclays, S&P Dow Jones, FTSE Russell, NCREIF, FTSE NAREIT, Cambridge, Cliffwater, MSCI, HFRI
1 Per Cliffwater LLC 2021: “There can be no assurance that any expected rates of return or risk will be achieved. Expected rates of return and risk may be based upon assumptions regarding future events and conditions that prove to be inaccurate. Expected rates of return and risk should not be relied upon as an indication of future performance and should not form the primary basis for an investment decision. The index returns are provided for information only. Reference to an index does not imply that a portfolio will achieve returns, volatility, or other results similar to the index.

Credit support
Of course, borrowers also benefit from very low interest rates and the massive liquidity provided by the Federal Reserve via improved access to capital, lower debt servicing cost, higher valuations and demand stimulus. Indeed, distressed debt managers that aggressively raised funds during the pandemic in anticipation of a surge in credit defaults are now having to turn to “opportunistic” credit to put their money to work as a large default wave has failed to materialize.
Risks to consider:
• Low rates have allowed for a higher percentage of more speculative, B/B-rated borrowers in the universe of leveraged borrowers. A higher percentage of lower rated companies suggests greater vulnerability across the universe of credits to possible future economic shocks.
• Valuations may be unsustainably inflated by lower-rated interest rates. This may have implications for loan-to-value ratios; however, this risk is of course much more acute for the equity and junior debt in the capital structure that provide a cushion for senior first lien debt.

Inflation – a sign of health or pernicious threat to recovery?
2
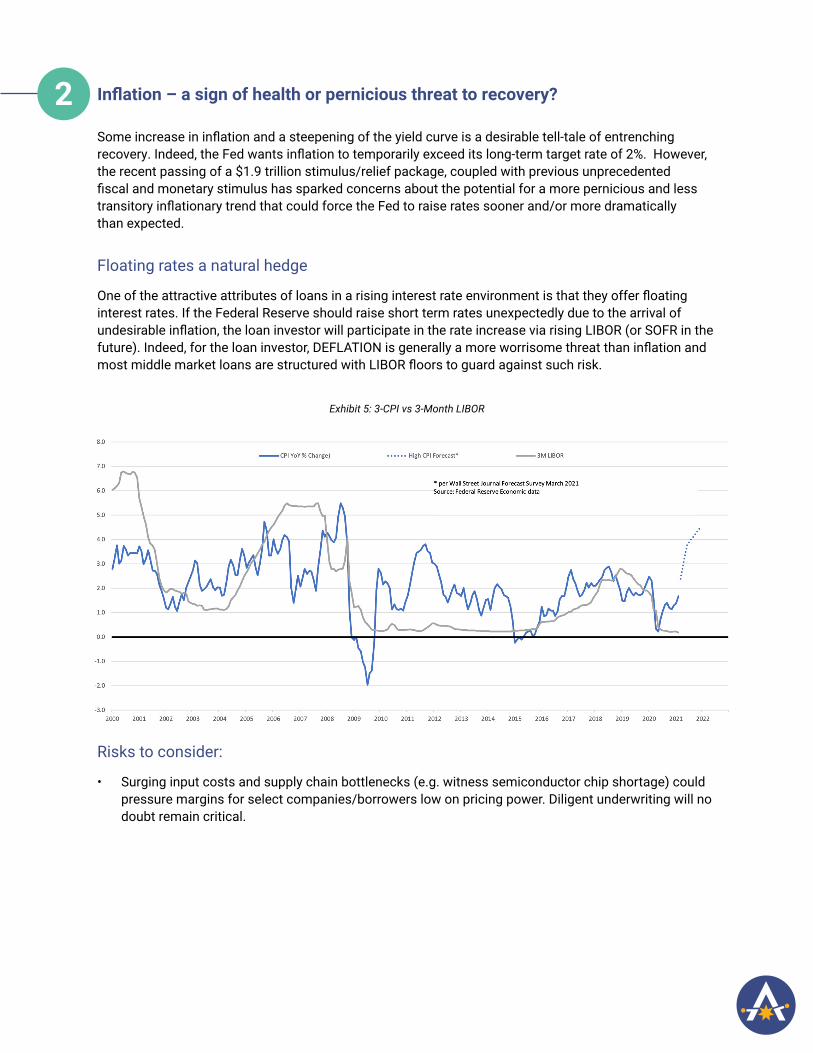
Inflation – a sign of health or pernicious threat to recovery?
Some increase in inflation and a steepening of the yield curve is a desirable tell-tale of entrenching recovery. Indeed, the Fed wants inflation to temporarily exceed its long-term target rate of 2%. However, the recent passing of a $1.9 trillion stimulus/relief package, coupled with previous unprecedented fiscal and monetary stimulus has sparked concerns about the potential for a more pernicious and less transitory inflationary trend that could force the Fed to raise rates sooner and/or more dramatically than expected.
Floating rates a natural hedge
One of the attractive attributes of loans in a rising interest rate environment is that they offer floating interest rates. If the Federal Reserve should raise short term rates unexpectedly due to the arrival of undesirable inflation, the loan investor will participate in the rate increase via rising LIBOR (or SOFR in the future). Indeed, for the loan investor, DEFLATION is generally a more worrisome threat than inflation and most middle market loans are structured with LIBOR floors to guard against such risk.
Exhibit 5: 3-CPI vs 3-Month LIBOR
Risks to consider:
• Surging input costs and supply chain bottlenecks (e.g. witness semiconductor chip shortage) could pressure margins for select companies/borrowers low on pricing power. Diligent underwriting will no doubt remain critical.
2

Middle market to continue to see resilient growth with help from PE
3

Middle market to continue to see resilient growth with help from PE
The middle market is expected to continue to be a resilient growth engine for the U.S. economy in the decade ahead. Middle market companies are defined by the National Center for the Middle Market (NCMM) as having annual revenues between $10 million and $1 billion and account for roughly one-third of private sector U.S. GDP and employment. The segment proved its resiliency through the pandemic, with average revenue dropping just 1.2% in 2020 based on NCMM survey data vs. 5%+ revenue drops for both large companies (as represented by the S&P500) and small businesses with less than 50 employees (based on ADP monthly reporting). The Middle Market also had lower job losses of 2.2% in 2020 vs 5.1% for small businesses and 8.2% for large corporations. This outperformance has been consistent through time with middle market companies seeing 6.5% average annual revenue growth and 4.3% employment growth in the 2012-2019 period — outpacing both large companies on the revenue side, and both large and small on the employment side (see Harvard Business Review, March 8, 2021 “The Middle Market Is Stressed, But Resilient”).
Private equity has played a significant role in this growth and resiliency of the middle market. Pitchbook data shows about 8,900 PE-owned companies in the U.S. in 2020 which is only about 4% of the total population of roughly ~200,000 middle market companies based on 2012 U.S. census and NCMM data (we estimated more like 230k today). However, PE is believed to have much higher ownership penetration among the larger-sized middle market companies with revenues in the $100 million to $1 billion range.
Exhibit 6: U.S. Private-Equity-Owned Company Inventory by Year
As NCMM data shows, private-equity-owned company revenue growth has consistently outpaced the overall NCMM middle market index by about 1-4% over the years (~2% recently). Data from our portfolio of PE-backed borrowers showed almost 5% revenue growth on average in 2020 across over 450 borrowers, with average EBITDA across our portfolio in the $50-55 million range. Admittedly, comparisons here may be skewed by higher PE M&A activity and some selection bias given that PE companies tend to buy leading companies. Still, there is little doubt that PE sponsors have brought value and agility to bear in an ever more complex, volatile and disrupted world. As a leading lender to sponsor-backed borrowers, we have seen numerous examples of this first-hand, particularly during the pandemic crisis — both in the form of financial and managerial support.
3

Challenges ahead
Looking forward, the Coronavirus-induced lock-down has accelerated various secular trends offering both threats and opportunities to middle market companies and their PE owners.
Customer engagement became a challenge requiring strengthening of e-commerce platform offerings and service capabilities. Companies also needed to learn to be able to operate in a remote work environment. Naturally, these requirements played well to the software and technology space which saw accelerated demand. In our 5th annual Compass Report completed in early February 2021 (https://www.antares.com/compass-report-2021/), 50% of borrower respondents noted they expect a 5-20% increase in their IT spending over the next 12 months with another 10% expecting over a 20% increase. These readings are up sharply from the previous pre-Covid Compass Report readings. Increased e-commerce and remote work also have significant implications for commercial real estate, urban infrastructure and mobility trends.
Supply chain fragilities were also exposed during the pandemic with supply chain management listed as a top external challenge by borrowers in our recent Compass Report. Global supply chains may actually grow more complex as some seek to build in greater diversification by multi-sourcing from various countries. This again plays well to supply chain software and automation. In other cases, reshoring/localization of supply chains may offer opportunities of growth.
For more on post-pandemic secular trends, see CPP Investments’ “Thinking ahead – How COVID-19 is shaping the landscape for long-term investors” (https://www.cppinvestments.com/insights/how-covid-19-is-shaping-the-landscape-for-long-term-investors)
Risks to consider
• Dispersion of threats, opportunities and outcomes. Underwriting discipline and industry expertise critical.

Supply/Demand – returns in the balance
4

Supply/Demand – returns in the balance
PE dry powder suggests PD opportunity
Although private debt fundraising has grown significantly in recent years, as Exhibit 7 shows, North American focused private debt dry powder of $219 billion still looks quite manageable relative to PE dry powder of over $1 trillion. Direct lending dry powder as a segment within private debt has more than doubled over the last five years to nearly $80 billion according to Prequin data but remains favorably low relative to PE buyout dry powder of $530 billion. Looking forward, high PE dry powder and continued favorable growth prospects for PE buyout fundraising suggests a healthy store of issuance opportunity for private debt and direct lending in the years ahead.
Of course, the larger question then becomes will PE investors continue to find a healthy supply of targets. At a basic level, using Pitchbook data from Exhibit 6, the net inventory of U.S. PE-owned companies has been rising about 300-500 companies annually, with buyouts partially offset by exits to non-sponsors (e.g. via corporate acquisitions or public listings). While attractive targets among larger sized middle market companies in the $100 million to $1 billion sales range may be becoming somewhat harder to come by, this population is likely still growing at near the 3.5% CAGR seen in the 2012-17 census data and there is still plenty of room for add-on acquisition growth among the 200,000 or so smaller middle market companies with $10 to $100 million in revenues. Sponsor-to sponsor sales (SBOs) have also seen rapid growth.
Exhibit 7: North American PE Dry Powder vs. Private Debt Dry Powder ($B)
4
Looking forward, demographics bode well for LBO and add-on “for sale” target growth, with the bulk of baby boomers expected to hit retirement age by 2029. Many are expected to transition ownership of their businesses within the next 5-10 years. Anticipation of the potential for rising capital gains taxes may also accelerate business sales activity. Meanwhile, potential increased infrastructure investment and trends in reshoring of manufacturing and supply chains could aid in new business formation and growth. On the negative side, lofty valuations and increased taxes and regulation could be a drag on new business formation/productivity and constrain the target set of companies that can generate acceptable returns. PE may also face more competition for deal flow from SPACs that have raised record levels of capital of late. While there are plusses and minuses in the outlook, on balance, we expect there to be a continued healthy supply of lending opportunities in the U.S. sponsor-backed middle market over the next several years.
Demand strengthening
On the loan demand side, investor interest in private debt has risen considerably. While North American-focused direct lending fundraising fell in 2020 according to Prequin data, various surveys show that many investors are still under-allocated to private debt and intend on increasing their allocations. Forecasts from Prequin in early 2021 show private credit AUM globally growing at an 11% CAGR from 2020-2025 — slightly faster than the previous 5-year growth rate of 10%. Of course, private debt funds are not the only source of capital for private equity deals in the U.S. middle market. Banks continue to be a source of capital too, although they play more the role of distributors in syndicated markets and don’t tend to hold much middle market debt (having lost share over the decades due primarily to regulatory requirements).
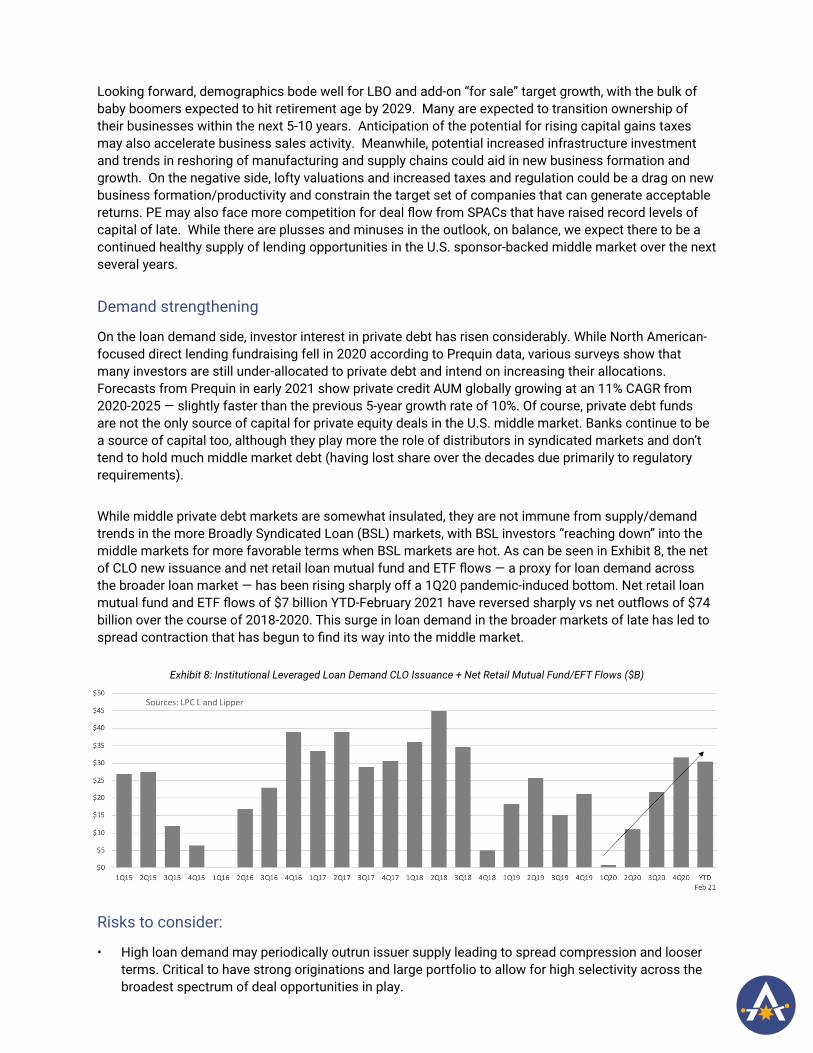
While middle private debt markets are somewhat insulated, they are not immune from supply/demand trends in the more Broadly Syndicated Loan (BSL) markets, with BSL investors “reaching down” into the middle markets for more favorable terms when BSL markets are hot. As can be seen in Exhibit 8, the net of CLO new issuance and net retail loan mutual fund and ETF flows — a proxy for loan demand across the broader loan market — has been rising sharply off a 1Q20 pandemic-induced bottom. Net retail loan mutual fund and ETF flows of $7 billion YTD-February 2021 have reversed sharply vs net outflows of $74 billion over the course of 2018-2020. This surge in loan demand in the broader markets of late has led to spread contraction that has begun to find its way into the middle market.
Exhibit 8: Institutional Leveraged Loan Demand CLO Issuance + Net Retail Mutual Fund/EFT Flows ($B)
Risks to consider:
• High loan demand may periodically outrun issuer supply leading to spread compression and looser terms. Critical to have strong originations and large portfolio to allow for high selectivity across the broadest spectrum of deal opportunities in play.

Samaritans at the Gate: ESG factors increasingly critical value creation drivers for both PE and PD
5

Samaritans at the Gate: ESG factors increasingly critical value creation drivers for both PE and PD
Limited partners, sponsors and lenders alike have become ever more mindful of Environmental, Social and Governance (ESG) factors. ESG considerations came to the forefront during the pandemic, with supply chain and health and safety issues of particular focus. The pandemic lent evidence to studies that have already shown that strong management of ESG issues is associated with resilient companies. Investors have also become acutely aware that market valuations are increasingly based on intangibles, such as intellectual capital, customer relationships, brand value, and other “soft” assets that create shareholder value in a knowledge-driven economy. Conventional accounting does not treat nonfinancial resources—things like human, social, and natural capital—as assets, even though they clearly represent sources of future value.
Interestingly, our 2021 Compass Report showed that almost 90% of PE sponsors have been seeing at least some increased focus on ESG policy by their LPs, and almost half have seen a significant increase. 80% see at least some focus on ESG KPIs and about one-third have seen a significant increase. In contrast, a lesser two-thirds of borrowers polled have a formal or informal ESG policy, and a lesser 43% formal or informal KPIs. This would seem to suggest that sponsors, in some cases pushed by their LPs, are in turn pushing ESG mindfulness down to their middle market investment companies – a hopeful trend for sustainability in the decade ahead.
Conclusions:
The road ahead for direct lenders and the middle market borrowers they serve continues to look quite favorable post 2020’s pandemic stress test, but performance will no doubt continue to vary among lenders. Just as the pandemic determined winners and losers in 2020, new winners and losers may emerge in the wake of massive stimulus, rising raw material costs and wage inflation and supply chain constraints. Shifting secular consumer, workplace, infrastructure and mobility trends will no doubt feed continued business model disruption. At times, there likely will be too much capital chasing too few deals.
Lenders with 1) deep experience through multiple cycles, 2) credit discipline with ESG mindfulness, and 3) selectivity enabled by strong originations, strong sponsor relationships and large, well-diversified portfolios are likely to continue to lead in the years ahead.
Disclaimer:The information in this report is for informational purposes only, is current as of the date noted and should not be used or taken as finance, legal, or other advice. The information presented should not be deemed as a recommendation to purchase or sell any securities or investments. Although Antares Capital LP believes that the information contained herein has been obtained from sources believed to be reliable, Antares Capital LP does not guarantee its accuracy, and it may be incomplete or condensed. Nothing within this publication should be deemed to be a research report. Past performance is not indicative of future results.
5