private asset impact fund - symbiotics
TRANSCRIPT
REPORT 2020An analysis of over 150 investment funds targeting emerging and frontier markets with a development impact focus
October 2020
PR IVATE ASSETIMPACT FUND

AUTHORS AND PUBLICATION TEAM
Brendan Mackinnon, Ramkumar Narayanan and Basile Quartier managed the impact fund survey and wrote this report. Roland Dominicé and Mariano Larena supported them with the editing and sponsorships, as did Samy Derradji and John Staehli for the overall publication coordination.
A special thanks to Gilles Bayon for the technical set up of the survey reporting and administration platforms, as well as Danielle Carpenter who proofread the publication and LaFabrique who managed its graphic design.
LEGAL DISCLAIMERThis paper contains general information only. Symbiotics is not by means of this paper rendering professional advice or services. The content of this paper is meant for research purposes, with an aim to broaden and deepen the understanding of private asset impact funds with a focus on emerging and frontier markets. This paper refers to specific figures, outcomes and performances. Such references are made for research purposes only and are not intended as a solicitation or recommendation to buy or sell any specific investment product or services. Similarly, the information and opinions expressed in the text have been obtained from sources believed to be reliable and in good faith, reflecting the view of the authors on the state of the industry, but no representation or warranty, expressed or implied, is made as to its accuracy or completeness. Before making any decision or taking any action that may affect your finances or your business, you should consult a qualified professional adviser. Symbiotics shall not be held responsible for any loss whatsoever sustained by any person who relies on this paper. It is also meant for distribution only under such circumstances as may be permitted by applicable law.

1
FOREWORD 4
EXECUTIVE SUMMARY 6
1 / ABOUT THE PAIF SURVEY 111.1 Successor of the Symbiotics MIV Survey 131.2 Scope, market size & methodology 141.3 Peer group definitions 171.4 Sample size 20
2 / INVESTMENT MANAGERS 212.1 Business model 232.2 Market share & concentration 252.3 Industry initiatives 26
3 / PRIVATE ASSET IMPACT FUNDS – FINANCIAL METRICS 273.1 Fund profile (key terms) 293.2 Size & growth 333.3 Balance sheet structure 363.4 Investment instruments 403.5 Impact sectors 423.6 Investee types 443.7 Geography of investments 473.8 Investment terms 543.9 Risk analysis 623.10 Fees & costs 673.11 Investor composition 693.12 Financial performance 72
4 / PRIVATE ASSET IMPACT FUNDS – IMPACT METRICS 774.1 Development finance narrative 794.2 SDG intent 804.3 ESG integration 864.4 BOP outreach 88
5 / PANDEMIC PERIOD UPDATE 93
FEATURED SPONSORS 102
APPENDICES 115
TABLE OF CONTENTS

SPONSORSHIP CONTRIBUTIONS
This report would not have been possible without the leadership and sponsorship of the State Secretariat for Economic Affairs (SECO), supporting both Symbiotics and Canopy, a new company dedicated to impact fund services, in jointly co-sponsoring this survey and report.
About SymbioticsSymbiotics is the leading market access platform for impact investing, dedicated to financing micro- small and medium enterprises and low- and middle-income households in emerging and frontier markets. Since 2005, Symbiotics has structured and originated some 4,000 deals for over 450 companies in almost 90 emerging and frontier markets, representing more than USD 5.5 billion. These investments have been purchased by more than 25 fund mandates and more than 50 third-party specialized fund managers, forming a growing ecosystem and marketplace for such transactions.
About the State Secretariat for Economic Affairs (SECO)Centre of expertise for economic developmentThe Economic Cooperation and Development division is part of SECO's economic competence. We use this expertise specifically for international cooperation, benefiting from direct access to leading economic organizations, government offices and central banks.
We focus on advanced developing and transition countries facing specific challenges in regard to development policy. Our programs are aligned with national and international development strategies. We systematically apply quality assurance, risk monitoring and results-driven management as part of our programs. This is how we make sure that our measures actually have an impact. We obtained ISO 9001 certification in 2001.
Since 2007, we have also contributed to efforts to reduce social and economic disparities in the enlarged European Union. This contribution falls under Switzerland's European policy and is not part of development cooperation.
Reducing poverty through sustainable growth Our mission is to help achieve sustainable economic growth that reaches all segments of the population in our partner countries, using a range of economic and trade policy measures. In doing so, we aim to reduce poverty and the impact of global risks. Growth should address economic as well as social and environmental aspects, without compromising the well-being of future generations. It enables the private sector to create more jobs and the government to deliver central public services.
To achieve our objective, we have defined four target outcomes: Effective institutions and services More and better jobs Trade and competitiveness Climate-friendly growth
2

These form our contribution to implementing the United Nations 2030 Agenda and its 17 goals for sustainable development. We systematically take into account the cross-cutting themes of good governance and gender equality in all areas of our work.
About CanopyCanopy Impact Fund Solutions is a new company offering independent research, impact and investment services for the impact investing ecosystem. Today, there are about 440 specialized funds and 210 specialized managers, which all require transversal market functionalities to mainstream and enhance their offering. Canopy aims at supporting them, with transparency, comparability and connectivity, amongst themselves and with investors. The firm is a spin-off from Symbiotics market intelligence and fund benchmarking activities, its impact reporting and measurement services, as well as its deal valuation and matchmaking solutions.
Co-sponsorsWe would also like to thank the following impact funds and impact fund managers who have accepted to sponsor this research publication by featuring themselves in its pages. They represent a great array and diversity of the impact fund industry and this initiative would not have been possible without their support.
ACTIAM AlphaMundi Group Caspian Advisors Deetken Impact European Solidarity Financing Fund for Africa
(FEFISOL) Grassroots Capital Management Incofin Investment Management INOKS Capital Regional MSME Investment Fund for Sub-Saharan
Africa (REGMIFA) Small Enterprise Assistance Funds (SEAF) Seedstars International Social Investment Managers and Advisors (SIMA) Swiss Investment Fund for Emerging Markets (SIFEM) TriLinc Triodos Investment Management Vox Capital WaterEquity
3

4
The Swiss State Secretariat for Economic Affairs (SECO) and Swiss Sustainable Finance (SSF) both have worked for many years and in a variety of joint projects with the industry to identify and promote innovative solutions that contribute to financing the Sustainable Development Goals (SDGs).
We welcome this new report that provides an important update on the universe of private impact investments targeting emerging and frontier markets. The USD 22 billion reported in this publication represent a subset of the wider impact investing market (including developed countries) and the even broader global market of sustainable investments (including manifold strategies in liquid markets). It has long been argued that additional sources of capital, beyond aid, are required to close the financing gap to reach the SDGs. Private impact investing with a focus on developing countries, the topic of this publication, represents this kind of additional development finance. In light of the Covid-19 crisis, financing needs to tackle the resulting challenges in developing countries will even grow further. Alongside government responses, impact investing strategies can support people and SMEs in need, by providing capital to support their resilience and facilitate recovery.
It is great to see that this industry has grown worldwide to 435 private asset impact funds and 210 investment managers, in the last count offered by this publication. Both the current size of this market and the growth of about 10% last year bear witness of the strong dynamics and bright future of this industry. Yet, if we compare this with annual SDG investment needs, there is a massive need and opportunity for further growth and innovation in this segment. At the same time, we are facing questions around impact management processes, impact measurement and reporting. This report offers a deep dive into the diversity and innovative approaches of impact strategies and will, over time, allow for a benchmarking of the industry.
We are proud to witness that investment managers headquartered in Switzerland account for 35% of the total asset size - an impressive share, which is one of the facets of a strong market of sustainable investments in Switzerland, as illustrated in the annual SSF market study on sustainable investments. We are determined to build on this great expertise in our country and to promote Switzerland as a logical place of business for impact investing fund managers and investors. SSF and SECO have been running a national workgroup on impact investing for many years. In close cooperation with market players and other actors of the ecosystem, we are tackling questions around impact, favorable frameworks and market intelligence, as well as research and education.
FOREWORD

5
Yet, we also strive towards opening a constructive dialogue with a wide array of private and public actors around the world, with a view to building expertise and supporting the appropriate framework conditions for such finance to grow to new levels. We are, therefore, very happy to see so many new funds and managers having emerged around the world and are keen to liaise with other centers to foster cooperation and use synergies in further growing the global market of development finance.
This first global private asset impact fund report was prepared by Symbiotics as a continuation of previous work reviewing microfinance investment vehicles (MIVs) and private debt impact funds (PDIFs). We believe the standardization, transparency and comparability that it brings into the market is an essential tool in the build-up of this industry, helping to crowd in further private sector investors.
We are positive the vibrant community of development finance players will continue to innovate and create impactful investment vehicles that contribute to tangible change. We wish each of them great success and are convinced that we can jointly grow development finance to the size needed to address the urgent issues the world is facing today.
Liliana de Sá KirchknopfHead of the Private Sector
Development Section, SECO
Sabine Döbeli CEO
Swiss Sustainable Finance

6
This survey is a first of its kind. It builds on the previous impact fund surveys Symbiotics has developed, on microfinance investment vehicles (MIVs) initiated in 2007 with CGAP/World Bank, and on private debt impact funds (PDIFs) initiated in 2018 with the GIIN.
The investment universe definition of Private Asset Impact Funds (PAIFs) includes all investment vehicles with more than 50% of their non-cash asset allocated both to private debt and/or private equity instruments and to emerging and frontier markets, with a development impact bias.
The surveyed PAIFs are part of the wider development finance investment space, which regroups both public sector and private sector investments. The latter is composed of both direct investments, and indirect investment through investment vehicles operated by specialized impact fund managers. This paper addresses and analyses this latter part of the market.
Survey coverage: This survey compiles data on 157 funds affiliated to 78 managers that are located in 26 countries. The survey team identified and contacted 435 PAIFs and 210 managers. In terms of assets under management, the survey covers about two-thirds of the market of private asset impact funds.
Market size: The survey aggregates USD 22.2 billion of fund assets. The total private asset impact fund market is estimated at USD 33 billion overall.
The survey brings the most comprehensive data set to date on this investment fund universe. It also sheds light on their primary asset classes and their primary impact sectors, and analyzes their impact management and measurement approaches, inherent to development finance investments. The report also highlights microfinance funds given their historical prominence within the PAIF landscape.
ANALYTICAL DIMENSIONS
Primary Asset Class Fixed income funds Equity funds Mixed funds
Primary Impact Sectors Climate & Energy Food & Agriculture Health & Education Housing, Water & Communities Microfinance SME development Multi-sector
Impact Measurement Approaches Sustainable finance principles
(ESG integration) Impact investing principles
(SDG intent) Inclusive finance principles
(BOP outreach)
EXECUTIVE SUMMARY

7
KEY HIGHLIGHTS ON IMPACT METRICS
Impact investing (SDG intent) measurement: Most PAIFs map their social and/or environmental goals against the SDGs, not only at the fund level (37%), but also at investee (29%) and transaction levels (26%). Also, most PAIFs already have dedicated SDG reporting for their investors (60%), with SDG 1, SDG 8 and SDG 5 being the most targeted. Post-investment indicators of impact performance linked to these SDG intents are also available within this report, with more mature sectors like Microfinance or Climate & Energy offering advanced measurement protocols and quantitative outputs.
Sustainable finance (ESG integration) measurement: The majority of PAIFs integrate ESG screening into investment decisions, offer some forms of ESG reports to their investors, and include social/environmental covenants within investment agreements.
Inclusive finance (BOP outreach) measurement: Quantitative metrics show a bias of PAIFs’ portfolio exposure to lower middle income (47%) and upper middle income (43%) countries, with the average GNI per capita of PAIF portfolios amounting to USD 6,290. PAIF investees, in most part financial institutions, employ slightly more men than women (55/45 ratio) while at the level of microfinance funds, end-borrower outreach is tilted towards rural (59%) and women borrowers (69%), through loan balances of USD 1,800 at the median observation.
KEY HIGHLIGHTS ON FINANCIAL METRICS
Manager location & concentration: As of December 2019, the combined asset size of USD 22.2 billion was mostly managed out of Switzerland (35%), followed by the Netherlands (18%), Germany (14%) and the United States (12%). The 10 largest investment managers from the sample account for 65% of the total survey size.
Fund size & growth: The average balance sheet size of a PAIF amounts to USD 141 million. These funds witnessed a growth of 9.5% in 2019 while they forecast a negative growth (-1.5%) for 2020 due to the current global pandemic.
Microfinance: The surveyed pool includes 157 funds, of which 86 are microfinance funds, representing 72.5% of the asset size.

PRIVATE ASSET IMPACT FUNDS
Balance sheet structure: 84% of PAIFs’ assets are invested in impact-related activities, while cash stands at 10%. The 49 Leveraged PAIFs have average balance sheets of USD 139 million and an average debt-to-equity ratio of 0.87.
Investment instruments: Private debt is the most used financial instrument, with USD 15.1 billion (92% senior debt; 8% subordinated debt) outstanding as of December 2019. Private equity stands at USD 3.2 billion (82% common equity; 18% preferred equity), with higher exposures outstanding per investee (USD 4.2 million) compared to private debt (USD 2.3 million).
Impact sectors: Microfinance accounts for the majority of PAIFs’ investment portfolios, at USD 10.8 billion outstanding at year-end (58% of the total). It is followed by the SME development (21%) and Food & Agriculture (7%) sectors. Climate & Energy investees are those who attract the largest volumes on average (USD 4.4 million), and Health & Education ones the smallest (USD 1.08 million).
Investee types: Financial institutions absorb the highest volumes (USD 14.4 billion outstanding; 86% of the total), making them the prime investee type of PAIFs. They are followed by SMEs (11%), whereas non-financial corporations and project finance remain uncommon within the PAIF universe.
Geography of investments: Latin America & the Caribbean captures the largest share of direct investments, at 28% of the total portfolio outstanding, followed by Eastern Europe & Central Asia (25%) and South Asia (16%). The top five countries of investments are India (13%), Ecuador (5%), Cambodia (5%), Georgia (4%) and Mexico (4%).
Debt investment terms: PAIF debt investments are mostly denominated in hard currency (64% vs. 36% in local currency, of which 30% remain unhedged), with a fixed coupon interest rate (66% vs. 34% with a floating rate). Portfolio yields average 7.6%, with significant differences coming in effect when segmenting the results by investee types or currency hedging strategies.
Risk analysis: The bulk of PAIFs’ country exposure sits within a range of B3 to A3 on Moody’s long-term sovereign risk rating scale, with the median rating being Ba2. Annual provisions and write-offs amounted to 0.8% and 0.3% of average assets in 2019.
Fees & costs: Management fees, which include all administration, investor relation and distribution costs, averaged 1.5% in 2019 for all PAIFs. Operating expenses amounted to 2.3%.
Investor composition: PAIFs from the sample source 52% of their funding from institutional investors, followed by 27% from private retail and qualified individuals (HNWIs) and the rest (21%) from public funders.
Financial performance: Impact investing strategies brought positive financial returns for investors in 2019. Unleveraged PAIFs generated net returns above the 4% mark in USD for all three asset strategies: 4.3% for Fixed Income; 4.6% for Mixed; 6.3% for Equity PAIFs. In the same currency, Leveraged PAIFs returned 2.7% on their equity tranche and 4.3% for their noteholders.
8
9
MICROFINANCE FUNDS
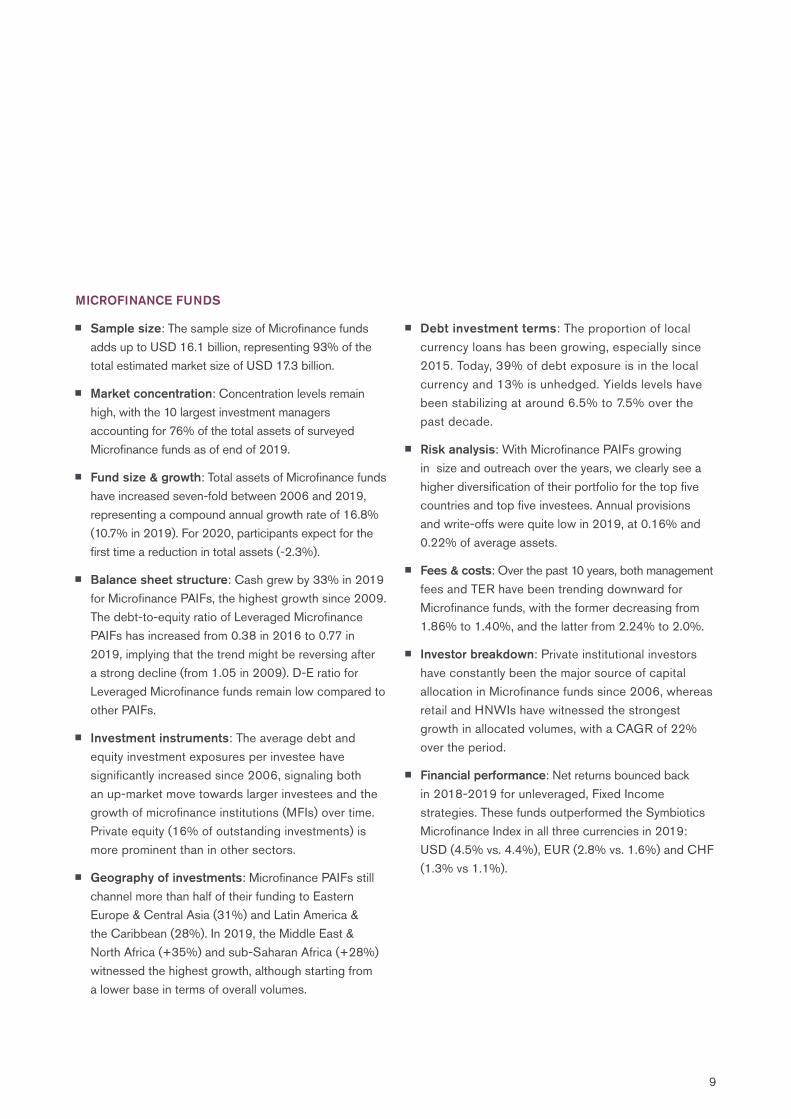
Sample size: The sample size of Microfinance funds adds up to USD 16.1 billion, representing 93% of the total estimated market size of USD 17.3 billion.
Market concentration: Concentration levels remain high, with the 10 largest investment managers accounting for 76% of the total assets of surveyed Microfinance funds as of end of 2019.
Fund size & growth: Total assets of Microfinance funds have increased seven-fold between 2006 and 2019, representing a compound annual growth rate of 16.8% (10.7% in 2019). For 2020, participants expect for the first time a reduction in total assets (-2.3%).
Balance sheet structure: Cash grew by 33% in 2019 for Microfinance PAIFs, the highest growth since 2009. The debt-to-equity ratio of Leveraged Microfinance PAIFs has increased from 0.38 in 2016 to 0.77 in 2019, implying that the trend might be reversing after a strong decline (from 1.05 in 2009). D-E ratio for Leveraged Microfinance funds remain low compared to other PAIFs.
Investment instruments: The average debt and equity investment exposures per investee have significantly increased since 2006, signaling both an up-market move towards larger investees and the growth of microfinance institutions (MFIs) over time. Private equity (16% of outstanding investments) is more prominent than in other sectors.
Geography of investments: Microfinance PAIFs still channel more than half of their funding to Eastern Europe & Central Asia (31%) and Latin America & the Caribbean (28%). In 2019, the Middle East & North Africa (+35%) and sub-Saharan Africa (+28%) witnessed the highest growth, although starting from a lower base in terms of overall volumes.
Debt investment terms: The proportion of local currency loans has been growing, especially since 2015. Today, 39% of debt exposure is in the local currency and 13% is unhedged. Yields levels have been stabilizing at around 6.5% to 7.5% over the past decade.
Risk analysis: With Microfinance PAIFs growing in size and outreach over the years, we clearly see a higher diversification of their portfolio for the top five countries and top five investees. Annual provisions and write-offs were quite low in 2019, at 0.16% and 0.22% of average assets.
Fees & costs: Over the past 10 years, both management fees and TER have been trending downward for Microfinance funds, with the former decreasing from 1.86% to 1.40%, and the latter from 2.24% to 2.0%.
Investor breakdown: Private institutional investors have constantly been the major source of capital allocation in Microfinance funds since 2006, whereas retail and HNWIs have witnessed the strongest growth in allocated volumes, with a CAGR of 22% over the period.
Financial performance: Net returns bounced back in 2018-2019 for unleveraged, Fixed Income strategies. These funds outperformed the Symbiotics Microfinance Index in all three currencies in 2019: USD (4.5% vs. 4.4%), EUR (2.8% vs. 1.6%) and CHF (1.3% vs 1.1%).


1
ABOUT THE PAIF SURVEY
This chapter describes the Private Asset Impact Fund (PAIF) survey and how it expands on previous fund research initiatives focused on microfinance and private debt impact funds. It also describes the survey scope and the methodology used, including the peer group definitions and criteria for a PAIF to qualify for inclusion in the study sample. The chapter concludes with the sample size in terms of assets under management (AUM) and number of PAIFs and how this relates to the overall PAIF market universe.
1.1 SUCCESSOR OF THE SYMBIOTICS MIV SURVEY
1.2 SCOPE, MARKET SIZE & METHODOLOGY
1.3 PEER GROUP DEFINITIONS
1.4 SAMPLE SIZE


Symbiotics fund research activities have historically focused on offering transparency and benchmarking solutions on microfinance investment vehicles (MIVs). This research expertise was initially built in partnership with the Consultative Group to Assist the Poor (CGAP), which initiated the first MIV benchmarking report in 2007. The MIV survey has been taking place on a yearly basis ever since, with over 90% market coverage during its 13-year span.
While the MIV sector has kept growing steadily over more than a decade, it witnessed the development of impact investing solutions beyond microfinance, through both historical MIV managers offering new and innovative products for impact investors and the emergence of new fund management companies developing expertise in niche sectors using a more diverse range of instruments and approaches to address a multiplicity of topics.
Acknowledging this evolution, the Symbiotics research team started exploring return patterns in impact sectors beyond microfinance, thanks to a research
partnership with the Global Impact Investing Network (GIIN), publishing The Financial Performance of Impact Investing Through Private Debt in 2018. This reference study, which saw a second edition in 2019, confirmed the market need for more transparency on the broader spectrum of private asset impact funds (PAIFs), including debt and equity funds, and not only on their financial performance, but also for on their asset structure, portfolio composition, risk metrics, investor base and impact performance.
This first edition of the PAIF Survey builds on these research efforts dating back more than a decade at Symbiotics, with a vision today to provide PAIFs, their fund managers, advisers and investors with the most comprehensive benchmarking and transparency report in the sector.
Starting in 2021, the survey will be performed by Canopy, a new company spun-off from Symbiotics, providing more independence, visibility, growth and development to such research and benchmarking activities.
1.1 SUCCESSOR OF THE SYMBIOTICS MIV SURVEY
13
1.0 ABOUT THE PAIF SURVEY

MARKET REPORT 2020
14
ScopeAs a continuation of our initial work with MIVs and private debt impact funds (PDIFs), the survey was sent out to all known investment funds with an impact bias, solely targeting emerging and frontier markets and using only private asset strategies (both private debt and equity).
Market sizeThe private asset impact fund (PAIF) study analyzes a subsegment of the global impact fund space, which to be comprehensive would regroup both developed and advanced economies, and both listed and private asset strategies. We deliberately focus only on emerging and frontier markets and only on private asset strategies, knowing that many other transparency and benchmarking initiatives exist on listed funds and advanced markets.
The first edition of this survey regroups 157 funds run by 78 investment managers, which altogether represent USD 22 billion of assets under management. This study has further identified, as of December 2019, a total of 210 investment managers, covering 435 private asset impact funds. In terms of volume, it estimates the participating funds to represent about two-thirds of the total space of private asset impact funds with an emerging market coverage. This would bring the target investment universe to USD 33 billion.
Based on the GIIN's Annual Impact Investor Survey 2020,1 there is USD 715 billion of assets under management in impact investing. More than 60% (or USD 443 billion) are invested through listed asset strategies. The rest, about USD 272 billion, are invested through private asset strategies.
Of those, about 60% (or USD 159 billion) are invested in emerging and frontier markets. This is what is considered as development finance, being both a subsection of sustainable finance, in the sense of integrating ESG norms into the investment value-chain, and impact investing, in the sense of positively addressing the SDGs. What differentiates it from other sustainable finance and impact investing strategies are the private markets in which it operates and its North-South development cooperation bias, as it aims to achieve inclusive growth for low-income households and small businesses in underserved and underdeveloped markets (see section 4.1 Development Finance narrative for more information).
Development finance investments regroup: (1) the public sector actors and policy investors: multilateral banks, development finance institutions and government aid agencies, as well as (2) private sector investors: investing directly and indirectly (through specialized investment funds). The GIIN estimates the private sector development finance investments volume at USD 90 billion.
The latter portion of private sector development finance investments, which invests through specialized investment funds, is the investment universe that the PAIF report 2020 seeks to grasp in more depth and detail through this study.
1.2 SCOPE, MARKET SIZE & METHODOLOGY
1 Global Impact Investing Network (GIIN) (2020). The Annual Impact Investor Survey 2020.

15
1.0 ABOUT THE PAIF SURVEY
In comparison, impact investing, and its development finance investments, form only a small fraction of the global capital markets. They nevertheless enjoy very strong backwinds and attraction amongst asset management and wealth management operators. The gap and margin of progression towards becoming a significant portion of sustainable finance, let alone mainstream capital markets offers impressive growth prospects. Estimates show that
the broader sustainable finance landscape, which includes environmental, social and governance (ESG) integration strategies, stands at USD 31 trillion, according to the last biennial report from the Global Sustainable Investment Alliance2. ESG strategies have taken up an important share of the overall global asset and wealth management industry in recent years, currently at about 30% of its USD 89 trillion total at the end of 2019.3
2 Global Sustainable Investment Alliance (2019). The Global Sustainable Investment Review 2018.3 Boston Consulting Group (2020). Global Asset Management 2020: Protect, Adapt, and Innovate
Sustainable financeUSD 31 trillion
Impact investingUSD 715 billion
Global assets under managementUSD 89 trillion
Private assetsUSD 272 billion
Emerging and frontier marketsUSD 159 billion
Impact investing
USD 715 billion
Figure 1 – Investment universe
Investment funds33 billion
Private sector90 billion

MethodologyWe have aggregated all data presented in this study by collecting it directly from individual fund information reported by survey participants themselves (the PAIFs), usually through their fund managers or investment managers. For comparability purposes, we have converted all indicators from PAIF accounting currencies to US dollars (USD) using end of 2019 exchange rates. Historical datapoints on Microfinance funds also use end of 2019 exchange rates applied to all previous years up to 2006 to remove the effects of currency movements against the USD for the calculation of growth indicators.
CRITERIA INCLUDED EXCLUDED
Impact intentionality Intention/mission to generate social, and/or environmental impact alongside a financial return.
No clear intention/mission to generate social or environmental impact alongside a financial return
Asset type Private assets Listed assets
Prime geographical focus Emerging and/or frontier markets Developed markets
Vehicle type Investment funds, investment companies, structured finance vehicles, as well as dedicated non-governmental organizations (NGOs), cooperatives or foundations
Asset owners, government agencies, development finance institution (DFIs), funds of funds, holdings/networks
MARKET REPORT 2020
In terms of survey inclusion criteria, all PAIFs composing the sample need to: 1 Be a stand-alone investment vehicle (asset owners, funds of funds, holding companies and networks do not qualify);2 Have an impact bias inscribed at the core of their strategy, defined as having a clear intention to generate social and/
or environmental impact alongside a financial return, and measuring it; 3 Invest more than 85% of their portfolio in private assets (debt or equity); 4 Invest more than 85% of their portfolio in emerging and frontier markets.
Table 1 – Inclusion criteria
16
1.0 ABOUT THE PAIF SURVEY
4 Consultative Group to Assist the Poor (CGAP) (2010). Microfinance Investment Vehicles Disclosure Guidelines.
In this study, we have classified PAIFs in distinct peer groups according to their asset class and primary impact sector of focus.
Peer group classification according to asset class: Fixed Income PAIFs: Investment vehicles of which the core activity, defined as more than 85% of their total
non-cash assets, is to invest in debt instruments. Equity PAIFs: Investment vehicles of which the core activity, defined as more than 65% of their total non-cash
assets, is to invest in equity instruments. Mixed PAIFs: Investment vehicles that invest in both debt and equity, with more than 15% and less than 65%
of their total non-cash assets invested in equity investments.
We made this peer group classification in accordance with the CGAP MIV Disclosure Guidelines;4 it could result in a different classification compared to the vehicle’s mission statement.
Peer group classification according to primary impact sector of focus:
We define the primary impact sector of the survey participant at the 50% mark in terms of its impact portfolio. For instance, if a PAIF has 65% of investments in Climate & Energy, while it spreads the rest of its impact portfolio across other sectors, we categorize the PAIF under the peer group “Climate & Energy”.
We classify a PAIF as “Multi-sector” only in cases where not a single sector accounts for 50% or more of its impact portfolio.
We have derived the breakdown by impact sectors from the GIIN’s recognized definitions and adjusted them based on PAIF business models and the overall study sample size.
17
1.3 PEER GROUP DEFINITIONS

GIIN CATEGORIES PAIF IMPACT SECTORS
Arts & Culture Climate & Energy
Education Food & Agriculture
Energy Health & Education
Financial services (excl. microfinance) Housing, Water & Communities
Food & Agriculture Microfinance
Forestry & Timber SME development
Healthcare Multi-sector
Housing
Information & Communication Technologies (ICT)
Infrastructure
Manufacturing
Microfinance
Water, Sanitation & Hygiene (WASH)
Table 2 – Impact sector classification
Climate & Energy: Energy financing with a sustainable bias includes strategies to reduce energy use and save energy in a more efficient manner and/or use renewable energy and clean technologies for alternative production and consumption schemes, or a combination of both. This category can extend to forestry, land use and conservation, as well as insurance schemes to, for instance, address climate preservation. Overall, the multiplicity of models and businesses in this segment best address SDG 7 (Affordable and Clean Energy) and SDG 13 (Climate Action).
Food & Agriculture: Agricultural value chain financing, whether production, trade, distribution or other models, focuses on businesses that increasingly adopt a sustainable approach to the extraction and harvesting of natural products from the planet, whether crops, cattle, fisheries or other plants and animals. With a sustainability intentionality attached to it, the businesses engaged in these sectors address SDG 2 (Zero Hunger), SDG 14 (Life below Water) and SDG 15 (Life on Land).
Health & Education: Providing student and school loans or financing innovative digital learning solutions or, more generally, knowledge transfer and management contribute to SDG 4 (Quality Education). Financing hospitals and clinics, healthcare plans, services and insurance, and the production and distribution of health products contribute to SDG 3 (Good Health and Well-being).
Housing, Water & Communities: This category groups housing, infrastructure and utilities investments, and the industries that develop, support and construct them, with a bias towards sustainable innovation to, for instance, provide green buildings, transportation, water or waste collection and treatment systems that are accessible and affordable for the base of the pyramid. They can be linked with SDG 6 (Clean Water and Sanitation), SDG 9 (Industry, Innovation and Infrastructure) and SDG 11 (Sustainable Cities and Communities).
18
MARKET REPORT 2020
Mapping SDGs to impact sector classification

Private AssetImpact Funds
1.0 ABOUT THE PAIF SURVEY
Microfinance: This category refers to the provision of and access to financial services at the base of the pyramid in underserved economies. It primarily addresses a household finance need, either in terms of financial security (credit lines, savings, insurance, payments) or in terms of household consumption (loans and targeted savings programs). It also contributes to financing small household income streams (working capital loans for small entrepreneurial or employment activities). Microfinance models tend to focus on the poorest categories of clients, are positively biased towards women, and intend, by design, to reduce gaps in income, consumption and access to finance. They are typically linked to SDG 1 (No Poverty), SDG 5 (Gender Equality) and SDG 10 (Reduced Inequalities).
Small and medium enterprise (SME) development: Refers to the financing of small and medium enterprises, broadly defined as employing respectively 5 to 50 and 50 to 250 employees.5 SME development is principally about employment and entrepreneurship as vehicles for growth and economic development. SMEs typically represent the vast majority of formalized companies in a given country, as well as both the largest share of employment and the largest contributions to its GDP. They are thus the most valuable means to addresses normative, behavioral and practical changes when it comes to responsibly producing and consuming the goods and services put forth to the public. The funds in this sector are typically linked to SDG 8 (Decent Work and Economic Growth) and SDG 12 (Responsible Consumption and Production).
Figure 2 – Primary SDGs by impact sector
5 The European Union defines a small enterprise as less than 50 employees, EUR 10 million in turnover or assets, and a medium enterprise as less than 250 employees, EUR 50 million in turnover or assets. Financing of SMEs might vary widely in size, for instance from EUR 10,000 to EUR 10 million. These metrics might differ significantly in emerging or frontier markets.
Microfinance
Food &Agriculture
Climate &Energy
SMEdevelopment
Housing, Water &Communities
Health & Education
19
MARKET REPORT 2020
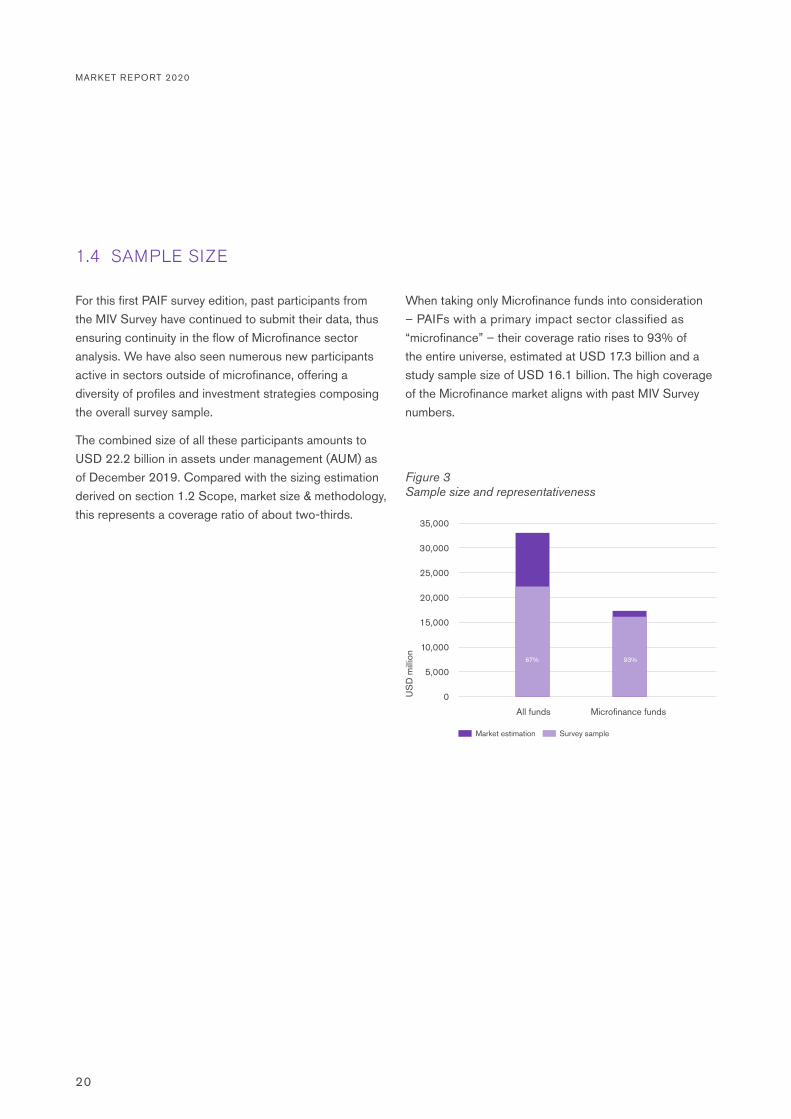
For this first PAIF survey edition, past participants from the MIV Survey have continued to submit their data, thus ensuring continuity in the flow of Microfinance sector analysis. We have also seen numerous new participants active in sectors outside of microfinance, offering a diversity of profiles and investment strategies composing the overall survey sample.
The combined size of all these participants amounts to USD 22.2 billion in assets under management (AUM) as of December 2019. Compared with the sizing estimation derived on section 1.2 Scope, market size & methodology, this represents a coverage ratio of about two-thirds.
When taking only Microfinance funds into consideration – PAIFs with a primary impact sector classified as “microfinance” – their coverage ratio rises to 93% of the entire universe, estimated at USD 17.3 billion and a study sample size of USD 16.1 billion. The high coverage of the Microfinance market aligns with past MIV Survey numbers.
Figure 3Sample size and representativeness
10,000
15,000
20,000
5,000
Microfinance fundsAll funds
Market estimation Survey sample
0
25,000
30,000
35,000
US
D m
illion
20
1.4 SAMPLE SIZE
93%67%

2
INVESTMENT MANAGERS
This chapter delves into the investment manager landscape by first providing an overview of their business model, roles and position within the impact investing value chain. It then quantifies their market share within the study sample, first in terms of their headquarters and then at a company level. Finally, the chapter describes industry initiatives of which they are signatories and/or members.
2.1 BUSINESS MODEL
2.2 MARKET SHARE & CONCENTRATION
2.3 INDUSTRY INITIATIVES

CANOPY / MARKET REPORT 2020

PAIFs are stand-alone investment vehicles with a dedicated balance sheet; in most cases they are set up as a registered investment fund in a given jurisdiction, pooling money from multiple investors and investing it on their behalf in a diversified set of private assets, either debt or equity, or a mix of both. Their specific legal status, and the needs, rights and obligations that go with them, vary from one jurisdiction to another. The way they are managed, and their governance setup, also vary from one another.
A breakdown of their key functions will include: (1) fund management (holding the regulatory license for running the fund, overseeing other functions, and usually managing the risk and compliance requirements), (2) fund administration (running the administrative, accounting, legal, tax and audit functions), (3) fund distribution (selling the fund to investors and managing those relations), (4) investment management (portfolio construction and monitoring, either as a delegated discretionary portfolio manager, or as an adviser to the fund manager), and (5) other sub-advisory functions (market research and access, sourcing and origination, investee due diligence, credit risk analysis, impact assessments, deal structuring, deal valuations, brokerage, etc.).
Historically, most roles were merged into the same company, the fund manager vertically integrating all investment value chain functions. But over the years, and especially more recently, as well as in more mature market segments, companies are gradually spreading these functions across specialized firms and actors. The governance and management of PAIFs will thus vary greatly based on the segmentation of the roles and functions along the investment value chain. Whatever the setup, PAIFs sit at the center of the value chain, pooling investor money and injecting it with an impact bias at the base of the pyramid (BOP) in underserved emerging and frontier economies.
The base of the pyramid can be defined as low- and middle-income households and/or micro- small and medium sized businesses in low- and middle-income economies. The investees catering for the base of the pyramid can be categorized as either: (1) financial institutions, (2) small and medium enterprises (SMEs), (3) corporations, or (4) projects and project finance transactions.
2.1 BUSINESS MODEL
23
2.0 INVESTMENT MANAGERS
Fund distribution
Financial institutions
INVESTORSGlobal capital markets:
Public funders, Institutional investors, Retail investors, HNWIs
PRIVATE ASSETIMPACT FUNDS
INVESTEES
BASE OF THE PYRAMID
EMERGING ANDFRONTIER MARKETS
Fund administration
Non-financial institutions: SMEs, Corporations, Projects
Fund management
Investment management
Other sub-advisory functions
Figure 4 – Investment value chain

MARKET REPORT 2020
Emerging and frontier markets Upper-middle-, lower-middle- and low-income countries, as defined by the World Bank.
Financial institutions Any type of financial institutions (banks, non-bank financial institutions, credit cooperatives, savings houses, leasing schemes, insurance plans, etc.) addressing the BOP.
Small and medium enterprises (SMEs) Businesses which employ between 5 and 50 employees (small), and between 50 and 250 employees (medium).
Corporations Any larger company, outside of the SME sector in relation to both number of employees and asset size, which for the purpose and context of PAIFs may typically have financing needs in excess of USD 10 million.
Projects A project finance transaction, usually for larger infrastructure or industrial financing, outside of the balance sheet of their sponsors, in the sense of relying solely on the project’s cash flows for repayment, with the project’s assets held as collateral.
Base of the pyramid (BOP) Low- and middle-income households and/or micro, small and medium-sized enterprises (MSMEs) in underserved economies.
Low- and middle-income households Households with net disposable income that is average or below average, ranging from extremely poor to moderately poor and vulnerable non-poor levels, as defined by the World Bank.
24
DEFINING THE INVESTMENT UNIVERSE AND VALUE CHAIN
Public funders Including multilateral banks, development financial institutions and other government and policy investors.
Institutional investors Pension funds, financial institutions (such as insurance companies, banks and asset management companies), treasury departments of companies, funds of funds, NGOs and foundations.
Private investors Typically defined in the private banking world as high-net-worth individuals (HNWIs), having investable assets in excess of a certain amount of money (e.g. USD 1 million).
Retail investors Private investors with smaller amounts of available cash to invest than HNWIs. Funds targeting retail investors typically need to register for a public distribution license with their regulators.
Private asset impact funds (PAIFs) Investment funds with more than 50% of non-cash assets allocated to impact investments through private instruments (debt and/or equity), targeting in majority emerging and frontier markets.
Table 3 – Defining the investment universe and value chain

2.0 INVESTMENT MANAGERS
Our study sample includes 78 investment managers, a number that encompasses both fund managers covering the full PAIF value chain, as well as other more specialized entities offering only investment management services or a wider array of services. Together, they are located in 26 countries.
Their headquarters are mostly located in Switzerland (35% AUM, 35 PAIFs), the Netherlands (18% AUM, 16 PAIFs), Germany (14%, 9 PAIFs) and the United States (9% AUM, 23 PAIFs). Western European companies collectively manage 85% of AUM through 101 PAIFs, ahead of North American ones, with a market share of 9% in terms of AUM (28 PAIFs).
In terms of market concentration, the top 10 investment managers account for 65% of the total sample size, signaling a relatively concentrated market on its upper segment.
Concentration levels in the Microfinance segment are even higher, with the top 10 players accounting for 76% of assets as of end of 2019.
Austria
Mauritius
Belgium
India
Other
The Netherlands
Germany
Switzerland
United States
Sweden
Luxembourg% of AUM
Figure 5Top 10 fund investment management countries
50%
40%
30%
20%
10%
Top 3
35%
43%47%
55%
65%
76%
Top 5 Top 10
All funds Microfinance funds
0
60%
70%
80%
90%
100%
% o
f AU
M
Figure 6Top 10 fund investment managers
25
2.2 MARKET SHARE & CONCENTRATION
35
1814
9
4
4
3
32
71

MARKET REPORT 2020
26
Principles/guidelines/standards As the industry has grown and evolved from financial inclusion to impact investing, a multiplicity of principles, reporting guidelines and standards are bringing more transparency and common reporting frameworks to the sector.
According to our sample, participants adopted foremost the Principles for Responsible Investment (PRI; 22 companies), the International Finance Corporation’s (IFC) Operating Principles for Impact Management
(16 companies) and the Smart Campaign’s Client Protection Principles (CPP;6 15 companies). Other responses from survey participants notably included the Principles for Investors in Inclusive Finance (PIIF), the United Nations Development Programme's SDG Impact Practice Standards for Private Equity Funds and the United Nations Environment Programme Finance Initiative's Principles for Positive Impact Finance.
Organization membershipsSeveral organizations and networks now facilitate promotion, discussion and knowledge sharing between fund managers, institutional investors, NGOs and associations, as well as DFIs and other public entities.
The GIIN, the Social Performance Task Force (SPTF) and the European Microfinance Network (EMN) appear to be the organizations with the highest membership and participation rate among survey respondents, with 31, 17 and 11 companies reporting membership, respectively.
2.3 INDUSTRY INITIATIVES
Number of signatories
Principles for Responsible Investment
IFC's Operating Principles for Impact Management
Smart Campaign's Client Protection Principles
Principles for Investors in Inclusive Finance
UNDP's SDG Impact Practice Standards for Private Equity Funds
Other
22
16
16
15
6
5
Figure 7 – Principles, guidelines and standards
Number of members
Global Impact Investing Network
Social Performance Task Force
European Microfinance Network
Swiss Sustainable Finance
Asian Venture Philanthropy Network
Council on Smallholder Agricultural Finance
European Venture Philanthropy Association
Other(s)
31
17
4
18
11
6
4
4
Figure 8 – Organization memberships
6 In July 2020, the Center for Financial Inclusion, which had housed the Smart Campaign since its inception, announced it would transfer the management of the Smart Campaign Client Protection Standards to the Social Performance Task Force and CERISE, and that the Smart Certification Program would wind down in April 2021. Read the full press release.
3
PRIVATE ASSET IMPACT FUNDS – FINANCIAL METRICSThis chapter presents aggregated metrics of our PAIF sample. For most indicators, we have disaggregated the information by main peer groups, including primary impact sector, and asset class. Where relevant, we have applied additional filters to contextualize the findings. In addition, we present past MIV Survey results along with 2019 datapoints complementing the 13-year data track record for Microfinance PAIFs. The chapter starts by profiling the PAIFs within the overall sample, before delving into more operational results on the market size and growth, as well as more specifically on PAIF balance sheets, investment instruments, investees, sectors, geography, investment terms, risks, investors and financial performance.
3.1 FUND PROFILE (KEY TERMS)
3.2 SIZE & GROWTH
3.3 BALANCE SHEET STRUCTURE
3.4 INVESTMENT INSTRUMENTS
3.5 IMPACT SECTORS
3.6 INVESTEE TYPES
3.7 GEOGRAPHY OF INVESTMENTS
3.8 INVESTMENT TERMS
3.9 RISK ANALYSIS
3.10 FEES & COSTS
3.11 INVESTOR COMPOSITION
3.12 FINANCIAL PERFORMANCE

28

29
Inception & closingStarting in the late 1990s, development finance emerged as a topic for private sector investments, notably through the launch of pioneering Microfinance funds. This space has evolved, initially through private debt funds and
eventually through private equity funds. It has also diversified beyond microfinance, particularly in the last decade, as shown below. In 2019 specifically, 17 new funds were launched, with 10 of them being focused on microfinance.
Open-ended PAIFs, which do not have set end dates, account for 78% of AUM. Closed-ended funds account for the rest, with defined termination dates; their median term is currently set for 2023. Whereas open-ended funds are predominantly Fixed Income funds, closed-ended
ones include both debt and equity strategies. Looking specifically at Equity funds that are still in activity, their median vintage year was 2014, with a median investment period of five years, ending in 2019.
3.1 FUND PROFILE (KEY TERMS)
Nb. of funds Fixed income Equity Mixed
Open-ended 85 65 4 16
Closed-ended 72 31 30 11
Total 157 96 34 27
Table 4 – Sample matrix - Primary asset class and vehicle term
10
5
0
-5
-10
-20
-15
15
20
25
30
Num
ber o
f fun
ds
1975
1976
1977
1978
1979
1980
1981
1982
1983
1984
1985
1986
1987
1988
1989
1990
1991
1992
1993
1994
1995
1996
1997
1998
1999
2000
2001
2002
2003
2004
2005
2006
2007
2008
2009
2010
2011
2012
2013
2014
2015
2016
2017
2018
2019
2020
2021
20
2220
2320
2420
2520
2620
2720
2820
2920
3020
3120
3220
3320
3420
35
Non-microfinance funds Microfinance funds
Figure 9 – Inception and closing dates
3.0 PR IVATE ASSET IMPACT FUNDS - F INANCIAL METR ICS
Newly opened funds
Funds terminated & expected to close
MARKET REPORT 2020
30
Figure 10 – Domicile
United States
Netherlands
Luxembourg
Mauritius
Belgium
Cayman Islands
Canada
Norway
India
Singapore
Other
63
21
16
11
6
33
5
5
19
5
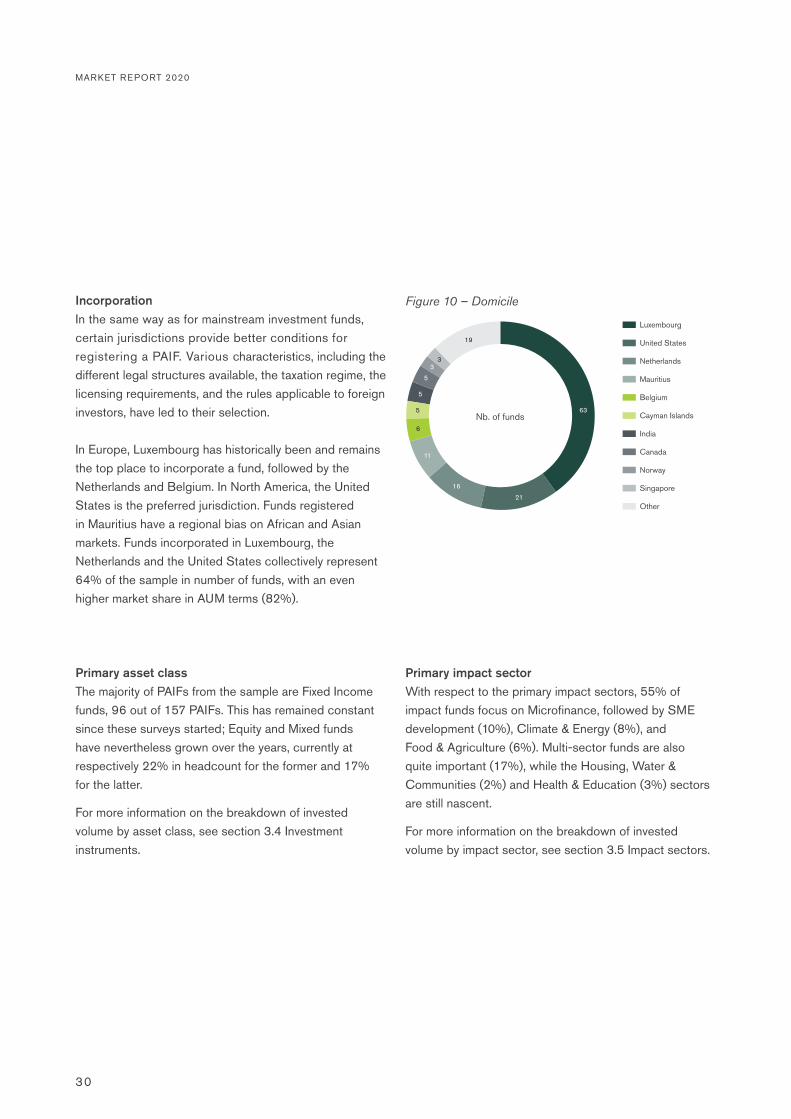
Primary asset classThe majority of PAIFs from the sample are Fixed Income funds, 96 out of 157 PAIFs. This has remained constant since these surveys started; Equity and Mixed funds have nevertheless grown over the years, currently at respectively 22% in headcount for the former and 17% for the latter.
For more information on the breakdown of invested volume by asset class, see section 3.4 Investment instruments.
Primary impact sectorWith respect to the primary impact sectors, 55% of impact funds focus on Microfinance, followed by SME development (10%), Climate & Energy (8%), and Food & Agriculture (6%). Multi-sector funds are also quite important (17%), while the Housing, Water & Communities (2%) and Health & Education (3%) sectors are still nascent.
For more information on the breakdown of invested volume by impact sector, see section 3.5 Impact sectors.
IncorporationIn the same way as for mainstream investment funds, certain jurisdictions provide better conditions for registering a PAIF. Various characteristics, including the different legal structures available, the taxation regime, the licensing requirements, and the rules applicable to foreign investors, have led to their selection.
In Europe, Luxembourg has historically been and remains the top place to incorporate a fund, followed by the Netherlands and Belgium. In North America, the United States is the preferred jurisdiction. Funds registered in Mauritius have a regional bias on African and Asian markets. Funds incorporated in Luxembourg, the Netherlands and the United States collectively represent 64% of the sample in number of funds, with an even higher market share in AUM terms (82%).
Nb. of funds

3.0 PR IVATE ASSET IMPACT FUNDS - F INANCIAL METR ICS
31
Table 5 – Sample matrix - Primary impact sector and asset class
Table 6 – Fund typeFund typeThe sample is largely composed of investment funds, but 10% take the form of NGOs, cooperatives or foundations (15 out of 157). These non-profit legal statutes generally have a below-market rate of return philosophy.
Nb. of funds Fixed income Equity Mixed
Climate & Energy 12 5 3 4
Food & Agriculture 10 7 2 1
Health & Education 4 3 0 1
Housing, Water & Communities
3 3 0 0
Microfinance 86 57 13 16
SME development 16 10 3 3
Multi-sector 26 11 13 2
Total 157 96 34 27
2019 Nb. of funds
Cooperative 6
Foundation 7
Investment company 5
Investment fund 134
NGO 2
Structured finance instrument 3
Total 157
MARKET REPORT 2020
32
Number of funds
KfW
EU
DEG
Swedfund
FMO
USAID
OeEB
BID
IFC
EIB
SIFEM
BIO
Japan Gov
BMZ
CDC
AFD
SECO
Luxembourg Gov
10
4
3
3
2
2
2
2
2
2
1
1
1
1
1
1
5
6
Figure 12 – Public sponsors
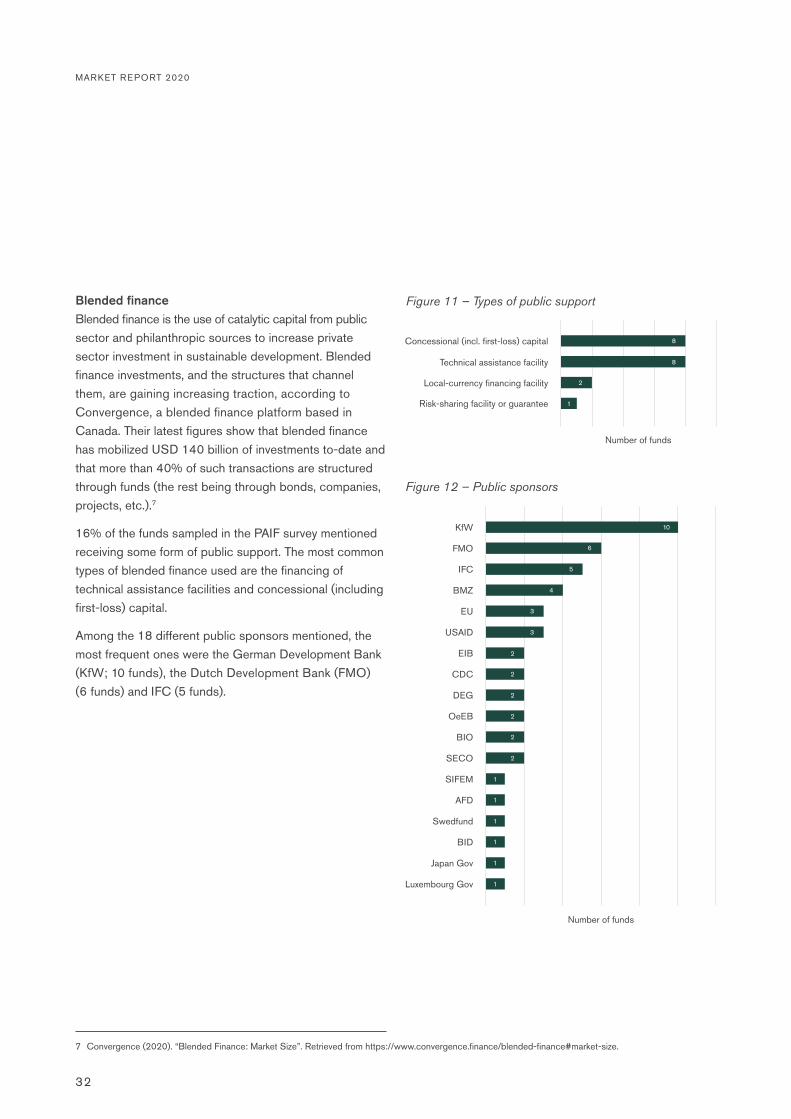
Blended financeBlended finance is the use of catalytic capital from public sector and philanthropic sources to increase private sector investment in sustainable development. Blended finance investments, and the structures that channel them, are gaining increasing traction, according to Convergence, a blended finance platform based in Canada. Their latest figures show that blended finance has mobilized USD 140 billion of investments to-date and that more than 40% of such transactions are structured through funds (the rest being through bonds, companies, projects, etc.).7
16% of the funds sampled in the PAIF survey mentioned receiving some form of public support. The most common types of blended finance used are the financing of technical assistance facilities and concessional (including first-loss) capital.
Among the 18 different public sponsors mentioned, the most frequent ones were the German Development Bank (KfW; 10 funds), the Dutch Development Bank (FMO) (6 funds) and IFC (5 funds).
Number of funds
Concessional (incl. first-loss) capital
Risk-sharing facility or guarantee
Local-currency financing facility
Technical assistance facility
8
8
2
1
Figure 11 – Types of public support
7 Convergence (2020). “Blended Finance: Market Size”. Retrieved from https://www.convergence.finance/blended-finance#market-size.

3.0 PR IVATE ASSET IMPACT FUNDS - F INANCIAL METR ICS
33
Inception & closingA private asset impact fund’s average size amounts to USD 141 million.
Fixed Income funds (USD 172 million) are typically larger than Mixed funds (USD 138 million) and Equity funds (USD 58 million). Fixed Income funds logically, given their size, but also their reach for diversification in managing their risk, have a broader outreach in number of regions, countries, sectors and investees.
The average size also varies considerably when looking at the different primary impact sectors. Specifically, Microfinance (USD 186 million) and Multi-sector (USD 116 million) funds are on average significantly larger than their counterparts. On the other end, Health & Education (USD 24 million) and Housing, Water & Communities (USD 50 million) funds are by far the smallest ones.
Focusing on Microfinance funds, we see that the average fund size has increased considerably since 2006, when it stood at USD 40 million.
3.2 SIZE & GROWTH
87100
80
60
40
20
All funds Climate & Energy
Food & Agriculture
Health & Education
Housing, Water & Communities
Microfinance SME development
Multi-sector Fixed income Equity Mixed
141
84
24
50
186
64
116
172
58
138
0
120
140
160
180
200
US
D m
illion
Figure 13 – Average size
250
200
150
100
50
2006 2007 2008 2009 2010 2011 2012 2013 2014 20172015 20182016 20190US
D m
illion
Fixed incomeAll Microfinance funds MixedEquity
Figure 14 – Historical average size of Microfinance funds

MARKET REPORT 2020
34
Market growthThe total assets of PAIFs increased by 9.5% on average in 2019, calculated on a constant sample of 134 PAIFs.
Participants expect a 1.5% reduction in total assets in 2020 as a result of the economic impact of the COVID-19 pandemic (see last section "Pandemic Period Update").
The year 2019 saw an important increase in the assets of Mixed (+14.8%) and Fixed Income funds (+9.2%), particularly compared to Equity funds (+2.1%). For 2020, the latter are also those that expect the largest decrease (-8.1%), followed by Mixed funds (-4.8%), whereas Fixed Income funds expect a null growth (+0.2%).
At a sectoral level, Climate & Energy funds are those that grew the most in 2019 (+20.1%), followed by Microfinance (+10.7%) and Multi-sector (+7.1%) funds. SME development (-1.3%) and Housing, Water & Communities funds (-0.2%) witnessed slight decreases in 2019. Regarding assets as of end 2020, Climate & Energy (-6.6%) and SME development (-5.2%) funds forecast the largest reductions, whereas Health & Education (+35.6%) (starting from a lower base in terms of size) and Food & Agriculture (+7.4%) are more optimistic.
% AUM growth
Fixed income
Equity
Mixed
9.2%
0.2%
-4.8%14.8%
2.1%
-8.1%
-10% 0% 10% 20%
2019 2020 Forecast
Figure 15 – Growth by primary asset class
% AUM growth
Microfinance
SME development
Housing, Water & Communities
Health & Education
Food & Agriculture
Climate & Energy
Multi-sector
-2.3%
1.3%
-5.2%
-0.2%
10.7%
0.1%
35.6%
-6.6%
7.1%
7.1%
7.4%
5.1%
20.1%
-1.3%
-10% 0% 20%10% 40%30%
2019 2020 Forecast
Figure 16 – Growth by primary impact sector

Since 2006, the size of Microfinance funds has increased seven-fold, representing a compound annual growth rate of 16.8%, a number partly driven by rapid growth in the early years when the industry was still nascent. Microfinance funds have indicated their lowest growth prospects for 2020, translating their negative
market sentiment linked to the ongoing COVID-19 pandemic. As of this writing, Luxembourg-based Microfinance funds have registered total asset growth of -2% in the period December 2019 - September 2020 according to the Symbiotics Luxembourg MIV List.8
8 The Luxembourg List provides a monthly assessment of the asset size and microfinance portfolio of Microfinance funds incorporated in Luxembourg. The list is available at https://syminvest.com.
3.0 PR IVATE ASSET IMPACT FUNDS - F INANCIAL METR ICS
35
40%
30%
20%
10%
0
Actual growth Forecasted growth
-10%
50%
60%
% A
UM
gro
wth
Figure 17Historical growth of Microfinance funds
2007 2008 2009 2010 2011 2012 2013 2014 2015 2016 2017 2018 20202019

36
Asset compositionOn average, PAIFs invested 84% of total assets in impact-related activities. Cash stands at 10%, whereas non-impact portfolios (which include sovereign bonds, for instance) and other assets (such as accrued interests and receivables) remain low (1% and 5% respectively).
Cash levels are higher for Fixed Income (10%) and Mixed funds (12%), as explained by their higher liquidity management needs, either for portfolio replenishing or investor redemptions.
On the contrary, Equity funds that are closed-ended by nature and use capital calls and distribution policies to manage their liquidity tend to exhibit less cash (1%). For these Equity funds, the average size of their committed capital amounts to USD 93 million, about two-thirds (63%) of which are called (paid-in). However, higher levels of uncalled commitments are available for PAIFs in the Food & Agriculture as well as Climate & Energy sectors, at 78% and 65% of total committed capital respectively.
3.3 BALANCE SHEET STRUCTURE
50%
40%
30%
20%
10%
All funds Fixed income Equity Mixed
Other assets Cash and cash equivalents
Other portfolio Impact portfolio
0
60%
70%
80%
90%
100%
% o
f AU
M
Figure 18 – Asset composition by primary asset class
50%
40%
30%
20%
10%
All Equity funds
Climate & Energy
Food & Agriculture
Microfinance SME development
Multi-sector
Paid-in capital Uncalled commitments
0
60%
70%
80%
90%
100%
% o
f com
mite
d ca
pita
l
Figure 19 – Paid-in capital and uncalled commitments by primary impact sector
MARKET REPORT 2020

3.0 PR IVATE ASSET IMPACT FUNDS - F INANCIAL METR ICS
37
The asset composition appears to be quite similar across the different impact sectors. However, we have observed larger cash levels in the Health & Education sector (27%). On the other end, funds in the Climate & Energy and SME development sectors have the highest portion of assets invested in impact (91% and 87% respectively).
Over a ten-year period, Microfinance funds have seen their cash levels drop from 18% in 2009 (which was a high growth year, resulting in +89% cash levels compared to 2008) down to 9% at the end of 2019. Overall, this signals a better market outreach and absorption capacity for Microfinance funds over the years. Nonetheless, cash grew by 33% in 2019 for Microfinance funds, the highest growth since 2009.
Equity & liabilities compositionOf the 153 funds in the sample that have reported on their equity and liabilities composition, 49 funds finance part of their capital structure through debt funding from investors, in addition to raising equity. We categorize such funds as Leveraged PAIFs in this study.
These Leveraged PAIFs have average balance sheets of USD 139 million, with notes and other debt securities issued representing 46%. Their average debt-to-equity ratio amounts to 0.87.
Leveraged PAIFs are found in all sectors, but proportionally more so in Climate & Energy when compared to Unleveraged funds. In addition, the Leveraged funds in the sample are almost exclusively Fixed Income (32) and Mixed (15) funds, with only 2 Equity funds using some debt mechanisms to finance their overall capital.
10%
0
8%
-20%
6%
4%
2%
2007 2008 2009 2010 2011 2012 2013 2014 2015 2016 2017 2018 2019
Cash growth (right axis) Cash levels (left axis)
0 -40%
12%
20%
14%
40%
16%
60%
18%80%
20% 100%
Cas
h as
% o
f AU
M
Cas
h gr
owth
, yea
r-on
-yea
r
Figure 20 – Historical cash levels of Microfinance funds
38
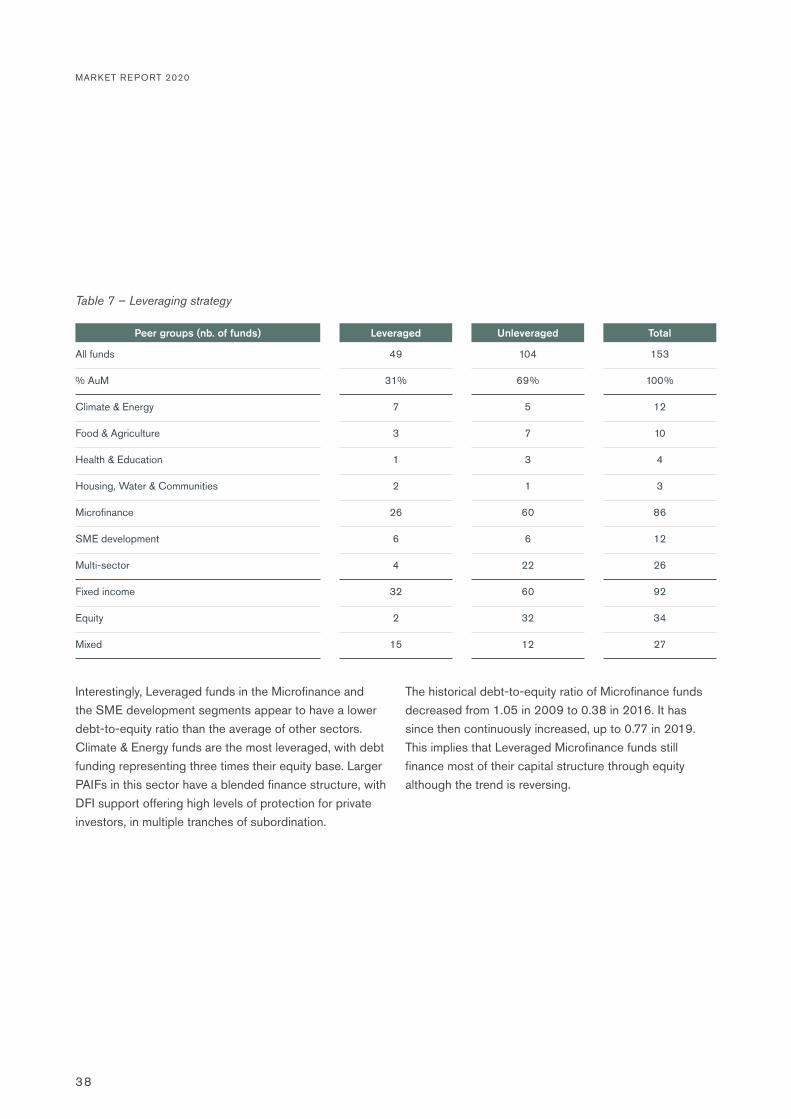
Peer groups (nb. of funds) Leveraged Unleveraged Total
All funds 49 104 153
% AuM 31% 69% 100%
Climate & Energy 7 5 12
Food & Agriculture 3 7 10
Health & Education 1 3 4
Housing, Water & Communities 2 1 3
Microfinance 26 60 86
SME development 6 6 12
Multi-sector 4 22 26
Fixed income 32 60 92
Equity 2 32 34
Mixed 15 12 27
Table 7 – Leveraging strategy
MARKET REPORT 2020
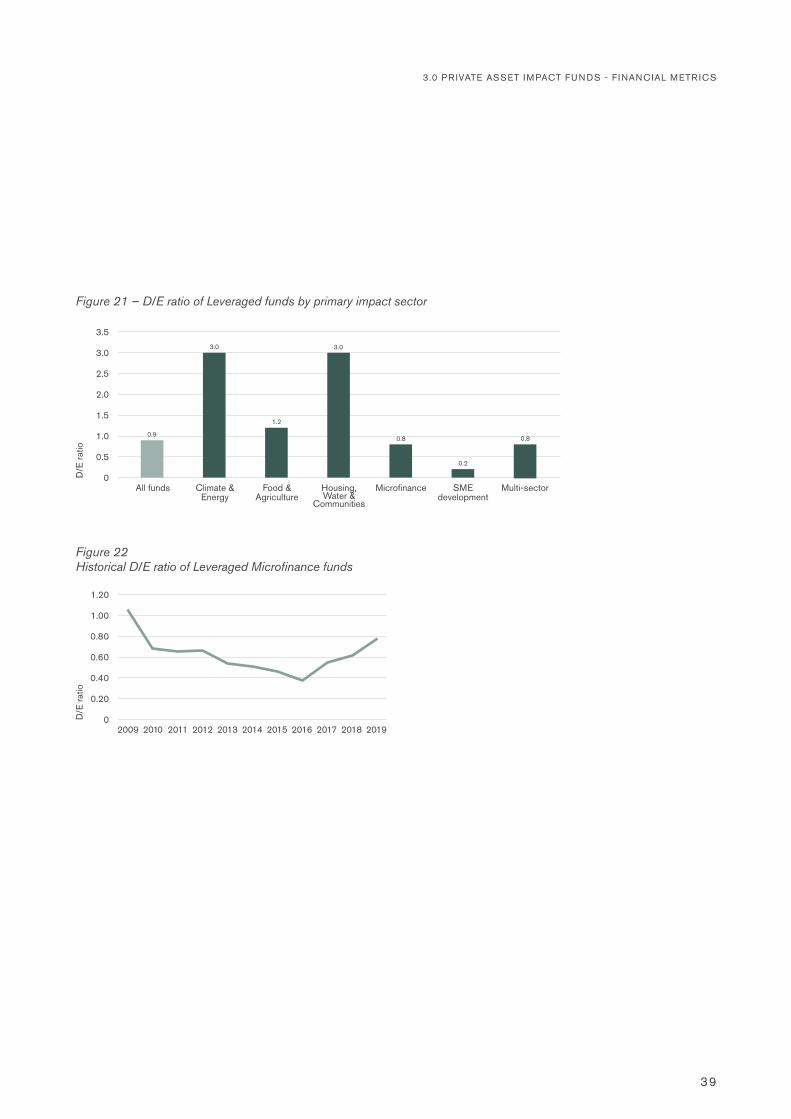
Interestingly, Leveraged funds in the Microfinance and the SME development segments appear to have a lower debt-to-equity ratio than the average of other sectors. Climate & Energy funds are the most leveraged, with debt funding representing three times their equity base. Larger PAIFs in this sector have a blended finance structure, with DFI support offering high levels of protection for private investors, in multiple tranches of subordination.
The historical debt-to-equity ratio of Microfinance funds decreased from 1.05 in 2009 to 0.38 in 2016. It has since then continuously increased, up to 0.77 in 2019. This implies that Leveraged Microfinance funds still finance most of their capital structure through equity although the trend is reversing.
3.0 PR IVATE ASSET IMPACT FUNDS - F INANCIAL METR ICS
39
1.00
0.80
0.60
0.40
0.20
2009 2010 2011 2012 2013 2014 2015 2016 2017 2018 20190
1.20
D/E
ratio
Figure 22 Historical D/E ratio of Leveraged Microfinance funds
2.5
2.0
1.5
1.0
0.5
All funds Climate & Energy
Food & Agriculture
MicrofinanceHousing, Water &
Communities
SME development
Multi-sector0
3.0
3.5
D/E
ratio
Figure 21 – D/E ratio of Leveraged funds by primary impact sector
0.9
3.0
1.2
3.0
0.8
0.2
0.8
40
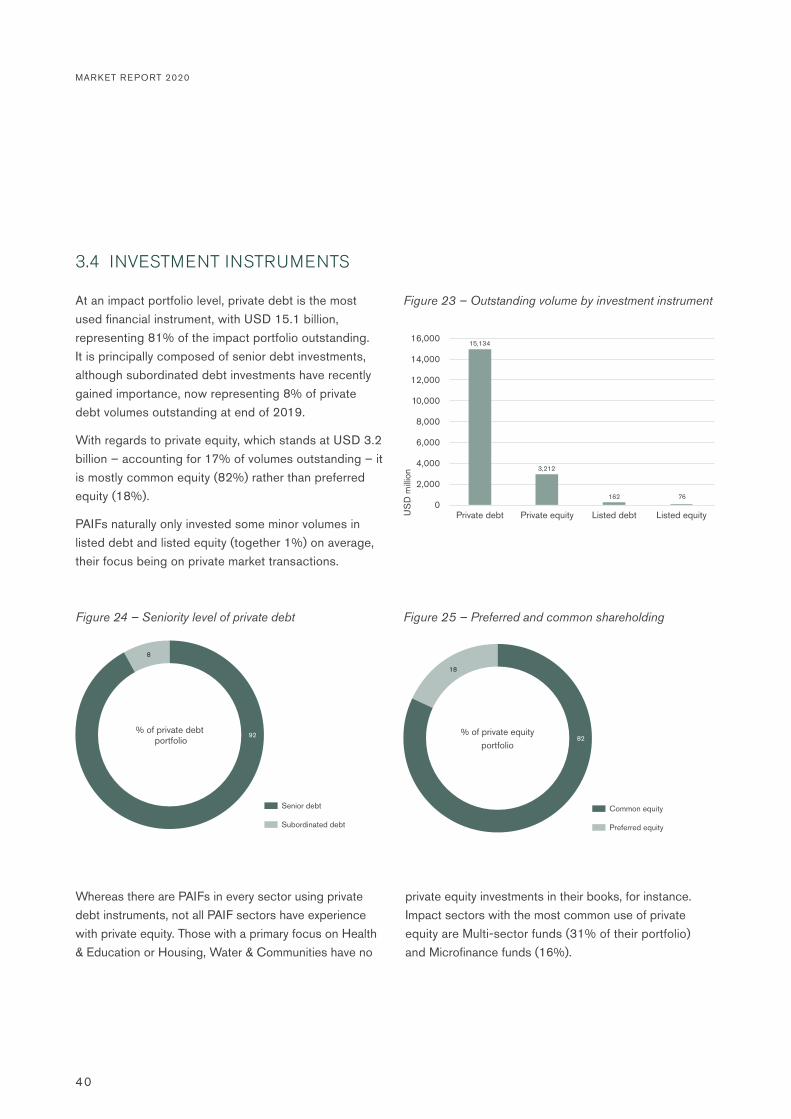
At an impact portfolio level, private debt is the most used financial instrument, with USD 15.1 billion, representing 81% of the impact portfolio outstanding. It is principally composed of senior debt investments, although subordinated debt investments have recently gained importance, now representing 8% of private debt volumes outstanding at end of 2019.
With regards to private equity, which stands at USD 3.2 billion – accounting for 17% of volumes outstanding – it is mostly common equity (82%) rather than preferred equity (18%).
PAIFs naturally only invested some minor volumes in listed debt and listed equity (together 1%) on average, their focus being on private market transactions.
Whereas there are PAIFs in every sector using private debt instruments, not all PAIF sectors have experience with private equity. Those with a primary focus on Health & Education or Housing, Water & Communities have no
private equity investments in their books, for instance. Impact sectors with the most common use of private equity are Multi-sector funds (31% of their portfolio) and Microfinance funds (16%).
3.4 INVESTMENT INSTRUMENTS
12,000
10,000
8,000
6,000
4,000
Private debt Private equity Listed debt Listed equity
2,000
0
14,000
16,000
US
D m
illion
Figure 23 – Outstanding volume by investment instrument
15,134
3,212
162 76
Figure 24 – Seniority level of private debt Figure 25 – Preferred and common shareholding
% of private debt portfolio
% of private equity portfolio
Subordinated debt Preferred equity
Senior debt Common equity
92
8
18
82
MARKET REPORT 2020

3.0 PR IVATE ASSET IMPACT FUNDS - F INANCIAL METR ICS
41
The average exposure per investee varies considerably depending on the financial instrument used. Private equity investments typically have higher exposures (USD 4.2 million) compared to private debt (USD 2.3 million). Equity PAIFs are smaller in size, with a low number of investees on average compared to Fixed Income and Mixed funds which, by design, diversify their investments across multiple investees, sectors and/or countries.
In terms of other instruments, we see that riskier subordinated debt investments have the smallest exposure outstanding, whereas investments in listed assets, although rare within this sphere, are on average larger than for private assets, for both debt and equity instruments.
50%
40%
30%
20%
10%
Climate & Energy
Food & Agriculture
Health & Education
Housing, Water &
Communities
Microfinance Multi-sectorSME development
Private debt Listed debtPrivate equity Listed equity
0
60%
70%
80%
90%
100%
% im
pact
por
tfolio
Figure 26 – Investment instruments by primary impact sector
5
4
3
2
1
Average investee exposure
Privatedebt
Seniordebt
Subordinated debt
Privateequity
Preferred equity
Listeddebt
Listedequity
Common equity
0
6
7
8
US
D m
illion
Figure 27 – Average investee exposure by investment instrument
2.72.3 2.4
1.1
4.2 4.2 4.0
3.2
7.6
42
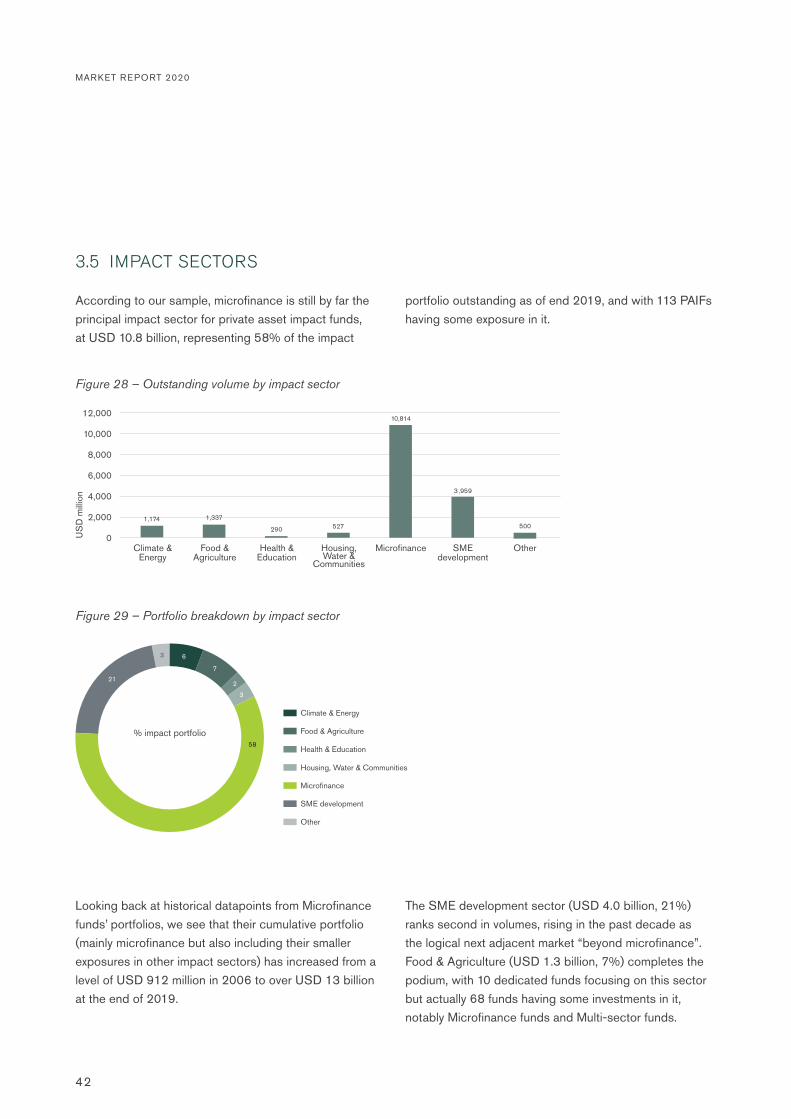
According to our sample, microfinance is still by far the principal impact sector for private asset impact funds, at USD 10.8 billion, representing 58% of the impact
portfolio outstanding as of end 2019, and with 113 PAIFs having some exposure in it.
3.5 IMPACT SECTORS
10,000
8,000
6,000
4,000
2,000
Climate & Energy
Food & Agriculture
Health & Education
MicrofinanceHousing, Water &
Communities
SME development
Other0
12,000
US
D m
illion
Figure 28 – Outstanding volume by impact sector
1,174 1,337
290 527
10,814
3 ,959
500
Figure 29 – Portfolio breakdown by impact sector
% impact portfolio
21
3 6
7
2
3
58
Food & Agriculture
Health & Education
Climate & Energy
Housing, Water & Communities
Microfinance
SME development
Other
Looking back at historical datapoints from Microfinance funds’ portfolios, we see that their cumulative portfolio (mainly microfinance but also including their smaller exposures in other impact sectors) has increased from a level of USD 912 million in 2006 to over USD 13 billion at the end of 2019.
The SME development sector (USD 4.0 billion, 21%) ranks second in volumes, rising in the past decade as the logical next adjacent market “beyond microfinance”. Food & Agriculture (USD 1.3 billion, 7%) completes the podium, with 10 dedicated funds focusing on this sector but actually 68 funds having some investments in it, notably Microfinance funds and Multi-sector funds.
MARKET REPORT 2020

3.0 PR IVATE ASSET IMPACT FUNDS - F INANCIAL METR ICS
43
10,000
8,000
6,000
4,000
2,000
2009200820072006 2010 2011 2012 2013 2014 2015 2016 2017 2018 20190
12,000
14,000
16,000
US
D m
illion
Figure 30 – Historical outstanding portfolio of Microfinance funds
The Climate & Energy sector (USD 1.1 billion, 6%) has seen an important rise in the number of new dedicated funds in past years. Overall, 48 PAIFs have some sort of exposure in Climate & Energy without necessarily dedicating the majority of their portfolios to this sector.
The Health & Education sector, with the biggest domestic public sector involvement by nature, has witnessed the lowest investments from PAIFs to date. It still represents USD 290 million of outstanding volume coming from 48 funds, with 4 PAIFs having their prime focus on this segment.
In terms of exposure per investee, Health & Education investees are those that receive the smallest volume
on average (USD 1.08 million), followed by Food & Agriculture investees (USD 1.44 million). This is explained by the fact that funds in these sectors: (1) invest a significant share of their portfolio in SMEs directly (rather than through local financing intermediaries, as often for other funds), which have smaller funding needs, and (2) are smaller in size and predominantly follow debt strategies requiring high diversification, both triggering smaller ticket sizes.
In contrast, Climate & Energy, SME development and Microfinance investees exhibit the largest funding volume on average. Many of the funds active in these sectors are larger in size and invest predominantly through large financial institutions that require larger funding volumes.
2.5
2.0
1.5
1.0
0.5
Average investee exposure
Climate & Energy
Food & Agriculture
Health & Education
Microfinance SME development
OtherHousing, Water &
Communities
0
3.0
4.0
3.5
5.0
4.5
US
D m
illion
Figure 31 – Average investee exposure by impact sector
2.7
4.4
1.41.1
2.72.4
3.4
1.5
44
Table 8 – Number of investees
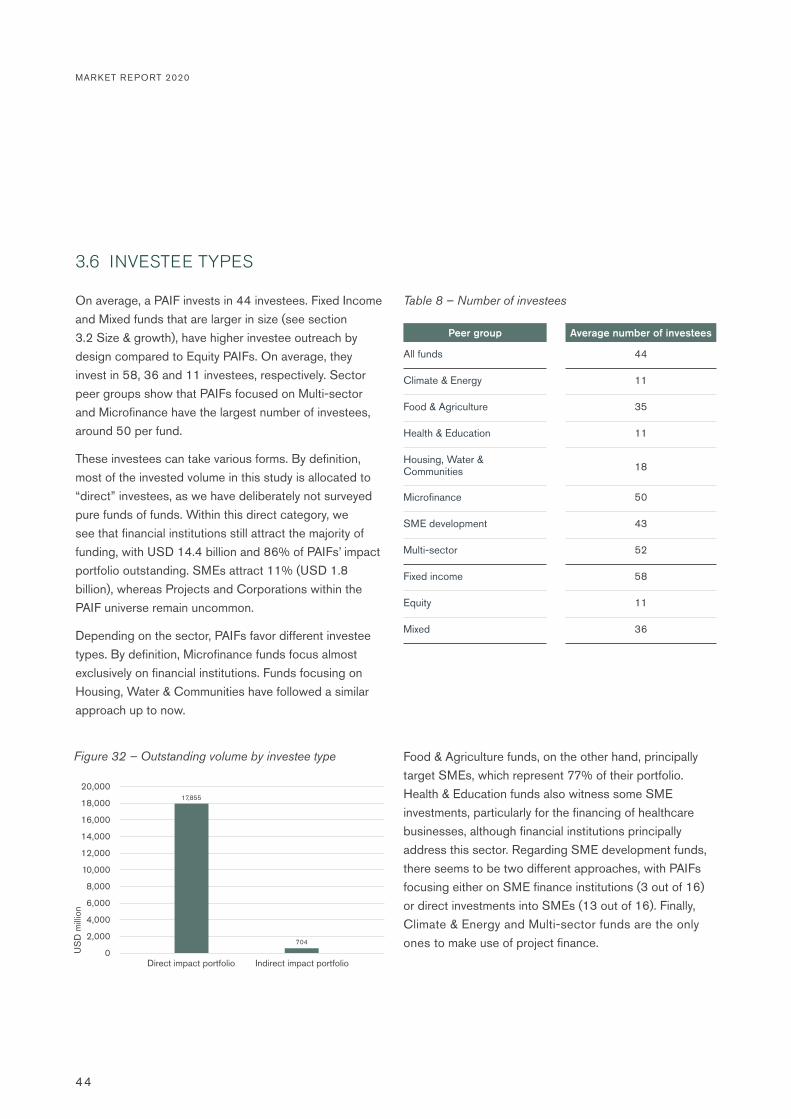
These investees can take various forms. By definition, most of the invested volume in this study is allocated to “direct” investees, as we have deliberately not surveyed pure funds of funds. Within this direct category, we see that financial institutions still attract the majority of funding, with USD 14.4 billion and 86% of PAIFs’ impact portfolio outstanding. SMEs attract 11% (USD 1.8 billion), whereas Projects and Corporations within the PAIF universe remain uncommon.
Depending on the sector, PAIFs favor different investee types. By definition, Microfinance funds focus almost exclusively on financial institutions. Funds focusing on Housing, Water & Communities have followed a similar approach up to now.
On average, a PAIF invests in 44 investees. Fixed Income and Mixed funds that are larger in size (see section 3.2 Size & growth), have higher investee outreach by design compared to Equity PAIFs. On average, they invest in 58, 36 and 11 investees, respectively. Sector peer groups show that PAIFs focused on Multi-sector and Microfinance have the largest number of investees, around 50 per fund.
3.6 INVESTEE TYPES
Peer group Average number of investees
All funds 44
Climate & Energy 11
Food & Agriculture 35
Health & Education 11
Housing, Water & Communities 18
Microfinance 50
SME development 43
Multi-sector 52
Fixed income 58
Equity 11
Mixed 36
12,000
10,000
8,000
6,000
4,000
Direct impact portfolio Indirect impact portfolio
2,000
0
16,000
14,000
20,000
18,000
US
D m
illion
Figure 32 – Outstanding volume by investee type
17,855
704
Food & Agriculture funds, on the other hand, principally target SMEs, which represent 77% of their portfolio. Health & Education funds also witness some SME investments, particularly for the financing of healthcare businesses, although financial institutions principally address this sector. Regarding SME development funds, there seems to be two different approaches, with PAIFs focusing either on SME finance institutions (3 out of 16) or direct investments into SMEs (13 out of 16). Finally, Climate & Energy and Multi-sector funds are the only ones to make use of project finance.
MARKET REPORT 2020
3.0 PR IVATE ASSET IMPACT FUNDS - F INANCIAL METR ICS
45
50%
40%
30%
20%
10%
Climate & Energy
Allfunds
Food & Agriculture
Health & Education
Housing, Water &
Communities
SME development
Multi-sectorMicrofinance0
60%
80%
70%
100%
90%
% im
pact
por
tfolio
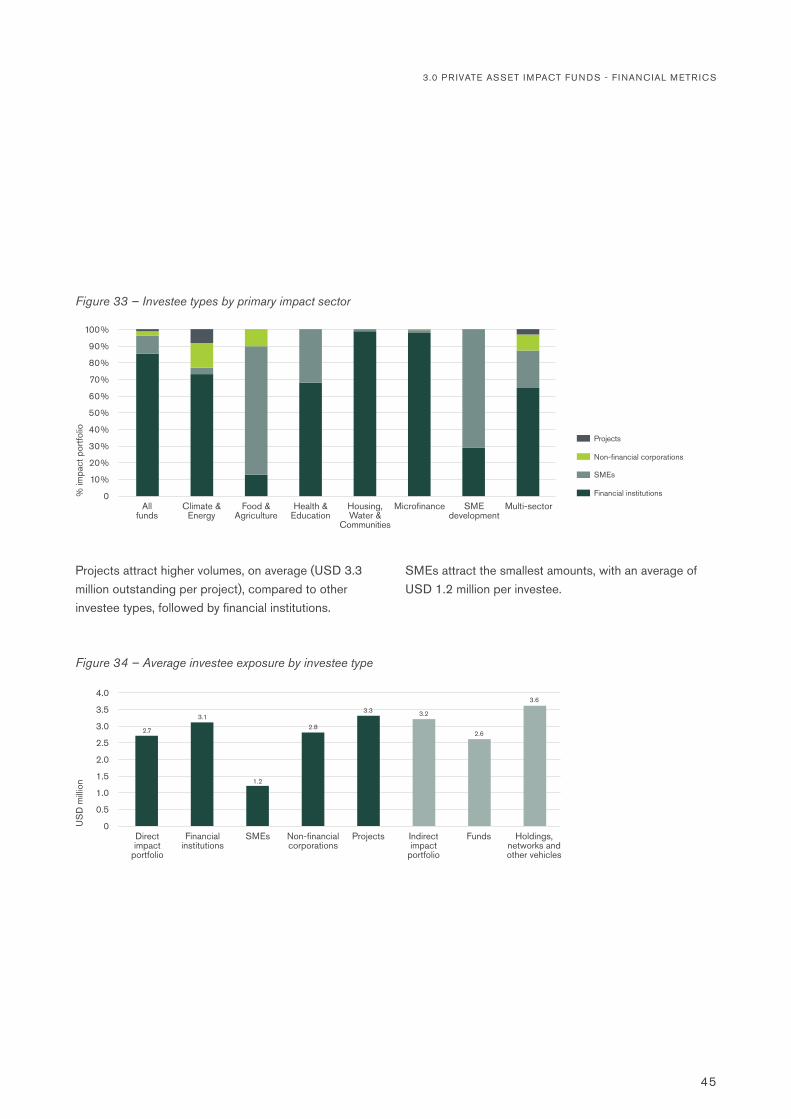
Figure 33 – Investee types by primary impact sector
Non-financial corporations
SMEs
Projects
Financial institutions
Projects attract higher volumes, on average (USD 3.3 million outstanding per project), compared to other investee types, followed by financial institutions.
SMEs attract the smallest amounts, with an average of USD 1.2 million per investee.
2.5
2.0
1.5
1.0
0.5
Direct impact
portfolio
Financial institutions
SMEs Non-financial corporations
Indirect impact
portfolio
Funds Holdings, networks and other vehicles
Projects0
3.0
4.0
3.5
US
D m
illion
Figure 34 – Average investee exposure by investee type
2.7
3.1
1.2
2.8
3.23.3
2.6
3.6

46
Focusing on Microfinance funds, their average direct investee exposure increased from USD 1.5 million to USD 3.1 million between 2006 and 2019, regardless of the asset class. This reflects the fast growth of
borrowing MFIs and the integration in MIV portfolios of larger financial institutions downscaling towards the BOP clientele, both with larger financing needs.9
9 For a detailed analysis of the evolution of the microfinance landscape at an investee level, see the Symbiotics white paper “Banking for Impact” published in 2018.
5,000,000
4,000,000
3,000,000
2,000,000
1,000,000
2009200820072006 2010 2011 2012 2013 2014 2015 2016 2017 2018 20190
6,000,000
7,000,000
9,000,000
8,000,000
US
D
Figure 35 – Historical average investee exposure of Microfinance funds
EquityFixed incomeAll Microfinance funds Mixed
MARKET REPORT 2020

3.0 PR IVATE ASSET IMPACT FUNDS - F INANCIAL METR ICS
47
RegionsIn line with the trends of past MIV Surveys, Latin America & the Caribbean again captured the largest share of direct outstanding investments as of end 2019, at 28% of total volume, followed by Eastern Europe & Central Asia (25%) and South Asia (16%). The Middle East & North Africa is still at a nascent phase regarding funding from PAIFs, whereas Sub-Saharan Africa, whose share stands at 14% of total volume, has seen a considerable increase in past years, particularly
outside of microfinance. In line with the scope of the survey, little volume is allocated to Western Europe and North America, as we have excluded funds focused on developed markets from the study.
Interestingly, Equity funds are most inclined towards South Asia (45% of their portfolio), whereas the first region for Mixed funds is Eastern Europe & Central Asia (35%), with investments in the Middle East & North Africa (12%) being more common than for other strategies.
3.7 GEOGRAPHY OF INVESTMENTS
5,000
4,000
3,000
2,000
1,000
Eastern Europe &
Central Asia
Latin America & the
Caribbean
East Asia & Pacific
South Asia Sub-Saharan Africa
Western Europe
North America
Middle East & North Africa
0
6,000
US
D m
illion
Figure 36 – Outstanding volume by region
4,391
4,995
2,003
2,922
2,385
737
209 52
50%
40%
30%
20%
10%
Fixed income Equity Mixed0
60%
80%
70%
100%
90%
% d
irect
impa
ct p
ortfo
lio
Figure 37 – Regional breakdown by primary asset class
Western Europe
Sub-Saharan Africa
North America
South Asia
Latin America & the Caribbean
East Asia & Pacific
Eastern Europe & Central Asia
Middle East & North Africa

48
The regional breakdown differs considerably according to the primary impact sector. Sub-Saharan Africa might soon become the leading region for Climate & Energy funding (attracting 25% of investments), mostly in the sub-sector of renewable energy production. The prime region for this sector remains Latin America & the Caribbean, with 27% of investments. Health & Education funds also
principally target Sub-Saharan Africa, where the needs for such basic services are the highest. Housing, Water & Communities funds, on the other hand, principally focus on East Asia & Pacific and South Asia (together representing more than half of portfolio), whereas the leading region for Food & Agriculture funds is Eastern Europe & Central Asia, with 31% of investments.
Finally, Microfinance funds still channel more than half of their funding to Eastern Europe & Central Asia (31%) and Latin America & the Caribbean (28%). However, since 2006, the regions seeing the highest growth are the Middle East & North Africa (+64% CAGR, starting from a very low base), South Asia (+34% CAGR), East Asia & Pacific (+29%) and Sub-Saharan Africa (+23%).
In 2019, the Middle East & North Africa witnessed the highest growth in investments from Microfinance funds (+35%), followed by Sub-Saharan Africa (+28%).
50%
40%
30%
20%
10%
Climate & Energy
Food & Agriculture
Health & Education
Housing, Water &
Communities
SME development
Microfinance Multi-sector0
60%
80%
70%
100%
90%
% d
irect
impa
ct p
ortfo
lio
Figure 38 – Regional breakdown by primary impact sector
Western Europe
Sub-Saharan Africa
North America
South Asia
Latin America & the Caribbean
East Asia & Pacific
Eastern Europe & Central Asia
Middle East & North Africa
MARKET REPORT 2020

3.0 PR IVATE ASSET IMPACT FUNDS - F INANCIAL METR ICS
49
2,500
2,000
1,500
1,000
500
2009200820072006 2010 2011 2012 2013 2014 2015 2016 2017 2018 20190
3,000
3,500
4,500
4,000
US
D m
illion
Figure 39 – Historical growth of Microfinance funds' portfolio by region
Eastern Europe & Central Asia(14.8% CAGR)
South Asia(34.1% CAGR)
East Asia & Pacific(29.4% CAGR)
Sub-Saharan Africa(22.9% CAGR)
Latin America & the Caribbean(15.2% CAGR)
Middle East & North Africa(64.4% CAGR)
2.5
2.0
1.5
1.0
0.5
Eastern Europe &
Central Asia
Latin America & the
Caribbean
East Asia & Pacific
South Asia Sub-Saharan Africa
Western Europe
North America
Middle East & North Africa
0
3.0
4.0
3.5
US
D m
illion
Figure 40 – Average investee exposure by region
3.7
2.6
3.63.4
1.6
2.2
2.8
1.2
For all PAIFs, taking apart some minor investments in North America, the average exposure volume per investee is the lowest in Sub-Saharan Africa (USD 1.6 million). On the contrary, the portfolio outstanding per investee is
the highest in Eastern Europe & Central Asia, and East Asia & Pacific (USD 3.7 million and USD 3.6 million, respectively).
50
MARKET REPORT 2020
CountriesAt a country level, the top 10 ranking is as follows: India (USD 2.2 billion, representing 13% of total volume), Ecuador (5%), Cambodia (5%), Georgia (4%), Mexico (4%), Peru (3%), the Russian Federation (3%), Costa Rica (3%), Kenya (2%) and Armenia (2%).
The top 10 countries for Fixed Income funds closely follow the observations for all PAIFs, at least for the first five countries. Equity funds, with many single-country or regionally focused mandates, include Brazil, Madagascar and Colombia within their top 10. India remains nonetheless in first place by a large margin (35%). Russia leads the portfolio for Mixed PAIFs, with four other countries from Eastern Europe & Central Asia in the top 10.
The rank varies even more when segmenting the analysis by principal impact sector. India, for instance, is in first position for Climate & Energy, Microfinance and Multi-sector funds, and in second for Food & Agriculture funds, but is excluded from the top 10 exposures of Health & Education and SME development funds. Similarly, Kenya is first in Health & Education, second in Climate & Energy, third for Multi-sector funds, and fourth for SME development funds, but does not appear among the top exposures of Food & Agriculture and Microfinance funds.

3.0 PR IVATE ASSET IMPACT FUNDS - F INANCIAL METR ICS
Top 10 Fixed income Equity Mixed
1 India India Russian Federation
2 Ecuador Bolivia India
3 Cambodia Mexico Cambodia
4 Georgia Peru Ecuador
5 Mexico Kenya Kazakhstan
6 Costa Rica Georgia Peru
7 Armenia Brazil Georgia
8 Peru Madagascar Belarus
9 Kenya Colombia Mexico
10 Kazakhstan Mauritius Uzbekistan
Table 9 – Top 10 country exposures by primary asset class
51
Top 10 Climate & Energy
Food & Agriculture
Health & Education
Microfinance SME development
Multi-sector
1 India Ukraine Kenya India Hong Kong India
2 Kenya India Ghana Ecuador Ghana Ecuador
3 Bangladesh Kazakhstan Botswana Cambodia Nigeria Kenya
4 Panama Côte d'Ivoire Zambia Georgia Kenya Cambodia
5 Ecuador Ghana DominicanRepublic
Mexico Oman Bolivia
6 Sri Lanka Poland Nigeria Russian Federation
Uganda Paraguay
7 Georgia United Kingdom Tunisia Peru United Kingdom Mexico
8 Cambodia Colombia Eswatini Costa Rica Brazil Brazil
9 El Salvador Ecuador Tanzania Armenia Mexico Argentina
10 Peru Namibia Guatemala Kazakhstan Colombia Ghana
Table 10 – Top 10 country exposures by primary impact sector

52
MARKET REPORT 2020
MEXICO3.6% AUM49 PAIFs
EL SALVADOR1.8% AUM46 PAIFs
HONDURAS1.5% AUM
47 PAIFs COSTA RICA2.7% AUM
41 PAIFsPANAMA1.6% AUM37 PAIFs
PERU3.0% AUM63 PAIFs
BOLIVIA2.1% AUM38 PAIFs
ECUADOR5.2% AUM59 PAIFs
Figure 41 – World map of country exposures, All funds
Top 5 country allocation
Top 6-20 country allocation
PAIF investment countries (127)

3.0 PR IVATE ASSET IMPACT FUNDS - F INANCIAL METR ICS
53
CAMBODIA4.8% AUM
58 PAIFs
INDONESIA1.7% AUM
47 PAIFs
RUSSIAN FEDERATION2.9% AUM13 PAIFs
MONGOLIA1.6% AUM41 PAIFs
UZBEKISTAN1.6% AUM
37 PAIFsKAZAKHSTAN2.2% AUM46 PAIFs
GEORGIA4.2% AUM
45 PAIFs
ARMENIA2.3% AUM40 PAIFs
INDIA13.2% AUM
70 PAIFsSRI LANKA1.7% AUM34 PAIFs
KENYA2.3% AUM56 PAIFs
ROMANIA1.7% AUM
34 PAIFs

54
PRIVATE DEBT PORTFOLIO
As seen in section 3.4 Investment instruments, PAIFs make the majority of their impact investments through private debt. Private debt will include term loans, both short term and long term, both senior and subordinated, and both secured and unsecured. They can also take the form of other fixed income instruments, such as promissory notes, deposits, certificates, guarantees, letters of credit, etc. Their interest rates may be fixed or floating and their currency denomination may be in hard currency (mostly USD) or in local currency.
Currency strategyA PAIF can lend money to investees in either hard or local currency. The responsibility to hedge the currency is with the investee in the first case and with the PAIF in the second case.
In our sample, most of the debt investments by Fixed Income and Mixed PAIFs are in hard currency (64% vs 36% in local currency).
Among PAIF loans made in local currency, 30% remain unhedged against the accounting currency of the fund. The absence of currency hedging costs leads to higher gross yields on the debt portfolio for PAIFs using this strategy, the drawback being the volatility induced by currency fluctuations on the loan's principal amount and the risk that the currency depreciation will overwhelm any return in the end.
Historical data from Microfinance Funds shows that this trends towards unhedged local currency investing is increasing. Hard currency debt investments have been common practice over the years in the microfinance space, even though the proportion of local currency loans has been growing, especially since 2015, which is an encouraging sign for investees in terms of managing their foreign exchange (FX) risk exposure. Today, 39% of debt exposure is in the local currency (LC) and 13% is unhedged (up from 5% in 2009).
3.8 INVESTMENT TERMS
25%
20%
15%
10%
5%
2009 2010 2011 2012 2013 2014 2015 2016 2017 2018 20190
30%
35%
45%
40%
% o
f deb
t por
tfolio
Figure 42 – Historical local currency portfolio of Microfinance funds
Local currency portfolio Unhedged local currency portfolio
MARKET REPORT 2020

3.0 PR IVATE ASSET IMPACT FUNDS - F INANCIAL METR ICS
55
In terms of impact sectors beyond microfinance, Health & Education funds seem to offer the highest proportion of local currency lending, followed by PAIFs in Housing, Water & Communities, at 96% and 57% of local currency
loans respectively. The unhedged portion of the debt portfolio is the highest for Housing, Water & Communities (32%), ahead of Microfinance funds.
50%
40%
30%
20%
10%
Fixed income and Mixed
funds
Climate & Energy
Food & Agriculture
Health & Education
MicrofinanceHousing, Water &
Communities
Multi-sectorSME development
0
60%
80%
70%
100%
90%
% o
f deb
t por
tfolio
Figure 43 – Currency type of debt portfolio
Figure 44 – Unhedged currency exposure
Hard currency
Local currency
Microfinance
SME development
Housing, Water & Community
Health & Education
Food & Agriculture
Climate & Energy
Fixed income and Mixed funds
Multi-sector
0% 20%10% 40% 50% 60%30%
% of debt portfolio % of local currency portfolio
21%
8%
38%
3%
32%
13%
57%
32%
8%
7%
1%
0%
0%
0%
30%
11%
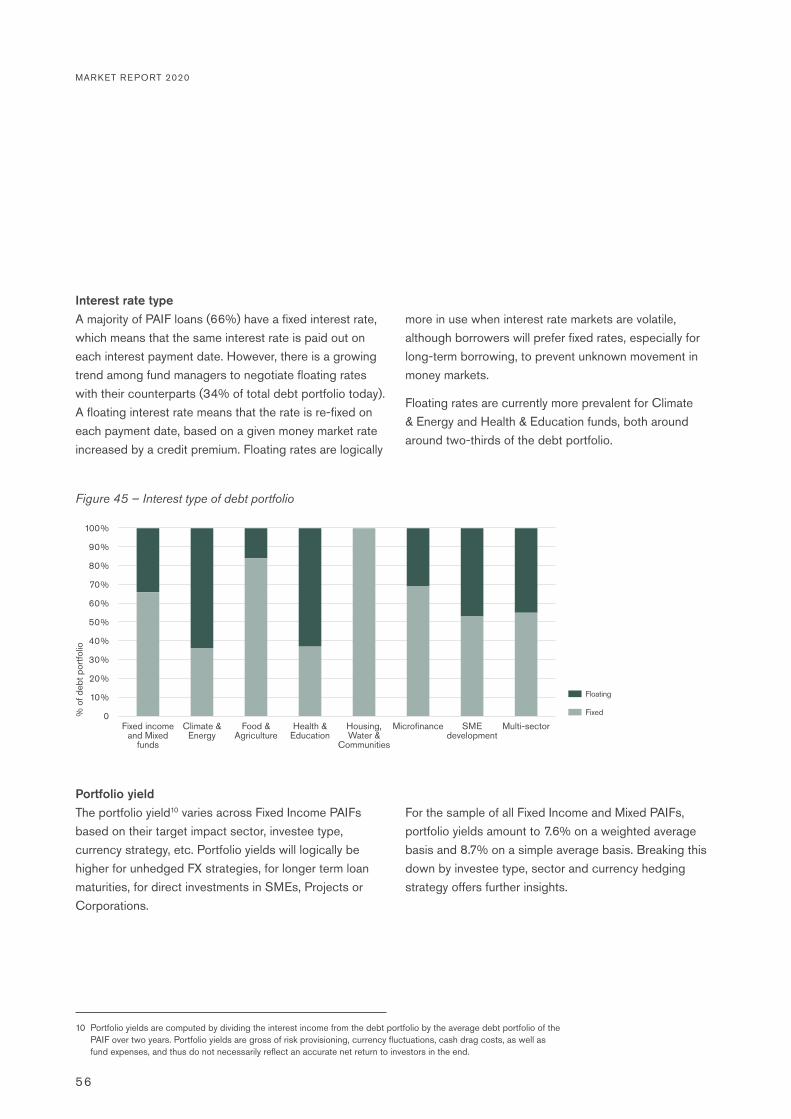
56
Interest rate typeA majority of PAIF loans (66%) have a fixed interest rate, which means that the same interest rate is paid out on each interest payment date. However, there is a growing trend among fund managers to negotiate floating rates with their counterparts (34% of total debt portfolio today). A floating interest rate means that the rate is re-fixed on each payment date, based on a given money market rate increased by a credit premium. Floating rates are logically
more in use when interest rate markets are volatile, although borrowers will prefer fixed rates, especially for long-term borrowing, to prevent unknown movement in money markets.
Floating rates are currently more prevalent for Climate & Energy and Health & Education funds, both around around two-thirds of the debt portfolio.
Portfolio yieldThe portfolio yield10 varies across Fixed Income PAIFs based on their target impact sector, investee type, currency strategy, etc. Portfolio yields will logically be higher for unhedged FX strategies, for longer term loan maturities, for direct investments in SMEs, Projects or Corporations.
For the sample of all Fixed Income and Mixed PAIFs, portfolio yields amount to 7.6% on a weighted average basis and 8.7% on a simple average basis. Breaking this down by investee type, sector and currency hedging strategy offers further insights.
50%
40%
30%
20%
10%
Fixed income and Mixed
funds
Climate & Energy
Food & Agriculture
Health & Education
MicrofinanceHousing, Water &
Communities
Multi-sectorSME development
0
60%
80%
70%
100%
90%
% o
f deb
t por
tfolio
Figure 45 – Interest type of debt portfolio
Fixed
Floating
10 Portfolio yields are computed by dividing the interest income from the debt portfolio by the average debt portfolio of the PAIF over two years. Portfolio yields are gross of risk provisioning, currency fluctuations, cash drag costs, as well as fund expenses, and thus do not necessarily reflect an accurate net return to investors in the end.
MARKET REPORT 2020
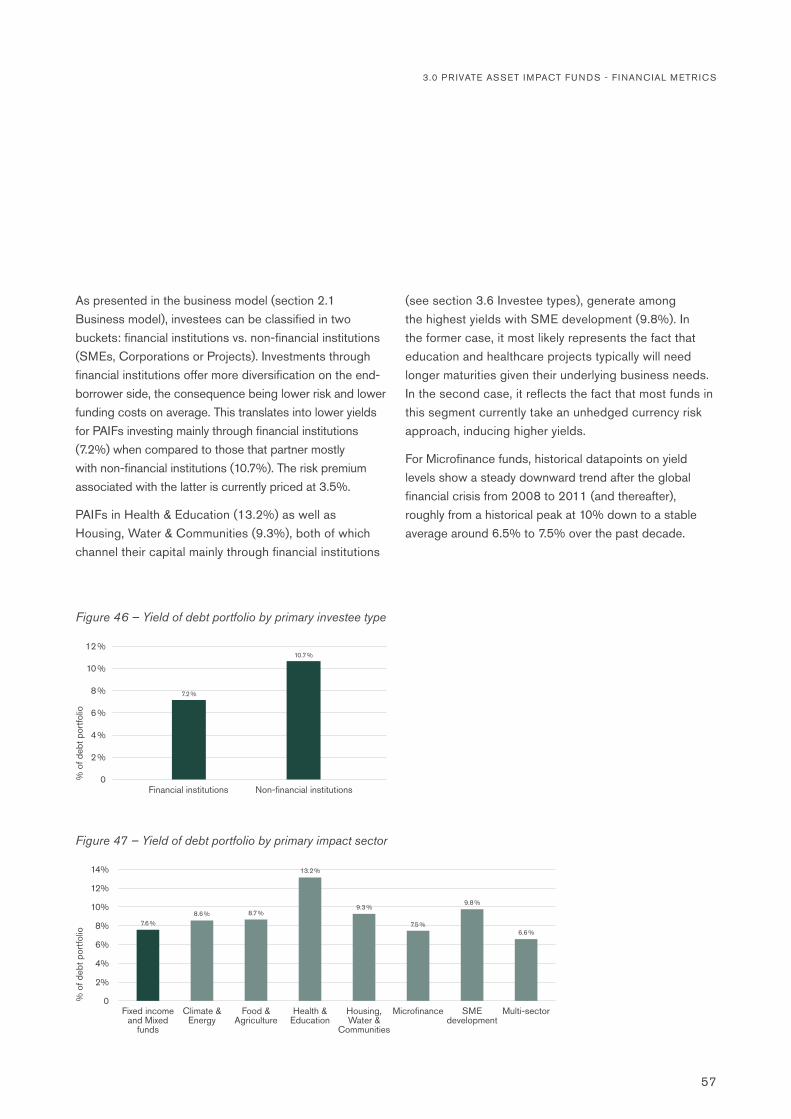
3.0 PR IVATE ASSET IMPACT FUNDS - F INANCIAL METR ICS
57
As presented in the business model (section 2.1 Business model), investees can be classified in two buckets: financial institutions vs. non-financial institutions (SMEs, Corporations or Projects). Investments through financial institutions offer more diversification on the end-borrower side, the consequence being lower risk and lower funding costs on average. This translates into lower yields for PAIFs investing mainly through financial institutions (7.2%) when compared to those that partner mostly with non-financial institutions (10.7%). The risk premium associated with the latter is currently priced at 3.5%.
PAIFs in Health & Education (13.2%) as well as Housing, Water & Communities (9.3%), both of which channel their capital mainly through financial institutions
(see section 3.6 Investee types), generate among the highest yields with SME development (9.8%). In the former case, it most likely represents the fact that education and healthcare projects typically will need longer maturities given their underlying business needs. In the second case, it reflects the fact that most funds in this segment currently take an unhedged currency risk approach, inducing higher yields.
For Microfinance funds, historical datapoints on yield levels show a steady downward trend after the global financial crisis from 2008 to 2011 (and thereafter), roughly from a historical peak at 10% down to a stable average around 6.5% to 7.5% over the past decade.
10 %
8 %
6 %
4 %
Financial institutions Non-financial institutions
2 %
0
12 %
% o
f deb
t por
tfolio
Figure 46 – Yield of debt portfolio by primary investee type
7.2 %
10.7 %
10%
8%
6%
4%
2%
Fixed income and Mixed
funds
Climate & Energy
Food & Agriculture
Health & Education
MicrofinanceHousing, Water &
Communities
Multi-sectorSME development
0
12%
14%
% o
f deb
t por
tfolio
Figure 47 – Yield of debt portfolio by primary impact sector
7.6 %8.6 % 8.7 %
13.2 %
9.3 %
7.5 %
9.8 %
6.6 %
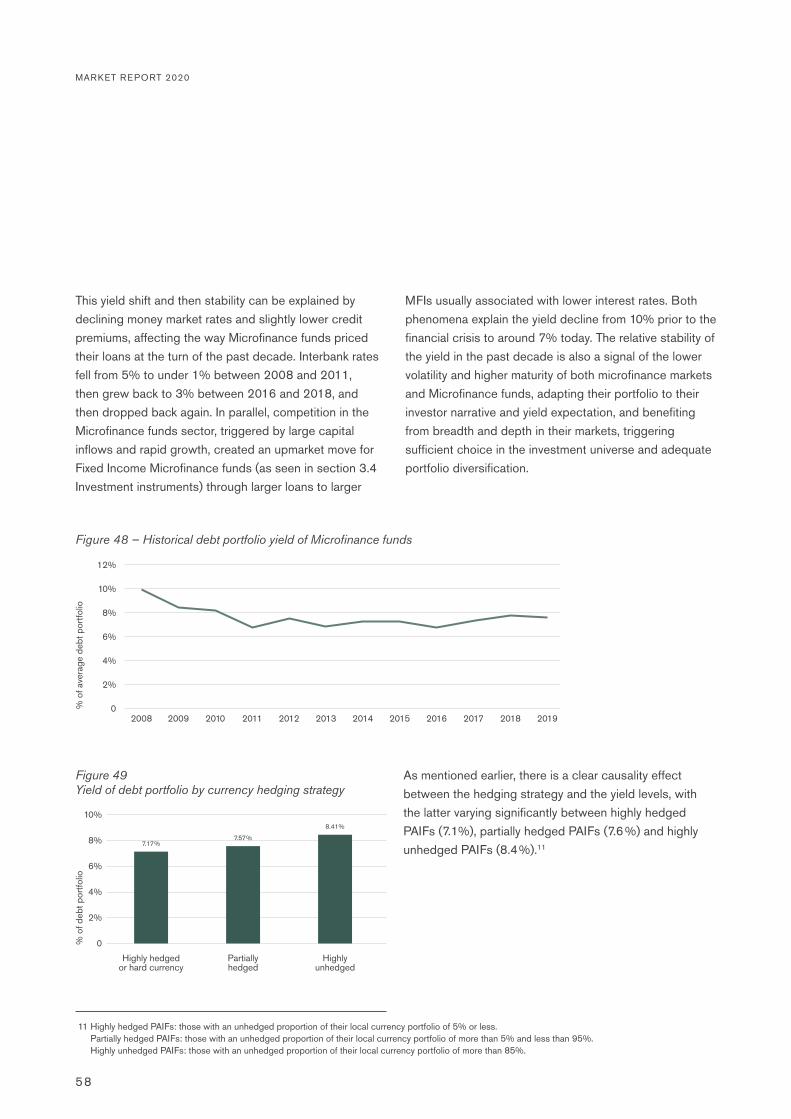
58
This yield shift and then stability can be explained by declining money market rates and slightly lower credit premiums, affecting the way Microfinance funds priced their loans at the turn of the past decade. Interbank rates fell from 5% to under 1% between 2008 and 2011, then grew back to 3% between 2016 and 2018, and then dropped back again. In parallel, competition in the Microfinance funds sector, triggered by large capital inflows and rapid growth, created an upmarket move for Fixed Income Microfinance funds (as seen in section 3.4 Investment instruments) through larger loans to larger
MFIs usually associated with lower interest rates. Both phenomena explain the yield decline from 10% prior to the financial crisis to around 7% today. The relative stability of the yield in the past decade is also a signal of the lower volatility and higher maturity of both microfinance markets and Microfinance funds, adapting their portfolio to their investor narrative and yield expectation, and benefiting from breadth and depth in their markets, triggering sufficient choice in the investment universe and adequate portfolio diversification.
10%
8%
6%
4%
2%
2008 2009 2010 2011 2012 2013 2014 2015 2016 2017 2018 20190
12%
% o
f ave
rage
deb
t por
tfolio
Figure 48 – Historical debt portfolio yield of Microfinance funds
8%
Highly hedged or hard currency
Partially hedged
Highly unhedged
4%
6%
2%
0
10%
% o
f deb
t por
tfolio
Figure 49Yield of debt portfolio by currency hedging strategy
7.17%7.57%
8.41 %
As mentioned earlier, there is a clear causality effect between the hedging strategy and the yield levels, with the latter varying significantly between highly hedged PAIFs (7.1%), partially hedged PAIFs (7.6 %) and highly unhedged PAIFs (8.4%).11
11 Highly hedged PAIFs: those with an unhedged proportion of their local currency portfolio of 5% or less. Partially hedged PAIFs: those with an unhedged proportion of their local currency portfolio of more than 5% and less than 95%. Highly unhedged PAIFs: those with an unhedged proportion of their local currency portfolio of more than 85%.
MARKET REPORT 2020
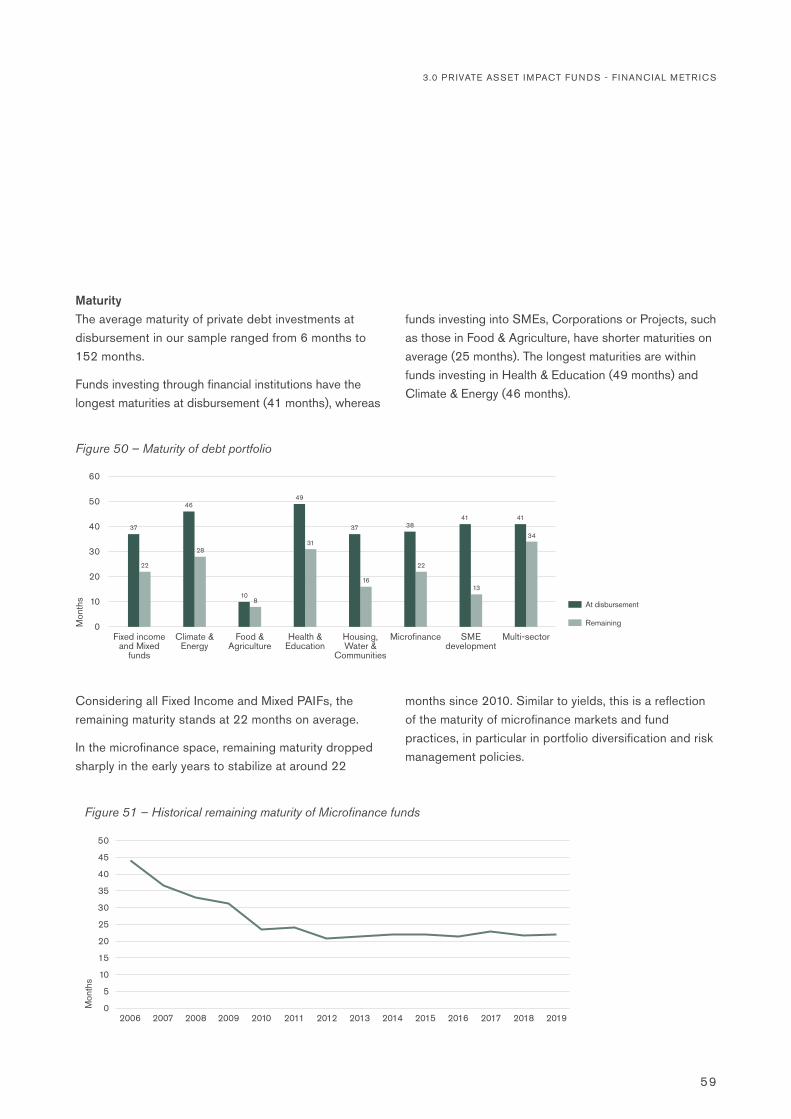
3.0 PR IVATE ASSET IMPACT FUNDS - F INANCIAL METR ICS
59
MaturityThe average maturity of private debt investments at disbursement in our sample ranged from 6 months to 152 months.
Funds investing through financial institutions have the longest maturities at disbursement (41 months), whereas
funds investing into SMEs, Corporations or Projects, such as those in Food & Agriculture, have shorter maturities on average (25 months). The longest maturities are within funds investing in Health & Education (49 months) and Climate & Energy (46 months).
Considering all Fixed Income and Mixed PAIFs, the remaining maturity stands at 22 months on average.
In the microfinance space, remaining maturity dropped sharply in the early years to stabilize at around 22
months since 2010. Similar to yields, this is a reflection of the maturity of microfinance markets and fund practices, in particular in portfolio diversification and risk management policies.
50
40
30
20
10
Fixed income and Mixed
funds
Climate & Energy
Food & Agriculture
Health & Education
MicrofinanceHousing, Water &
Communities
Multi-sectorSME development
0
60
Mon
ths
Figure 50 – Maturity of debt portfolio
Remaining
At disbursement
37
22
46
28
108
49
31
37
16
22
3841 41
34
13
30
25
20
15
10
5
2006 2007 2008 2009 2010 2011 2012 2013 2014 2015 2016 2017 2018 20190
40
35
50
45
Mon
ths
Figure 51 – Historical remaining maturity of Microfinance funds
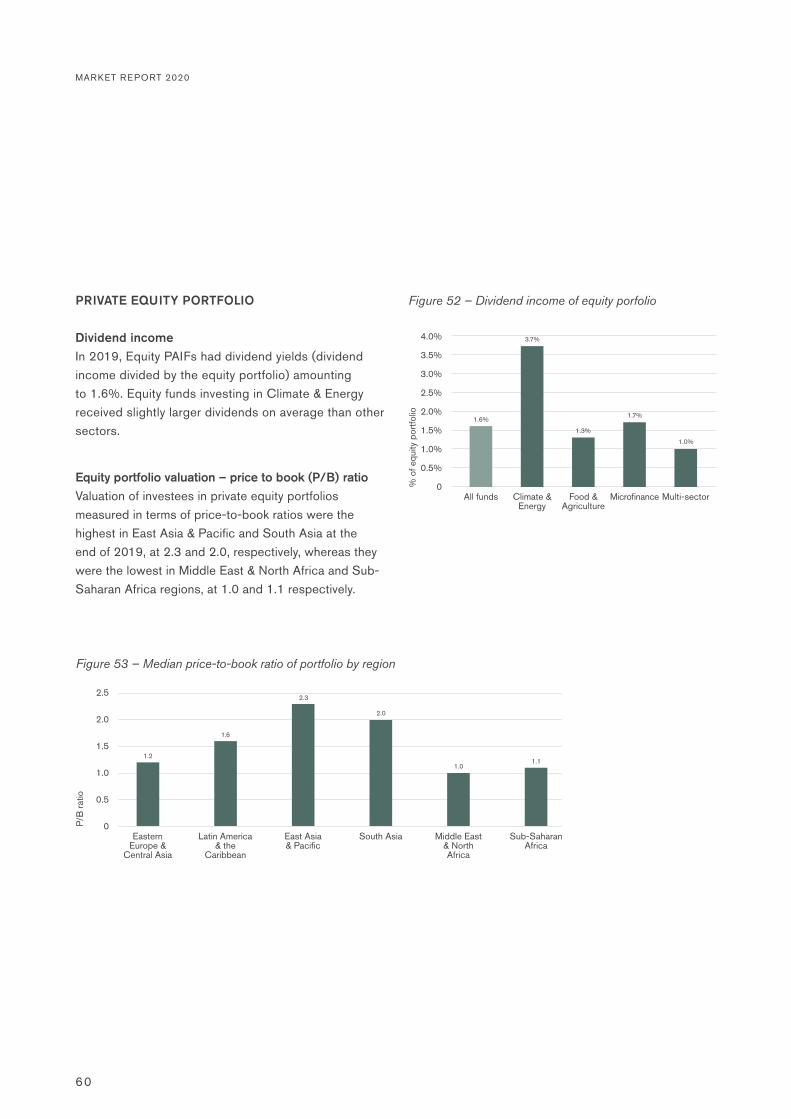
60
PRIVATE EQUITY PORTFOLIO
Dividend incomeIn 2019, Equity PAIFs had dividend yields (dividend income divided by the equity portfolio) amounting to 1.6%. Equity funds investing in Climate & Energy received slightly larger dividends on average than other sectors.
Equity portfolio valuation – price to book (P/B) ratioValuation of investees in private equity portfolios measured in terms of price-to-book ratios were the highest in East Asia & Pacific and South Asia at the end of 2019, at 2.3 and 2.0, respectively, whereas they were the lowest in Middle East & North Africa and Sub-Saharan Africa regions, at 1.0 and 1.1 respectively.
2.5%
2.0%
1.5%
1.0%
0.5%
All funds Climate & Energy
Food & Agriculture
Microfinance Multi-sector0
3.0%
3.5%
4.0%
% o
f equ
ity p
ortfo
lio
Figure 52 – Dividend income of equity porfolio
1.6%
1.3%
1.7%
1.0%
3.7%
2.0
1.5
1.0
0.5
Eastern Europe &
Central Asia
Latin America & the
Caribbean
East Asia & Pacific
South Asia Sub-Saharan Africa
Middle East & North Africa
0
2.5
P/B
ratio
Figure 53 – Median price-to-book ratio of portfolio by region
1.2
1.6
2.3
1.0
2.0
1.1
MARKET REPORT 2020

3.0 PR IVATE ASSET IMPACT FUNDS - F INANCIAL METR ICS
61
3.0
2.5
2.0
1.5
1.0
0.5
2014 2015 2016 2017 2018 20190
4.0
3.5
P/B
ratio
Figure 54 – Historical average price-to-book ratio of portfolio by region of Microfinance funds
Eastern Europe & Central Asia
East Asia & PacificSouth Asia
Sub-Saharan Africa
Latin America & the Caribbean
Middle East & North Africa
Historical numbers from Microfinance funds show that investee valuation levels varied across regions in 2019 when compared to previous exercises. The portfolio investees that have gained in terms of higher valuation for 2019 include those in Eastern Europe & Central Asia, today valued at twice their book value, whereas
these figures were under 1.0x following the economic downturn the region witnessed back in 2015, affecting the valuation in 2016-2017. Investees in East Asia & Pacific, Middle East & North Africa, and Sub-Saharan Africa have all been valued lower than in 2018.
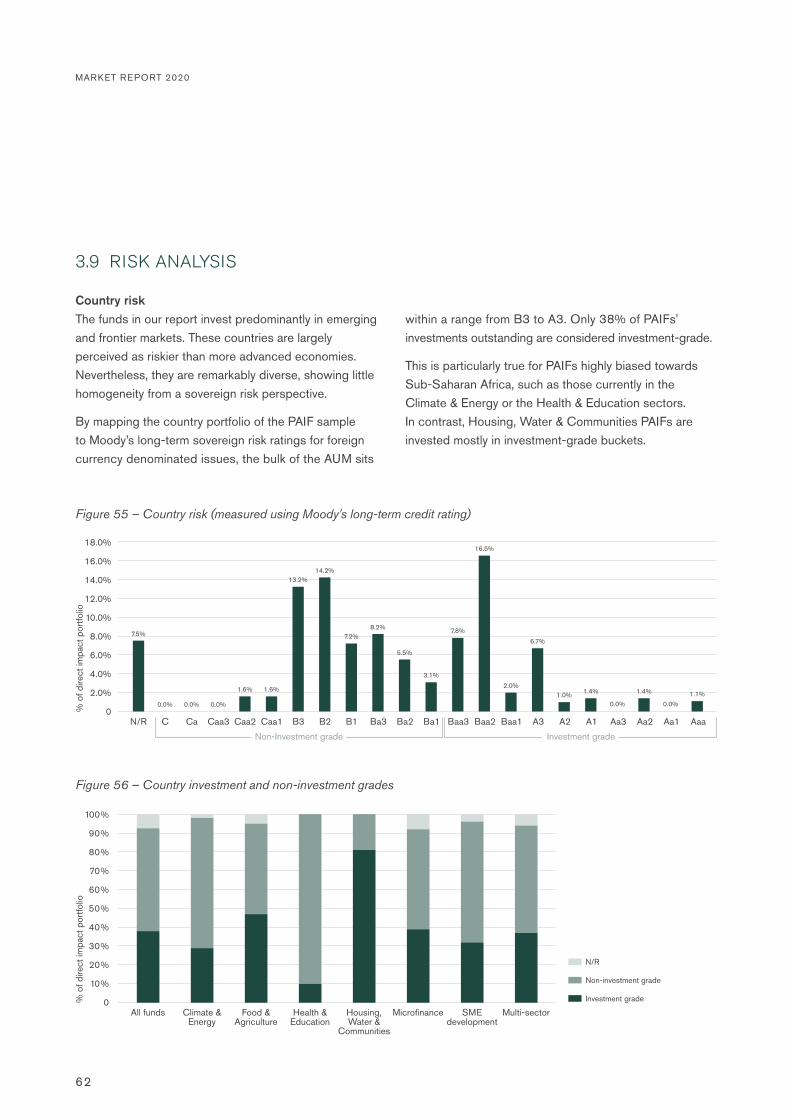
62
Country riskThe funds in our report invest predominantly in emerging and frontier markets. These countries are largely perceived as riskier than more advanced economies. Nevertheless, they are remarkably diverse, showing little homogeneity from a sovereign risk perspective.
By mapping the country portfolio of the PAIF sample to Moody’s long-term sovereign risk ratings for foreign currency denominated issues, the bulk of the AUM sits
within a range from B3 to A3. Only 38% of PAIFs' investments outstanding are considered investment-grade.
This is particularly true for PAIFs highly biased towards Sub-Saharan Africa, such as those currently in the Climate & Energy or the Health & Education sectors. In contrast, Housing, Water & Communities PAIFs are invested mostly in investment-grade buckets.
3.9 RISK ANALYSIS
10.0%
8.0%
6.0%
4.0%
2.0%
N/R C Ca Caa3 Caa2 Caa1 B3 B2 B1 Ba3 Ba2 Ba1 Baa3 Baa2 Baa1 Aa3A3 Aa2A2 Aa1A1 Aaa0
12.0%
14.0%
16.0%
18.0%
% o
f dire
ct im
pact
por
tfolio
Figure 55 – Country risk (measured using Moody's long-term credit rating)
7.5%
0.0% 0.0% 0.0%
1.6% 1.6%
13.2%14.2%
7.2%8.2%
5.5%
3.1%
7.8%
16.5%
2.0%
6.7%
1.0% 1.4%
0.0% 0.0%
1.4% 1.1%
50%
40%
30%
20%
10%
All funds Climate & Energy
Food & Agriculture
Health & Education
MicrofinanceHousing, Water &
Communities
Multi-sectorSME development
0
60%
80%
70%
100%
90%
% o
f dire
ct im
pact
por
tfolio
Figure 56 – Country investment and non-investment grades
Investment grade
Non-investment grade
N/R
MARKET REPORT 2020
Non-Investment grade Investment grade

3.0 PR IVATE ASSET IMPACT FUNDS - F INANCIAL METR ICS
63
Assigning a sovereign risk rating to the PAIF sector based on country exposures shows that the median portfolio sovereign risk is Ba2 on Moody’s scale.12
The rating varies according to PAIF peer group, as presented in the following table.
While this table offers a view on how PAIFs in each impact sector are positioned in terms of their sovereign risk ratings given their current country allocation, it does not infer about the actual riskiness of a given impact sector. It, nevertheless, helps understand the overall
aggregate sovereign risk ratings of such portfolios. Also, sovereign risk is not necessarily correlated to investee credit risk. Loan-loss reserves in the survey show rather disparate levels by impact sectors.
12 A rating for all PAIFs and the respective peer groups is assigned by looking at where the 50% mark falls in Moody’s rating scale when summing PAIF country percentages in each grade, without considering N/R countries.
All funds Climate & Energy Food & Agriculture Health & Education
Ba2 B1 Ba1 B2
Housing, Water & Communities Microfinance SME development Multi-sector
Baa2 Ba2 Ba3 Ba3
Fixed income Equity Mixed
Ba3 Baa2 Baa3
Table 11 – Median sovereign rating
14.0%
16.0%
10.0%
12.0%
6.0%
8.0%
2.0%
4.0%
0
18.0%
% o
f deb
t por
tfolio
Figure 57 – Default risk (measured using outstanding provisioning level)
2.9%
8.2%
2.1%2.8%
16.0%
7.7%
0.6%
Fixed income and Mixed
funds
Climate & Energy
Food & Agriculture
Health & Education
MicrofinanceHousing, Water &
Communities
SME development

64
Breaking this down by impact sector, Health & Education and Housing, Water & Communities funds have the highest portfolio concentration levels, while Microfinance and SME development funds have the lowest. The smallest average fund size (as described in section 3.2 Size & growth) for the former sectors partly explains the higher concentration levels observed.
Portfolio concentrationsConcentration indicators related to the top five countries and top five investees are much higher for Equity funds than for Fixed Income funds. For all PAIFs, these values average 52% and 29%, respectively.
21%
84%
44%
31%
50%
40%
30%
20%
10%
Fixed income Equity Mixed0
60%
80%
70%
100%
90%
% o
f im
pact
por
tfolio
Figure 58 – Concentration indicators by primary asset class
Top 5 unhedged currency (debt portfolio only)
Top 5 unhedged currency (debt portfolio only)
Top 5 investeesTop 5 countries
7%
18%
48%
87%
40%
Climate & Energy
Food & Agriculture
Health & Education
MicrofinanceHousing, Water &
Communities
SME development
Multi-sector
50%
40%
30%
20%
10%
0
60%
80%
70%
100%
90%
% o
f im
pact
por
tfolio
Figure 59 – Concentration indicators by primary impact sector
Top 5 investeesTop 5 countries
56%60%
89%
80%
7%
63%
40%
66%
50%47%
34%
67%
57%
30%
17%
27%
8%
46%
2%
The rapid growth in size and outreach of Microfinance funds over the years has enabled a higher diversification of their portfolio for the top five countries and top five investees.
MARKET REPORT 2020

3.0 PR IVATE ASSET IMPACT FUNDS - F INANCIAL METR ICS
65
Loan-loss provisions and write-offsLoan-loss reserves outstanding as a percentage of the credit portfolio of Fixed Income and Mixed PAIFs amounts to 2.9%.
Annual loan-loss provisions and loan write-offs during 2019 amounted to 0.8% and 0.3% of average assets. We observe large differences across the different sectors and investee types. Multi-sector and Climate & Energy funds recorded more loan-loss provisions
compared to funds investing in Microfinance and SME development sectors. Write-offs were generally scarce in 2019, but highest for PAIFs in Food & Agriculture.
Provisions in 2019 were higher for PAIFs investing primarily through financial institutions, while loan write-offs were more prevalent for PAIFs partnering with SMEs, Corporations or Projects.
60%
50%
40%
30%
20%
10%
2006 2007 2008 2009 2010 2011 2012 2013 2014 2015 2016 2017 2018 20190
100%
70%
80%
90%
% o
f im
pact
por
tfolio
Figure 60 – Historical concentration indicators of Microfinance funds
Top 5 countries
Top 5 investees
Figure 61 – Annual loan loss provisioning and write-offs by primary impact sector
Microfinance
SME development
Housing, Water & community
Health & Education
Food & Agriculture
Climate & Energy
Fixed income and Mixed PAIFs
Multi-sector
0% 1.0%0.5% 2.0% 2.5% 3.0% 3.5% 4.0% 4.5%1.5%
Annual loan loss provisions Annual loan write-offs
% of average total assets

66
Finally, looking at historical patterns for Microfinance funds, and proxying the change in loan-loss reserves outstanding from one year to the other, we see that 2010 and 2018 were years with the highest increase in provisioning. The former is linked to specific country-level microfinance crises in 2010, pursuant to the global financial crisis (e.g., India, Nicaragua, etc.). The latter is linked to a challenging environment across emerging markets in 2018.13
Annual loan loss provisions Annual loan write-offs
1.00%
0.80%
0.60%
0.40%
0.20%
Financial institutions
Non-financial institutions
0
1.20%
% o
f ave
rage
tota
l ass
ets
Figure 62 – Annual loan loss provisioning and write-offs by investee type
0.85%
0.63%
1.06%
0.23%
13 Emerging market stocks and government bonds dropped by 14.6% and 5.2% respectively in 2018.
0.40%
0.30%
0.20%
0.10%
0.00
-0.10%
2010 2011 2012 2013 2014 2015 2016 2017 2018 2019-0.20%
0.50%
0.60%
% o
f ave
rage
tota
l ass
ets
Figure 63 – Historical annual loan loss provisions of Microfinance funds
0.50%
0.20%
-0.02%
0.24%0.20%
-0.08%
0.10%0.08%
0.41%
0.16%
MARKET REPORT 2020
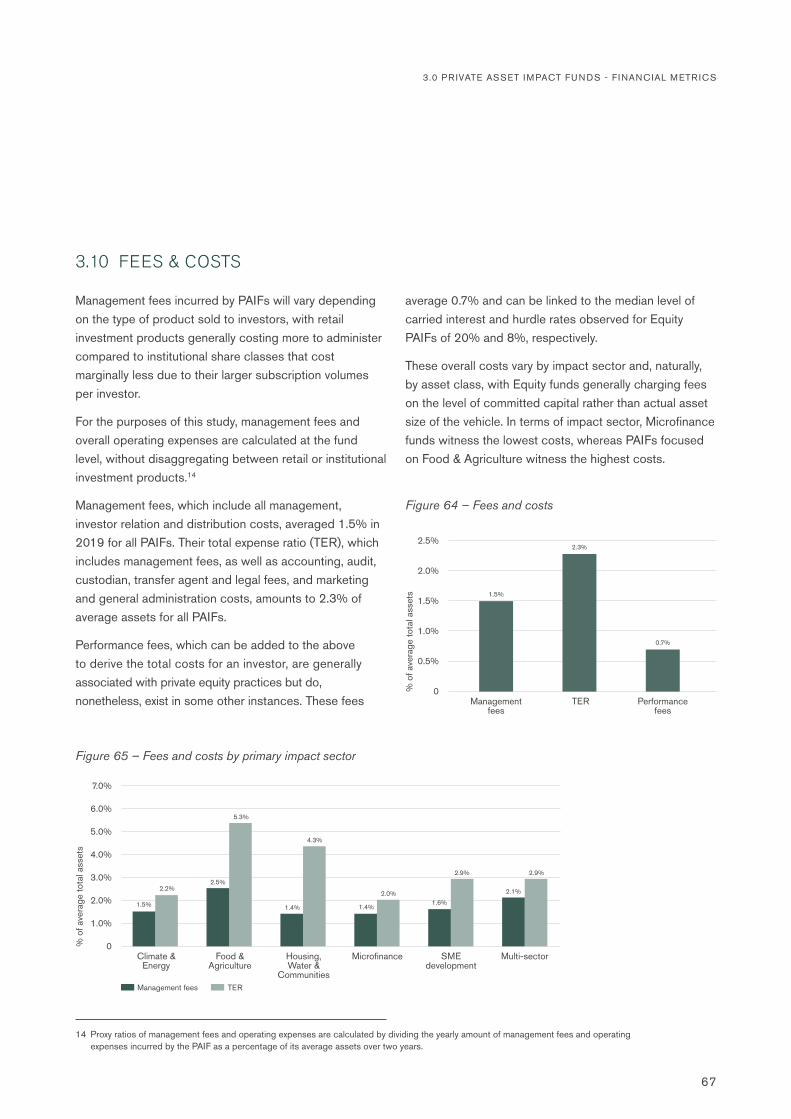
3.0 PR IVATE ASSET IMPACT FUNDS - F INANCIAL METR ICS
67
Management fees incurred by PAIFs will vary depending on the type of product sold to investors, with retail investment products generally costing more to administer compared to institutional share classes that cost marginally less due to their larger subscription volumes per investor.
For the purposes of this study, management fees and overall operating expenses are calculated at the fund level, without disaggregating between retail or institutional investment products.14
Management fees, which include all management, investor relation and distribution costs, averaged 1.5% in 2019 for all PAIFs. Their total expense ratio (TER), which includes management fees, as well as accounting, audit, custodian, transfer agent and legal fees, and marketing and general administration costs, amounts to 2.3% of average assets for all PAIFs.
Performance fees, which can be added to the above to derive the total costs for an investor, are generally associated with private equity practices but do, nonetheless, exist in some other instances. These fees
average 0.7% and can be linked to the median level of carried interest and hurdle rates observed for Equity PAIFs of 20% and 8%, respectively.
These overall costs vary by impact sector and, naturally, by asset class, with Equity funds generally charging fees on the level of committed capital rather than actual asset size of the vehicle. In terms of impact sector, Microfinance funds witness the lowest costs, whereas PAIFs focused on Food & Agriculture witness the highest costs.
3.10 FEES & COSTS
2.5%
2.0%
1.5%
1.0%
0.5%
Management fees
TER Performance fees
0% o
f ave
rage
tota
l ass
ets
Figure 64 – Fees and costs
1.5%
0.7%
2.3%
5.0%
6.0%
3.0%
4.0%
1.0%
2.0%
0
7.0%
% o
f ave
rage
tota
l ass
ets
Figure 65 – Fees and costs by primary impact sector
1.5%
2.2%2.5%
5.3%
1.4%
4.3%
1.4%
2.0%1.6%
2.9%
2.1%
2.9%
Climate & Energy
Food & Agriculture
MicrofinanceHousing, Water &
Communities
SME development
Multi-sector
Management fees TER
14 Proxy ratios of management fees and operating expenses are calculated by dividing the yearly amount of management fees and operating expenses incurred by the PAIF as a percentage of its average assets over two years.

68
Costs for Microfinance fundsOver the past 10 years, both management fees and TER have been trending downward in the Microfinance funds sector, with the former decreasing by approximately 45 basis points, from an initial level of 1.9% to 1.4%
today, and the latter by 25 basis points, from 2.2% a decade ago to 2.0% today. The relatively linear drop, especially for Fixed Income funds, reflects the growth, maturity and rivalry in the Microfinance funds sector.
3.5%
2.5%
3.0%
2.0%
1.5%
1.0%
0.5%
Fixed income Equity Mixed0%
of a
vera
ge to
tal a
sset
s
Figure 66 – Fees and costs by primary asset class
1.3%
2.6%
1.8%
2.1%
3.0%
2.6%
Management fees TER
6.0%
5.0%
4.0%
3.0%
2.0%
1.0%
2007 2008 2009 2010 2011 2012 2013 2014 2015 2016 2017 2018 20190
7.0%
% o
f ave
rage
tota
l ass
ets
Figure 67 – Historical TER of Microfinance funds
All Microfinance funds EquityFixed income Mixed
MARKET REPORT 2020
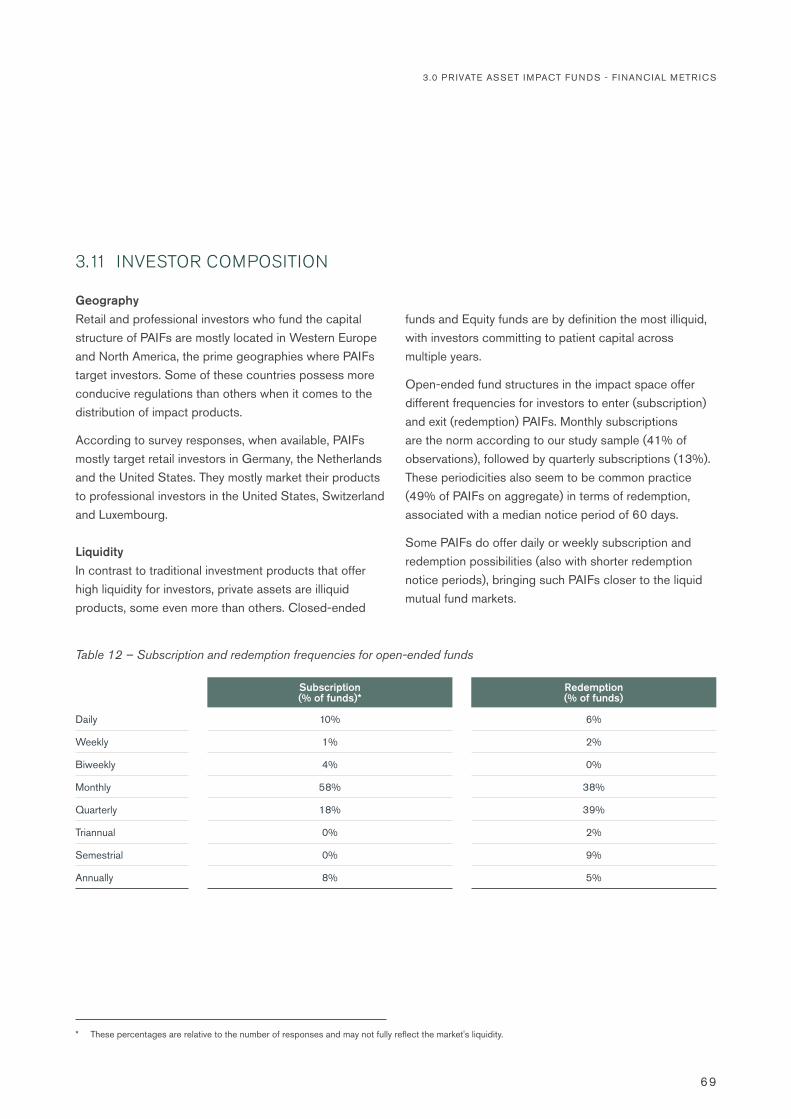
3.0 PR IVATE ASSET IMPACT FUNDS - F INANCIAL METR ICS
69
GeographyRetail and professional investors who fund the capital structure of PAIFs are mostly located in Western Europe and North America, the prime geographies where PAIFs target investors. Some of these countries possess more conducive regulations than others when it comes to the distribution of impact products.
According to survey responses, when available, PAIFs mostly target retail investors in Germany, the Netherlands and the United States. They mostly market their products to professional investors in the United States, Switzerland and Luxembourg.
LiquidityIn contrast to traditional investment products that offer high liquidity for investors, private assets are illiquid products, some even more than others. Closed-ended
funds and Equity funds are by definition the most illiquid, with investors committing to patient capital across multiple years.
Open-ended fund structures in the impact space offer different frequencies for investors to enter (subscription) and exit (redemption) PAIFs. Monthly subscriptions are the norm according to our study sample (41% of observations), followed by quarterly subscriptions (13%). These periodicities also seem to be common practice (49% of PAIFs on aggregate) in terms of redemption, associated with a median notice period of 60 days.
Some PAIFs do offer daily or weekly subscription and redemption possibilities (also with shorter redemption notice periods), bringing such PAIFs closer to the liquid mutual fund markets.
3.11 INVESTOR COMPOSITION
Subscription(% of funds)*
Redemption (% of funds)
Daily 10% 6%
Weekly 1% 2%
Biweekly 4% 0%
Monthly 58% 38%
Quarterly 18% 39%
Triannual 0% 2%
Semestrial 0% 9%
Annually 8% 5%
Table 12 – Subscription and redemption frequencies for open-ended funds
* These percentages are relative to the number of responses and may not fully reflect the market's liquidity.
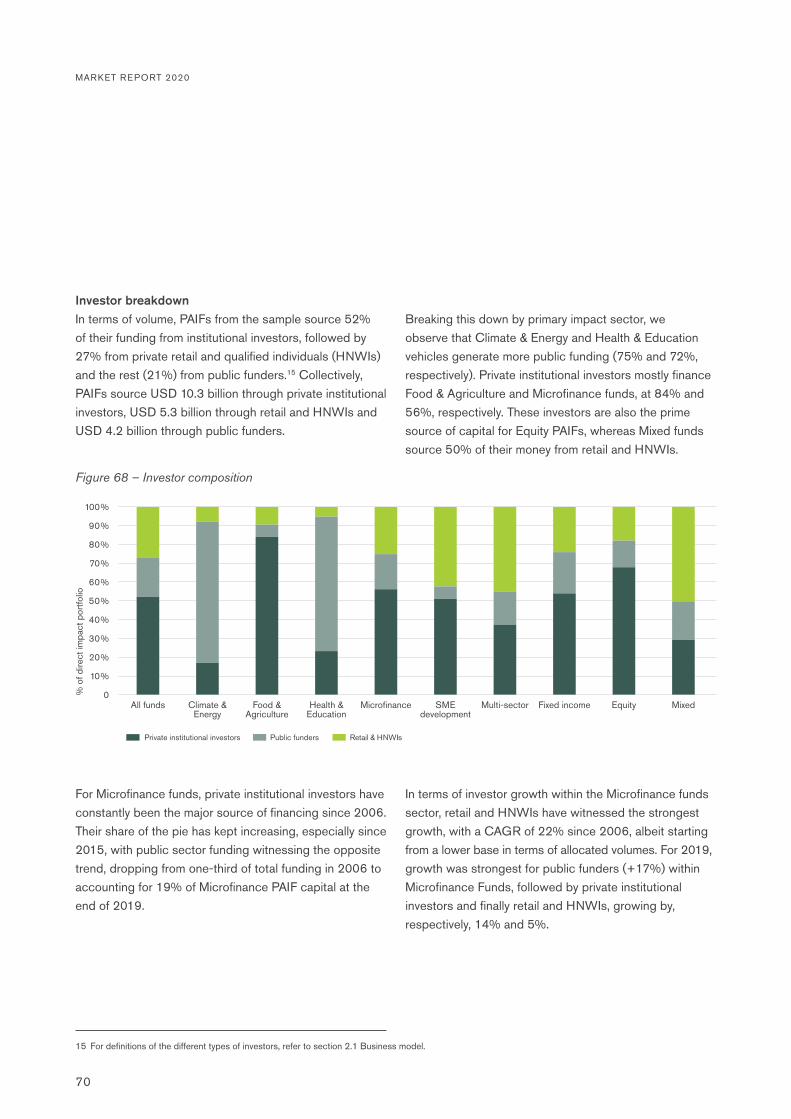
70
Investor breakdownIn terms of volume, PAIFs from the sample source 52% of their funding from institutional investors, followed by 27% from private retail and qualified individuals (HNWIs) and the rest (21%) from public funders.15 Collectively, PAIFs source USD 10.3 billion through private institutional investors, USD 5.3 billion through retail and HNWIs and USD 4.2 billion through public funders.
Breaking this down by primary impact sector, we observe that Climate & Energy and Health & Education vehicles generate more public funding (75% and 72%, respectively). Private institutional investors mostly finance Food & Agriculture and Microfinance funds, at 84% and 56%, respectively. These investors are also the prime source of capital for Equity PAIFs, whereas Mixed funds source 50% of their money from retail and HNWIs.
For Microfinance funds, private institutional investors have constantly been the major source of financing since 2006. Their share of the pie has kept increasing, especially since 2015, with public sector funding witnessing the opposite trend, dropping from one-third of total funding in 2006 to accounting for 19% of Microfinance PAIF capital at the end of 2019.
In terms of investor growth within the Microfinance funds sector, retail and HNWIs have witnessed the strongest growth, with a CAGR of 22% since 2006, albeit starting from a lower base in terms of allocated volumes. For 2019, growth was strongest for public funders (+17%) within Microfinance Funds, followed by private institutional investors and finally retail and HNWIs, growing by, respectively, 14% and 5%.
15 For definitions of the different types of investors, refer to section 2.1 Business model.
50%
40%
30%
20%
10%
All funds Climate & Energy
Food & Agriculture
Health & Education
Microfinance Multi-sector Fixed income Equity MixedSME development
0
60%
80%
70%
100%
90%
% o
f dire
ct im
pact
por
tfolio
Figure 68 – Investor composition
Private institutional investors Public funders Retail & HNWIs
MARKET REPORT 2020

3.0 PR IVATE ASSET IMPACT FUNDS - F INANCIAL METR ICS
71
7,000
6,000
5,000
4,000
3,000
2,000
1,000
2006 2007 2008 2009 2010 2011 2012 2013 2014 2015 2016 2017 2018 20190
9,000
8,000
US
D m
illion
Figure 69 – Historical investor composition of Microfinance funds
Private institutional investors (15.2% CAGR) Public funders (12.6% CAGR)
Retail & HNWIs (21.7% CAGR)
Yearly growth 2015 2016 2017 2018 2019
Private institutional investors 11.4% 13.1% 25.7% 4.2% 13.8%
Public funders 11.7% -6.9% 2.6% -1.1% 17.1%
Retail & HNWIs 15.4% 21.5% -3.5% 7.0% 5.1%
Table 13 – Yearly funding growth by investor type in Microfinance funds

72
Unleveraged funds USD EUR CHF
Fixed income 4.3% 2.7% 1.3%
Equity 6.3%
Mixed 4.6% 2.9%
Leveraged funds USD EUR CHF
Coupon returns 4.3%
Equity tranche (ROE) 2.7% 4.0%
Table 14 – Financial returns
Investors who fund the capital structure of PAIFs can either be shareholders, benefitting from the periodic distribution of dividends and capital appreciation of their fund units, or noteholders who have provided credit to the PAIFs in return for fixed or floating interest.
There are multiple drivers of net returns for PAIF investors. For Fixed Income funds, the net return will depend mostly on the portfolio yield or interest income from which the management fees, operational expenses and provisioning expenses will be deducted, together interlinked with liquidity management and cash drag dynamics, as well as international money market fluctuations. As seen before, cash levels average 10% of total assets, portfolio yields average 7.6% of portfolio levels, total expenses average 2.3% of total assets and provisioning levels reached 0.8% in 2019. For Equity funds, dividend levels and exit valuations, minus total expenses and performance fees, will drive the net return for investors. As seen in previous sections, all these inputs vary according to each PAIF’s primary impact sector of focus and overall investment strategy (currency, investee type, country allocation, etc.).
For the purposes of this study, we present the net returns by separating unleveraged and leveraged PAIFs, enabling us to disaggregate note interests and equity tranche returns for leveraged funds, and net shareholder returns in the case of unleveraged funds, by presenting the
information by strategy (Fixed Income funds, Mixed funds, Equity funds).
2019 – a strong year for financial returnsAs financial markets witnessed a comparatively strong year in 2019 across stocks and bonds, impact investing strategies also brought positive financial returns for investors.
For unleveraged funds, 2019 saw returns in USD of 4.3% for Fixed Income, 4.6% for Mixed and 6.3 % for Equity PAIFs. Returns were lower in EUR and CHF, at 2.7% and 1.3%, respectively for Fixed Income and 2.9% in EUR for Mixed funds.
For leveraged funds, the equity tranche returns amounted to 2.7% in USD and 4.0% in EUR. Noteholders received on average 4.3% on their loaned capital in USD.
For unleveraged Fixed Income funds, Health & Education and Microfinance sectors drove returns, at 9.8% and 4.5%, respectively. High portfolio yields along with relatively low annual loan loss provisions in the first sector partly explain the high returns. PAIFs with a prime focus on Food & Agriculture had a negative return in USD (-3.5%) and a low but positive one in EUR (1.1%).
3.12 FINANCIAL PERFORMANCE
MARKET REPORT 2020

3.0 PR IVATE ASSET IMPACT FUNDS - F INANCIAL METR ICS
73
3.5%
3.0%
2.5%
2.0%
1.5%
1.0%
0.5%
Climate & Energy Microfinance0%
retu
rn
Figure 70 – Leveraged funds - Equity Tranche (USD)
3.0%
1.6%
6.0%
4.0%
2.0%
0
-2.0%
-4.0%
-6.0%
8.0%
12.0%
10.0%
% re
turn
Figure 71 – Unleveraged, Fixed income funds
Food & Agriculture
Health & Education
Microfinance Multi-sector
CHFEURUSD
Maximum drawdownLooking at maximum drawdown figures16 helps contextualize how stable the PAIF market is. Across all sectors, and considering only funds with a monthly NAV valuation frequency, maximum drawdowns over the last five years have amounted to -2.31% for USD, -2.09% for EUR and -2.61% for CHF share classes. These values
decrease to -1.85%, -0.98% and -1.55%, respectively when focusing on highly hedged fund.
The low drawdown numbers are testament to the stability of the private asset impact investing strategy, even during stress periods for financial markets.
9.8%
-3.5%
1.1%
4.5%
2.8%
1.3%
3.1%
1.7%
16 Maximum drawdown should be understood as the maximum observed loss from a peak to a trough of a fund share class net asset value (NAV) per unit, before a new peak is reached.

74
Looking back at Microfinance funds' returnsIn microfinance, net returns have varied over the years since initial observations dating back to 2006. Following a challenging 2014-2017 period, Microfinance PAIF returns bounced back in 2018-2019 for Unleveraged Fixed Income strategies in USD. For these specific PAIFs, the 2019 values outperformed the Symbiotics Microfinance Index (SMX)17 in USD (4.5% vs. 4.4%), EUR (2.8% vs. 1.6%) and CHF (1.3% vs 1.1%).
Leveraged PAIFs seem to generate more stable returns on their equity tranche, at least in EUR, over the years in comparison to Unleveraged PAIFs.
For Equity Microfinance funds, returns averaged 9.0% in USD in the period under review, with high volatility linked to this business model.
17 The SMX - MIV Debt USD, EUR and CHF indexes are in-house Symbiotics indexes that track, on a monthly basis, the NAV of a selection of Microfinance funds with a majority of assets invested in Fixed Income instruments. The funds are equally weighted. The index has been available on syminvest.com in USD, EUR and CHF since 2004.
8%
6%
6%
5%
4%
4%
2%
3%
0
2%
-2%
1%
-4%
0
2006
2006
2007
2007
2008
2008
2009
2009
2010
2010
2011
2011
2012
2012
2013
2013
2014
2014
2015
2015
2016
2016
2017
2017
2018
2018
2019
2019
-6%
-1%
10%
7%
8%
% re
turn
% re
turn
Figure 72 – Historical USD returns of Fixed income Microfinance funds
Figure 73 – Historical EUR returns of Fixed income and Mixed Microfinance funds
Leveraged - noteholders
Leveraged - noteholders
Leveraged - equity tranche
Leveraged - equity tranche
Unleveraged, Fixed Income funds
Unleveraged, Fixed Income funds Unleveraged, Mixed funds
MARKET REPORT 2020

3.0 PR IVATE ASSET IMPACT FUNDS - F INANCIAL METR ICS
75
14%
12%
10%
8%
6%
4%
2%
2006 2007 2008 2009 2010 2011 2012 2013 2014 2015 2016 2017 2018 20190
18%
16%
% re
turn
Figure 74 – Historical USD returns of Equity Microfinance funds
Too fewobservations
between 2008 and 2010
Return forecastsWhile the full effects of the COVID-19 pandemic on PAIF performance remain uncertain as of writing, most PAIFs expect a slight to moderate decrease in their performance in 2020. Eight respondents expect a high decrease, of which 7 are Mixed and Fixed Income funds (4 and 3, respectively).
One-fifth appear to indicate stable returns for 2020 while only another fifth expect any sort of increase in returns, be it slight, moderate or high.
PAIFs in Climate & Energy, Health & Education and SME development are more optimistic (50% of funds expect a return increase) compared to Microfinance funds (75% expect a decrease). Equity PAIFs, although they forecast a decrease in size for 2020 (see section 3.2 Size & growth), are more optimistic than Mixed and Fixed income funds (44%, 27% and 10% of them expect an increase in returns, respectively).
Figure 75 – Return forecasts
Nb. of funds
8
26
36
26
8
12
5
Moderate decrease
Slight decrease
High decrease
Stable
Slight increase
Moderate increase
High increase


4
PRIVATE ASSET IMPACT FUNDS – IMPACT METRICSThis chapter looks at PAIF impact measurement and management practices. We have divided the chapter into three distinct sections, looking at impact management and measurement from three distinct lenses, altogether defining the development finance narrative.
We first look at their investment strategy, in terms of SDG intent, using impact investing principles, and seeing how they are put into practice in investment documentation and reporting.
We then look at the investment process, in terms of ESG integration, using broader sustainable finance principles and seeing how they filter, screen and rate each of the investments.
Finally, we look at the investment output in terms of BOP outreach, using more specific inclusive finance principles, and seeing how they actually deploy their capital at the base of the pyramid to maximize outreach and inclusion, as far out as possible in low- and middle-income countries and as deeply as possible into low- and middle-income households.
4.1 DEVELOPMENT FINANCE NARRATIVE
4.2 SDG INTENT
4.2 ESG INTEGRATION
4.3 BOP OUTREACH


79
Private sector development finance is inherent to the business model of PAIFs and their investment managers, seeking to pursue an investment philosophy geared towards sustainable finance, impact investing and inclusive finance in emerging and frontier markets. The development finance narrative integrates thus a triple promise or commitment, alongside the other risk, return, regulatory and cost elements built into their practice.
From a market size and investment universe standpoint, development finance is part of inclusive finance, in the sense of following an investment strategy with a view to create inclusive growth for the benefit of low- and middle-income economies in underserved markets, in a North-South dynamic. Inclusive finance is part of impact
investing, in the sense of positively addressing a range of global challenges, as currently illustrated by the SDGs. Finally, impact investing is part of sustainable finance, in the sense of integrating environmental, social and governance norms into the investment value chain and decision-making process.
As a result, development finance investments stand out from mainstream investments because they integrate these filters and drivers in their decision-making process, added value and monitoring work. Development finance funds have a theory of change built on what impact goals they address, how they filter the investment universe and how far and how deep they reach out with their investments.
4.1 DEVELOPMENT FINANCE NARRATIVE
DEVELOPMENTFINANCE
BOPESGSDG
4.0 PR IVATE ASSET IMPACT FUNDS – IMPACT METR ICS
Figure 76 – Development finance narrative
Impact investing(SDG intent)
Inclusive finance(BOP outreach)
Sustainable finance(ESG integration)

MARKET REPORT 2020
80
Integrating SDGs in the investment narrative and mapping them to specific strategies or transactions has become an important topic for the impact investment community. Ever since the 2030 Agenda for Sustainable Development put forward the common goals adopted in 2015, a variety of investment products revolving around one or multiple SDGs have come to light. For PAIFs, their impact intentionality at the onset guides their operational impact narrative. Many have even started implementing SDG considerations at the core of their impact investment activities.
As a result, PAIFs increasingly map their social and/or environmental goals against the SDGs. Some do it at the fund level (52 funds), others map it at the investee level (42), while yet others more granularly at the transaction level (37). Most PAIFs (80) have dedicated SDG reporting for their investors, and among those which do not have it, 32 are planning to do so soon.
We refer to this exercise upstream in the investment strategy as “SDG intent” using impact investing principles to tie the strategy of the fund to explicit goals and objectives, which then trickle down in the fund and transaction documentation and can be measured thereafter in the fund reporting.
4.2 SDG INTENT
Figure 77 – Mapping of funds' social/environmental goals against the SDGs
Nb. of funds
37
42
52
12
At an investee level
At a fund level
At a transaction level
No
Figure 78 – SDG reporting to investors
Nb. of funds 80
32
24
Yes
Not yet but planning to
No
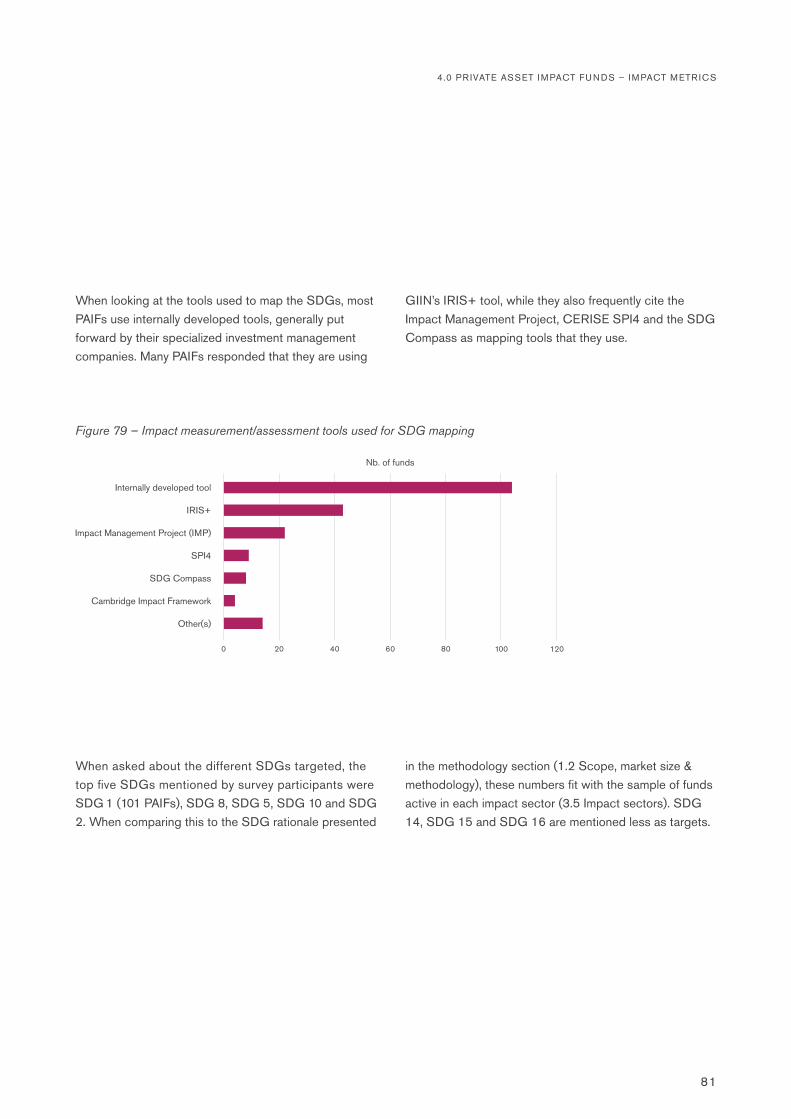
4.0 PR IVATE ASSET IMPACT FUNDS – IMPACT METR ICS
81
When looking at the tools used to map the SDGs, most PAIFs use internally developed tools, generally put forward by their specialized investment management companies. Many PAIFs responded that they are using
GIIN’s IRIS+ tool, while they also frequently cite the Impact Management Project, CERISE SPI4 and the SDG Compass as mapping tools that they use.
When asked about the different SDGs targeted, the top five SDGs mentioned by survey participants were SDG 1 (101 PAIFs), SDG 8, SDG 5, SDG 10 and SDG 2. When comparing this to the SDG rationale presented
in the methodology section (1.2 Scope, market size & methodology), these numbers fit with the sample of funds active in each impact sector (3.5 Impact sectors). SDG 14, SDG 15 and SDG 16 are mentioned less as targets.
Figure 79 – Impact measurement/assessment tools used for SDG mapping
SDG Compass
Cambridge Impact Framework
SPI4
Impact Management Project (IMP)
IRIS+
Internally developed tool
Other(s)
0 4020 80 100 12060
Nb. of funds

MARKET REPORT 2020
82
Figure 80 – Targeted SDGs
Goal 2
Goal 4
Goal 15
Goal 7
Goal 6
Goal 14
Goal 10
Goal 3
Goal 5
Goal 9
Goal 8
Goal 13
Goal 1
Goal 17
Goal 12
Goal 11
Goal 16
0 4020 80 100 12060
Nb. of funds
Each SDG has its own targets and indicators in terms of specification, implementation and measurement. For each PAIF category, we can subsegment the strategy and intent
into specific categories, with some measurement protocols sufficiently evolved to propose ex-post indicators of impact performance.

4.0 PR IVATE ASSET IMPACT FUNDS – IMPACT METR ICS
83
Reporting frameworks and measurement protocols for Climate & Energy PAIFs are much more advanced than most other categories, even than Microfinance funds. Most companies and projects have clear guidelines to capture either energy savings, CO2 emission reductions or renewable production, for instance. From the data collected in the PAIF sample, the annual renewable energy production from projects funded is 544,746 megawatt hours per year (MWH/year) at a fund level. The annual energy savings from projects funded is 176,074 MWh per year. The annual CO2 emissions reductions/avoidance/capture achieved from projects funded amount on average to 828,323 tons of CO2 per year.
Food & AgricultureThe portfolio of Food & Agriculture funds can typically be split in terms of their strategy and target objectives between equipment and input providers (2%), farmers and producers (16%), traders (31%), processors and manufacturers (15%) and distributors and retailers (36%).
In terms of ex-post outcome measurement, one key indicator is the area under sustainable management, which stands, on average, at 331,326 hectares per fund.
Climate & EnergyPAIFs in Climate & Energy allocate most of their portfolio between energy efficiency and storage, renewable energy production, and other segments, including climate insurance.
Figure 81 – Climate & Energy subsectors financed
% of financing for Climate & Energy
funds
12
37
41
12
Clean transportation
Energy efficiency/storage
Renewable energy production
Other(s)
Figure 82 – Agriculture value chain actors financed
% of financing for Food & Agriculture
funds
16
31
15
36
1 2
Equipment/input providers
Farmers and producers
Traders
Processors and manufacturers
Distributors and retailers
Other(s)

MARKET REPORT 2020
84
Health & EducationThe portfolio of Health & Education funds overwhelmingly addresses students rather than school needs (99% vs 1% of financing). Respondents were not yet able to report on their portfolio breakdown by type of healthcare service providers or beneficiaries, which can include clinics, health insurers, healthcare equipment suppliers and households, among others.
Housing, Water & CommunitiesHousing, Water & Communities sector funds typically channel their portfolio between affordable housing (61%) and sustainable water management (39%) strategies and objectives.
Figure 83 – Education actors financed
% of financing for Education funds
1
99
Education providers
Students/learners
Figure 84 – Housing, Water & Communities subsectors financed
% of financing for Housing, Water & Communities
funds6139
Affordable housing
Sustainable water and wastewater management
MicrofinanceThe impact of microfinance is best described in terms of three targets: (1) financial security, (2) household consumption and (3) employment and entrepreneurship dynamics. These can then be measured through a variety of indicators, in terms of (1) savings accounts, insurance policies, other non-credit products, and short-term liquidity loans, (2) household need loans, housing loans and
consumer loans, and (3) number of credit clients, average loans, and number of employees thereof, respectively.
In this survey, we were able to capture the breakdown of the gross loan portfolio of investees, in majority MFIs financed by Microfinance funds. This breakdown relates to the sectors of activity of end-clients and consumption patterns.
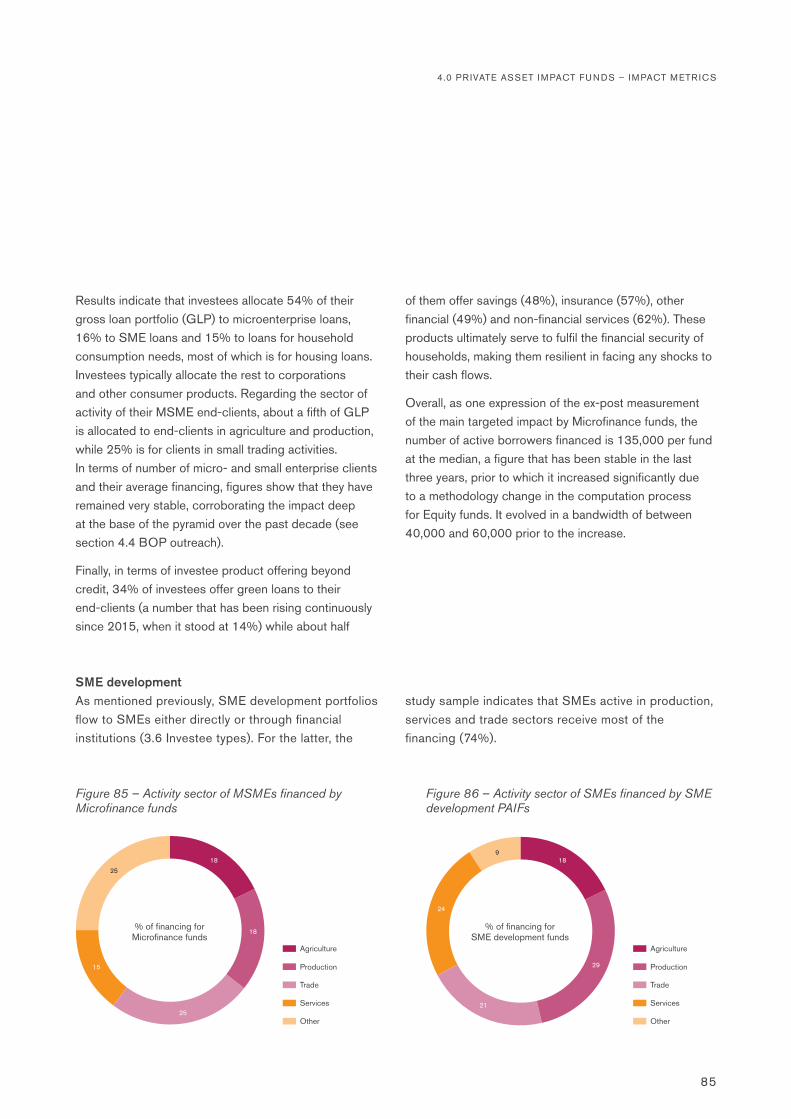
4.0 PR IVATE ASSET IMPACT FUNDS – IMPACT METR ICS
85
Results indicate that investees allocate 54% of their gross loan portfolio (GLP) to microenterprise loans, 16% to SME loans and 15% to loans for household consumption needs, most of which is for housing loans. Investees typically allocate the rest to corporations and other consumer products. Regarding the sector of activity of their MSME end-clients, about a fifth of GLP is allocated to end-clients in agriculture and production, while 25% is for clients in small trading activities. In terms of number of micro- and small enterprise clients and their average financing, figures show that they have remained very stable, corroborating the impact deep at the base of the pyramid over the past decade (see section 4.4 BOP outreach).
Finally, in terms of investee product offering beyond credit, 34% of investees offer green loans to their end-clients (a number that has been rising continuously since 2015, when it stood at 14%) while about half
of them offer savings (48%), insurance (57%), other financial (49%) and non-financial services (62%). These products ultimately serve to fulfil the financial security of households, making them resilient in facing any shocks to their cash flows.
Overall, as one expression of the ex-post measurement of the main targeted impact by Microfinance funds, the number of active borrowers financed is 135,000 per fund at the median, a figure that has been stable in the last three years, prior to which it increased significantly due to a methodology change in the computation process for Equity funds. It evolved in a bandwidth of between 40,000 and 60,000 prior to the increase.
SME developmentAs mentioned previously, SME development portfolios flow to SMEs either directly or through financial institutions (3.6 Investee types). For the latter, the
study sample indicates that SMEs active in production, services and trade sectors receive most of the financing (74%).
Figure 85 – Activity sector of MSMEs financed by Microfinance funds
Figure 86 – Activity sector of SMEs financed by SME development PAIFs
% of financing for Microfinance funds
% of financing for SME development funds
18 18
18
25
29
21
15
24
25
9
Agriculture Agriculture
Production Production
Trade Trade
Services Services
Other Other

MARKET REPORT 2020
86
The second step in assessing the impact management and measurement practice of PAIFs applies broader sustainable finance principles, using ESG integration practices in terms of screening, filtering and rating the investments and investees as part of their decision-making process and reporting thereof.
Most of the PAIFs (133 of them) in the study sample integrate ESG screening into investment decision processes, with only a handful that are not yet doing so or not doing it at all. In terms of reporting, a significant majority of PAIFs do some form of ESG reporting for their investors (118 of them) while eight mentioned they plan to do so.
While PAIFs account for ESG factors, the majority do not – or do not yet – offer preferential treatment for their investees that demonstrate strong ESG commitment. A few PAIFs do, however, systematically offer preferential treatment (25 of them). For those that do it always, often or sometimes, the most frequent type of preferential treatment mentioned is “lower interest rates” on the credit side and “accepting lower dividends” on the equity side. More lenient financial covenants and other types of preferential treatment include flexible repayment schedules, less collateral, technical assistance and higher risk-taking willingness.
4.3 ESG INTEGRATION
Figure 87 – Integration of ESG screening into investment decision process
Figure 88 – ESG reporting to investors
Nb. of funds Nb. of funds
5
133 118
8
1 15
Yes Yes
Not yet but planning to Not yet but planning to
No No
Figure 89 – Use of preferential terms for investees demonstrating strong ESG commitment
Nb. of funds
25
16
2
88
Always
Often
Sometimes
Never
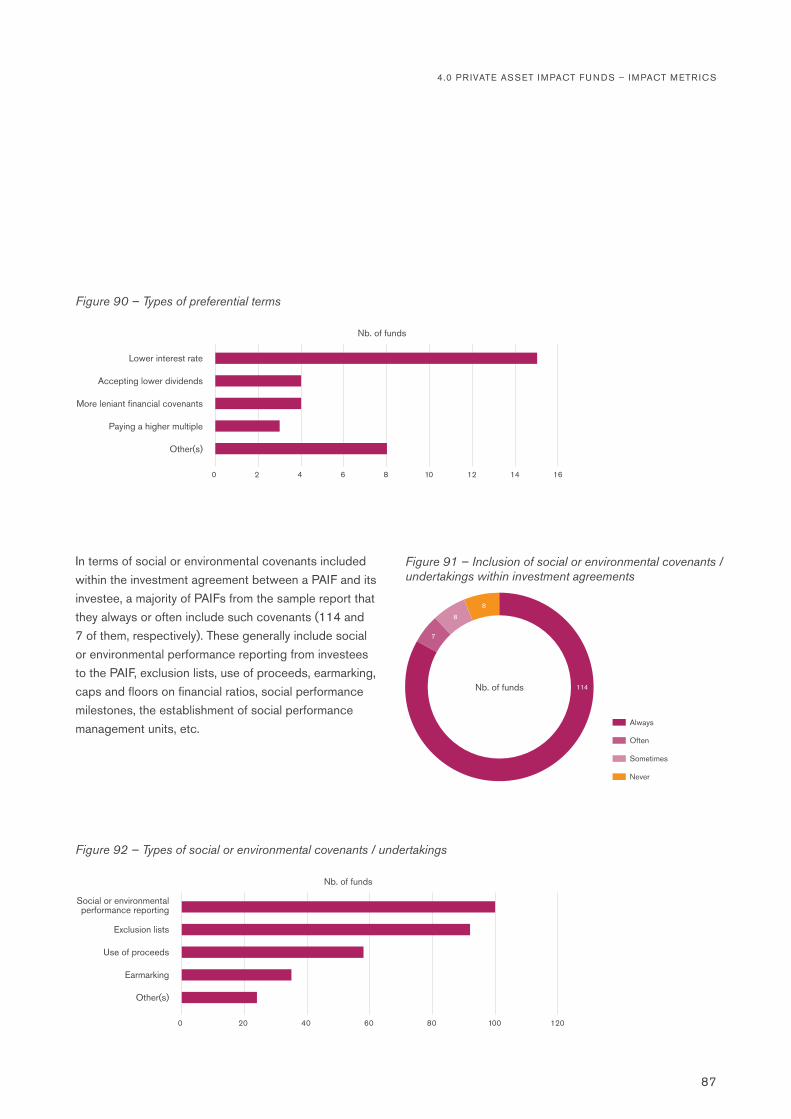
4.0 PR IVATE ASSET IMPACT FUNDS – IMPACT METR ICS
87
In terms of social or environmental covenants included within the investment agreement between a PAIF and its investee, a majority of PAIFs from the sample report that they always or often include such covenants (114 and 7 of them, respectively). These generally include social or environmental performance reporting from investees to the PAIF, exclusion lists, use of proceeds, earmarking, caps and floors on financial ratios, social performance milestones, the establishment of social performance management units, etc.
Figure 90 – Types of preferential terms
Other(s)
Paying a higher multiple
More leniant financial covenants
Accepting lower dividends
Lower interest rate
161412100 2 4 6 8
Nb. of funds
Figure 91 – Inclusion of social or environmental covenants / undertakings within investment agreements
Nb. of funds 114
7
8
8
Always
Often
Sometimes
Never
Figure 92 – Types of social or environmental covenants / undertakings
Other(s)
Social or environmentalperformance reporting
Earmarking
Use of proceeds
Exclusion lists
1201000 20 40 60 80
Nb. of funds

MARKET REPORT 2020
88
The third and last step in assessing the impact management and measurement practices of PAIFs is to use specific inclusive finance principles, anchored in development finance, looking at investment output in terms of BOP outreach, and seeing how they actually deploy their capital at the base of the pyramid to maximize outreach and inclusion, as far out as possible in low- and middle-income countries (country level) and as deeply as possible into low- and middle-income households (end-beneficiary level).
We derived the results presented below from common reporting metrics used by PAIFs in their disclosure of impact performance to investors, with more tracking and granularity for Microfinance funds given the sector’s historical track record and higher level of industry maturity.
Country outreachIn terms of volume, a PAIF’s direct impact portfolio is allocated mostly in lower middle-income countries (47%), followed by upper middle-income countries (43%), with only 4% to low-income countries. Arguably, grant funding and concessional investments probably best serve least developed countries (LDCs), given the sovereign risk management dynamics inherent to private sector investors and their fund managers. Health & Education as well as Housing, Water & Communities PAIFs are the most inclusive, country-wise, allocating three quarters of their impact portfolio to lower middle-income economies. Mixed funds seem to be the ones allocating the most to upper middle-income and high-income countries.
4.4 BOP OUTREACH
50%
40%
30%
20%
10%
All funds Climate & Energy
Food & Agriculture
Health & Education
Housing, Water &
Communities
Microfinance Multi-sector Fixed income Equity MixedSME development
0
60%
80%
70%
100%
90%
% o
f dire
ct im
pact
por
tfolio
Figure 93 – Country exposure by income level
Lower middle income Low incomeUpper middle incomeHigh income

4.0 PR IVATE ASSET IMPACT FUNDS – IMPACT METR ICS
89
Across all these markets, the gross national income (GNI) per capita averages USD 6,290. Comparing this to the world average (USD 11,570) demonstrates the ability of PAIFs to channel capital to where the population and households have lower than average income levels.
SME development and Food & Agriculture PAIFs have the highest GNI per capita recorded for their country portfolios, while Housing, Water & Communities and Health & Education the lowest.
Investee outreachInvestees are a prime link for PAIFs to the BOP. As observed, PAIFs mostly finance financial institutions and SMEs (section 3.6 Investee types). It is relevant to point to some social metrics at the investee level, especially since those are major drivers of employment in emerging and frontier markets. For this first survey edition, we have aimed to gather data on the number of employees of investees and the gender breakdown, looking at whether gender parity exists in PAIF impact portfolio investees. On average, investees have 40,000 employees, while
the median stands at less than 14,000. Slightly more than half of employees are men, but contrasts exist when looking at primary sectors of focus. Education PAIFs seem to finance investees with more women staff (at 80% of total employees), for instance, whereas Food & Agriculture investees have the highest share of men staff (65%). In terms of number of employees, Microfinance funds have the largest headcount at the investee level (average of 60,000 employees, median of 32,000), MFIs being known as labor-intensive employers.
10,000
8,000
6,000
4,000
2,000
All funds Climate & Energy
Food & Agriculture
Health & Education
Housing, Water &
Communities
Microfinance Multi-sector Fixed income Equity MixedSME development
0
12,000
US
D
Figure 94 – GNI per capita

MARKET REPORT 2020
90
50,000
40,000
30,000
20,000
10,000
Simple average Median0N
b. o
f em
ploy
ees
Figure 95 – Number of people employed by funds' investees Figure 96 – Gender profile of investees' employees
% of investees'employees
4555
Women
Men
End-client outreachFor all PAIFs, we attempted to retrieve the number of end-clients financed and assess where these clients were located and their gender. Results show that a PAIF finances on average 1.2 million end-clients, whereas the median observation stands at 204,000 end-clients, signaling the presence of high values that stem from Equity PAIFs (average of 4.3 million end-clients financed), with their higher outreach ability given their ownership stakes and capacity to drive decision-making in their investees (compared to Fixed Income and Mixed PAIFs which only
report the pro rata segment of the clientele they finance, with averages of 304,000 and 569,000 end-clients respectively).
In terms of location and gender, 58% of end-clients are in rural areas and two-thirds are women. Outreach to women seems to be particularly prevalent for Housing, Water & Communities (86%) and Microfinance (69%) funds. In terms of historical trends for Microfinance funds, they do show a bias in working with MFIs that have had a higher number of rural and women borrowers over the years.
70%
60%
50%
40%
30%
20%
10%
2008 2009 2010 2011 2012 2013 2014 2015 2016 2017 2018 20190
80%
% o
f end
-bor
row
ers
finan
ced
Figure 97 – Historical profile of Microfinance funds' end-borrowers
Rural Urban & peri-urban Women Men & Legal entities
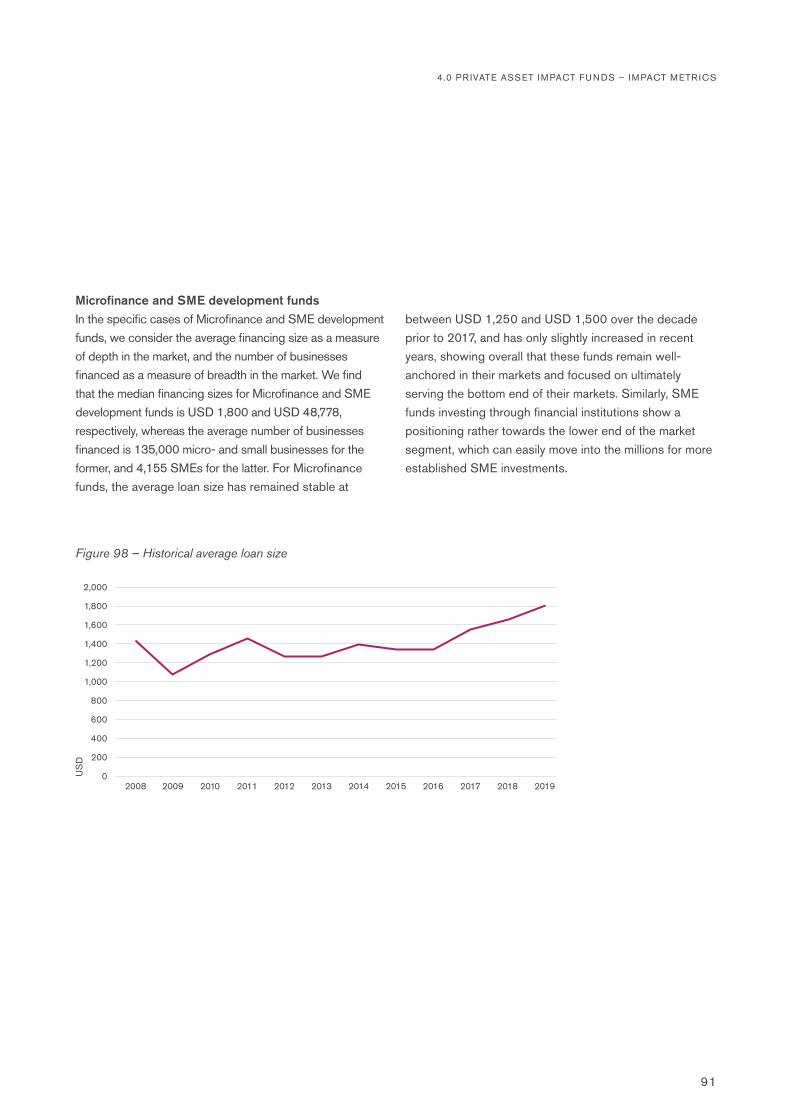
4.0 PR IVATE ASSET IMPACT FUNDS – IMPACT METR ICS
91
Microfinance and SME development fundsIn the specific cases of Microfinance and SME development funds, we consider the average financing size as a measure of depth in the market, and the number of businesses financed as a measure of breadth in the market. We find that the median financing sizes for Microfinance and SME development funds is USD 1,800 and USD 48,778, respectively, whereas the average number of businesses financed is 135,000 micro- and small businesses for the former, and 4,155 SMEs for the latter. For Microfinance funds, the average loan size has remained stable at
between USD 1,250 and USD 1,500 over the decade prior to 2017, and has only slightly increased in recent years, showing overall that these funds remain well-anchored in their markets and focused on ultimately serving the bottom end of their markets. Similarly, SME funds investing through financial institutions show a positioning rather towards the lower end of the market segment, which can easily move into the millions for more established SME investments.
1,400
1,200
1,000
800
600
400
200
2008 2009 2010 2011 2012 2013 2014 2015 2016 2017 2018 20190
1,600
1,800
2,000
US
D
Figure 98 – Historical average loan size


5
PANDEMIC PERIOD UPDATE This short chapter analyzes the effects of the COVID-19 pandemic on the financial performance of microfinance funds in 2020. It uses the reference index for fixed income microfinance funds to quantify the repercussions of the current crisis while putting in perspective the resilience of microfinance during stress periods for financial markets. Other mainstream indices are used to contextualize overall findings.

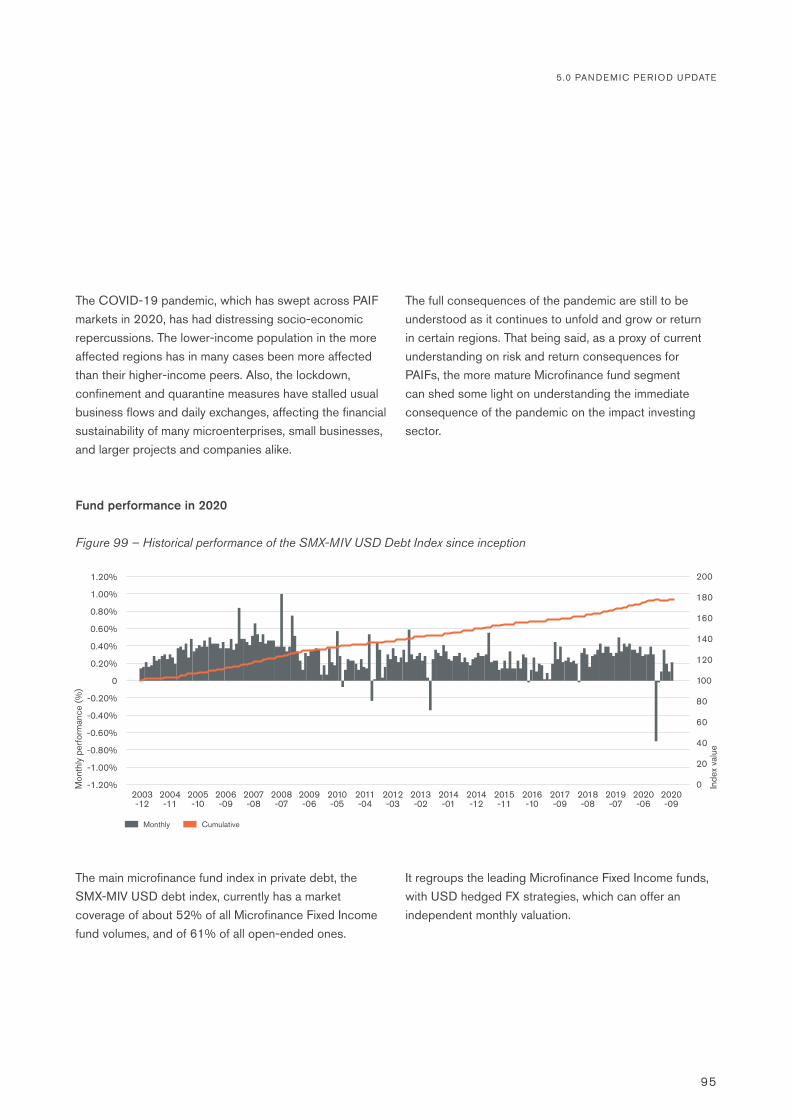
5.0 PANDEMIC PER IOD UPDATE
95
The COVID-19 pandemic, which has swept across PAIF markets in 2020, has had distressing socio-economic repercussions. The lower-income population in the more affected regions has in many cases been more affected than their higher-income peers. Also, the lockdown, confinement and quarantine measures have stalled usual business flows and daily exchanges, affecting the financial sustainability of many microenterprises, small businesses, and larger projects and companies alike.
The full consequences of the pandemic are still to be understood as it continues to unfold and grow or return in certain regions. That being said, as a proxy of current understanding on risk and return consequences for PAIFs, the more mature Microfinance fund segment can shed some light on understanding the immediate consequence of the pandemic on the impact investing sector.
The main microfinance fund index in private debt, the SMX-MIV USD debt index, currently has a market coverage of about 52% of all Microfinance Fixed Income fund volumes, and of 61% of all open-ended ones.
It regroups the leading Microfinance Fixed Income funds, with USD hedged FX strategies, which can offer an independent monthly valuation.
Fund performance in 2020
0.60%140
0.40%1200.20%
1000
80-0.20%
60-0.40%
40-0.60%
20
2003-12
2012-03
2008-07
2016-10
2004-11
2013-02
2017-09
2005-10
2014-01
2009-06
2018-08
2006-09
2014-12
2010-05
2007-08
2015-11
2011-04
2019-07
2020-09
2020-06
-1.20%
-1.00%
-0.80%
0
0.80%160
1.00% 180
1.20% 200
Figure 99 – Historical performance of the SMX-MIV USD Debt Index since inception
Monthly Cumulative
Mon
thly
perfo
rman
ce (%
)
Inde
x va
lue

96
Since its launch in December 2003, and as of September 2020, this index has provided a cumulative return of 77.52%, which represents a compound monthly net return of 28.59 basis points or a compound annual net return of 3.49%. So far in 2020, the index has a year-to-date net return of 0.91%, which when annualized amounts to
1.21% or 1.79% when considering the past 12-months. In both cases, the Microfinance funds industry has taken its hardest hit since inception; but it has also remained afloat and shown much less performance volatility than other asset classes.
0.60% 178.0
0.40%
0.20%
177.0
0176.0
-0.20%175.0
-0.40%174.0
-0.60% 173.0
2019- 09
2020- 07
2020- 02
2019- 10
2020- 08
2020- 03
2019- 11
2020- 09
2020- 04
2019- 12
2020- 05
2020- 01
2020- 06
-0.80% 172.0
Figure 100 – One year performance of the SMX-MIV USD Debt Index
Monthly Cumulative
105.00
110.00
115.00
120.00
100.00
95.00
90.00
85.00
80.00
75.00
2019- 09
2020- 06
2020- 01
2019- 10
2020- 07
2020- 08
2020- 02
2019- 11
2020- 09
2020- 03
2019- 12
2020- 04
2020- 05
70.00
Figure 101 – Contextualizing the economic impact of the pandemic on Fixed income Microfinance funds
DM stocks
Fixed income Microfinance funds
EM stocks
EM government bonds
Commodities
DM government bonds
Inde
xed
perfo
rman
ceMARKET REPORT 2020
Hedge funds
Mon
thly
perfo
rman
ce (%
)
Inde
x va
lue
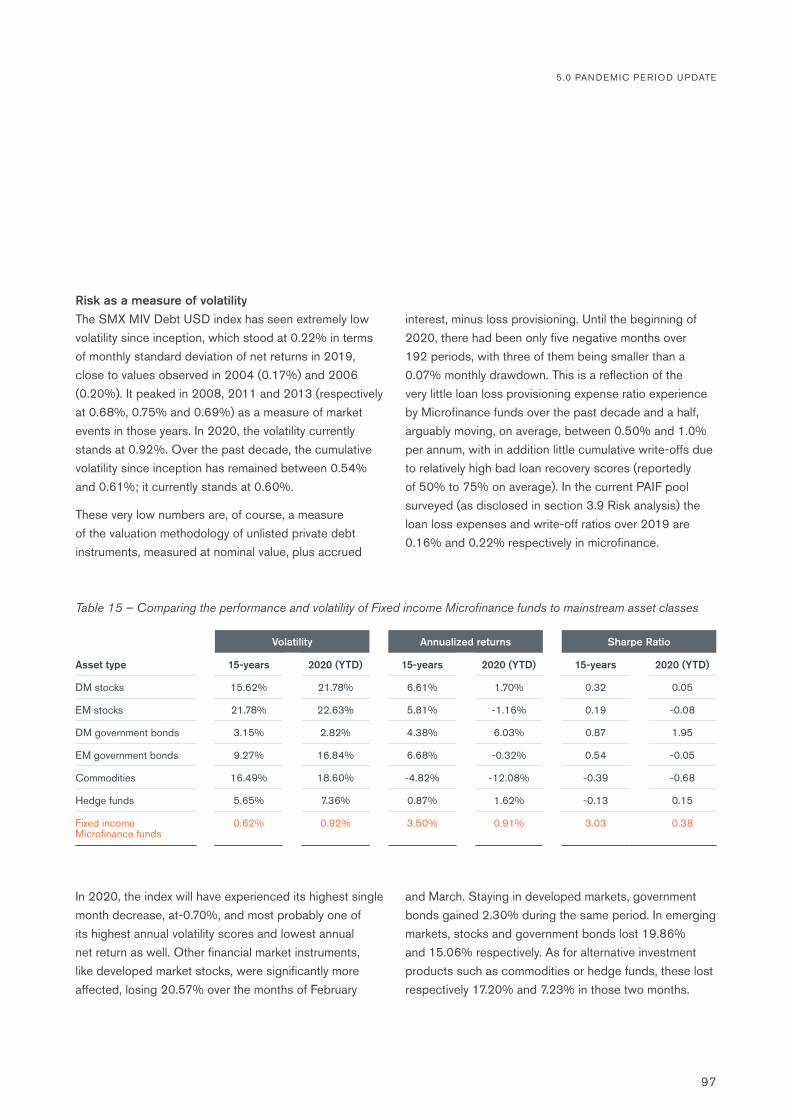
5.0 PANDEMIC PER IOD UPDATE
97
Risk as a measure of volatilityThe SMX MIV Debt USD index has seen extremely low volatility since inception, which stood at 0.22% in terms of monthly standard deviation of net returns in 2019, close to values observed in 2004 (0.17%) and 2006 (0.20%). It peaked in 2008, 2011 and 2013 (respectively at 0.68%, 0.75% and 0.69%) as a measure of market events in those years. In 2020, the volatility currently stands at 0.92%. Over the past decade, the cumulative volatility since inception has remained between 0.54% and 0.61%; it currently stands at 0.60%.
These very low numbers are, of course, a measure of the valuation methodology of unlisted private debt instruments, measured at nominal value, plus accrued
interest, minus loss provisioning. Until the beginning of 2020, there had been only five negative months over 192 periods, with three of them being smaller than a 0.07% monthly drawdown. This is a reflection of the very little loan loss provisioning expense ratio experience by Microfinance funds over the past decade and a half, arguably moving, on average, between 0.50% and 1.0% per annum, with in addition little cumulative write-offs due to relatively high bad loan recovery scores (reportedly of 50% to 75% on average). In the current PAIF pool surveyed (as disclosed in section 3.9 Risk analysis) the loan loss expenses and write-off ratios over 2019 are 0.16% and 0.22% respectively in microfinance.
In 2020, the index will have experienced its highest single month decrease, at-0.70%, and most probably one of its highest annual volatility scores and lowest annual net return as well. Other financial market instruments, like developed market stocks, were significantly more affected, losing 20.57% over the months of February
and March. Staying in developed markets, government bonds gained 2.30% during the same period. In emerging markets, stocks and government bonds lost 19.86% and 15.06% respectively. As for alternative investment products such as commodities or hedge funds, these lost respectively 17.20% and 7.23% in those two months.
Volatility Annualized returns Sharpe Ratio
Asset type 15-years 2020 (YTD) 15-years 2020 (YTD) 15-years 2020 (YTD)
DM stocks 15.62% 21.78% 6.61% 1.70% 0.32 0.05
EM stocks 21.78% 22.63% 5.81% -1.16% 0.19 -0.08
DM government bonds 3.15% 2.82% 4.38% 6.03% 0.87 1.95
EM government bonds 9.27% 16.84% 6.68% -0.32% 0.54 -0.05
Commodities 16.49% 18.60% -4.82% -12.08% -0.39 -0.68
Hedge funds 5.65% 7.36% 0.87% 1.62% -0.13 0.15
Fixed income Microfinance funds
0.62% 0.92% 3.50% 0.91% 3.03 0.38
Table 15 – Comparing the performance and volatility of Fixed income Microfinance funds to mainstream asset classes
MARKET REPORT 2020
98
Overall, Microfinance funds remain attractive in terms of additional risk for additional performance brought to multi-asset strategies and mainstream investment portfolios, when comparing Microfinance funds to stocks, bonds and alternatives in developed or emerging markets.17 Sharpe ratios from the different asset classes (using the 3-Month LIBOR in USD as the risk-free rate and despite the divergent liquidity nature of each asset class) clearly signal an interesting coupling of risk and return. This remains true in 2020 as well.
Underlying risk management policiesThese figures are, of course, not a measure of prediction for the coming months, as the full effect of the pandemic is not fully built into mainstream or impact markets yet. However, they are also a reflection of the important work done by domestic policymakers, development finance policy-makers and impact financing fund managers.
To support their economies, policy-makers have responded with a wave of interest rate cuts and stimulus packages in larger volumes than those seen during the global financial crisis. Development banks and foreign government aid agencies have also stepped in to inject much needed liquidity aimed at the financially underserved through large and rapid debt relief programs. Microfinance fund managers have also put significant coordinated efforts into ensuring that liquidity needs are met with coordinated intelligence and commitment, for the benefit of investors, microfinance institutions and their end clients.
In April 2020 for instance, nine leading Microfinance investment managers (BlueOrchard, DWM, Incofin, Microvest, Oikocredit, responsAbility, Triodos, Triple Jump and Symbiotics) signed a memorandum of understanding to coordinate their response to the COVID-19 impacts in terms of managing liquidity and solvency cases in the market. Also, in May 2020, a consortium of public and private
players in inclusive finance (among which Grameen Crédit Agricole Foundation, Alterfin, Pamiga, Cordaid Investment Management, FS Impact Finance, Inpulse, Investing for Development, MCE Social Capital, SIDI and SIMA) signed a common pledge to coordinate policies, technical assistance and lending activities to protect microfinance institutions and their end-clients. Finally, prominent impact investing networks supported by several foundations created the R3 Coalition, managed by the GIIN, to fill financing gaps and share insights with the investment community in response to the COVID-19 pandemic.
In terms of data points, CGAP launched the Global Pulse Survey of Microfinance Institutions, which provides up-to-date data on Microfinance fund borrowers. Symbiotics also runs MFI benchmarks, such as the SYM50, which tracks key performance indicators. Both show that the MFI landscape is quite stable and resilient as of now. For the SYM50, comparing end 2019 and end of August 2020 figures, profitability has indeed come down over the year, but it remains positive (returns on equity have moved on average from 10% to 5% over the year). Portfolio at risk levels have roughly doubled, but are still under control, moving from 5% to 10%, on average. Cash levels are stable, at around 10% of assets, even slightly increasing recently. Capital adequacy ratios are stable at 29%. Liquidity coverage ratios are stable at 175%. Risk coverage ratios are similarly stable at 107%. And both cash collection rates and cash disbursement rates, despite dropping to unseen levels in Q2, are gradually returning closer to 100%. From these figures we should not conclude that things are returning to a back-to-normal situation; they are different from one country to another. More importantly they require the benefit of time to be able to understand where they are headed over the last quarter and into 2021. But they explain quite well the current performance of the SMX MIV Debt USD index.
17 We used and sourced the following market indices from Bloomberg Stocks – Developed markets: MSCI World Net Total Return USD Index; Emerging markets: MSCI Emerging Net Total Return USD Index Government bonds – Developed markets: JPM Hedged USD GBI Global Index; Emerging markets: JPM EMBI Global Core Index Alternatives – Commodities: Bloomberg Commodity Index Total Return; Hedge funds: HFRX Global Hedge Fund Index

FEATURED SPONSORS

100
We would like to thank the following impact fund managers and PAIFs for their generous financial support and collaboration on this first edition of the PAIF survey.
In the following pages, our sponsors showcase their product offerings, business models and track records in the impact investing sector.

ALPHAMUNDI GROUP KPIs
Incorporation year : 2009Headquarters : Geneva, Switzerland
Nb. of offices : 4Nb. of staff (FTE) : 13
AuM (USD) : 59 millionNb. of PAIFs : 2
Nb. of investees : 24Main geography of investment :
Africa & Latin AmericaMain impact sector : Poverty alleviation
Main asset class : Private debt
AlphaMundi Group was created in 2008 as a Swiss advisory group dedicated to impact investing. Its mission is to provide market-based solutions to the world’s most pressing challenges, currently best defined by the Sustainable Development Goals. Since 2009, AlphaMundi has profitably invested USD 64M in 47 impact ventures in Latin America and Africa, primarily through the firm’s SocialAlpha impact fund and related co-investments, across 120 venture debt and equity transactions, with an impact on more than 5 million beneficiaries, the vast majority in rural areas and some 40% of women.
SocialAlpha is an open-ended, Gender Lens, Multi-sector, private debt SICAV-SIF fund scaling up SMEs in Latin America & Africa since 2009, across Sustainable Food, Financial Inclusion and Renewable Energy.The open-ended Fund provides short-duration loans of 12-24 months, allowing for a quarterly liquidity, with the occasional use of mezzanine instruments, convertibles and warrants.
SocialAlpha’s most appealing features include a first-loss guarantee facility by USAID covering about 25% of the Fund’s AUM, and its resilience, with low volatility and market correlation since inception, delivering a net USD IRR of 2.7%.SocialAlpha also provides co-investment rights that allow Fund investors to co-invest directly in select portfolio companies, through debt or equity, and thereby enhance their risk-adjusted returns, with a net USD IRR of 6.72% since co-investment inception in 2014.
As for the Fund’s impact, its portfolio companies currently serve more than 350k low-income clients, 79% living in rural areas. In fact, SocialAlpha’s agriculture companies are a key source of income for 44k supplier farmers. Women represent 43% of portfolio company staff and 54% of direct clients.
Since inception, the Fund has impacted 5M+ beneficiaries. It has helped 7,000 low-income students access university, including 98% of first-time borrowers. More than 700k solar home systems have been installed by the Fund’s solar companies, giving clean energy access to 2M+ African households. The Fund Manager, AlphaMundi, has staff in Geneva, Bogota, Nairobi, and a corporate foundation in Washington, D.C.
ABOUT THE SOCIALALPHA INVESTMENT FUND (SAIF-BASTION)
30 %
20 %
10 %
0 %
-10 %
-20 %
-30 %
06/2012
06/2013
06/2014
06/2015
06/2016
06/2017
06/2018
06/2019
06/2020
CUMULATIVE RETURNS
SAIF Bastion Emerging Market
Bonds Index
Equity Emerging
Markets
Investment SolutionsFor People and Planet

Caspian Debt is the third fund promoted by Caspian Advisors a leading impact fund manager in India. Caspian Debt's mission is to
enable the growth of companies that can achieve in a responsible, sustainable, and transparent manner positive social &
environmental impact. We are a certified B Corporation, which means we take into account the impact of our decisions on our
employees, customers, community and environment. We have served over 140 companies in the last 7 years responsibly &
profitability.
FOCUS SECTORS
Focusing on critical and
transformational sectors and
business models.
13
SDGs served
Food & Agriculture
About Grassroots and Caspian: Since they began collaborating in 2005, Grassroots and Caspian have mobilized USD 350 million in impact capital to
date, of which USD 150 million has been invested in India. We have built a solid track record of investment performance and hands on-value
creation. Our expertise lies in working with early stage companies and transforming them into robust high growth businesses.
Our Strategy
Impact
Identifying transparent, ethically run,
professionally managed organizations
that require early stage funding.
Providing collateral free customised loans
to these organizations & closely
monitoring impact through the loan cycles.
HealthcareSmall Finance
BankClean Energy Microfinance
38%women impact
businesses
40%
companies led
by women
83%active companies that showed
positive CAGR post receiving
support from Caspian Debt.
58%
of companies have
taken at least 4 loans
USD 300Mn
Amount disbursed
till date
www.caspiandebt.in
Since 2000, Grassroots has pioneered private investment in impact companies, starting with microfinance and evolving to
include SMEs, sustainable agriculture, affordable education, and other sectors. Grassroots mobilizes the “first mover” capital
that develops innovative, scalable business models to alleviate the challenges of poverty, food and health insecurity, climate and
gender vulnerability, and build resilient communities. Grassroots funds target a financial return consistent with fidelity to their
social objectives.
Education
Milestones
Early private equity investments
in South Asian micro & SME
finance companies
2001 2003
Launch first private
microfinance fund
of funds
2005
Anchor investments in
Bellwether, Microvest, ASA
International, Locfund
2008
Partner to launch equity funds in India & Latin
America targeting microfinance, SME &
affordable housing with over USD 100Mn capital
2010
Support pilot &
launch of B Corp
& GIIRS ratings
2013
First Delaware
Public Benefit
Corporation
2015
Rated best for the
World by B Lab for
Governance, Customers
2017
Anchor investor in first impact
company to successfully IPO on
London Stock Exchange
2018
Supported USD 30 million
in OPIC / DFC financing
for Caspian Debt
Key Indicators
USD 350 million invested
across Latin America,
Africa and Asia
Managed and / or
anchored eight impact
funds
All funds exceeded
return of capital
Targeted seven SDGs: poverty, hunger,
gender equality, work and economic
growth, responsible consumption, climate
action and partnerships
About Caspian Debt
About Grassroots Capital Management
https://www.grassrootscap.com/
Caspian Debt is the third fund promoted by Caspian Advisors a leading impact fund manager in India. Caspian Debt's mission is to
enable the growth of companies that can achieve in a responsible, sustainable, and transparent manner positive social &
environmental impact. We are a certified B Corporation, which means we take into account the impact of our decisions on our
employees, customers, community and environment. We have served over 140 companies in the last 7 years responsibly &
profitability.
FOCUS SECTORS
Focusing on critical and
transformational sectors and
business models.
13
SDGs served
Food & Agriculture
About Grassroots and Caspian: Since they began collaborating in 2005, Grassroots and Caspian have mobilized USD 350 million in impact capital to
date, of which USD 150 million has been invested in India. We have built a solid track record of investment performance and hands on-value
creation. Our expertise lies in working with early stage companies and transforming them into robust high growth businesses.
Our Strategy
Impact
Identifying transparent, ethically run,
professionally managed organizations
that require early stage funding.
Providing collateral free customised loans
to these organizations & closely
monitoring impact through the loan cycles.
HealthcareSmall Finance
BankClean Energy Microfinance
38%women impact
businesses
40%
companies led
by women
83%active companies that showed
positive CAGR post receiving
support from Caspian Debt.
58%
of companies have
taken at least 4 loans
USD 300Mn
Amount disbursed
till date
www.caspiandebt.in
Since 2000, Grassroots has pioneered private investment in impact companies, starting with microfinance and evolving to
include SMEs, sustainable agriculture, affordable education, and other sectors. Grassroots mobilizes the “first mover” capital
that develops innovative, scalable business models to alleviate the challenges of poverty, food and health insecurity, climate and
gender vulnerability, and build resilient communities. Grassroots funds target a financial return consistent with fidelity to their
social objectives.
Education
Milestones
Early private equity investments
in South Asian micro & SME
finance companies
2001 2003
Launch first private
microfinance fund
of funds
2005
Anchor investments in
Bellwether, Microvest, ASA
International, Locfund
2008
Partner to launch equity funds in India & Latin
America targeting microfinance, SME &
affordable housing with over USD 100Mn capital
2010
Support pilot &
launch of B Corp
& GIIRS ratings
2013
First Delaware
Public Benefit
Corporation
2015
Rated best for the
World by B Lab for
Governance, Customers
2017
Anchor investor in first impact
company to successfully IPO on
London Stock Exchange
2018
Supported USD 30 million
in OPIC / DFC financing
for Caspian Debt
Key Indicators
USD 350 million invested
across Latin America,
Africa and Asia
Managed and / or
anchored eight impact
funds
All funds exceeded
return of capital
Targeted seven SDGs: poverty, hunger,
gender equality, work and economic
growth, responsible consumption, climate
action and partnerships
About Caspian Debt
About Grassroots Capital Management
https://www.grassrootscap.com/About Grassroots Capital Management
About Caspian Debt
https://www.grassrootscap.com
https://www.caspiandebt.in
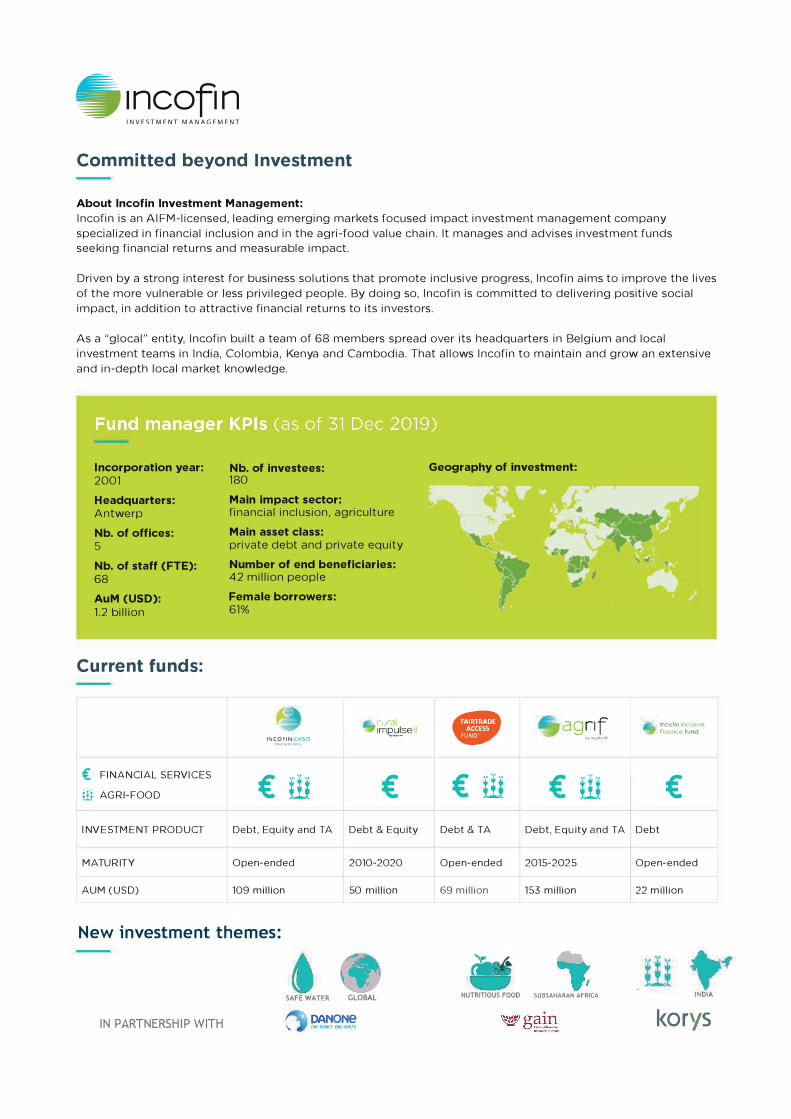
e1ncofin INVESTMENT MANAGEMENT
Committed beyond lnvestment
About lncofin lnvestment Management: lncofin is an AIFM-licensed, leading emerging markets focused impact investment management company specialized in financial inclusion and in the agri-food value chain. lt manages and advises investment funds seeking financial returns and measurable impact.
Driven by a strong interest for business solutions that promote inclusive progress, lncofin aims to improve the lives of the more vulnerable or less privileged people. By doing so, lncofin is committed to delivering positive social impact, in addition to attractive financial returns to its investors.
As a "glocal" entity, lncofin built a team of 68 members spread over its headquarters in Belgium and local investment teams in lndia, Colombia, Kenya and Cambodia. That allows lncofin to maintain and grow an extensive and in-depth local market knowledge.
Incorporation year: 2001
Headquarters: Antwerp
Nb. of offices: 5
Nb. of staff (FTE): 68
AuM (USD): 1.2 billion
Current funds:
€ FINANCIAL SERVICES
m AGRI-FOOD
INVESTMENT PRODUCT
MATURITY
AUM (USD)
Nb. of investees: 180
Main impact sector: financial inclusion, agriculture
Main asset class: private debt and private equity
Number of end beneficiaries: 42 million people
Female borrowers: 61%
rural INCOFIN CVSO
1mP..�Lse Il
€ "f' ;_t € Debt, Equity and TA Debt & Equity
Open-ended 2010-2020
109 million 50 million
New investment themes:
IN PARTNERSHIP WITH
symbioticsgroup.com
SAFE WATER GLOBAL
DANONe \, 0NEl'l.AN(T.OHE:H€ALTH
Geography of investment:
• agrifbylncofinl'-'
€ "f' ;_t € "f';_tDebt & TA Debt, Equity and TA
Open-ended 2015-2025
69 million 153 million
--� ..... NUTRITIOUS FOOD SUBSAHARAN AFRICA
lncofin Inclusive Finance Fund
€ Debt
Open-ended
22 million
INDIA
korys

INOKS CAPITAL KPls
Incorporation year : 2004Headquarters : Geneva, Switzerland
Nb. of offices : 4Nb. of staff (FTE) : 28
AuM (USD) : 560 millionNb. of PAIFs : 3
Nb. of investees : 39Main geography of investment :
Global with EM biasMain impact sectors : Food Security,
Poverty Reduction, Environmental Quality, Women Empowerment
Main asset class : Alternative Credit - Loans
IMPACT INVESTING IN THE FOOD SECTOR
INOKS Capital (thereafter “INOKS”) is a Swiss asset manager prudentially regulated by FINMA, providing customized financing solutions, via collective investment schemes or segregated mandates, to companies active non-speculatively in mainly the Agriculture/Food sector. INOKS aims to be the market leader in capital access in the real economy, by (i) focusing in fast developing geographies like Sub-Sahara African or Eastern European markets and (ii) by applying its proprietary ESG/Impact framework.
INOKS believes that Impact Investing has a powerful leverage to channel capital towards the companies that contribute to a sustainable inclusive future and address the immediate needs of the real economy. For INOKS, Impact Investing is an engaged financial act that goes beyond exclusion and/or compliance with international standards and steers towards increased engagement with counterparties to unlock and scale their impact.
To achieve this, INOKS deploys a two-fold investment strategy implemented through clear principles, standards and tools (please see ‘Theory of Change’ chart below). This strategy consists of investing its capital (i) responsibly by mitigating negative effects according to ESG criteria and (ii) impactfully by contributing to address specific sustainability challenges and generating positive impact according to INOKS’s four Impact Themes:
Poverty Reduction, Food Security, Environmental Quality and Women Empowerment.
Achieving attractive returns while at the same time contributing to positive impact? It is not only possible but also something that usually goes hand in hand… Indeed, INOKS’s managed funds have been achieving positive returns for more than ten years now with a low correlation to traditional asset classes and low levels of volatility.
As an example, INOKS is supporting a local Ivorian rice processor, aiming at improving food security through increased local rice availability and more stable market prices at country level. To do so, the company works at local level to develop and improve local milling facilities and strengthen agricultural productivity and efficiencies of local farmers’ cooperative. Whilst enabling a better resilience of local actors, which is key even more so in COVID19 times, it also leads to higher and more sustainable returns for the company.
IMPACT INVESTMENT AND POSITIVE
HOLISTIC RETURN
REGMIFA IN A NUTSHELL
Launched: 2010Asset class: Fixed-income
Impact sector: Microfinance and SME financeRegional focus: Sub-Saharan Africa
KPIs (JUNE 2020)
Total assets (USD): 144.6 millionNb. of investees: 51
Currency strategy: LC, fully hedgedInvestor-type: Public, Professional
ACTIVE CONTRIBUTION TO THE SDGs
A UNIQUE BLENDED FINANCE STRUCTURE FOR MSMES IN SUB-SAHARAN AFRICA
REGMIFA aims to foster economic development, employment creation and poverty alleviation in Sub-Saharan Africa (SSA). The Fund provides innovative financial products and technical assistance (TA) support to Partner Lending Institutions (PLIs, mostly microfinance institutions and SME banks), which serve MSMEs and low- and middle-income households. The Fund is a unique public-private partnership between development finance institutions, private investors and African stakeholders.
TRACK-RECORD SINCE 2010 :
USD 422M 24 320,000invested countries jobs supported per year
56% 74% 153,000women borrowers urban borrowers end-borrowers per year
Technical assistance facility :
69 EUR 9.1M 23PLIs supported donors’ commitments countries
in SSA
REGMIFA 10 YEARS OF IMPACT :
On the 10th anniversary of its launch, REGMIFA is releasing a landmark study on the Fund’s footprint in three key markets, and how its financial services supported MSMEs in terms of:
financial inclusion changes in income quality of life employment generation
Key takeaways:
657 63% MSMEs interviewed end-borrowers did not have access to similar loans in the past 92% 90%of end-borrowers run of end-borrowersmicro-enterprises with experienced an increaseless than five employees in overall quality of life
IMPACT OF COVID-19 ON END-BORROWERS:
REGMIFA’s key role in promoting sustainable development is even more decisive in pandemic and crisis times. To offer PLIs actionable insights to better serve their MSME clients, REGMIFA is participating in a leading industry initiative, launched in May 2020, to assess the impact of the pandemic at the level of end-borrowers.
The data collection is currently in its final round, with more than 2,000 end-borrowers from Ghana, Kenya, Nigeria, Senegal and Madagascar reached so far. The results from this data collection, are available on a live public dashboard, co-sponsored by REGMIFA, for benefit of all actors in the microfinance industry. The dashboard currently includes data from 10 financial institutions in 8 countries (including REGMIFA’s PLIs), and will continue to be updated as new data is collected.
Interim results:
92% 88%are in a worse financial have seen their income decreasesituation because of the pandemic.
53% 48%describe their loan have seen their foodrepayments as a burden consumption decrease

As an impact investor, SIFEM commits to maximising the development effects linked to its investment decisions. SIFEM selects each investment based on a bottom-up impact thesis and customises the measurement of indicators and the monitoring to match that thesis. Its result measurement system is in line with the 2030 Agenda for Sustainable Development adopted by the United Nations in 2015.
SIFEM’s investments have supported the creation and maintenance of over 830,000 jobs worldwide. SIFEM also targets investments that contribute to climate change mitigation and to fostering women’s economic empowerment. To date, SIFEM has invested around 135 million francs in climate finance projects, including renewable energies and energy-efficiency solutions for SMEs. Also, around 40 per cent of the employees in SIFEM portfolio companies are women.
In addition, SIFEM’s investments contribute to broadening the local tax base – with USD 1.860 bn in corporate and other taxes paid by underlying portfolio companies (2018) – and help leverage private investments for development. For each dollar invested by SIFEM, there were USD 6 by private investments (2018).
SIFEM works with financial intermediaries not only to deliver relevant financing solutions, but also to add value to local businesses. Its role goes beyond the provision of long-term finance. SIFEM seeks to strengthen the capacity of financial intermediaries to manage environmental, social, and governance risks (ESG) at the level of their underlying portfolios.
FUND MANAGER KPIs Incorporation year : 2011
Headquarters : Bern, Switzerland
Nb. of offices : 1Nb. of employees : 28 (obviam AG)
Total Active Commitments (USD) : 839 million
Total Assets (CHF) : 643 million Total Investments to date (USD) : 1.059 billion
Nb. of active projects : 97 (80 funds and 17
financial institutions)
Nb. of investees : 500+ Geography : 70+ countries
Impact sectors : Broadly diversified
portfolio, including industry &
manufacturing, infrastructure, financial services, energy, and agriculture
Internal Rate of Return : 6.0 %
(31 Dec 2019)
Total Value over Paid-In : 124 %
INVESTING FOR IMPACT
The Swiss Investment Fund for Emerging Markets (SIFEM) is the Development Finance Institution (DFI) of the Swiss Confederation. SIFEM promotes long-term, sustainable, and broad-based economic growth in developing countries and emerging markets by providing financial support to commercially viable small and medium-sized companies (SMEs) as well as fast-growing enterprises. This helps create and secure more and better jobs and reduce poverty while also contributing towards the integration of these countries into the global economic system.
SIFEM invests through nearly 100 financial intermediaries by investing indirectly in local or regional risk capital funds and by providing credit lines to local banks and other financial institutions, often in collaboration with other
IT’S ABOUT MORE THAN PROVIDING FINANCING
DFIs and private investors. In contrast to other DFIs, SIFEM has a stronger exposure to private equity as 66.5 per cent (31 Dec 2019) of its portfolio are equity and quasi-equity instruments, and around 33.5 per cent (31 Dec 2019) are current income earning assets.
EXAMPLE: INVESTING IN UKRAINE
Among SIFEM's more than 500 investeecompanies are two companies in the Ukraine: Ruta, a manufacturer of tissue products, and Sperco, a pharmaceutical producer of mainly cold and cough medicines. The Europe Virgin Fund (EVF), to which SIFEM contributed USD 7 m in 2010, supported Ruta and Sperco with growth capital. EVP is managed by 4i Capital Partners, a Ukraine-based private equity investment company.
2010Investmentyear
USD 7 MIOFundinvestment
376Employees(Ruta)
432Employees(Sperco)
For further information - www.sifem.ch


HOW WE INVEST DEFINES THE WORLD WE WANT TO LIVE IN
Triodos Investment Management is a globally recognised leader in impact investing. As an impact investor we serve as a catalyst in sectors that are key in the transition to a world that is fairer, more sustainable and humane.
We have built up in-depth knowledge in sectors such as Energy & Climate, Financial Inclusion and Sustainable Food & Agriculture. We also invest in listed companies that materially contribute to the transition toward a sustainable society.
Triodos Investment Management is a wholly owned subsidiary of Triodos Bank NV, a leading expert in sustainable banking.
THE TRUE PURPOSE OF INVESTING IS TO SERVE THE REAL NEEDS OF SOCIETY
We believe how we invest defines the world we want to live in, recognising the instrumental role and creative power of capital when used consciously. As a financial institution, we use money as a driving force towards a society that is humane, ecologically balanced and works for the benefit of all.
For more than 30 years, we have offered impact investment solutions that connect investors who want to make money work for positive change with innovative entrepreneurs and sustainable businesses doing just that.
Our Financial Inclusion strategy
Through our Financial Inclusion strategy, we finance values-driven organisations that use financial services to deliver sustainable development. We are active in over 50 countries in Asia, Africa, Latin America, Eastern and Central Europe, and the Caucasus, financing 100+ institutions.
Our investment focus ranges from microfinance institutions and SME banks to Fintech companies and financial institutions that address specific basic needs, such as affordable housing and education. We also look for opportunities that tie together financial services, renewable energy and sustainable agriculture.
Our financial instruments are tailored to the long-term needs of the institutions and based on their business model and the stage of development. They range from equity and mezzanine finance to (senior) debt.
Impact highlights
We manage 4 financial inclusion funds with close to EUR 1 billion AUM, offering investment opportunities for private and institutional investors. The impact created by our investment portfolio include the following:
19.1M 75% borrowers reached female borrowers
63% 19.2Mrural borrowers savers reached
20 equity investments with active board membership.
109 45 financial institution countries
www.triodos-im.com
FUND MANAGER KPIs
Headquarters : Zeist, the NetherlandsNb. of staff (FTE) : 185
AuM (USD) : 5.8 billion (30 June 2020)Nb. of direct investments : 750+
Main geography of investment : global Impact strategies : energy transition,
food transition and an inclusive society Main asset classes : debt, mezzanine
finance and (senior) debt

Deetken ImpactMake an Impact with your InvestmentDeetken ImpactMake an Impact with your Investment
Ilu Women’s Empowerment Fund Caribbean Basin Sustainable Energy Fund (CABEF)
Honduras Renewable Energy Financing Facility (H-REFF)
Debt investments that advance gender equality & women’s
economic empowerment
Joint Venture with Pro Mujer, a mission-driven
women’s development organization
$26MM committed AUM
Equity and mezzanine investments in renewable
energy and energy efficiency
Emphasis on the Caribbean
Co-invests with H-REFF
$27MM committed AUM
Equity and mezzanine investments in renewable
energy and energy efficiency
Emphasis on Central America and Honduras
Co-invests with CABEF
$33MM committed AUM
Deetken Impact supports the Sustainable Development Goals. Specifically, we evaluate our investment opportunities and our portfolio companies
based on their contribution to these goals.
ACTIAM FINANCIAL INCLUSION STRATEGY
Inception Date : 2014Asset Class : Private Debt
AuM of Strategy (EUR) : 130 millionRegion(s) of Investment : Global
FINANCIAL INCLUSION THROUGH A CLIENT-CENTRIC APPROACH
ACTIAM is a trendsetter when it comes to impact investing, making investment opportunities scalable in high-impact themes like financial inclusion and energy transition. With a track record of over 12 years in impact investing, initially built through institutional microfinance funds in 2007 & 2008, its team of eight professionals demonstrates a sound performance. ACTIAM manages approximately ¤ 60 billion in assets for insurance companies, pension funds, banks and intermediaries.
Investment StrategyThe Strategy provides finance to micro, small and medium enterprises in developing and emerging economies by providing senior debt and sub-debt capital to Financial Institutions. By combining the sourcing capabilities and track record of the Strategy Manager and the Investment Advisor, the Strategy aims to improve access to finance for low-income people and potentially realize above-average returns in an inefficient market. The Strategy measures and reports on several key indicators on an annual basis, tracking the social and environmental performance of investees. Indicators used are in line with market standards. The realized annualized net return since its 2014 inception is 3.7 % (as of 30 June 2020).
The team, get in touch! Sinisa Vukic, Senior Portfolio Manager
[email protected] Nikkie Pelzer, Senior Investment Analyst
Investment Highlights & Differentiation A globally diversified fixed income portfolio with a buy-and-hold strategy in private loans to financial inclusion institutions with an objective to contribute to the access of finance and sustainable economic growth while providing market-based returns.
A governance structure whereby the Investment Advisor, Developing World Markets (DWM), is responsible for the deal sourcing and ACTIAM is responsible for the portfolio management of the Strategy. This prevents deal blindness, builds on the local presence of the investment advisor, addresses conflict of interests, and adds a layer of ‘top-down’ appraisals uncommon in the microfinance sector.
Measurable positive impact through enhanced credit strength of financial inclusion institutions.
Focus on cost control and limiting the number and the size of defaults.
Limited liquidity, monthly on a best effort basis
For more than thirty years, SEAF has been a leader in the impact investing space in emerging and frontier markets. Our mission –To Impact Lives and Communities in Underserved Markets Through Entrepreneur-Focused Investment – is exemplified through the cumulative efforts of our teams across the globe.
SEAF has launched and managed forty investment funds with US$ 1.2 billion, all focused on providing entrepreneurs with the growth capital and capacity building resources needed to bring positive change to their communities. SEAF has managed a diverse range of funds with varied performance objectives and risks, largely through single-country funds with individual mandates spanning the spectrum from predominantly return-focused to mission-driven developmental impact focused. Through these funds, more than US$ 560 million has been invested in small and medium-sized enterprises (SMEs), catalyzing economic growth, job creation and community development across more than thirty countries.
Impact is at the core of our work at SEAF. SEAF is a signatory to the Operating Principles for Impact Management, indicative of the intentional impact SEAF seeks to create through its investments. Quality jobs, community growth and Gender Equality are central to SEAF’s mission as they have been for thirty years.
52k JobsCreated and Sustained
3x GrowthPortfolio CompanyRevenues
5,000+Local SuppliersEngaged
FEFISOL is a social investor targeting small MFIs and agricultural entities (AEs) across the African continent. It was launched by SIDI & Alterfin in 2011, with the support of European DFIs and other committed shareholders. By offering adapted financial services and tailored technical assistance, FEFISOL aims at supporting microentrepreneurs in rural areas; contributing to the development of sustainable agricultural practices and fighting against socio-economic inequalities.
ResultsAfter 9 years of activities, the fund was able to finance over 90 clients in 25 countries. 93% of the portfolio was invested in Sub-Saharan Africa and 60% in countries with a low ranking on the Human Development Index (HDI). FEFISOL disbursed 85M EUR in loans, of which 50% were dedicated to AEs, almost all certified either organic and/or fairtrade. At the end of year 9, FEFISOL indirectly reached 1.7M rural end beneficiaries.
Added valueWith an average loan for MFIs at 509K EUR and an average loan for AEs at 220K EUR, FEFISOL really
FEFISOL KPls
Impact sector : Microfinance & AgricultureRegional focus : Africa
Total assets (USD) : 34 millionNb. of investees : 90
Investor-type : DFIs, Social Banks, NGOs, Foundations
Average loan to MFIs (EUR) : 509,000Average loan to AEs (EUR) : 220,000
Percentage of AE financed that are certified either organic and/or fairtrade : 93%
Average loan to end beneficiary from MFIs financed (EUR) : 500
Women end beneficiaries : 54%
targets the missing middle. As to reply to its clients’ needs, the fund was able to invest 70% of its loan portfolio in local currencies and provide technical assistance to 49 clients for a total committed budget of 2.2M EUR.
FEFISOL coming to liquidation in 2021, SIDI and Alterfin are very enthusiastic in renewing this fund, with a stronger social and environmental focus!
SEAF KPIs
Asset class: Private EquityImpact sector: SDGs, Gender Lens, ESG
Regional focus: GlobalAUM (USD): 300 million
Nb. of investees: 40Currency strategy: Non-hedge
Investor-type: Diverse

SEEDSTARS GROUP
Headquartered in SwitzerlandOperating since 2012
13 offices and 81 team members85+ emerging markets covered
SEEDSTARS INTERNATIONAL
Fund 1 operating since 2017Global emerging markets59 portfolio companies97% active or acquired
54% raised follow-on capital
Seedstars International is an emerging market VC fund focused on impactful seed stage tech companies. The Fund has invested in 59 entities in 28 countries covering key sectors such as financial services, health, education and agriculture. The team invests in batches of 10-15 ventures that are supported through an intense three month program focused on growth and fundraising. 54% of portfolio companies have already gone on to raise follow-on capital from later stage investors including Omidyar, Sequoia and YCombinator. As one of the few reputable institutional names available to early stage founders in emerging markets, Seedstars will continue to strengthen this positioning in order to support more high growth ventures that drive economic, social and environmental change.
Leveraging the Seedstars Community The Fund is part of the Seedstars group, founded in 2012 in Switzerland. The group has been running the largest startup competition in emerging markets since 2013, the Seedstars World Competition, that thanks to its strong brand presence and access to local communities of venture partners and alumni, gathers over 7,000 deals in over 85 countries each year, Seedstars group has also invested in a
strong local presence with 13 offices and a team of 81 people actively participating in the local entrepreneurial ecosystems and connecting with 700+ active mentors and 1200+ active co-investors. Additionally, Seedstars has developed over 130 training programs to educate its founder on topics from growth and revenue, fundraising, international expansion, talent and management.
TriLlinc believes that the key to economic growth and environmental sustainability is a thriving middle class, which is driven by successful “responsible” small and medium-sized businesses. By investing in “responsible” companies which are willing to be held accountable, those companies can create jobs, pay fair and increasing wages, and raise the tax base for the community, resulting in the potential to improve local infrastructure, education, and healthcare systems, among others.
TriLinc’s Private Debt Plus® investment strategy, has provided more than $1.3 billion in trade finance, term loan, and short-term financing to 95 small and mid-sized businesses in 38 different developing economies supporting more than 42,000 permanent jobs while delivering consistent returns to our investors.
TO LEARN MORE VISIT WWW.TRILINCGLOBAL.COM
Target Geography – Latin America, Southeast Asia, Sub-Saharan Africa, Emerging Europe, and United StatesTarget Companies – Private, Middle Market Growth Stage BusinessesFund Level Impact Focus – Economic development through providing access to finance for underserved SMEs Borrower Level Impact Focus – Sustainable companies with an intent to create positive, measurable impact in their communities and willingness to track and report on that impact. Generally, borrower impact is focused on Building Sustainable Communities, Strengthening the Workforce and Enhancing Global Competitiveness.
All data as of 6/30 2020 unless otherwise indicated. This information is for general purposes only and does not represent a recommendation or offer of any particular security, strategy, or investment. Such an offer may only be made by means of a private placement memorandum. TriLinc Global LLC (“TLG”) is a holding company and an impact fund sponsor founded in 2008. TriLinc Advisors, LLC (“TLA”) and TriLinc Global Advisors, LLC (“TLGA”) are wholly-owned subsidiaries of TLG and are SEC registered investment advisors. Unless otherwise noted, TLG, TLA and TLGA are collectively referred throughout this document as “TriLinc.” Securities offered through CommonGood Securities, LLC, Member FINRA/SIPC. Regulation and membership do not indicate a certain level of skill, training, or endorsement by the SEC, FINRA, or SIPC.
INVESTMENT & IMPACT STRATEGY

WATEREQUITY FUNDS
Asset class : Private DebtImpact sector : Water and SanitationRegional focus : Emerging Markets
Total assets (USD) : 60 millionNb. of investees : 30
Currency strategy : Both hedged and unhedged
Investor-type : Accredited
Realize untapped opportunity.
WaterEquity is the first asset manager to provide investors competitive market returns by exclusively focusing on solving the most urgent issue of our time - the global water and climate crisis. Led by Dr. Paul O’Connell who brings 20 years of institutional asset management experience, the success of WaterEquity is built on decades of experience investing in water and sanitation in emerging markets, delivering proven social and financial returns.
Fund management excellence. Proven capability in emerging markets.
WaterEquity identifies private lending opportunities in water and sanitation that offer attractive returns, low to moderate credit risk, verifiable social impact, and true ESG investments. WaterEquity funds provide opportunities for investors to make responsible and sustainable investment choices that will reduce the impacts of climate change and gender inequality.
VOX CAPITAL KPls
Asset class : Venture CapitalImpact sector : Health, Education, Financial
Services, Agriculture, EnvironmentalRegional focus : Brazil (main focus)
and Latin AmericaAUM (USD) : 40 million
Nb. of investees : 10 activesInvestor-type : HNWI, family offices,
foundations, government
Vox was founded in 2009, with the purpose of creating a world where businesses can generate positive social transformations.
We are a pioneer investment management firm, offering market-competitive financial solutions that improve the human experience and nurture the planet, by integrating impact to risk and return in all our investment decisions. We believe the entire flow of money has the potential to generate abundance, equality, and positive socio-environmental transformations, ultimately improving our human experience while nurturing the planet.
We invest in businesses that improve current ways of providing basic services in order to reduce social inequalities
Since 2009, we invested in 27 companies from different industries, focusing on startups that help improve the access of the Brazilian population to basic needs, such as education, healthcare, and financial services.
Money is a powerful instrument for change
Through our active portfolio companies, we: Impacted 13,7 million people in 2019 only in practically all +5000 municipalities in Brazil
Provided financial inclusion to +11 million people in Brazil
Equipped 166 hospitals, 281 clinics and 1,2 thousand ambulances caring for 6,1 million patients
Trained 117 thousand medical students. Together, our companies have grown 378% from June to August in 2020 versus same period last year.
Creating Positive Social Impact.
WaterEquity funds have deployed $68M through 30 debt investments across three countries (India, Indonesia, and Cambodia).
Accelerating Safe Water and Sanitation Access: 1.6M people reached with safe water or sanitation.
Building Climate Change Resilience: Our investments enable emerging consumers to access water at times of scarcity and reduce water contamination during floods.
Promoting Gender Equality: 93% of the people directly impacted by our investments are women.
We invite accredited investors to learn more by visiting our website at WaterEquity.org.


APPENDICES

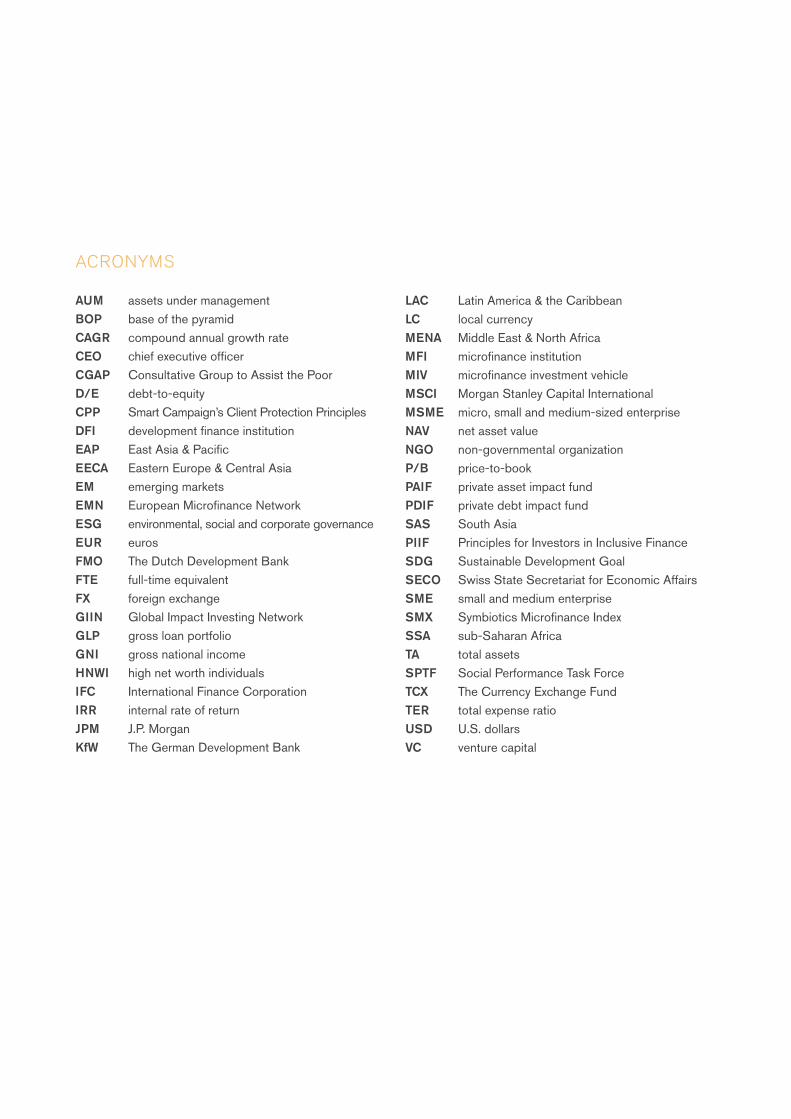
AUM assets under managementBOP base of the pyramidCAGR compound annual growth rateCEO chief executive officerCGAP Consultative Group to Assist the PoorD/E debt-to-equityCPP Smart Campaign’s Client Protection PrinciplesDFI development finance institutionEAP East Asia & PacificEECA Eastern Europe & Central AsiaEM emerging marketsEMN European Microfinance NetworkESG environmental, social and corporate governanceEUR eurosFMO The Dutch Development BankFTE full-time equivalentFX foreign exchangeGIIN Global Impact Investing NetworkGLP gross loan portfolioGNI gross national incomeHNWI high net worth individualsIFC International Finance CorporationIRR internal rate of returnJPM J.P. MorganKfW The German Development Bank
LAC Latin America & the CaribbeanLC local currencyMENA Middle East & North AfricaMFI microfinance institutionMIV microfinance investment vehicleMSCI Morgan Stanley Capital InternationalMSME micro, small and medium-sized enterpriseNAV net asset valueNGO non-governmental organizationP/B price-to-bookPAIF private asset impact fundPDIF private debt impact fundSAS South AsiaPIIF Principles for Investors in Inclusive FinanceSDG Sustainable Development GoalSECO Swiss State Secretariat for Economic AffairsSME small and medium enterpriseSMX Symbiotics Microfinance IndexSSA sub-Saharan AfricaTA total assetsSPTF Social Performance Task ForceTCX The Currency Exchange FundTER total expense ratioUSD U.S. dollarsVC venture capital
ACRONYMS

Figure 1 Investment universe p. 15Figure 2 Primary SDGs by impact sector p. 19Figure 3 Sample size and representativeness p. 20Figure 4 Investment value chain p. 23Figure 5 Top 10 fund investment management/advisory countries p. 25Figure 6 Top 10 fund investment managers p. 25Figure 7 Principles, guidelines and standards p. 26Figure 8 Organization memberships p. 26Figure 9 Inception and closing dates p. 29Figure 10 Domicile p. 30Figure 11 Types of public support p. 32Figure 12 Public sponsors p. 32Figure 13 Average size p. 33Figure 14 Historical average size of Microfinance funds p. 33Figure 15 Growth by primary asset class p. 34Figure 16 Growth by primary impact sector p. 34Figure 17 Historical growth of Microfinance funds p. 35Figure 18 Asset composition by primary asset class p. 36Figure 19 Paid-in capital and uncalled commitments by primary impact sector p. 36Figure 20 Historical cash levels of Microfinance funds p. 37Figure 21 D/E ratio of Leveraged funds by primary impact sector p. 39Figure 22 Historical D/E ratio of Leveraged Microfinance funds p. 39Figure 23 Outstanding volume by investment instrument p. 40Figure 24 Seniority level of private debt p. 40Figure 25 Preferred and common shareholding p. 40Figure 26 Investment instruments by primary impact sector p. 41Figure 27 Average investee exposure by investment instrument p. 41Figure 28 Outstanding volume by impact sector p. 42Figure 29 Portfolio breakdown by impact sector p. 42Figure 30 Historical outstanding portfolio of Microfinance funds p. 43Figure 31 Average investee exposure by impact sector p. 43Figure 32 Outstanding volume by investee type p. 44Figure 33 Investee types by primary impact sector p. 45Figure 34 Average investee exposure by investee type p. 45Figure 35 Historical average investee exposure of Microfinance funds p. 46Figure 36 Outstanding volume by region p. 47Figure 37 Regional breakdown by primary asset class p. 47Figure 38 Regional breakdown by primary impact sector p. 48
INDEX OF FIGURES
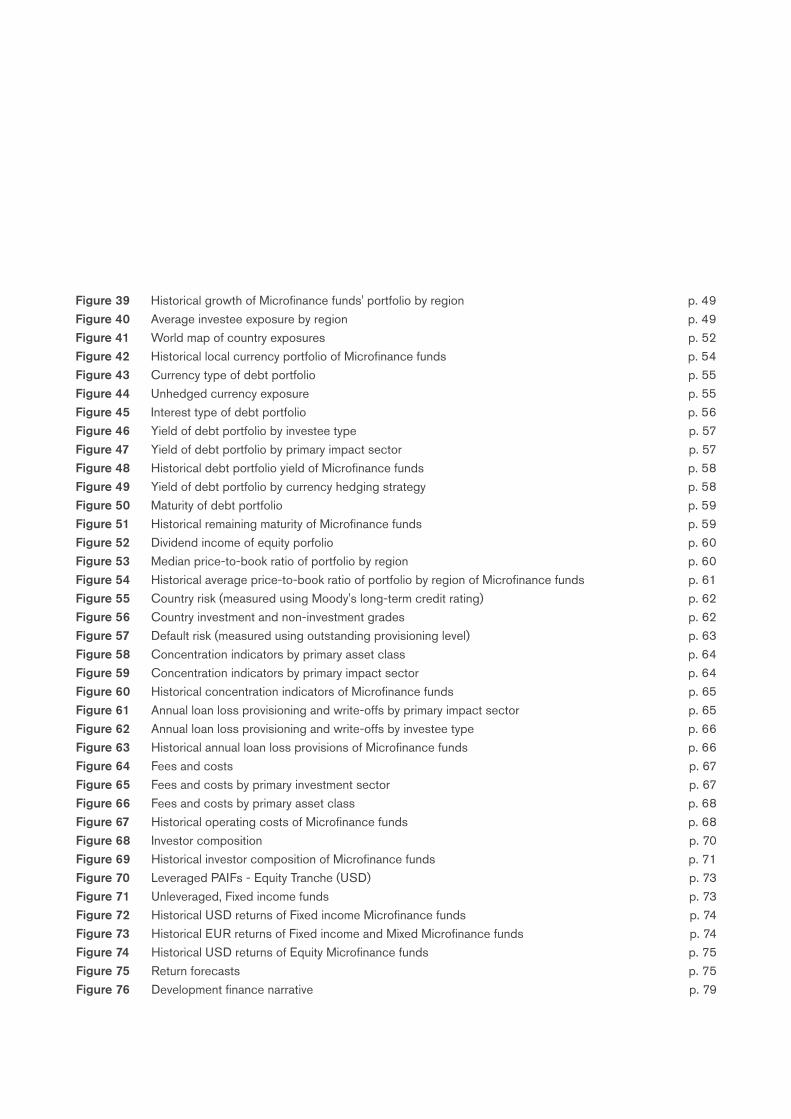
Figure 39 Historical growth of Microfinance funds' portfolio by region p. 49Figure 40 Average investee exposure by region p. 49Figure 41 World map of country exposures p. 52Figure 42 Historical local currency portfolio of Microfinance funds p. 54Figure 43 Currency type of debt portfolio p. 55Figure 44 Unhedged currency exposure p. 55Figure 45 Interest type of debt portfolio p. 56Figure 46 Yield of debt portfolio by investee type p. 57Figure 47 Yield of debt portfolio by primary impact sector p. 57Figure 48 Historical debt portfolio yield of Microfinance funds p. 58Figure 49 Yield of debt portfolio by currency hedging strategy p. 58Figure 50 Maturity of debt portfolio p. 59Figure 51 Historical remaining maturity of Microfinance funds p. 59Figure 52 Dividend income of equity porfolio p. 60Figure 53 Median price-to-book ratio of portfolio by region p. 60Figure 54 Historical average price-to-book ratio of portfolio by region of Microfinance funds p. 61Figure 55 Country risk (measured using Moody's long-term credit rating) p. 62Figure 56 Country investment and non-investment grades p. 62Figure 57 Default risk (measured using outstanding provisioning level) p. 63Figure 58 Concentration indicators by primary asset class p. 64Figure 59 Concentration indicators by primary impact sector p. 64Figure 60 Historical concentration indicators of Microfinance funds p. 65Figure 61 Annual loan loss provisioning and write-offs by primary impact sector p. 65Figure 62 Annual loan loss provisioning and write-offs by investee type p. 66Figure 63 Historical annual loan loss provisions of Microfinance funds p. 66Figure 64 Fees and costs p. 67Figure 65 Fees and costs by primary investment sector p. 67Figure 66 Fees and costs by primary asset class p. 68Figure 67 Historical operating costs of Microfinance funds p. 68Figure 68 Investor composition p. 70Figure 69 Historical investor composition of Microfinance funds p. 71Figure 70 Leveraged PAIFs - Equity Tranche (USD) p. 73Figure 71 Unleveraged, Fixed income funds p. 73Figure 72 Historical USD returns of Fixed income Microfinance funds p. 74Figure 73 Historical EUR returns of Fixed income and Mixed Microfinance funds p. 74Figure 74 Historical USD returns of Equity Microfinance funds p. 75Figure 75 Return forecasts p. 75Figure 76 Development finance narrative p. 79

Figure 77 Mapping of funds' social/environmental goals against the SDGs p. 80Figure 78 SDG reporting to investors p. 80Figure 79 Impact measurement/assessment tools used for SDG mapping p. 81Figure 80 Targeted SDGs p. 82Figure 81 Climate & Energy subsectors financed p. 83Figure 82 Agriculture value chain actors financed p. 83Figure 83 Education actors financed p. 84Figure 84 Housing, Water & Communities subsectors financed p. 84Figure 85 Activity sector of MSMEs financed by Microfinance funds p. 85Figure 86 Activity sector of SMEs financed by SME development funds p. 85Figure 87 Integration of ESG screening into investment decision process p. 86Figure 88 ESG reporting to investors p. 86Figure 89 Use of preferential terms for investees demonstrating strong ESG commitment p. 86Figure 90 Types of preferential terms p. 87Figure 91 Inclusion of social or environmental covenants / undertakings within investment agreements p. 87Figure 92 Types of social or environmental covenants / undertakings p. 87Figure 93 Country exposure by income level p. 88Figure 94 GNI per capita p. 89Figure 95 Number of people employed by investees p. 90Figure 96 Gender profile of investees' employees p. 90Figure 97 Historical profile of Microfinance funds' end-borrowers p. 90Figure 98 Historical number of end borrowers and average loan size p. 91Figure 99 Historical performance of the SMX-MIV USD Debt Index since inception p. 95Figure 100 One-year performance of the SMX-MIV USD Debt Index p. 96Figure 101 Contextualizing the economic impact of the pandemic on Fixed income Microfinance funds p. 96

Table 1 Inclusion criteria p. 16Table 2 Impact sector classification p. 18Table 3 Defining the investment universe and value chain p. 24Table 4 Sample matrix - Primary asset class and vehicle term p. 29Table 5 Sample matrix - Primary investment sector and asset class p. 31Table 6 Fund type p. 31Table 7 Leveraging strategy p. 38Table 8 Number of investees p. 44Table 9 Top 10 country exposures by primary asset class p. 51Table 10 Top 10 country exposures by primary impact sector p. 51Table 11 Median sovereign rating p. 63Table 12 Subscription and redemption frequencies for open-ended funds p. 69Table 13 Yearly funding growth by investor type p. 71Table 14 Financial returns p. 72Table 15 Comparing the performance and volatility of Fixed income Microfinance funds to p. 97 mainstream asset classes
INDEX OF TABLES
4IP GroupAavishkaar CapitalAccionACTIAM Impact InvestingAdenia PartnersAlphaMundi GroupAlterfinAsia Africa Investment & ConsultingBamboo Capital PartnersBank Im Bistum EssenBIM InvestmentsBlueOrchardBOPA InvestmentsCaspian AdvisorsCordaid Investment ManagementC-Quadrat Asset ManagementCreation Investments Capital ManagementDeetken ImpactDéveloppement International Desjardins (DID)DWSElevar EquityEnabling QapitalFinance in MotionFOUNTFS Impact FinanceFundoGarden ImpactGAWA Capital Grameen Credit Agricole FoundationGroFin CapitalImpact Finance Management S.A.Incofin IMInnpactINOKS Capital
InpulseInspired EvolutionInvest in Visions GmbHInvesting for DevelopmentInvestisseurs & Partenaires (I&P)iungo capitalMaj InvestMatch Maker Fund ManagementMicroVestNetri Fundación PrivadaNMINN Investment PartnersNorsad FinanceOikocreditOmnivore Capital Management AdvisorsOmtrixOpen Road AlliancePhileaPrivium Fund ManagementresponsAbility Investments AGSEAFSEB Investment Management ABSeedstarsSIDISIMA FundsSymbioticsTriLinc Global, LLCTriodos Investment ManagementTriple Jump B.V.Vox CapitalWaterEquityWorking Capital for Community Needs, Inc.WWB Asset Management
LIST OF PARTICIPANTS

