privacy-preserving overgrid: secure data collection for
TRANSCRIPT
sensors
Article
Privacy-Preserving Overgrid: Secure Data Collectionfor the Smart Grid
Daniele Croce 1,2,* , Fabrizio Giuliano 1 , Ilenia Tinnirello 1 and and Laura Giarré 3
1 Department of Engineering, University of Palermo, Viale delle Scienze, ed. 9, 90128 Palermo, Italy;[email protected] (F.G.); [email protected] (I.T.)
2 The Department of Computer Science, University of Rome “La Sapienza”, Via Salaria, 113, 00198 Rome, Italy3 Department of Engineering, University of Modena e Reggio Emilia, Via P. Vivarelli, 10, 41125 Modena, Italy;
[email protected]* Correspondence: [email protected] or [email protected]
Received: 13 March 2020; Accepted: 13 April 2020; Published: 16 April 2020�����������������
Abstract: In this paper, we present a privacy-preserving scheme for Overgrid, a fully distributedpeer-to-peer (P2P) architecture designed to automatically control and implement distributed DemandResponse (DR) schemes in a community of smart buildings with energy generation and storagecapabilities. To monitor the power consumption of the buildings, while respecting the privacy of theusers, we extend our previous Overgrid algorithms to provide privacy preserving data aggregation(PP-Overgrid). This new technique combines a distributed data aggregation scheme with the SecureMulti-Party Computation paradigm. First, we use the energy profiles of hundreds of buildings,classifying the amount of “flexible” energy consumption, i.e., the quota which could be potentiallyexploited for DR programs. Second, we consider renewable energy sources and apply the DR schemeto match the flexible consumption with the available energy. Finally, to show the feasibility of ourapproach, we validate the PP-Overgrid algorithm in simulation for a large network of smart buildings.
Keywords: privacy; secret sharing; distributed; peer to peer; smart grid; overlay networks; P2P;gossiping; overgrid
1. Introduction
Today, Internet of Things (IoT) scenarios where widespread technology is constantly monitoringuser activities is crucial to develop algorithms for data collection, monitoring, and control thatare guaranteeing the user privacy. All data regarding geolocation, power consumption, visitedwebsites, music, and movie downloads can undoubtedly reveal sensitive information about users’habits. Exploiting the IoT paradigm, a smart grid is an innovative energy distribution network able toimprove the conventional electrical grid so to be more reliable, cooperative, responsive, and economical.The smart grid technology improves two-way communications between utility companies andcustomers, and exploits near real-time data to make cost-effective and environment-friendly decisions.In the smart grid scenario, traditional and renewable sources are integrated and require an incrementof the power system flexibility. Therefore, the control of location-dependent power demand has beentackled with demand response (DR) approaches. DR refers to the possibility of end users to changetheir consumption patterns in response to a dynamic price signal, or (called load control) to thepossibility of directly switching or tuning specific user appliances off during peak demand.
In this paper, we consider DR schemes for a community of smart buildings, aiming at preservingthe privacy related to the single user power consumption. The key idea is to extend Overgrid [1,2],a Peer-to-Peer (P2P)-based control scheme for distributed DR, to control a community of userswith power consumption comparable to industrial utilities, but without dealing directly with the
Sensors 2020, 20, 2249; doi:10.3390/s20082249 www.mdpi.com/journal/sensors

Sensors 2020, 20, 2249 2 of 18
single residential user (whose contribution in terms of load reduction is limited anyway). Instead,we introduce Privacy-Preserving Overgrid (PP-Overgrid) which aims at controlling a group of smartbuildings as a whole, protecting the privacy of the users through an innovative Secure Multi-PartyComputation mechanism.
We assume that such clusters of buildings are equipped with Internet connectivity and a localcommunication network to control the electric smart appliances and sensors. We refer to the communityof buildings participating to the load control program as an Overgrid. In the present paper, we extendprevious results on Overgrid in [1,2] by introducing a mechanism that limits the shared knowledgeabout user habits to preserve their privacy. The main contributions of the paper are:
• We design PP-Overgrid, a fully distributed P2P architecture able to aggregate and monitor thepower consumption of the nodes, while respecting the privacy of the users. The architecture isbased on a combination of P2P aggregation algorithm and secure multi-party computation.
• We analyzed the energy profiles of hundreds of real buildings, to distinguish “flexible” energyconsumption, useful to be exploited for DR programs.
• Considering real data traces of renewable energy sources, we validate the PP-Overgrid algorithmin simulation for a large network of smart buildings, applying a statistical control of the loads.
Hereafter, we report some Background and Related Work regarding Distribute Load Control,Overlay Networks, and Privacy Preserving schemes. In Section 3, the Overgrid architecture and the P2Pprotocol are described, together with an aggregation technique. In Section 4, the privacy-preservinggeneralization is presented and analyzed and finally some experiments and simulations studies arereported in Section 5.
2. Background and Related Work
In this section, we review the state-of-the-art solutions for load control and P2P Networks. We alsodescribe some distributed privacy-preserving aggregation schemes, relevant to the understanding ofthe proposed PP-Overgrid.
2.1. Distributed Load Control
Operated at different levels of the grid, load control can alleviate voltage regulation problems(primary level) or matching desired consumption profiles (secondary/tertiary level). Direct LoadControl (DLC), for example, is a specific mechanism of demand side management that allowselectric utilities to turn specific users’ appliances off during peak demand periods and critical events.Most of the current DLC programs work on thermostatic loads [3,4], such as air conditioners andheating systems because they allow a fine-tuning regulation of power demand.
Multiple load typologies, including interruptible or deferrable loads, have been considered forresponding to different frequency components of the regulation signal. For example, in [5], it has beenshown that the pool pump control can work at a time scale between the few minutes characterizingthe typical control interval of thermostatic loads, and the few hours characterizing the deferral ofelectric vehicles charging. Internet connections available in most households may enable more flexibleprograms managed by energy suppliers or third parties [6]. Other solutions are considering the use ofenhanced smart plugs which consider user habits and consumption profiles to optimize controllableresources [7].
For a given demand, control signals or control decisions can be programmed by using analyticaltools, such as queuing models [8] that have been widely adopted for teletraffic engineering [9].Indeed, loads on the electrical grid are multiplexed at different aggregation levels (distributiontransformers, primary station, price zone), similarly to traffic from data sources multiplexed ata router of a different hierarchical level. In [9], teletraffic analogy has been exploited for sizingthe power distribution network as a function of the statistical characterization of the loads, while, in [8],the queuing models are used to study an optimal scheduling of energy suppliers working on renewable

Sensors 2020, 20, 2249 3 of 18
sources, without knowing the statistics of the energy production and demand processes. Queuingtheory is also used in [10] and [11] for sizing the population of customers subscribing a DLC programunder a given maximum tolerable delay for activating the controlled appliances.
2.2. Overlay Networks
Overlay networks are particular communication networks built on top of an existing network.With the advent of Internet and peer-to-peer (P2P) networks, overlay networks have attracted muchattention for their flexibility and scalability. These networks are a great tool to create applicationsharing and distribution of large-scale data, multicast application layer services, distribution ofOn Demand video contents and video streaming, etc. Overlay networks are efficiently used toprovide data redundancy, data identification, data search, data persistence guarantees, authentication,and anonymization. They also offer efficient, scalable and robust routing architectures, combinedwith fault tolerance, load balancing, and explicit geographical knowledge. Since energy systemsare intrinsically distributed, the mapping between the energy grid and the network overlay isa straightforward and promising approach.
A particular case of overlay networks are P2P networks, in which the nodes, the so-called peers,all have equivalent functionality. Each pair of nodes can communicate directly or via other peersusing routing protocols, and there is no centralized control or hierarchical organization. Generally,P2P networks require no special administrative procedures to be realized and therefore can easilygrow both in terms of nodes and data. They are particularly robust to errors and failures and haveexcellent performance thanks to their decentralized nature.
There are two main classes of P2P overlay networks: structured and unstructured. In structuredoverlay networks, the network topology is rigidly controlled and the content is stored in specificlocations of the network (not on random nodes) so that data search is more efficient. StructuredP2P networks usually use distributed hash tables (DHTs) to organize data allocation. Unstructuredoverlays, instead, are based on looser protocols, where nodes do not have a priori knowledge ofthe topology, and use flooding mechanisms with limited range to search for content on the network.These mechanisms are highly efficient to locate popular and replicated content but are less efficientin contexts in which the data are sparse. Moreover, the load of each node grows linearly with thenumber of queries. Despite this, unstructured overlay networks suffer much less overhead than thosebased on DHTs. As a result, today they are more prevalent on the Internet than the former. For moreinformation on P2P networks, see [12].
A particular use case of overlay networks is the aggregation of distributed data. Data aggregationalgorithms determine global properties in the network that can be used in other applications.Examples of aggregate functions are SUM, AVERAGE, MIN, MAX, quantile, etc. In recentyears, various algorithms for distributed computation of these functions have been developed,with different advantages and disadvantages in terms of accuracy, robustness, computationalcomplexity, and communication overhead, as discussed in [13]. As we will explain, we use suchalgorithms in the implementation of Overgrid: in particular, we exploit the Flow Updating [14]algorithm to monitor the average energy consumption of the nodes in the grid. The Flow Updatingalgorithm is an efficient scheme that has been proven to be fault-tolerant to both message loss andnode crashes, and its convergence speed has been studied in [15].
2.3. Privacy-Preserving Schemes
Several solutions exist to perform privacy-preserving data mining [16]. Thus far, two mainapproaches have been proposed: modifying the data before transferring it to the data aggregator(in such a way that the total results are not compromised) or relying on groups of users thatmust work together to provide aggregate results. Data modifications can lead to mining errors ifrandom noise is used [17] or may become complex when using homomorphic data encryption [18].Instead, in PP-Overgrid, we employ the second approach based on Multi-Party Computation (MPC)

Sensors 2020, 20, 2249 4 of 18
protocols [19]. These algorithms were developed for aggregating information collected from multipleusers, without disclosing any information of the single users. Usually, multi-party computingarchitectures rely on multiple (independent) nodes that deal with randomized versions of the userinformation provided by the input peers. Several data distribution solutions between nodes exist,based on logical [20] or arithmetic circuits [21] or linear secret sharing [22]. In particular, linear secretsharing mechanisms e.g., Sharemind [23], SEPIA [24], and P4P [25], have been proven to scale wellwith the increase in the number of users.
PP-Overgrid is based on scalable MPC techniques, exploiting secure functions that can beexpressed as iterative data sums. While previous works such as [25] and [26] assume that nodesnever leave the network, in PP-Overgrid, the network topology may be unstable during the executionof the data mining operation.
3. The Overgrid Concept
The idea in Overgrid is to generalize the concept of a microgrid: the energy resources undercontrol for imposing a desired energy balance with the main grid are not physically localized in a givenregion, but rather are aggregated regardless of their placement on the energy grid. Buildings joiningthe Overgrid, also called nodes, are equipped with controllable loads, local generators, and storagesystems, which can be jointly exploited for controlling the power demand. Aggregation in an Overgridcan be based on different criteria, such as the type of utilities and the consumption behaviors ofthe nodes, the level of building exposure to sunlight (which in turns affects the operation of airconditioning systems), the presence of power sources/accumulators, as well as the presence of loadsdue to electric vehicles. Without loss of generality, in this paper, we will limit the analysis to a singlecluster of homogeneous nodes, i.e., a group of smart buildings with different power consumptionprofiles but uniform capabilities.
3.1. Architecture Overview
As shown in Figure 1, Overgrid is a virtual community of buildings participating in a distributedload control program, by means of an overlay P2P network where each node is a peer in the network.Here, for distributed load control program, we mean the possibility to adapt the aggregated powerdemand of all the nodes belonging to the Overgrid, in order to satisfy a dynamic power constraintprovided by the Distribution System Operator (DSO) without the usage of a central server. Once thelogical aggregation is defined and the P2P network is created, the Overgrid is operated as a genericmicrogrid, collecting the power consumption characteristics of each peer, distributing the DSO requeststo modulate the electrical load and implementing the load control (on the individual peers), accordingto the distributed Demand–Response (DR) paradigm.
Regarding the physical communication network between nodes, we assume that each Overgridnode is equipped with an Internet connection (towards other nodes) as well as a local connection(through WiFi, ZigBee, power line, etc.) for controlling appliances, smart plugs, storage, and productionsystems. Over this physical connection, the nodes in Overgrid form an unstructured P2P overlay basedon Gossip protocols, a commonly used P2P paradigm allowing fault tolerant and scalable informationdiffusion across the network, totally decentralized and with low network overhead [27]. Gossipingprotocols exploit periodic exchange of messages between nodes. The scalability comes from the factthat each node is in communication with a subset of other nodes (typically much smaller than theentire size of the network), which represents the neighbors of the node. Periodically, each node selectsanother node from its neighbors and exchanges messages containing the local view of some networkparameters. Thanks to such a periodic exchange of messages, each node independently carries outa plurality of distributed functions to maintain the P2P overlay structure, distribute information to itsneighbors, aggregate data, and operate the DR control, as detailed in [1].
Once a decision on power reduction is taken by a node, a local energy management system isused to map such a decision into a specific control action on the building flexible loads, e.g., tuning of

Sensors 2020, 20, 2249 5 of 18
the temperature on the heating/cooling systems, switching off smart appliances, etc., also taking intoaccount the preferences of the users. For example, Figure 1 shows the local energy management systemcomposed of a local server, as well as an interface for defining the load control policies desired by theuser by means of a common HTTP protocol. The implementation of the fine-grained local control andthe technologies to be used are out of the scope of this paper.
Figure 1. Reference scenario for the Overgrid.
3.2. The Distributed Demand Response Scheme
In Overgrid, the nodes monitor a set of local and global parameters needed to implement thedistributed DR. In particular, to follow the DSO requests, each node must: (i) receive the DSO requestand contribute to spreading it to other nodes; (ii) estimate the total consumption of the network;and (iii) compute a reduction on the current power demand (potentially different for every node)to comply with the DSO request. All of these tasks can be executed by means of the gossipingprotocol, which is used for disseminating the information about the DSO request and for implementinga distributed evaluation of the total power demand.
Different approaches can be exploited for estimating the total power demand. We chose toexploit a distributed aggregation technique, called Flow Updating [14], which is very robust forerror-prone overlay networks. The scheme is based on the concept of mass saving of the network:starting from the local variable available in each node (the local power demand), the nodes iterativelyupdate their estimates on the total power demand by averaging the local value with their neighborsestimates. In more detail, Flow Updating uses the concept of flow in graph theory and computes the
Sensors 2020, 20, 2249 6 of 18
average directly from the input (local) value and the contribution of the flows along graph edgesto the neighbors:
ei = vi − ∑j∈ni
fij, (1)
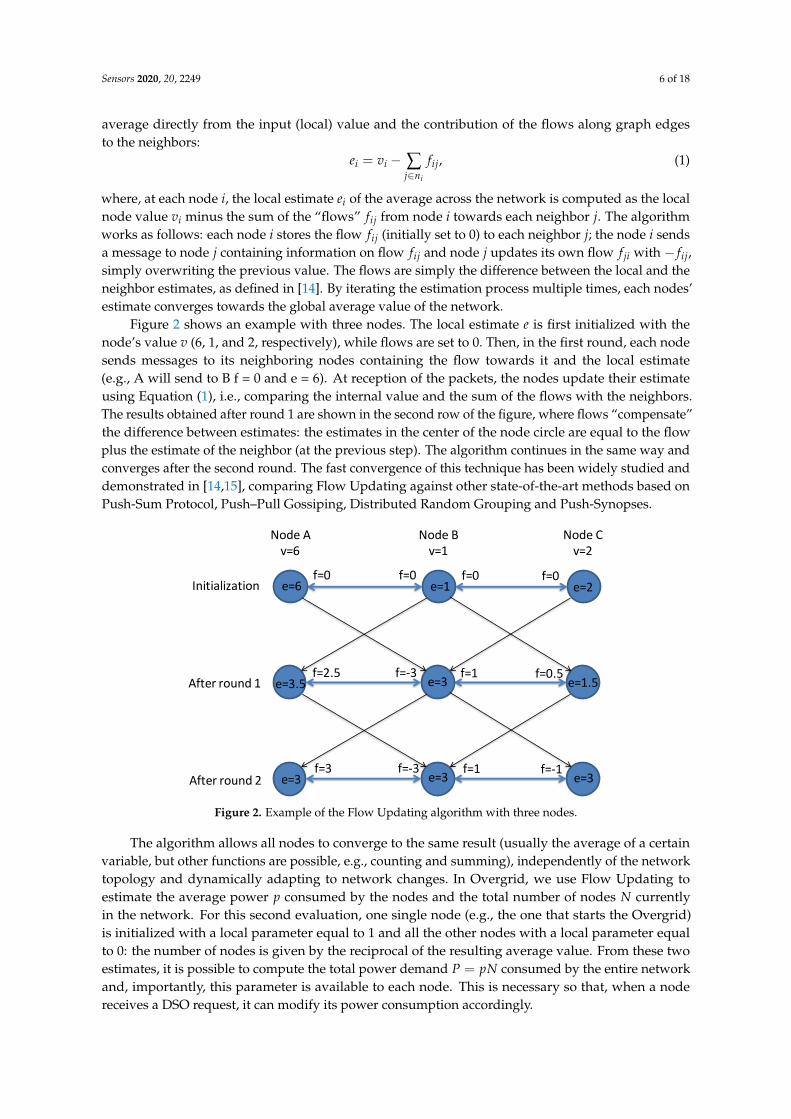
where, at each node i, the local estimate ei of the average across the network is computed as the localnode value vi minus the sum of the “flows” fij from node i towards each neighbor j. The algorithmworks as follows: each node i stores the flow fij (initially set to 0) to each neighbor j; the node i sendsa message to node j containing information on flow fij and node j updates its own flow f ji with − fij,simply overwriting the previous value. The flows are simply the difference between the local and theneighbor estimates, as defined in [14]. By iterating the estimation process multiple times, each nodes’estimate converges towards the global average value of the network.
Figure 2 shows an example with three nodes. The local estimate e is first initialized with thenode’s value v (6, 1, and 2, respectively), while flows are set to 0. Then, in the first round, each nodesends messages to its neighboring nodes containing the flow towards it and the local estimate(e.g., A will send to B f = 0 and e = 6). At reception of the packets, the nodes update their estimateusing Equation (1), i.e., comparing the internal value and the sum of the flows with the neighbors.The results obtained after round 1 are shown in the second row of the figure, where flows “compensate”the difference between estimates: the estimates in the center of the node circle are equal to the flowplus the estimate of the neighbor (at the previous step). The algorithm continues in the same way andconverges after the second round. The fast convergence of this technique has been widely studied anddemonstrated in [14,15], comparing Flow Updating against other state-of-the-art methods based onPush-Sum Protocol, Push–Pull Gossiping, Distributed Random Grouping and Push-Synopses.
Node Cv=2
Node Bv=1
Node Av=6
e=1e=6 e=2
e=3e=3.5 e=1.5
e=3e=3 e=3
f=0f=0 f=0 f=0
f=1f=2.5 f=-3 f=0.5
f=1f=3 f=-3 f=-1
Initialization
After round 1
After round 2
Figure 2. Example of the Flow Updating algorithm with three nodes.
The algorithm allows all nodes to converge to the same result (usually the average of a certainvariable, but other functions are possible, e.g., counting and summing), independently of the networktopology and dynamically adapting to network changes. In Overgrid, we use Flow Updating toestimate the average power p consumed by the nodes and the total number of nodes N currentlyin the network. For this second evaluation, one single node (e.g., the one that starts the Overgrid)is initialized with a local parameter equal to 1 and all the other nodes with a local parameter equalto 0: the number of nodes is given by the reciprocal of the resulting average value. From these twoestimates, it is possible to compute the total power demand P = pN consumed by the entire networkand, importantly, this parameter is available to each node. This is necessary so that, when a nodereceives a DSO request, it can modify its power consumption accordingly.

Sensors 2020, 20, 2249 7 of 18
3.3. The Load Control Function
Finally, in order to satisfy the DSO request (assumed to arrive every 15 minutes), the combinedaction of all the nodes in the network is needed. Let PDSO ≤ P be the maximum power demandenforced by the DSO into the Overgrid. Each node belonging to the Overgrid has to reduce its powerdemand in order to meet such a constraint. To achieve this goal, a distributed logic is carefullydefined, avoiding all nodes reacting at the same time to the request (causing possible instabilities) andthat the requested power reduction is balanced among different peers (avoiding fairness problems).For the first issue, we implemented a random delay mechanism that postpones the power reduction ofthe nodes for a certain amount of time (back-off ) to de-synchronize the nodes among them. For thesecond issue, we assumed that each load can be fine-tuned, in order to implement a power reductionproportional to PDSO/P for each specific load. This approach can be generalized in case of non-tunableloads, by switching off each specific appliance with probability 1− PDSO/P. In more complex scenarios,other fairness measures could also be employed, for example tacking into account different class ofnodes (e.g., industrial vs residential), different priorities (e.g., public safety), or different pricing levels(“premium” users might be less affected compared to “basic” consumers).
4. Privacy-Preserving Overgrid
The distributed architecture of Overgrid avoids the presence of a central data-center, which inprinciple could easily collect consumption data to profile single user behaviors. Indeed, data on users’power demand can be very sensitive, revealing, for example, the presence (or the absence) of people athome or the number of people living in the same building. However, even using a decentralized P2Pscheme like Flow Updating, neighbor nodes exchange information about their real consumption atthe first iteration of the scheme for computing the average power demand of the Overgrid, or whena new node joins the Overgrid. Since neighbor nodes might not trust each other, this operation couldrepresent a data breach.
We propose an extension of the distributed DR scheme implemented in Overgrid,in order to mitigate the problem of data breaches between neighboring nodes. The scheme,called Privacy-Preserving Overgrid (PP-Overgrid), combines the original DR algorithm with a SecureSecret Sharing (SSS) scheme [28]. In particular, we use a Secure Sum Computation (SSC), to privatelysum the secrets of n nodes, using a distributed implementation like the one shown in Figure 3.The algorithm works as follows: assume each node owns its secret si, and that the sum, ∑n
i si,lies in the range [0, q). The first node 1 adds a random value r to its secret s1 modulo q, obtainingr1 = (r + s1)mod q and sends it to node 2. Then, node 2 adds its own secret to r1, obtainingr2 = (r1 + s2)mod q and sends it to node 3, and so on until the last node n sends rn back to node 1.Finally, node 1 subtracts the initial random value r and determines the sum ∑n
i si.
1 2
36
5 4
Add random number r
Subtract random number r
Each nodeadds its own
secret
Figure 3. Secure Sum implementation example.
In PP-Overgrid, the idea is replacing each node with a set of n logical sub-nodes, each one witha specific power demand, whose sum corresponds to the real demand of the nodes. For each node i,
Sensors 2020, 20, 2249 8 of 18
the power demand shij of a generic sub-node j with j ≤ n− 1 is randomly generated as in the so-calledtrivial secret sharing scheme, while the last power demand shin is computed in order to guaranteethat the total demand ∑n
j shij = pi corresponds to the real demand pi of node i. The use of logicalsub-nodes guarantees that information is not disclosed unless the n shares are summed together. If oneshare is missing, no information can be retrieved (i.e., results become random). This on–off privacyproperty descends from the homomorphic property of the SSS: when considering two (or more) secrets,the sum of the shares represents a share of the sum of the secrets. In PP-Overgrid, we have applied SSS(and its well-known privacy properties) to the Overgrid scenario to protect user’s consumption data.
For each sub-node, random values of power demand are extracted from uniform distributionin the range [0, pmax], where pmax is the maximum power of the nodes, while negative values takeinto account the presence of power generators. Thus, to retrieve the real consumption data of nodei, it is necessary to know all the power demands of its sub-nodes. This can be easily avoided byopportunistically building the topology connecting sub-nodes to external nodes, i.e., by avoidingall the internal sub-nodes from being connected to the same external node. By executing the FlowUpdating schemes between N · n virtual nodes of the Overgrid, the average power demand of thewhole Overgrid is equal to the value p/n, from which p can be derived.
4.1. Architecture Extension
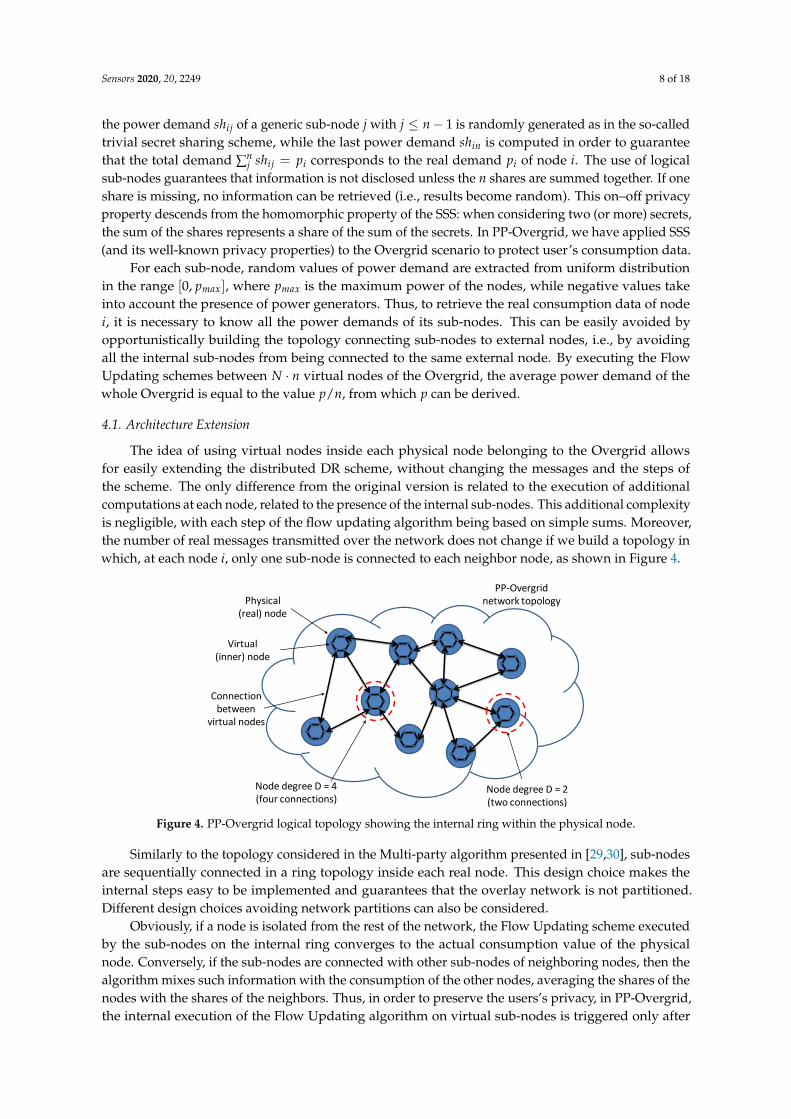
The idea of using virtual nodes inside each physical node belonging to the Overgrid allowsfor easily extending the distributed DR scheme, without changing the messages and the steps ofthe scheme. The only difference from the original version is related to the execution of additionalcomputations at each node, related to the presence of the internal sub-nodes. This additional complexityis negligible, with each step of the flow updating algorithm being based on simple sums. Moreover,the number of real messages transmitted over the network does not change if we build a topology inwhich, at each node i, only one sub-node is connected to each neighbor node, as shown in Figure 4.
Physical(real) node
Virtual (inner) node
Connection between
virtual nodes
PP-Overgridnetwork topology
Node degree D = 4 (four connections)
Node degree D = 2 (two connections)
Figure 4. PP-Overgrid logical topology showing the internal ring within the physical node.
Similarly to the topology considered in the Multi-party algorithm presented in [29,30], sub-nodesare sequentially connected in a ring topology inside each real node. This design choice makes theinternal steps easy to be implemented and guarantees that the overlay network is not partitioned.Different design choices avoiding network partitions can also be considered.
Obviously, if a node is isolated from the rest of the network, the Flow Updating scheme executedby the sub-nodes on the internal ring converges to the actual consumption value of the physicalnode. Conversely, if the sub-nodes are connected with other sub-nodes of neighboring nodes, then thealgorithm mixes such information with the consumption of the other nodes, averaging the shares of thenodes with the shares of the neighbors. Thus, in order to preserve the users’s privacy, in PP-Overgrid,the internal execution of the Flow Updating algorithm on virtual sub-nodes is triggered only after

Sensors 2020, 20, 2249 9 of 18
the reception of messages by all the neighboring nodes. This guarantees that, even if a tagged nodeis isolated for a while, the execution of internal averaging operations is suspended too and will notreveal the power demand of the node one the external connection is re-established.
It is easy to see that the privacy level of the proposed scheme depends on the number of node’sneighbors, also called node degree. Indeed, sub-nodes communicate some of the power demandshares to other neighboring nodes. If all of the neighboring nodes of a target node collude with eachother, i.e., exchange the messages received by the sub-nodes belonging to the target node, then theycan retrieve the secret power demand of the node. In more detail, the SSC scheme guarantees thatno information is disclosed until the shares of the sub-nodes are kept separated (i.e., not summedtogether). To converge, the Flow Updating algorithm indirectly "mixes" and sums the shares of all thesub-nodes in the network, revealing the average value of all nodes together. However, the consumptionof a target node can still be revealed if all its neighbors collude to compute the sum of the flows towardsthe target node. Indeed, if the Flow Updating has converged, the colluding node’s estimate will be thesame of the target node’s estimate which, according to Equation 1, is equal to the node’s (secret) valueminus the sum of the flows. Otherwise, no information is revealed, as explained in [29].
4.2. Convergence Time
Thanks to the scalability of Overgrid, creating virtual subnodes does not increase the convergencetime. Instead, it slightly improves it, although it also increases the variability of intermediate resultsbefore convergence. To verify this, we simulate PP-Overgrid on a network of 100 nodes withoutsub-nodes (n = 1, i.e., no privacy) and with 5 or 10 sub-nodes in each node. The topology of thenetwork is a random graph, with a fixed node degree D between 5 and 20, i.e., D is the minimumnumber of connections per node. In this experiment, we assume that all nodes exchange messages andexecute a step of the Flow Updating scheme at regular time intervals, called cycles. Figure 5 shows theaverage power consumption p estimated over time for all the nodes of the grid, as well as the globalnetwork average (think green line). In the experiment, we start from a stationary state, and then thepower demand of each node is suddenly changed to a new value at simulation cycles 50 and 100.
From the figure, it is clear that, without sub-nodes (top three figures), the convergence ofPP-Overgrid is slower while, with a higher number of sub-nodes, the convergence is faster. The reasonrelies on the fact that increasing the number of sub-nodes significantly reduces the degree of thePP-Overgrid network (the external connections are distributed among the different sub-nodes). Indeed,as shown in [15], the convergence time of the Flow Updating algorithm will improve if the network isloosely connected (and this is what happens when creating the sub-nodes). Additionally, note thatthe global average (thick green line) converges quicker with more sub-nodes, but, taking a closerlook, the overall network convergence speed is slower: indeed, the single nodes (local average) needmore iterations to get closer to the global network average. Nevertheless, even in the presence of10 sub-nodes (i.e., increasing the number of nodes by an order of magnitude), the increase in theconvergence time is negligible, proving the feasibility of PP-Overgrid.

Sensors 2020, 20, 2249 10 of 18
50 100 150Simulation cycle
-2
-1
0
1
2
3
4
5
6
7
Est
imat
e
N=100, Nsub=1, D=5
50 100 150Simulation cycle
-2
-1
0
1
2
3
4
5
6
7
Est
imat
e
N=100, Nsub=1, D=10
50 100 150Simulation cycle
-2
-1
0
1
2
3
4
5
6
7
Est
imat
e
N=100, Nsub=1, D=20
Figure 5. Convergence of the PP-Overgrid algorithm with N = 100 nodes, subnodes n = {1, 5, 10} andgraph degree D = {5, 10, 20}.
5. Experiments
A possible application of PP-Overgrid is to compensate the variability of energy productionfrom unpredictable sources, such as wind and solar. For example, Figure 6 shows the total wind andsolar energy production in Belgium, obtained by analyzing publicly available data of the Belgium’stransmission system operator [31]. From the figure, it is clear that such energy sources, and particularlywind, are highly variable and difficult to predict [32]. In our experiments, we will derive the powerconstraint PDSO applied by the operator by considering these data about renewable energy production.
PP-Overgrid has been implemented in Java exploiting the PeerSim simulator [33], which providesthe basic tools to simulate the gossip P2P overlay. The topology is generated randomly by PeerSim,where the number of nodes represent the number of smart buildings, while, for the power consumptiondata, we used the traces described in Section 5.2. Running independently on each node, the gossipingprotocol exchanges messages with the neighbor nodes, transmitting the information required for theFlow Updating algorithm. At startup, the emulator generates the random topology of the P2P network,with average node degree D the number of neighbors per node. It builds the connections between thenodes (each node has a neighbor “list”), so that each node then communicates to the neighboring nodesbased on this topology. The list of neighbors can be statically configured or can change dynamically as

Sensors 2020, 20, 2249 11 of 18
nodes join and leave the overlay. For easiness of presentation, however, in our experiments, we limitour analysis to a static environment.
Mon Tue Wed Thu Fri Sat Sun Mon
0
10
20
30
40
50
60
70
80
Ener
gy D
SO R
eque
st [k
Wh]
DSO WINDDSO SOLAR
Figure 6. Total wind and solar energy production during a week.
5.1. Characterizing Flexible Loads
For the implementation of the DR programs, it is necessary to distinguish loads that are flexibleand, therefore, manageable, from those that are not flexible. In residential environments, loads thatmay be considered flexible include:
• Heating and cooling units• Washing machines• Dryers• Dishwashers• Water heaters
while in the category of non flexible loads fall:
• Lights• Air circulation pumps for AC• Televisions and decoders• Computers• Fridges and freezers
The management of flexible loads such as washing machines and dishwashers is easily achievable(e.g., through smart plugs). The controlled interruption of the air conditioning units for short time doesnot have a particularly negative influence on perceived comfort conditions: switching off the heatingand/or cooling for small periods does not produce an abrupt change in temperature in the rooms,but a gradual change which can be corrected as soon as the air conditioning system is reactivated.In residential buildings, there is a multiplicity of other electrical loads that are, however, discontinuousand are active for short intervals of time; their extreme variability makes them impossible to beincluded in the list of flexible loads. For other commercial buildings, the loads that may be consideredflexible are only the AC units.
The traces described in Section 5.2 have been divided between flexible and non-flexible loadshares. The construction of such load profiles was carried out considering the average power absorbedby flexible (FLEX) loads and for non flexible loads (NOFLEX). Knowing the FLEX/NOFLEX load

Sensors 2020, 20, 2249 12 of 18
diagrams, it is then possible to use the traces to test PP-Overgrid applying the DR program to theflexible power only.
Energy consumption often exhibits regular patterns, with similar daily and weekly patterns.In our experiments, we assumed that every 15 min the DSO checks the energy production and requestsfrom the PP-Overgrid users a modification (up or down) in the global power consumption of thegrid. We then simulate the behavior of the nodes (each with a different amount of flexible power)responding to the power change requests made by the DSO.
5.2. Energy Load Profiles
We use real energy production traces from renewable sources, obtained by analyzing thewind/solar generation data in Belgium [31]. For the smart buildings, we also use real world powerconsumption traces and explicitly distinguish the flexible and non-flexible appliances. In particular,for the power consumption traces, we used NEEA’s RBSA dataset [34], a comprehensive meteringstudy covering most energy end uses in over 100 residential homes. The target loads included in theRBSA metering are:
• Heating and cooling• Hot water• White goods/appliance: refrigerator, freezer, clothes washer, clothes dryer• Consumer electronics: TV, TV accessories and Computer, computer accessories• Lighting• Other large loads: hot tubs, well pumps, sump pumps, electric cars, etc.
We analyzed these consumption traces to distinguish the flexible power from non-flexible power.For example, Figure 7 shows the total, flexible, and non-flexible power consumption reported in theRBSA dataset for a sample week.
Mon Tue Wed Thu Fri Sat Sun Mon
10
20
30
40
50
60
70
80
90
Ener
gy C
onsu
mpt
ion
[kW
h]
TotalUnflexibileFlexibile
Figure 7. Total, flexible, and inflexible power consumption during a sample week in the NEEA’sRBSA dataset.
The detailed list of loads considered as flexible is detailed in Table 1 and considers all the threehousing types of the RBSA dataset: single-family homes, manufactured homes, and multifamilybuildings. The table captures data mostly from Heating, Ventilation and Air Conditioning (HVAC)systems but also appliances such as washing machines, dryers, dishwashers, and DHW (Domestic HotWater) systems. The use of such data allows us to validate the feasibility of PP-Overgrid in realistic

Sensors 2020, 20, 2249 13 of 18
scenarios, monitoring the performance of the P2P network, and analyzing the nodes consumptionwith and without applying the DR program.
Table 1. Description of residential loads identified as flexible.
# Name Type Description
1 AC HVAC Central air conditioner outdoor unit energy use in kWh
2 Boilr_g_e HVAC Hydronic loop electric pump energy use in kWh
3 DHP HVAC Ductless heat pump total energy use in kWh. Includes both outdoorand indoor units
4 ER HVAC Zonal electric resistance heater energy use in kWh.
5 ER_2 HVAC Additional zonal electric resistance heater energy use in kWh.
6 ER_3 HVAC Additional zonal electric resistance heater energy use in kWh.
7 ER_4 HVAC Additional zonal electric resistance heater energy use in kWh.
8 ER_5 HVAC Additional zonal electric resistance heater energy use in kWh.
9 Furn HVAC Electric furnace resistance heating element energy use in kWh
10 Furn_AH HVAC Central forced air system air handler energy use in kWh. Includesair handlers for gas furnaces, electric resistance furnaces, central airconditioners, and heat pumps.
11 HP_in HVAC Air source heat pump system auxiliary resistance element energyuse in kWh. Located indoors; at the air handler, the elements provideadditional heat.
12 HP_in_2 HVAC Additional air source heat pump system auxiliary resistance elementenergy use in kWh. Located indoors, at the air handler, the elementsprovide additional heat
13 HP_out HVAC Air source heat pump outdoor unit energy use in kWh. Recordsenergy use for both heating and cooling.
14 HP_out_2 HVAC Additional air source heat pump outdoor unit energy use in kWh.Records energy use for both heating and cooling.
15 PTAC HVAC Packaged terminal air conditioner energy use in kWh
16 PTHP HVAC Packaged terminal heat pump energy use in kWh
17 Dryer Appliance Clothes dryer energy use in kWh. Includes heating element, drummotor, and exhaust fan energy.
18 Dwash Appliance Dishwasher energy use in kWh.
19 Cwash Appliance Clothes washer energy use in kWh
20 Cwash_2 Appliance Additional clothes washer energy use in kWh
21 DHW_1 DHW Primary electric resistance tank water heater energy in kWh
22 DHW_2 DHW Secondary electric resistance tank water heater energy in kWh
23 DHW_HP DHW Heat pump water heater energy use in kWh.
5.3. Numerical Results
In this section, we analyze the ability of PP-Overgrid to respond to realistic DSO requests, byconsidering 10 sub-nodes for each real node joining the Overgrid, a total number of N = 100 real nodesand a network degree of 5 or 20. We assume that the DSO updates its power constraint signal every15 minutes and that each node can adapt the consumption of flexible loads in a purely proportionalfashion. In other words, pi being the initial power demand of node i and pi_new the power demandafter the DR scheme, we consider that it is feasible to perform a proportional reduction pinew = PDSO
pN · piat each node i, in order to meet the DSO request PDSO.

Sensors 2020, 20, 2249 14 of 18
Figure 8 shows the aggregated power demand of PP-Overgrid when applying the DR (red curve)and without applying the DR scheme (green curve), together with the PDSO signal (blue curve) sent bythe DSO. For completeness, the figure also shows the results without applying the privacy preservingscheme, i.e., without sub-nodes (n = 1). In all the considered scenarios, for a network degree D = 5 orD = 20, the results show that the DR scheme is able to meet the DSO constraints, since the red curveclosely matches the blue one. This fact is better depicted in Figure 9, where we only show results forthe time interval between the 75th and the 80th hour, improving the readability of the comparisonbetween the blue and red curves. In such a figure, we can also appreciate the convergence time ofthe scheme for network topologies of different degrees D: as anticipated in Section 4.2, the lower thedegree of the network, the faster the computation of the average power demand (and consequently,the faster the computation of the adaptation actions). Note also that, for D = 20, the introduction ofthe internal sub-nodes improves the convergence of the scheme because it reduces the degree of theoverall topology, including both virtual and real nodes.
0 50 100 150 200
time[hours]
0
20
40
60
80
100
120
140
Co
nsu
mp
tio
n [
KW
h]
N=100, Nsub
=1, D=5
DSO Request
Flex NO DR
Flex DR
0 50 100 150 200
time[hours]
0
20
40
60
80
100
120
140
Co
nsu
mp
tio
n [
KW
h]
N=100, Nsub
=10, D=5
DSO Request
Flex NO DR
Flex DR
0 50 100 150 200
time[hours]
0
20
40
60
80
100
120
140
Co
nsu
mp
tio
n [
KW
h]
N=100, Nsub
=1, D=20
DSO Request
Flex NO DR
Flex DR
0 50 100 150 200
time[hours]
0
20
40
60
80
100
120
140
Co
nsu
mp
tio
n [
KW
h]
N=100, Nsub
=10, D=20
DSO Request
Flex NO DR
Flex DR
Figure 8. DSO adaptation of PP-Overgrid algorithm with N = 100 nodes, subnodes n = {1, 10} andgraph degree D = {5, 20}.

Sensors 2020, 20, 2249 15 of 18
75 76 77 78 79 80
time[hours]
10
15
20
25
30
35
40
45
50
55
Co
nsu
mp
tio
n [
KW
h]
N=100, Nsub
=1, D=5
DSO Request
Flex NO DR
Flex DR
75 76 77 78 79 80
time[hours]
10
15
20
25
30
35
40
45
50
55
Co
nsu
mp
tio
n [
KW
h]
N=100, Nsub
=10, D=5
DSO Request
Flex NO DR
Flex DR
75 76 77 78 79 80
time[hours]
10
15
20
25
30
35
40
45
50
55
Co
nsu
mp
tio
n [
KW
h]
N=100, Nsub
=1, D=20
DSO Request
Flex NO DR
Flex DR
75 76 77 78 79 80
time[hours]
10
15
20
25
30
35
40
45
50
55C
on
su
mp
tio
n [
KW
h]
N=100, Nsub
=10, D=20
DSO Request
Flex NO DR
Flex DR
Figure 9. Detail of the PP-Overgrid convergence adaptation with N = 100 nodes, subnodes n = {1, 10}and graph degree D = {5, 20}.
5.4. Quantized Load Adaptation
The proportional control of the loads might not always be feasible in practical cases becauseappliances often can only be switched on or off. To overcome this problem, we propose an alternativecontrol scheme, based on statistical decisions about the activation/de-activation of the loads. To meetthe DSO constraint, in case the power constraint PDSO is higher than the estimated power demandP = p · N · n of the Overgrid, users could randomly switch off each appliance with probability:
Pr{o f f } = 1− PDSOp · n · N . (2)
If the number of nodes (and appliances) is large enough, the effect of such random decisions willmake the total power demand close to PDSO. Figure 10 shows again the DSO constraint over time(blue curve), together with the total power demand of a network with N = 100 nodes and D = 20,with (red curve) or without (green curve) activating the DR scheme based on this statistical loadcontrol. The figure shows that the adaptation (red curve) closely follows the DSO requests variation,although the two curves do not perfectly match because of the random decisions and discrete valuesof the consumption loads. To quantify the mismatch between the desired PDSO power demand andthe one achieved by PP-Overgrid, Figure 11 shows the Cumulative Distributed Function (CDF) of theabsolute error |P− PDSO|. From the figure, it is evident that the adaptation error is lower than 5 kWhin more than 90% of the cases. The figure also shows the CDF of the corresponding Binomial function,

Sensors 2020, 20, 2249 16 of 18
showing that the errors follow the random process of touring the loads off, with approximately thesame distribution. This means that the error can be controlled and minimized by increasing the numberof nodes in the network, as well as reducing the size (quantization) of the loads.
75 76 77 78 79 80
time[hours]
5
10
15
20
25
30
35
40
45
50
55
Consum
ption [K
Wh]
N=100, Nsub
=10, D=20
DSO Request
Flex NO DR
Flex DR
Figure 10. Detailed results of the quantized DSO Adaptation, with subnodes n = 10 and graph degreeD = 20.
0 1 2 3 4 5 6 7Adaptation error [KWh]
0.0
0.2
0.4
0.6
0.8
1.0
CDF
OvergridBinomial
Figure 11. CDF of the DSO adaptation errors caused by quantized loads and comparison with thebinomial distribution.
6. Conclusions
In this paper, we proposed PP-Overgrid, a scalable solution for supporting privacy-preservingDR schemes working in a community of smart buildings, acting as a virtual microgrid regardless oftheir physical location. Based on a distributed P2P protocol, called Flow Updating, PP-Overgrid is ableto estimate of the total power demand of the grid without violating the single users’ power profiles.To compute such a power demand in a privacy-preserving manner, we introduced virtual sub-nodesinside each real node of the original Overgrid. Similar to Secure secret sharing algorithms, sub-nodescommunicate to the neighboring nodes randomly generated consumption data, guaranteeing that thetotal sum of aggregated data is equal to the real one.
Additionally, PP-Overgrid implements two different types of distributed load control to adapt thepower consumption of the network to the power constraints communicated by the DSO: a proportional(continuous) reduction of the load and a quantized (probabilistic) activation/de-activation of theloads. We explored the applicability of our scheme using a P2P network simulator and real power

Sensors 2020, 20, 2249 17 of 18
consumption traces of residential buildings. Our results show the feasibility of the scheme in matchinga desired power constraint, under different network topologies and scenarios.
Author Contributions: D.C. conceived the experiments and wrote the paper; F.G. performed the implementationand the experiments; I.T. analyzed the data; L.G. revised the paper. All authors have read and agreed to thepublished version of the manuscript.
Funding: This work has been funded thanks to the National Research Project DEMAND (DistributEdMANagement logics and Devices for electricity savings in active users installations) supported by the ItalianMinistry for the Economic Development MISE - identification code: CCSEB_00093.
Acknowledgments: The authors would like to thank the anonymous reviewers for their help in improving thequality of the paper.
Conflicts of Interest: The authors declare no conflict of interest.
References
1. Croce, D.; Giuliano, F.; Tinnirello, I.; Galatioto, A.; Bonomolo, M.; Beccali, M.; Zizzo, G. Overgrid: A FullyDistributed Demand Response Architecture Based on Overlay Networks. IEEE Trans. Autom. Sci. Eng. 2017,14, 471–481. [CrossRef]
2. Croce, D.; Giuliano, F.; Bonomolo, M.;Leone, G.; Musca, R.; Tinnirello, I. A decentralized load controlarchitecture for smart energy consumption in small islands. Sustain. Cities Soc. 2020, 53, 101902. [CrossRef]
3. Hao, H.; Lin, Y.; Kowli, A.; Barooah, P.; Meyn, S. Ancillary service to the grid through control of fans incommercial building HVAC systems. IEEE Trans. Smart Grid 2014, 5, 2066–2074. [CrossRef]
4. Mathieu, L.; Koch, S.; Callaway, D. State estimation and control of electric loads to manage real-time energyimbalance. IEEE Trans. Power Syst. 2013, 28, 430–440. [CrossRef]
5. Meyn, S.P.; Barooah, P.; Busic, A.; Ehren, J. Ancillary service to the grid from deferrable loads: The case forintelligent pool pumps in Florida. In Proceedings of the IEEE Conference on Decision and Control, Florence,Italy, 10–13 December 2013; pp. 6946–6953.
6. Ancillotti, E.; Bruno, R.; Conti, M. The role of communication systems in smart grids: Architectures, technicalsolutions and research challenges. Comput. Commun. 2013, 36, 1665–1697. [CrossRef]
7. Gomes, L.; Sousa, F.; Vale, Z. An Intelligent Smart Plug with Shared Knowledge Capabilities. Sensors 2018,18, 3961. [CrossRef] [PubMed]
8. Neely, M.; Tehrani, A.; Dimakis, G. Efficent Algorithms for Renewable Energy Allocation to DelayTolerant Consumers. In Proceedings of the IEEE International Conference on Smart Grid Communications,Gaithersburg, MD, USA, 4–6 October 2010; pp. 549–554.
9. Ardakanian, O.; Keshav, S.; Rosenberg, C. On the use of teletraffic theory in power distribution systems.In Proceedings of the Future Energy Systems: Where Energy, Computing and Communication Meet(e-Energy) 2012, Madrid, Spain, 9–11 May 2012; pp. 1–10.
10. Di Bella, G.; Giarré, L.; Ippolito, M.; Jean-Marie, A.; Neglia, G.; Tinnirello, I. Modeling Energy DemandAggregator for Residential Users. In Proceedings of the IEEE Conference on Decision and Control, Florence,Italy, 10–13 December 2013; pp. 6280–6285.
11. Tinnirello, I.; Neglia, G.; Giarré, L.; Di Bella, G.; Jean-Marie, A.; Ippolito, M.G. Large Scale Control ofDeferrable Domestic Loads in Smart Grids. IEEE Trans. Smart Grid. 2018, 9, 733–742. [CrossRef]
12. Lua, E.; Crowcroft, K.J.; Pias, M.; Sharma, R.; Lim, S. A survey and comparison of peer-to-peer overlaynetwork schemes. Commun. Surv. Tutor. 2005, 7, 72–93.
13. Jesus, P.; Baquero, C.; Almeida P.S. A Survey of Distributed Data Aggregation Algorithms. IEEE Comm. Surv.Tutor. 2015, 17, 381–404. [CrossRef]
14. Jesus, P.; Baquero, C.; Almeida, P.S. Flow updating: Fault-tolerant aggregation for dynamic networks.J. Parallel Distrib. Comput. 2015, 78, 53–64. [CrossRef]
15. Almeida, P.S.; Baquero, C.; Farach-Colton, M.; Jesus, P.; Mosteiro, M.A. Fault-tolerant aggregation:Flow-Updating meets Mass-Distribution. Distrib. Comput. 2017, 30, 281–291. [CrossRef]
16. Verykios, V.S.; Bertino, E.; Fovino, I.N.; Provenza, L.P.; Saygin, Y.; Theodoridis, Y. State-of-the-art in privacypreserving data mining. SIGMOD Rec. 2004, 33, 50–57. [CrossRef]

Sensors 2020, 20, 2249 18 of 18
17. Agrawal, R.; Srikant, R. Privacy-preserving data mining. In Proceedings of the 2000 ACM SIGMODInternational Conference on Management of Data (ser. SIGMOD ’00), Dallas, TX, USA, 16–18 May 2000;ACM: New York, NY, USA, 2000; pp. 439–450.
18. Erkin, Z.; Veugen, T.; Toft, T.; Lagendijk, R. Privacy-preserving user clustering in a social network.In Proceedings of the First IEEE International Workshop on Information Forensics and Security (WIFS 2009),London, UK, 7–9 December 2009; pp. 96–100.
19. Hazay, C.; Orsini, E.; Scholl, P.; Soria-Vazquez, E. Concretely Efficient Large-Scale MPC with Active Security(or, TinyKeys for TinyOT). In Advances in Cryptology—ASIACRYPT 2018; Peyrin T., Galbraith S., Eds.;Lecture Notes in Computer Science; Springer: Cham, Switzerlands, 2018; Volume 11274.
20. Yao, A.C.C. How to generate and exchange secrets. In Proceedings of the 27th Annual Symposium onFoundations of Computer Science (SFCS ’86), Los Alamitos, CA, USA, 27–29 October 1986; pp. 162–167.
21. Ben-Or, M.; Goldwasser, S.; Wigderson, A. Completeness theorems for non-cryptographic fault-tolerantdistributed computation. In Proceedings of the 20th Annual ACM Symposium on Theory of Computing(STOC’88), Chicago, IL, USA, 2–4 May 1988; pp. 1–10.
22. Cramer, R.; Damgard, I.; Maure, U. Multiparty computations from any linear secret sharing scheme.In Proceedings of the International Conference on the Theory and Application of Cryptographic Techniques(EUROCRYPT), Bruges, Belgium, 14–18 May 2000.
23. Bogdanov, S.; Laur, D.; Willemson, J. Sharemind: A framework for fast privacy-preserving computations.In Proceedings of the 13th European Symposium on Research in Computer Security (ESORICS), Málaga,Spain, 6–8 October 2008; pp. 192–206.
24. Burkhart, M.M.D.; Strasser, M.; Dimitropoulos, X. Sepia: Privacy-preserving aggregation of multi-domainnetwork events and statistics. In Proceedings of the 19th USENIX Security Symposium (USENIX),Washington, DC, USA, 11–13 August 2010; pp. 223–240.
25. Duan, Y.; Canny J.; Zhan, J. P4P: Practical large-scale privacy-preserving distributed computation robustagainst malicious users. In Proceedings of the 19th USENIX Security Symposium (USENIX), Washington,DC, USA, 11–13 August 2010; pp. 223–240.
26. Clifton, C.; Kantarcioglu, M.; Vaidya, J.; Lin, X.; Zhu, M.Y. Tools for privacy preserving distributed datamining. SIGKDD Explor. 2002, 4, 28–34. [CrossRef]
27. Altoaimy, L.; Alromih, A.; Al-Megren, S.; Al-Hudhud, G.; Kurdi, H.; Youcef-Toumi, K. Context-AwareGossip-Based Protocol for Internet of Things Applications. Sensors 2018, 18, 2233. [CrossRef] [PubMed]
28. Shamir, A. How to share a secret. Commun. ACM 1979, 22, 612–613. [CrossRef]29. Randazzo, F.; Croce, D.; Tinnirello, I.; Barcellona, C.; Merani, M.L. Experimental evaluation of
privacy-preserving aggregation schemes on planetlab. In Proceedings of the 2015 International WirelessCommunications and Mobile Computing Conference (IWCMC), Dubrovnik, Croatia, 24–28 August 2015;pp. 379–384.
30. De Valck, P.; Moerman, I.; Croce, D.; Giuliano, F.; Tinnirello, I.; Garlisi, D.; de Poorter, E.; Jooris, B. Exploitingprogrammable architectures for wifi/zigBee inter-technology cooperation. EURASIP J. Wirel. Commun.Network. 2014, 212, 1–13. [CrossRef]
31. Elia Grid Power Generation Data. Available online: http://www.elia.be/en/grid-data/power-generation/(accessed on 14 April 2020).
32. Guarino, F.; Croce, D.; Tinnirello, I.; Cellura, M. Data fusion analysis applied to different climate changemodels: An application to the energy consumptions of a building office. Energy Build. 2019, 196, 240–254.[CrossRef]
33. Montresor, A.; Jelasity, M. PeerSim: A scalable P2P simulator. In Proceedongs of the 9th InternationalConference on Peer-to-Peer (P2P’09), Seattle, WA, USA, 9–11 September 2009; pp. 99–100.
34. NEEA Residential Building Stock Assessments. Dataset and User Manual. Available online: https://neea.org/data/residential-building-stock-assessment (accessed on 14 April 2020).
c© 2020 by the authors. Licensee MDPI, Basel, Switzerland. This article is an open accessarticle distributed under the terms and conditions of the Creative Commons Attribution(CC BY) license (http://creativecommons.org/licenses/by/4.0/).