prisoners of birth: tedx whitefield
TRANSCRIPT

All men are equal:
It is NOT BIRTH,
but virtue alone,
that makes the difference.
-- Voltaire

2
My name starts with "A".
Called early for all questions,
submissions, etc.. at class.
Often unprepared, struggled
against classmates named "V…".
But I learned to be prepared –
always.
But does the first letter of the
name actually affect the marks?
“
I WAS NAMED “ANAND” AT BIRTH

3
2005First letter marks
A
P
V
D
S
N
K
R
B
G
M
V
A
P
D
S
K
N
B
R
G
M
59.2%
58.9%
58.9%
58.8%
57.9%
56.3%
56.2%
56.1%
55.4%
54.5%
54.4%
66.5%
65.9%
65.8%
65.2%
64.3%
64.0%
63.4%
62.8%
62.6%
61.5%
61.1%
2011First letter marks
Source: Karnataka State Board exams (8 – 8.5 lakh students per year)
COMPARE MARKS BY FIRST LETTER
WHYdoes it matter?
Highest
Lowest
4
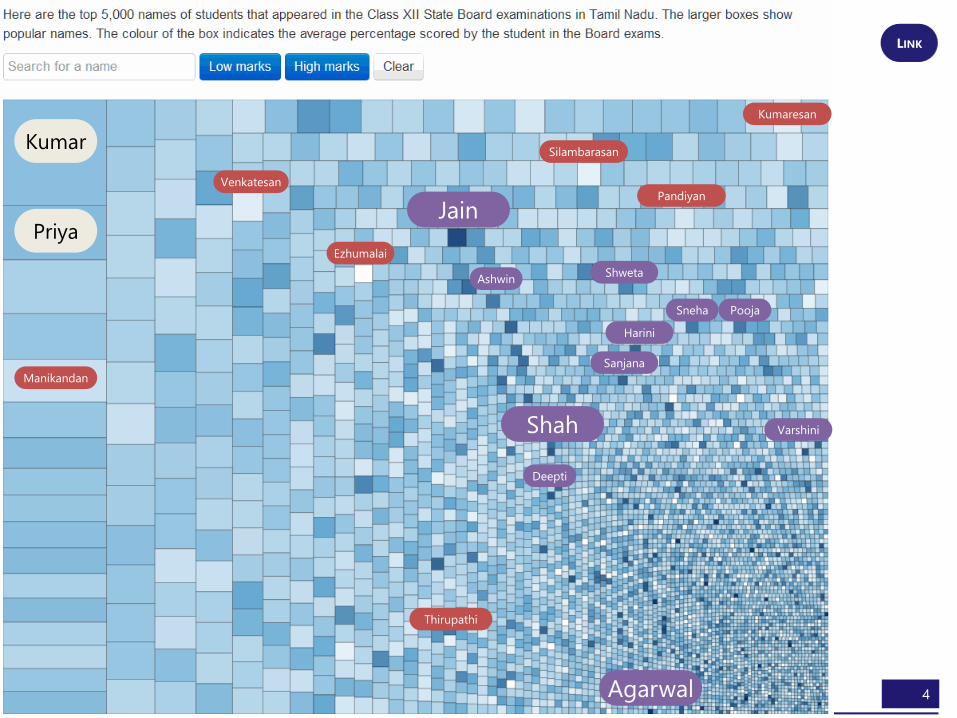
COMPARE MARKS BY STUDENT NAMES
Jain
Harini
Shweta
Sneha Pooja
Ashwin
Shah
Deepti
Sanjana
Varshini
Ezhumalai
Venkatesan
Silambarasan
Pandiyan
Kumaresan
Manikandan
Thirupathi
Agarwal
Kumar
Priya
LINK

NAMES DO MATTER
BUT NOT FOR REASONS I THOUGHT

6
WHILE COUNTING NAMES, I SPOTTED SOMETHING STRANGE
Name Count
MANIKANDAN 9,778
PRIYA 8,399
VIGNESH 7,298
SARANYA 6,449
SUGANYA 5,463
SANGEETHA 4,640
SARAVANAN 4,022
16% higher
15% higher
13% higher
18% higher
18% higher
15% higher
These ratios are very steady.
If we plot them on a log-log
graph, they form a straight line.
3.55
3.6
3.65
3.7
3.75
3.8
3.85
3.9
3.95
4
4.05
4.1
0 0.2 0.4 0.6 0.8 1

7
THIS IS ALSO TRUE OF CANDIDATE NAMES IN ASSEMBLY ELECTIONS
Name CountNONE OF THE ABOVE 629OM PRAKASH 478ASHOK KUMAR 411RAM SINGH 362RAJ KUMAR 294ANIL KUMAR 271AMAR SINGH 248MOHAN LAL 235RAM KUMAR 224BABU LAL 218RAM PRASAD 213JAGDISH 210VIJAY KUMAR 207RAJENDRA SINGH 196VINOD KUMAR 195SHYAM LAL 193RAJESH KUMAR 186SITA RAM 186RAM LAL 171...
WAIT… WHAT? 478 OM PRAKASHS?

8
ARE DUPLICATE CANDIDATE NAMES COMMON?
State Constituency Affected candidate Party Count
Chattisgarh Mahasamund Chandu Lal Sahu BJP 11
Chattisgarh Bilaspur Lakhan Lal Sahu BJP 5
Delhi West Delhi Jarnail Singh AAP 3
Madhya Pradesh Rewa Janardan Mishra BJP 2
Uttar Pradesh Mathura Hema Malini BJP 2
Haryana Kurukshetra Raj Kumar Saini BJP 2
Madhya Pradesh Hoshangabad Uday Pratap Singh BJP 2
Maharashta Osmanabad Gaikward Ravindra Vishwanath Shivsena 2
Haryana Sonipat Padam Singh INLD 2
Tamil Nadu Salem Umarani S DMDK 2
Uttar Pradesh Unnao Anil Kumar SPI 2
Duplicate candidate names were very uncommon
until 2014 – when suddenly, several constituencies
had candidates with the same name as the sitting
MP – making it more confusing for voters.
The affected candidate and party (the
ones who suffered because of the
confusion) are listed. Note the absence of
the largest party – INC.


10
… AND ALSO OF NAMES MENTIONED IN BOLLYWOOD MOVIES10
Person CountLata Mangeshkar 824Asha Bhosle 810Shakti Kapoor 589Kishore Kumar 585Mohammed Rafi 527Sunidhi Chauhan 515Alka Yagnik 451Udit Narayan 435Kader Khan 430Sonu Nigam 405Sameer 398Asrani 397Helen 395Shaan 377Aruna Irani 375Anupam Kher 367Shreya Ghoshal 357Gulshan Grover 341...

POPULARITY FEEDS ON ITSELF
SO YOUR NAME WAS INFLUENCED WELL BEFORE YOU WERE BORN

BUT IS THIS UNIQUE TO NAMES?FOR EXAMPLE, HOW ARE MARKS DISTRIBUTED?

13
TN CLASS X: ENGLISH
0
5,000
10,000
15,000
20,000
25,000
30,000
35,000
40,000
0 5 10 15 20 25 30 35 40 45 50 55 60 65 70 75 80 85 90 95 100

14
TN CLASS X: SOCIAL SCIENCE
0
5,000
10,000
15,000
20,000
25,000
30,000
35,000
40,000
0 5 10 15 20 25 30 35 40 45 50 55 60 65 70 75 80 85 90 95 100

15
TN CLASS X: MATHEMATICS
0
5,000
10,000
15,000
20,000
25,000
30,000
35,000
40,000
0 5 10 15 20 25 30 35 40 45 50 55 60 65 70 75 80 85 90 95 100

MATHEMATICAL ABILITY IS INNATE
WHAT ELSE IS INFLUENCED AT BIRTH?

17
GENDER
DIFFERENCE
Do girls score more than
boys, or is it the other way
around?
Gender is a known driver of
performance. Girls generally
score higher. There is
considerable variation across
subjects, however. The
differences in sciences is
minimal. But languages,
commerce and economics
give girls a significant edge.
There is also a correlation
between girls’ dropout ratio
and their over-performance
– indicating perhaps that the
smarter girls tend to stay
back in school.
Subject Girs higher by Girls Boys
Physics 0 119 119
Chemistry 1 123 122
English 4 130 126
Computers 6 137 131
Biology 6 129 123
Mathematics 11 123 112
Language 11 152 141
Accounting 12 138 126
Commerce 13 127 114
Economics 16 142 126
WHO SCORES MORE? BOYS OR
GIRLS?

18
HOW DOES PLACE OF BIRTH AFFECT PERFORMANCE?
Coastal areas have a
consistently better performance

YOUR BIRTHDAY ITSELF IS NOT
RANDOM

20
This is a dataset (1975 – 1990) that has
been around for several years, and has
been studied extensively. Yet, a
visualization can reveal patterns that
are neither obvious nor well known.
For example,
• Are birthdays uniformly distributed?
• Do doctors or parents exercise the C-section option to move dates?
• Is there any day of the month that has unusually high or low births?
• Are there any months with relatively high or low births?
Very high births in September.
But this is fairly well known. Most
conceptions happen during the
winter holiday season
Relatively few births during the
Christmas and Thanksgiving
holidays, as well as New Year and
Independence Day.
Most people prefer not
to have children on the
13th of any month, given
that it’s an unlucky day
Some special days like April
Fool’s day are avoided, but
Valentine’s Day is quite
popular
More births Fewer births … on average, for each day of the year (from 1975 to 1990)
LET’S LOOK AT 15 YEARS OF US BIRTH DATA LINK

ARE LUCKY DATES FOR REAL?DOES THE SUN SIGN MATTER, FOR EXAMPLE?

22
The marks shoot
up for Aug borns
… and peaks for
Sep-borns
120 marks out of
1200 explainable
by month of birth
An identical pattern was observed in 2009 and 2010…
… and across districts, gender, subjects, and class X & XII.
“It’s simply that in Canada the eligibility
cut-off for age-class hockey is January
1. A boy who turns ten on January 2,
then, could be playing alongside
someone who doesn’t turn ten until the
end of the year—and at that age, in
preadolescence, a twelve-month gap in
age represents an enormous difference
in physical maturity.”
-- Malcolm Gladwell, Outliers
SUN SIGNS
Based on the results of the
20 lakh students taking the
Class XII exams at Tamil
Nadu over the last 3 years, it
appears that the month you
were born in can make a
difference of as much as 120
marks out of 1,200.
June borns
score the lowest

23
THE PATTERN IN INDIA IS QUITE DIFFERENT
This is a birth date dataset that’s
obtained from school admission data
for over 10 million children. When we
compare this with births in the US, we
see none of the same patterns.
For example,
• Is there an aversion to the 13th or is there a local cultural nuance?
• Are holidays avoided for births?
• Which months have a higher propensity for births, and why?
• Are there any patterns not found in the US data?
Very few children are born in the
month of August, and thereafter.
Most births are concentrated in
the first half of the year
We see a large number of
children born on the 5th, 10th,
15th, 20th and 25th of each month
– that is, round numbered dates
Such round numbered patterns a
typical indication of fraud. Here,
birthdates are brought forward to
aid early school admission
More births Fewer births … on average, for each day of the year (from 2007 to 2013)
LINK

24
THIS ADVERSELY IMPACTS CHILDREN’S MARKS
It’s a well established fact that older
children tend to do better at school in
most activities. Since many children
have had their birth dates brought
forward, these younger children suffer.
The average marks of children “born” on the 1st, 5th, 10th, 15th etc.. of
the month tend to score lower marks.
• Are holidays avoided for births?
• Which months have a higher propensity for births, and why?
• Are there any patterns not found in the US data?
Higher marks Lower marks … on average, for children born on a given day of the year (from 2007 to 2013)
Children “born” on round numbered days score lower marks on average,
due to a higher proportion of younger children
LINK

WHAT AFFECTS OUR MARKS?BEHAVIOR OR BIRTH?

26
NATIONAL ACHIEVEMENT SURVEY FOR CLASS 8 (2014)
What do the children in schools know and can do at
different stages of elementary education?
Have the inputs made into the elementary education
system had a beneficial effect or not?
LINK

27
HAVING EDUCATED PARENTS HELPS MOST
This table shows the % improvement in score due to each factor
LINK
28
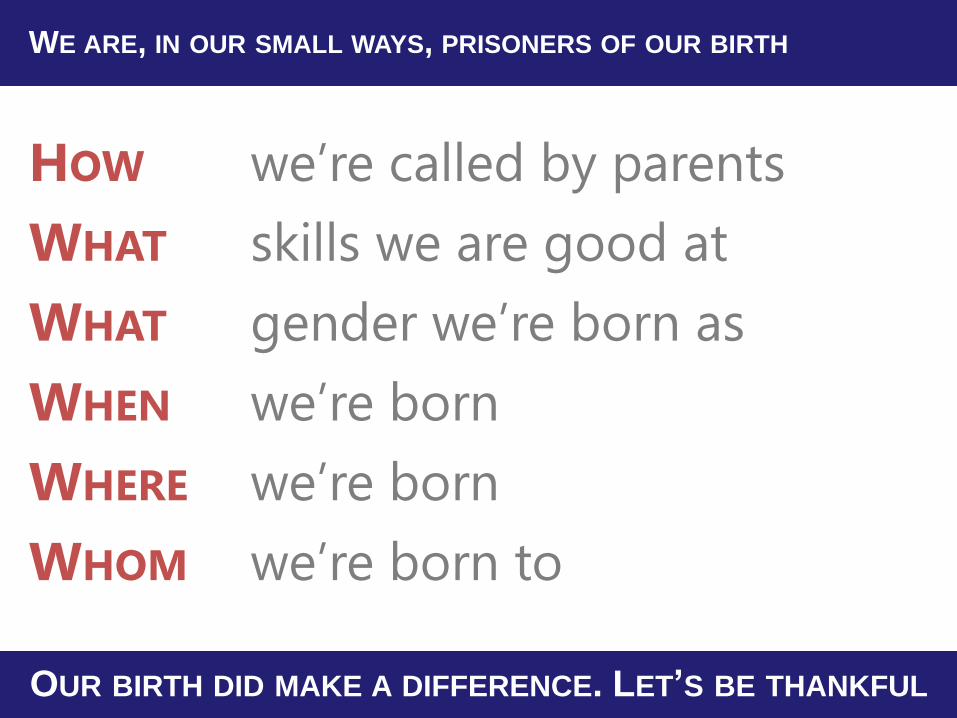
WE ARE, IN OUR SMALL WAYS, PRISONERS OF OUR BIRTH
HOW we’re called by parents
WHAT skills we are good at
WHAT gender we’re born as
WHEN we’re born
WHERE we’re born
WHOM we’re born to
OUR BIRTH DID MAKE A DIFFERENCE. LET’S BE THANKFUL