prioritization of traffic sign replacement using the
TRANSCRIPT

PRIORITIZATION OF TRAFFIC SIGN REPLACEMENT
USING THE ANALYTIC NETWORK PROCESS
BY
PONJANAT UBOLCHAY
A THESIS SUBMITTED IN PARTIAL FULFILLMENT OF THE
REQUIREMENTS FOR THE DEGREE OF MASTER OF SCIENCE
(ENGINEERING AND TECHNOLOGY)
SIRINDHORN INTERNATIONAL INSTITUTE OF TECHNOLOGY
THAMMASAT UNIVERSITY
ACADEMIC YEAR 2015


ii
Acknowledgements
First and foremost, my deepest gratitude and great appreciation is to my
thesis advisor, Assoc. Prof. Dr. Mongkut Piantanakulchai, for his supports, invaluable
helps, knowledges, encouragement, and recommendations throughout the course of this
research. I would also like to thanks to my thesis committees, Dr. Sorntep Vannarat and
Assoc. Prof. Dr. Chawalit Jeenanunta for their comments and suggestions.
I am sincerely grateful for financial support from Bangchak Petroleum
Public Company Limited. Next, I would also like to thanks to “Sirindhorn International
Institute of Technology: SIIT”. In addition, I would like to express my special thankful
to experts and every respondents to complete the questionnaire, without their valuable
data, this research would not be able to achieve.
Finally, I would like to offer my thanks to my adorable family who kindly
supported me either physical or mental strength at all times. Furthermore, I would like
to thanks my friends from TRANSIIT group for their helps. Thank you Ms. Pattanun
Manachitrungrueng, secretary of CET, for her kindly helps. Last, thank you to all staffs,
seniors, and my friends in school of Civil Engineering and Technology for their helps
and necessary information to me.

iii
Abstract
PRIORITIZATION OF TRAFFIC SIGN REPLACEMENT
USING THE ANALYTIC NETWORK PROCESS
by
PONJANAT UBOLCHAY
Bachelor of Urban Environmental Planning and Development, Faculty of Architecture
and Planning, Thammasat University, 2012
Master of Science (Engineering and Technology), Sirindhorn International Institute of
Technology, Thammasat University, 2015
Traffic signs are used as safety tools to guide and control vehicles. Cleared
traffic signs are essential to convey message to road users. Traffic signs should be
maintained in good condition. A way to treat damaged signs is to replace them with
new signs. However, several damaged traffic signs exist in road network, and it is
impossible to replace them all. Therefore, prioritization is necessary for traffic sign
replacement. In this research, to prioritize replacement of damaged signs, the Analytic
Network Process (ANP) is applied. Prioritization of traffic sign replacement is
considered by three factors such as location of traffic signs, level of damage of signs,
and the context of traffic signs. The result shows that level of damage of signs is the
first priority, especially the traffic signs which are fade away or unclear message.
While, the physical location of traffic signs, where is roundabout, is the last priority.
Moreover, a technique to rank hazardous highway locations in Thailand by
using available statistical data from the Department of Highways (DOH) is presented
in this research. Accident rate, death rate, and injury rate are calculated per length of
highway and traffic volume. Two methods of ranking are applied in this study, weights
given by DOH and weights derived from Principal Component Analysis (PCA). The
results of study reveal hazardous highway locations in Thailand in two levels, district
level and specific highway sections. The results show that both methods give similar

iv
ranking results. The method of PCA provides an alternative ranking scheme which does
not require subjective judgment of weights.
Moreover, comprehension of traffic signs by drivers is studied in this
research. This research proposes a method to rank importance of traffic signs by linking
the context of traffic signs and potential causes of traffic accidents. Five categories of
traffic accident causes which are related to traffic signs - speeding, road way
channelization, overtaking, hazardous road conditions, and causes related to pedestrians
and animals - are considered. The results show that drivers interpret the meaning of
traffic signs by more than one meaning, and the importance of traffic signs depends on
their meaning which drivers understand.
Keywords: Analytic Network Process (ANP), Prioritization, Traffic sign, Traffic sign
replacement
v
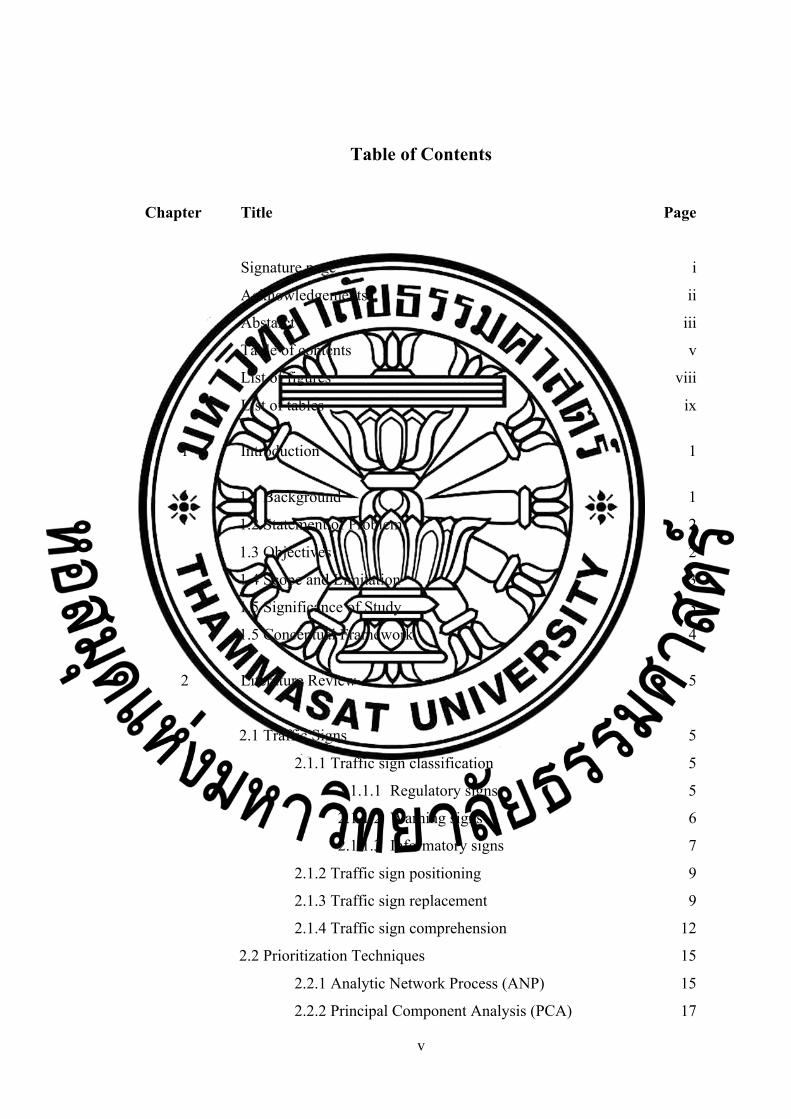
Table of Contents
Chapter Title Page
Signature page i
Acknowledgements ii
Abstarct iii
Table of contents v
List of figures viii
List of tables ix
1 Introduction 1
1.1 Background 1
1.2 Statement of Problem 2
1.3 Objectives 2
1.4 Scope and Limitation 3
1.5 Significance of Study 3
1.5 Conceptual Framework 4
2 Literature Review 5
2.1 Traffic Signs 5
2.1.1 Traffic sign classification 5
2.1.1.1 Regulatory signs 5
2.1.1.2 Warning signs 6
2.1.1.3 Informatory signs 7
2.1.2 Traffic sign positioning 9
2.1.3 Traffic sign replacement 9
2.1.4 Traffic sign comprehension 12
2.2 Prioritization Techniques 15
2.2.1 Analytic Network Process (ANP) 15
2.2.2 Principal Component Analysis (PCA) 17

vi
3 Research Methodology 19
3.1 Identification Hazardous Highway Locations in Thailand 19
3.1.1 Department of Highway (DOH) weight 19
3.1.2 Principal Component Analysis (PCA) 20
3.2 Traffic Sign Classification by Linking the Context of Traffic Signs
and Traffic Accident Causes 22
3.2.1 Data collection 23
3.2.1.1 Questionnaire preparation 23
3.2.1.2 Sample size determination 24
3.2.2 Relevance of traffic signs and traffic accident causes 26
3.3 Traffic Sign Prioritization 26
3.3.1 Questionnaire preparation and data collection 26
3.3.2 Analytic Network Process (ANP) procedure 28
4 Prioritization for Traffic Sign Replacement 32
4.1 Hazardous Highway Location Ranking 32
4.1.1 Hazardous highway district area ranking 33
4.1.2 Hazardous highway section ranking 35
4.1.3 Weighted score comparison 36
4.1.3.1 District area location 37
4.1.3.2 Section location 37
4.2 Linking the Context of Traffic Signs and Potential Causes of Traffic
Accidents 37
4.2.1 Background 38
4.2.2 Descriptive statistics 38
4.2.3 Relevance of traffic signs and potential causes of traffic
accident 39
4.3 Prioritization of Traffic Sign Replacement 41
4.4 Application for Priority of Traffic Sign Replacement 55

vii
5 Conclusion and Recommendations 57
5.1 Conclusion and Discussion 57
5.2 Recommendations 59
References 60
Appendices 65
Appendix A 66
Appendix B 78
Appendix C 91

viii
List of Figures
Figures Page
1.1 Conceptual framework 4
2.1 Examples of regulatory signs 6
2.2 Examples of warning signs 7
2.3 Examples of informatory signs 7
3.1 Structure of the ANP in this study 29
3.2 General structure of the supermatrix 30
4.1 Comparison of the context of regulatory signs and warning signs related to
potential causes of traffic accident 41
4.2 Weighted scores of priority of traffic sign replacement 55

ix
List of Tables
Tables Page
2.1 Summary of traffic sign classification in Thailand 8
2.2 Sign condition assessment guide in Europe 10
2.3 Guideline for traffic sign assessment in Thailand 11
2.4 Guideline for frequency of traffic sign assessment in Thailand 12
2.5 Summary of related literatures to traffic sign comprehension 13
2.6 Fundamental scale of relative importance 16
3.1 Example of questionnaire used in this study 24
3.2 Sample size for ±3%, ±5%, ±7%, and ±10% precision levels where confidence
level if 95% and P = 0.5 25
3.3 The definition of comparison scale 28
3.4 The definition of the Likert scale 28
4.1 Correlation matrix of indicators by district areas 33
4.2 Eigenvalue, proportion and eigenvector of each principal component (district
area) 33
4.3 Comparison of ranking results for hazardous highway district areas 34
4.4 Correlation matrix of indicators by highway sections 35
4.5 Eigenvalue, proportion and eigenvector of each principal component (by
sections) 35
4.6 Comparison of ranking results for hazardous highway sections 36
4.7 Comparison of results on weight scores for hazardous highway district area 37
4.8 Comparison of results on weight scores for hazardous highway section 37
4.9 Summary of driver characteristics (%) 38
4.10 Examples of results: potential causes of traffic accident when the traffic sign
is missing/damaged 39
4.11 Personal profile of experts 41
4.12 Pairwise comparison of the first expert: location of traffic sign 42
4.13 Pairwise comparison of the second expert: location of traffic sign 42
4.14 Pairwise comparison of the third expert: location of traffic sign 42

x
4.15 Pairwise comparison of the first expert: Level of damage of sign 43
4.16 Pairwise comparison of the second expert: Level of damage of sign 43
4.17 Pairwise comparison of the third expert: Level of damage of sign 43
4.18 Pairwise comparison of the first expert: The context of traffic sign 43
4.19 Pairwise comparison of the second expert: The context of traffic sign 44
4.20 Pairwise comparison of the third expert: The context of traffic sign 44
4.21 Initial supermatrix: The first expert 45
4.22 Initial supermatrix: The second expert 46
4.23 Initial supermatrix: The third expert 47
4.24 Weighted supermatrix: The first expert 48
4.25 Weighted supermatrix: The second expert 49
4.26 Weighted supermatrix: The third expert 50
4.27 Limiting supermatrix: The first expert 51
4.28 Limiting supermatrix: The second expert 52
4.29 Limiting supermatrix: The third expert 53
4.30 Average of weighted scores of elements for traffic sign replacement 54

1
Chapter 1
Introduction
1.1 Background
About 1.24 million people die each year as a result of road traffic crashes.
The world's fatalities on the roads occur in low-income and middle-income countries,
even though these countries have approximately half of the world's vehicles. Without
action, road traffic crashes are predicted to result in the deaths of around 1.9 million
people annually by 2020 (World Health Organization, 2016). In Thailand, up to 26,000
people are killed in road accidents every year. In 2014, Thailand’s roads were ranked
the second most dangerous worldwide. A study by the University of Michigan
Transportation Research Institute showed that Thailand has the second-highest traffic
fatality rate in the world, with 44 deaths per 100,000 populations (Hynes, 2014;
DeGroat, 2014).
The elements in the road environment are important to support the safety.
Traffic signs are one of the most important elements in road environment. Traffic signs
are used as a traffic safety tool for guiding and controlling traffic, mostly developed to
provide crucial information within a short time by words or symbols to support safe
driving (Kirmizioglu and Tuydes-Yaman, 2012; Al-Madani and Al-Janahi(a), 2002;
Al-Madani and Al-Janahi(b), 2002). Generally, traffic signs are grouped into three
groups: regulatory signs, warning signs, and informatory or guidance signs. Regulatory
signs give notice of requirements, prohibitions or restrictions. Warning signs provide
warning of a hazard ahead. The last group of traffic signs is informatory signs or
guidance signs. These signs give the information about routes, places, or facilities of
particular value or interest to road users.
Traffic signs must give a clear message at the correct time to road users.
Therefore, symbols are used rather than words to convey a message. The message must
be unambiguous and speedily understood (Department for Transport, 2004). Symbols
allow instant communication to road users, overcome language barriers, and have been
a standard for traffic control devices worldwide. Familiarity with symbols on traffic
2
signs is important for every drivers and road user in order to maintain the safety and
efficiency of transportation facilities (United States Department of Transportation
Federal Highway Administration, 2002).
Clear and effective traffic signs are an essential part of highways. The road
with poorly maintained signs might be hazardous. After installation, traffic signs must
be maintained to preserve the original effectiveness and general condition at all times.
Traffic signs become less effective not only when characters or coloring are
deteriorated, but also they are dirty, damaged, or displaced as a result of accidents or
vandalisms (Department for Transport, 2004).
1.2 Statement of Problem
As mentioned above, traffic signs are important for road users. The main
role of traffic signs is to give notice of requirements, prohibitions, restrictions,
warnings, information, or directions for safe driving.
After installation, traffic signs are deteriorated in time, by weathering,
vandalism, or being hit by vehicles. Traffic signs must be maintained to preserve their
original effectiveness. A way to treat these deteriorated or damaged signs is
replacement. When budget and time are limited, it is necessary to prioritize traffic sign
replacements by considering their relative importance. Many factors must be
considered such as location, level of damage, and potential of traffic accident caused
by missing or damaged signs.
However, it is generally impossible to replace every damaged traffic sign
due to financial and time limitations (Agarwal et al., 2013). Moreover, a large number
of traffic signs which exist in practice cause difficulties in ranking them in terms of
their relative importance. Therefore, a tool to aid the prioritization for traffic sign
replacement is necessary.
1.3 Objectives
The main objective of this study is to prioritize traffic sign replacement in
Thailand. In general, traffic signs are installed on all national highways. Before

3
replacing the new traffic signs, national highways should be prioritized or ranked a
hazardous location. Therefore, this study generates a pre-screening step. The objective
of this step is to identify hazardous highway location in Thailand.
Moreover, there are several traffic signs which are existed in practice. It is
difficult in ranking or prioritizing traffic signs in terms of their importance. Therefore,
to rank an importance of traffic signs, the context of traffic signs and potential causes
of traffic accidents are linked. This process is to identify an importance of traffic by
linking their context and potential causes of traffic accidents.
1.4 Scope and Limitation
General, traffic signs are classified into three groups; regulatory signs,
warning signs, and informatory signs depend on their meaning. However, only
regulatory signs and warning signs are considered in this study. Because there are many
informatory signs in road networks. They can be created all times, depending on
situations such as an informatory sign for guiding a direction. Therefore, informatory
signs are not included in this study.
1.5 Significance of Study
This study will be useful for a replacement approach. Nowadays, there are
many less effective or damaged signs must be maintained on road systems. However,
agencies are limited capacity by budget and time. Therefore, a prioritization approach
is an approach to prioritize traffic sign replacement.

4
1.5 Conceptual Framework
Identification of the problem
Literature review
Formulation of the decision making problem
Pre-screening process
Prioritization of traffic sign replacement
Replacement plan
Hazardous highway location
District area Section
Location of traffic sign
Level of damage of traffic sign
Context of traffic sign Potential causes of traffic accident
Figure 1.1 Conceptual framework

5
Chapter 2
Literature Review
This chapter presents a literature review related to the topic of prioritization
of traffic sign replacement using the analytic network process. Related literatures of
this study are divided into two parts: traffic signs, and prioritization techniques.
2.1 Traffic Signs
Traffic signs or road sings serve many functions such as regulating,
warning, and giving directions and information to road users. The knowledge of traffic
signs is essential, not just for new drivers, but for all road users including experienced
drivers (Department for Transport, 2004).
2.1.1 Traffic sign classification
Traffic signs can be classified into two basic groups: ideogram based
signs, and by text based signs. Ideogram based signs use simple ideographs (graphic
symbol) to convey the meaning, while the text based signs texts or symbols (Paclı́k et
al., 2000). Moreover, traffic signs can be also classified into three groups by their
function or meaning: regulatory signs, warning signs, and informatory signs
(Department for Transport, 2004; Office of transport and traffic policy and planning,
2004; Traffic Engineering and Safety Unit Design Branch, 1997).
2.1.1.1 Regulatory signs
Regulatory signs are signs that present a notice of requirements,
prohibitions, or restrictions. Shapes of regulatory signs include circular, octagonal, and
invert equilateral triangular shape, and may be supplemented by plates beneath them
augmenting the message given by the sign (Department for Transport, 2004).
In Thailand, regulatory signs are classified into three groups –
priority sign, prohibitory or restrictive sign, and mandatory sign – by Office of
Transportation and Traffic Policy and Planning, Ministry of Transport (2004). The

6
regulatory signs in Thailand are shown in Appendix A. Examples of regulatory signs
are shown in Figure 2.1.
(i)
Priority for
oncoming traffic
(ii)
Cycle prohibited
(iii)
Horn prohibited
(iv)
Compulsory
Pedestrian
(v)
Minimum speed
limit
Figure 2.1 Examples of regulatory signs
2.1.1.2 Warning signs
Warning signs are used to warn drivers about potential danger
ahead. A Special group of warning signs is roadwork signs, which are used to alert road
users the temporary traffic management in progress on the road ahead. The shape of
warning signs is diamond. The signs may be supplemented by rectangular shape with
additional information. Normally, warning signs have yellow background with black
symbol. However, the background of roadwork signs that are special signs is orange
with a black symbol (Department for Transport, 2004; Office of transport and traffic
policy and planning, 2004). This study does not consider roadwork signs because they
are temporary sign. After road maintenance is finished, roadwork signs are removed.
In Thailand, Department of Disaster Prevention and Mitigation,
Ministry of Interior (2014), classified warning signs into four groups: curve warning
signs, cross traffic warning signs, situation warning signs, and trailer warning signs.
The warning signs that are considered are shown in Appendix A. Examples of warning
signs are shown in Figure 2.2.

7
(i)
Turn left ahead
(ii)
Dangerous dip
(iii)
End of divided
highway
(iv)
Traffic signal
ahead
(v)
Animal crossing
Figure 2.2 Examples of warning signs
2.1.1.3 Informatory signs
The last group of traffic signs is informatory sign. These signs give
information about routes, places, and facilities to road users. There are two principal
types of informatory signs: directional information signs, and other information signs.
Directional information signs show directions or distances to places, while other
information signs give a variety of information to road users. The shape of informatory
sign is rectangular, while directional information signs commonly have an arrow
(Department for Transport, 2004; Office of transport and traffic policy and planning,
2004).
In Thailand, informatory signs are classified into three groups –
guide signs, information signs, and support signs – by Department of Disaster
Prevention and Mitigation, Ministry of Interior (2014). Because there are many
informatory signs and they are generally less important in terms of safety, therefore,
informatory signs are not be included in this study. However, Examples of informatory
sign are shown in Figure 2.3.
(i)
Hospital
(ii)
Parking
(iii)
Restaurant
(iv)
Gas station
(v)
Destination
Figure 2.3 Examples of informatory signs

8
Summary of traffic sign classification is presented in Table 2.1. The
detail in summary table will be referred to commonly used signs in Thailand. The
purposes, characteristics, and colors of traffic signs are given by Office of Transport
and Traffic Policy and Planning, Ministry of Transport, Thailand (2004).
Table 2.1 Summary of traffic sign classification in Thailand
Regulatory Sign Warning Sign Informatory Sign
Purpose • Prohibition
• Restriction
• Mandatory
• Warning
o Danger
o Special
caution
o Roadwork
• Guidance
o Direction
o Distance
o Place /
Facility
Shape
Background
Color • White
• Blue
• Red
• Yellow
• Orange
• White
• Blue
• Green

9
Regulatory Sign Warning Sign Informatory Sign
Line Color • Red
• White
• Black
• Black • Black
• White
• Brown
Symbol /
Character Color • Black
• White
• Black • Black
• White
• Brown Source: Adapted from Office of Transport and Traffic Policy and Planning, Ministry of Transport,
Thailand, 2004
2.1.2 Traffic sign positioning
Positioning of traffic signs is an importance within roadway networks.
Standardization of traffic sign position is not always attainable, however, because of
the changing roadway geometric conditions and environment (Government of Alberta:
Transportation, 2010). Traffic signs siting along the road in relation to the junction,
hazard, or other feature to which it applies. The placement in relation to the edge of the
carriageway and other features of the cross section (Department for Transportation,
2004).
2.1.3 Traffic sign replacement
Traffic sign replacement is an approach to manage damaged sign.
Because damaged signs effect on drivers’ visibility, and visibility is a factor that is
related to road fatalities. Retroreflectivity is considered as another important factor
which relate to visibility of traffic signs. Retroreflectivity plays an important role to
communicate with drivers during daytime and nighttime. The retroreflective sheeting
deterioration depends on many factors such as materials of sheeting signs, colors of
traffic signs, sheeting age, UV-radiation, pollutants, moisture, and temperature (Carlson
and Lupes, 2007; Office of Transport and Traffic Policy and Planning, 2004; Hummer
et al., 2013; Wen-hong et al., 2013; Black et al., 1992).

10
Moreover, Hummer et al. (2013) presented that the traffic sign
replacement is the largest effect on budget. The authors suggested five methods for a
traffic sign management system:
1) A nighttime visual inspection is to assess the retroreflective
condition of traffic signs.
2) A daytime inspection is to investigate damaged signs.
3) Traffic sign prioritization for replacement by using safety aspect
is to evaluate the important signs.
4) Replacing the old traffic signs with a higher quality traffic sign.
5) Record the information of traffic signs such as the installation
date, type of traffic signs.
Nowadays, there is not specific guidance and practice to replace old
traffic signs with new traffic signs. In practical, traffic signs with defects should be
assessed the condition of the equipment. Office of Transport and Traffic Policy and
Planning (2004) classified the temporary traffic signs (temporary warning signs) by
their condition of the equipment. General, the classification of the conditions of traffic
signs could be applied to use with all damaged traffic signs for assessment. The
condition of traffic signs was classified into three levels: acceptable, marginal, and
unacceptable. Table 2.2 represents the traffic sign assessment guideline.
Table 2.2 Sign condition assessment guide in Europe
Traffic sign illustration Level Definition
• Acceptable • There are some abrasions on
the traffic signs but still
understand the meaning.
• Marginal • There are big abrasions on
the traffic sign, but not large
areas missing.

11
Traffic sign illustration Level Definition
• Unacceptable • The colors of traffic signs
fade/not clear and does not
match the standard color. In
addition sign are damaged
by vehicle hit. Source: Adapted from Department for Transport/Highways Agency et al., 2009
In Thailand, traffic signs are assessed by trained official. There are five
levels to classify the condition of traffic signs: no damage, low level, moderate level,
high level, and extreme level. The guideline for traffic sign assessment in Thailand is
represented in Table 2.3.
Table 2.3 Guideline for traffic sign assessment in Thailand
Damaged level Criteria (Definition)
No damage • Normal
Low level • Low damage of sign, no effects to road users.
Moderate level • The sign will be damaged in the future but currently
has no effect to road users.
High level • Damaged sign, difficult to understand.
Extreme level • Excessively damaged sign, road users almost
cannot see and understand. Source: Adapted from Office of Transport and Traffic Policy and Planning, Ministry of Transport,
Thailand, 2003
In addition, frequency of traffic sign assessment is suggested as every
1 month, every 3 months, and every 6 months. The frequency of traffic sign assessment
is represented in Table 2.4.

12
Table 2.4 Guideline for frequency of traffic sign assessment in Thailand
Period Error of traffic sign
Every 1 month • Dirty sign
• Proper direction of traffic sign installment
• Obscured the vision by the trees
Every 3 months • Vandalism (Damaged sign)
• Retroreflectivity at night
• Deterioration of sign luminance
Every 6 months • Dirty sign (Overhead signs)
• Proper direction (Overhead signs)
• Fade away or unclear message
• Rust on the sign Source: Adapted from Office of Transport and Traffic Policy and Planning, Ministry of Transport,
Thailand, 2003
2.1.4 Traffic sign comprehension
Using symbols or words, traffic signs must provide critical information
to drivers in short time. Therefore, comprehension of traffic sign is important to safe
driving. Poor comprehension of traffic signs increases traffic accident risks. Confusable
traffic signs give more than a meaning to drivers. Assess comprehension of traffic signs
can be assessed by using questionnaires to drivers, which contained short-answer and
multiple-choice questions. Several factors were found significant traffic sign
comprehension such as education level, monthly income level, nationality, gender, age,
urbanization of residence level, years with driving license, and daily driving practice of
drivers (Al-Madani and Al-Janahi, 2002a; Al-Madani and Al-Janahi, 2002b; Ng and
Chan, 2008; Ismali, 2012; Kirmizioglu and Tuydes-Yaman, 2012). The summary of
related literatures of traffic sign comprehension is represented in Table 2.5 below.

13
Table 2.5 Summary of related literatures to traffic sign comprehension
Author Methodology Result
Al-Madani and
Al-Janahi
(2002)a
• Survey questionnaires o Short answer
o Multiple choices
• 28 types of traffic signs o 18 regulatory signs
o 10 warning signs
• Significant variables o Nationality
o Driving experience
o Income
o Education level
o Gender
Al-Madani and
Al-Janahi
(2002)b
• Survey questionnaires o Short answer
o Multiple choices
• 28 types of traffic signs o 18 regulatory signs
o 10 warning signs
• 55% of drivers can correctly
identify the regulatory signs,
and 56% for the warning
signs.
• European and American
drivers have better
understanding of traffic sign
than Asian and Arab drivers.
• Major factors to traffic sign
comprehension o Gender
o Age
o Education level
o Income
Ng and Chan
(2008)
• Survey questionnaires
• 21 types of traffic signs
• Sample size of 109
• Significant variable o Driving experience
o Education level
• Drivers are the highest
understanding on
Pedestrians prohibited sign.
Ismail (2012) • Survey questionnaires o Short answer
o Multiple choices
• 24 types of traffic signs o 8 regulatory signs
o 8 warning signs
• Direct proportion o Level of education
o Level of urbanization of the
residential area
o Driving experience
o Gender

14
Author Methodology Result o 8 guide signs
• Sample size of 1,750 (Male drivers are higher
comprehension level than
female drivers.)
o Vehicle ownership (private car
drivers have higher
comprehension level than
other drivers)
• Inverse proportion o Age
o Number of accident
Kirmizioglu and
Tuydes-Yaman
(2012)
• Survey questionnaires o Open-ended questions
• 39 types of traffic signs
• Sample size of 1,478 o The employees of public
institutions
o Local people
o Driving professional
• Pedestrian Crossing Ahead
sign was the most correctly
identified sign.
• Traffic signs that mixed
comprehension o No through road in the
direction indicated from
junction ahead sign
o Road narrow from left sign
o Motor or non-motorized
vehicles prohibited sign
o End of motorway sign
o Crossroad with a non-priority
road sign
o Dangerous shoulder sign
o Give way sign
o No standing or parking sign
o Sharp deviation of route to the
left sign
• Overall of drivers did not
well-known on traffic signs.
• To increase the traffic sign
comprehension, education
was suggested.

15
2.2 Prioritization Techniques
Prioritization is the essential to make the best approach. It is important
when time and financial are limited and demands are unlimited. Prioritization helps to
manage the time where it is most needed and most wisely spent. A good priority reduce
stress, and move towards a successful conclusion. There are several approaches to
prioritize such as Paired Comparison Analysis, Decision Matrix Analysis, the Action
Priority Matrix, Eisenhower Urgent / Important Principle, The Ansoff Matrix and the
Boston Matrices, Pareto Analysis, and The Modified Borda Count (Mindtools, 2016).
In this study, the Analytic Network Process (ANP) technique was
considered to be a main technique for prioritization the traffic signs. The priority of
ANP technique derives from pairwise comparison matrices. The priority are entered as
parts of the columns of a supermatrix. The supermatrix represents the influence priority
of an element on the left of the matrix on an element at the top of the matrix with respect
to a particular control criterion (Saaty, 2010). In addition for finding the top rank of
hazardous highway location in Thailand, highway location was ranked by using
statistical data from the Department of Highways (DOH) and Principal Component
Analysis (PCA). Therefore, this part, Analytic Network Process (ANP) and Principal
Component Analysis (PCA) will be presented.
2.2.1 Analytic Network Process (ANP)
The Analytic Hierarchy Process (AHP) and Analytic Network Process
(ANP) have found useful applications in decision making. AHP and ANP are basically
a way to measure intangible factors. Pairwise comparison with judgments is used in
these techniques (Saaty, 2010).
The ANP is the generalization of the AHP developed by Saaty. The
ANP is a multicriteria theory of measurement used to obtain relative priority scales
from individual judgments or from actual measurement normalized to a relative form,
that belong to a fundamental scale of absolute numbers. The judgments represent the
relative influence, of one of two elements over the other in a pairwise comparison
process on a third element in the system, with respect to an underlying control criterion.
The ANP combines the result of dependence and feedback within and between clusters

16
of elements, whereas the AHP combines the result with its independence upper levels
from lower levels of elements (Saaty, 2005).
The ANP technique can be divided into four major steps as follows:
(1) model construction of decision making problem, (2) pairwise comparison matrix,
(3) supermatrix formation, and (4) the best alternative selection (Saaty, 2005; Yuksel
and Dagdeviren, 2007; Shiue and Lin, 2012). In pairwise comparison step, Saaty (2010)
suggested a fundamental scale for comparison two components which is presented in
Table 2.6.
Table 2.6 Fundamental scale of relative importance
Intensity of
Importance
Definition Explanation
1 Equal importance Two activities contribute equally
to the objective
2 Weak or slight
3 Moderate importance Experience and judgment slightly
favor one activity over another
4 Moderate plus
5 Strong importance Experience and judgment
strongly favor one activity over
another
6 Strong plus
7 Very strong or
demonstrated importance
An activity is favored very
strongly over another; its
dominance demonstrated in
practice
8 Very, very strong
9 Extreme importance The evidence favoring one
activity over another is of the
highest possible order of
affirmation

17
Intensity of
Importance
Definition Explanation
1.1 – 1.9 When activities are very
close a decimal is added to
1 to show their difference as
appropriate
A better alternative way to
assigning the small decimals is to
compare two close activities with
other widely contrasting ones,
favoring the lager one a little
over the smaller one when using
the 1 – 9 values Source: Saaty, 2010
In many researches, ANP technique could be applied for prioritization
in several field of study. As for example, in physical field, Neaupane and
Piantanakulchai (2006) studied the landslide in Nepal. ANP was applied for landslide
sensitivity, that priority weights for each indicator. Promentilla et al. (2013) applied
ANP to rank the potential CO2 sources and sinks in CO2 capture and storage (CCS)
system. The ranking could identify the best situations for the projects.
In economical field, moreover, Aragonés-Beltrán et al. (2014) applied
both AHP and ANP to study the investment a solar-thermal power plant project. The
study is to determine the order of priority of the projects.
Not only ANP was applied to utilize, but also AHP was utilized. In
study related to road safety, Agarwal et al. (2013) used AHP for ranking the hazardous
locations. The weight, which obtained from AHP, could identify safety factors for road
safety.
2.2.2 Principal Component Analysis (PCA)
The Principal Component Analysis (PCA) is a technique which applied
for determining weight of hazardous highway location in Thailand. PCA is a
multivariate technique used to find the best combination of indicators, which could
describe the variation of original data by means of a smaller set of dimension. The
advantage of the technique is to the weight of indicators, which based on statistical
method rather than subjective judgments. It lets simply the data itself to decide on the

18
weighting issue, which is good from transparency point of view (Al-Haji, 2007).
Eigenvalues in PCA show the majority weight of components, and eigenvectors show
weight of each factors that is used for calculation. PCA is also an approach to identify
significant indicators used for ranking (Al-Haji, 2007; Xiaoyi et al., 2010; Xiaona and
Qicheng, 2014).
The procedure of PCA could be divided into five procedures as follows
(Xiaoyi et al., 2010): (1) defining the basic indicator matrix, (2) normalizing the basic
indicator matrix, (3) determining eigenvalues and eigenvectors, (4) calculation of the
scores, and (5) ranking the scores. The detail of procedure will be presented in the next
chapter.
PCA technique was applied to evaluate indicators in many researches.
For example, as PCA could be determined the weights, therefore, Al-Haji (2007)
applied PCA technique to develop road safety development index (RSDI). Zang et al.
(2010) evaluated third-party logistic enterprises in agricultural product logistic by using
PCA technique. Liu and Xu (2011) applied PCA technique for selecting supplier in
modern automotive industry.

19
Chapter 3
Research Methodology
This study developed a method to prioritize for traffic sign replacement in
Thailand. There are three procedures for prioritization in this study: ranking hazardous
highway locations, linking the context of traffic sings and traffic accident causes, and
weighting the indicators.
3.1 Identification of Hazardous Highway Locations in Thailand
Ranking hazardous highway locations is the first step of this study. This
step identifies the hazardous highway locations for safety improvement on highways.
Historical statistics which included accident rates, death rates, and injury rates were
used as indicators. Two weighting schemes by Department of Highway (DOH) criteria,
and Principal Component Analysis (PCA) – were applied and compared. Rates were
calculated based on exposures in vehicle-kilometers in the analysis.
3.1.1 Department of Highway (DOH) weighting scheme
Nowadays, Department of Highway (DOH) uses its own criteria to
locate hazardous locations on national highway for implementation of road safety
measures by using the traffic accident statistics (Statistical Information Group, 2013).
The criterion gives priority for each indicator as follows: 20% for accident rate, 50%
for death rate, and 30% for injury rate. The weighted score could be written in Equation
1:
Weighted Score = 0.2x1 + 0.5x2 + 0.3x3 (1)
where,
x1 : normalized accident rate
x2 : normalized death rate
x3 : normalized injury rate

20
3.1.2 Principal Component Analysis (PCA)
Principal Component Analysis (PCA) is another technique to locate
hazardous locations on national highway in this study. As mention in 2.2.2, the weight
of indicators in PCA is based on statistical data. Hence, history of traffic accident –
accident rates, death rates, and injury rates – could be applied. The general form of the
principal components is presented in the linear combination of indicators as shown in
Equation 2:
!"# = &'('
)
'*+
where,
PCj : weighted score obtained from principal component j
ai : weight of indicator i
xi : indicator i
p : number of indicators
Procedures of PCA in this study is as follows (Xiaoyi et al., 2010):
1. Defining the basic indicator matrix
Suppose are n highway districts or sections with 3 indicators
(e.g. accident rate, death rate, and injury rate). The basic indicator matrix is defined as:
,- =
(′++ (′+/ (′+0(′/+ (′// (′/0(′0+ (′0/ (′00⋮ ⋮ ⋮
(′2+ (′2/ (′20
(3)
where,
(′ij : indicator j of highway district/section i
(2)

21
2. Normalizing the basic indicators
In this step, each indicator xij is normalized by its mean and
standard deviation (Smith, 2002) as presented in Equation 4.
Which results in the normalized indicator matrix A:
, =
(++ (+/ (+0(/+ (// (/0(0+ (0/ (00⋮ ⋮ ⋮(2+ (2/ (20
(5)
3. Determining eigenvalues and eigenvectors
Eigenvalues are a special set of scalars associated with a
linear system of equations that are also known as characteristic roots (Weisstein, 2014)
which can be obtained by solving the following system of equations.
,3 = 43 (6)
where,
A : normalized indicator matrix
λ : eigenvalue
ν : eigenvector
4. Calculation of weighted score
In this step, principal components that explain most of the
variations (eigenvalues) are chosen. The proportion of explained variations varies by
(4)

22
the magnitude of eigenvalue. Normally, the principal components are chosen such that
total explained variation are summed up to 70% to 90% (Al-Haji, 2007). Subsequently,
a single value (score) is calculated by using the formula below.
5 = 67
7*789:
7*+
(<'7=')'*2
'*+
where,
S : score of highway district/section
67 : weight calculated by proportion of eigenvalue of the component to the total
sum of eigenvectors considered
<'7 : component i of eigenvector of principal component K
Xi : normalized indicator i
K : index of the principal component
Kmax : number of principal component used in the analysis which could explain
more than 80% of total variance
i : index of indicator
N : number of indicators considered
5. Rank the score in the final step
For this study, the calculations were programmed using MATLAB to
find eigenvalues and eigenvectors in PCA.
3.2 Traffic Sign Classification by Linking the Context of Traffic Signs and Traffic
Accident Causes
There are several causes of traffic accident on road networks. Five
categories of traffic accident causes related to traffic signs - speeding, road way
channelization, overtaking, hazardous road conditions, and causes related to pedestrians
and animals - are considered in this study. This part presents a methodology to identify
(7)

23
the importance of traffic signs by linking the context of traffic signs and traffic accident
causes by drivers’ comprehension.
3.2.1 Data collection
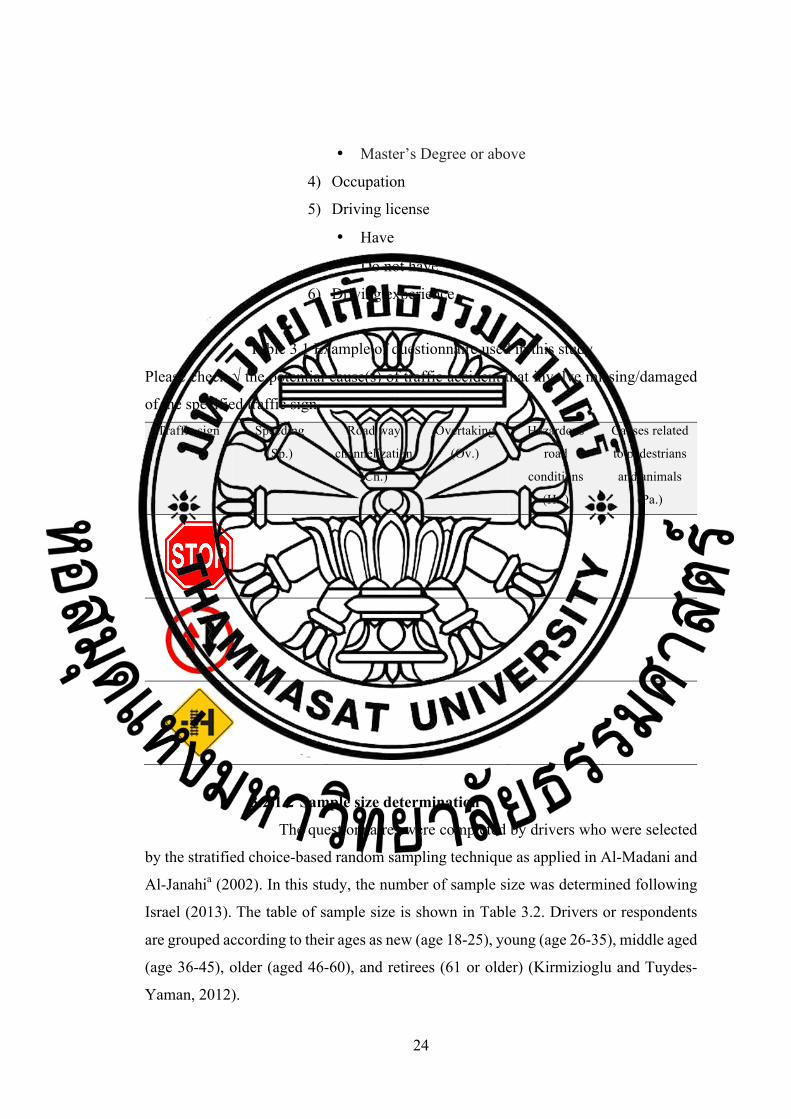
3.2.1.1 Questionnaire preparation
Questionnaires were used in the data collection. These contain 40
regulatory signs and 51 warning signs commonly used in Thailand. The questionnaire
consists of two main parts: multiple-choice and short-answer questions. The
questionnaire is presented in Appendix B, and the example of the questionnaire is
shown in Table 3.1.
1. Multiple-choice questions
The multiple-choice question part was designed to evaluate
the linkage of the context of traffic signs and potential causes of traffic accident (if the
sign is missing or damaged) perceived by drivers. There are five indicators for this part:
1) Speeding
2) Road way channelization
3) Overtaking
4) Hazardous road condition (Slippery road, narrow road,
etc.)
5) Human and animal (School area, Animal area, etc.)
2. Short-answer questions
Personal information of respondent was asked in this part. The indicators of the questions are shown as following:
1) Gender
• Male
• Female
2) Age
3) Educational level
• Middle school
• High school or Vocational certificate
• Vocational Diploma
• Bachelor’s Degree
24
• Master’s Degree or above
4) Occupation
5) Driving license
• Have
• Do not have
6) Driving experience
Table 3.1 Example of questionnaire used in this study
Please check √ the potential cause(s) of traffic accident that involve missing/damaged
of the specified traffic sign Traffic sign Speeding
(Sp.)
Road way
channelization
(Ch.)
Overtaking
(Ov.)
Hazardous
road
conditions
(Hr.)
Causes related
to pedestrians
and animals
(Pa.)
√ √
√ √
3.2.1.2 Sample size determination
The questionnaires were completed by drivers who were selected
by the stratified choice-based random sampling technique as applied in Al-Madani and
Al-Janahia (2002). In this study, the number of sample size was determined following
Israel (2013). The table of sample size is shown in Table 3.2. Drivers or respondents
are grouped according to their ages as new (age 18-25), young (age 26-35), middle aged
(age 36-45), older (aged 46-60), and retirees (61 or older) (Kirmizioglu and Tuydes-
Yaman, 2012).

25
Table 3.2 Sample size for ±3%, ±5%, ±7%, and ±10% precision levels where
confidence level if 95% and P = 0.5
Source: Israel, 2013
In Thailand, October 2015, the number of driving licenses and
transport personnel licenses is 29,997,028. 10% precision (e) levels was considered,
therefore the sample size (n) is 100 in this study.
Size of
population
Sample size (n) for precision (e) of
±3% ±5% ±7% ±10%
500 a 222 145 83
600 a 240 152 86
700 a 255 158 88
800 a 267 163 89
900 a 277 166 90
1,000 a 286 169 91
2,000 714 333 185 95
3,000 811 353 191 97
4,000 870 364 194 98
5,000 909 370 196 98
6,000 938 375 197 98
7,000 959 378 198 99
8,000 976 381 199 99
9,000 989 383 200 99
10,000 1,000 385 200 99
15,000 1,034 390 201 99
20,000 1,053 392 204 100
25,000 1,064 394 204 100
50,000 1,087 397 204 100
100,000 1,099 398 204 100
>100,000 1,111 400 204 100

26
3.2.2 Relevance of traffic signs and causes of traffic accidents
The degree of relevancy between the context of traffic signs and causes
of traffic accident are calculated by using Equation 8.
?'# =('#
where,
R@j : degree of relevancy of missing/damaged of traffic sign j to the potential
cause of traffic accident i
xij : number of respondents who match the missing/damaged of traffic sign j to
potential cause of accident i
i : potential cause of traffic accident i (1 = speeding, 2 = channelization,
3 = overtaking, 4 = hazardous road condition, and 5 = causes related to
pedestrians and animals)
j : traffic sign type j
3.3 Traffic Sign Prioritization
The final step of this study is the prioritization of traffic sign replacement.
Analytic Network Process (ANP) was used in the prioritizing process. Locations of
traffic sign, levels of damaged sign, and traffic accident causes were considered as
criteria.
3.3.1 Questionnaire preparation and data collection
Questionnaires were used as a research tool to collect data. The
questionnaires were completed by three experts (two experts from the Department of
Highway, and one expert from the university). Questionnaire consists of three parts:
expert information, pairwise comparison of the clusters, and evaluation the level of
elements of each cluster (Appendix C). The questionnaires were as followings:
A('#
2
'*+
(8)

27
1. Part I: Expert information
1) Gender
• Male
• Female
2) Age
3) Educational level
• High school
• Bachelor’s Degree
• Master’s Degree or above
4) Organization and position
5) Experience (years)
2. Part II and III: Evaluation the criterions and elements
The questionnaire of part II and III was designed for analysis the
prioritization of traffic signs. To solve the problem, Analytic Network Process (ANP)
was used in this step. A decision problem that is analyzed with the ANP is often through
a control hierarchy or network. A decision network has clusters, elements, and links. A
cluster is a collection of relevant elements within a network or sub-network. Each
control criterion, the clusters of the system with their elements are determined. (Bayazit,
2002).
In this study, there are three clusters - physical locations of traffic
sign, levels of damaged sign, and causes of traffic accident - and each of cluster consists
of elements. Generally, ANP uses pairwise comparisons. However, to reduce the
complexity of the interview, pairwise comparisons were used in the comparisons of
criteria, while scorings using the Likert scale were used in the comparisons of elements.
ANP uses the fundamental scale (1-9), normally, the comparison
scale enables the decision-maker to incorporate experience and knowledge and indicate
how many times an element dominates another with respect to the criterion. It is a scale
of absolute numbers (Bayazit, 2002). Never the less, in this study, the comparison scale
of 1-5 were used. The definition of comparison scale used for decision-maker
judgments is given in Table 3.3.

28
Table 3.3 The definition of comparison scale
Intensity of
Importance
Definition Explanation
1
2
3
4
5
Equal importance
Moderate importance
Strong importance
Very strong or
demonstrated importance
Extreme importance
Two activities contribute equally to
the objective
Experience and judgement slightly
favor one activity over another
Experience and judgement strongly
favor one activity over another
An activity is favored very strongly
over another; its dominance
demonstrated in practice
The evidence favoring one activity
over another is of the highest
possible order of affirmation * Source: Adapted from Saaty, 2010
To compare elements in each cluster, the Likert scale was used in
this step. The definition of the Likert scale used for judgments is given in Table 3.4.
Table 3.4 The definition of the Likert scale
Very high High Moderate Low Very low
5 4 3 2 1
3.3.2 Analytic Network Process (ANP) procedure
ANP is a methodology which applied to evaluate for prioritization
traffic signs in this study. Refer to Saaty (2005), there are four main stages which were
applied, described below:
1. Structuring of the decision-making problems
There are three clusters and each of clusters consists of elements:
eight elements in physical locations of traffic sign, three elements of levels of damaged

29
sign, and five elements of traffic accident causes. To easily understand, the criterions
and their elements can be grouped as clusters, it is shown in Figure 3.1.
Cluster
Element
Inter-dependence relation between clusters
Inter-dependence relation between elements in the cluster
Figure 3.1 Structure of the ANP in this study
Levels of damage of sign*
…..
Low level
Moderate level
High level
Location of traffic sign
Straight
Curve
Railway
Slope/Bridge
+ Intersection
T Intersection
Y Intersection
Roundabout The context of traffic
sign
Speeding
Road way channelization
Pedestrians and animals
Overtaking
Hazardous road condition
* Levels of damage of sign
Low level
- Dirty sign
Moderate level
- Damage sign,
Less retroreflectivity
High level
- Fade away or
Unclear message
30
2. Making pairwise comparison and the Likert scale questionnaire
The series of pairwise comparison were made to find the relative
importance of the elements with respect to a component of the network (Bottero et al.,
2007). In this study, pairwise comparison of clusters (physical locations of traffic sign,
levels of damaged sign, and causes of traffic accident) were used by using a ratio scale
of 1 to 5 as given in Table 3.3. There are three series of cluster comparison:
• Physical locations of traffic sign – Levels of damaged sign
• Physical locations of traffic sign – Traffic accident causes
• Levels of damaged sign – Traffic accident causes
3. Supermatrix formation
Figure 3.2 General structure of the supermatrix
where,
Ci the ith cluster that has j elements
Wij a priority vector calculated from the priority vector of the clusters multiple by
the normalized priority vector of the elements, representing the importance of
the elements in the ith cluster on an element in the jth cluster.
* If there is no relationship between clusters, the corresponding matrix segment is a
zero. * Source: Neaupane and Piantanakulchai, 2006

31
The priority vectors derived from the questionnaire part II and III
were entered into columns of a supermatrix. The general stricter of a supermatrix is
shown in Figure 3.2. In this study, there are two types of the technique for data
collection (pairwise comparison, and the Likert scale). Therefore, the priority vector of
the element which obtained in part III of the questionnaire must be normalized. The
supermatrix is transformed into weighted which the sum of each column is one.
4. Final priority
The last step, the weighted supermatrix (Wij) is transformed into
the limiting supermatrix. The calculation of the limit supermatrix is given in equation
(9).
limE→G
6E
If the supermatrix has the effect of cyclicity, there may be two or
more N limiting supermatrices. In this case, the Cesaro sum is calculated as in Eq. (10)
to get the average priority weights as follows (Neaupane and Piantanakulchai, 2006):
limE→G
1I 6'
E
For this study, the calculations were programmed using MATLAB
to find the limit supermatrix.
i =1
N
(10)
(9)

32
Chapter 4
Prioritization of Traffic Sign Replacement
Due to time and budget limitation, prioritization of traffic sign replacement
is necessary. In this study, physical locations of traffic signs, levels of damaged signs,
and traffic sign classifications (the context of traffic sign) are considered as indicators
for prioritization. Because the prioritization of all traffic signs in the country is not
practical due to excessive number of traffic signs to be considered. Identification
hazardous locations by ranking is the first important step. This chapter presents the
results of ranking of hazardous highway location/section and the results of ANP
weights.
4.1 Hazardous Highway Location Ranking
History of traffic accidents on national highway in Thailand - accident
rates, death rates, and injury rates - were used as indicators to identify an accident
location or hazardous location. Aside from accident related indicators, transportation
indicators such as traffic volume is also considered as a significant indicator. The
growing number of vehicles and traffic volume, besides a low culture of road users,
enhances the risk of accident (Pakalnis et al., 2003).
Currently, in Thailand, the Department of Highways (DOH) uses accident
statistics to rank hazardous locations on national highways by assigning weights to
accident rate, death rate, and injury rate (Statistical Information Group, 2013). Another
methodology to find weights of each factors is Principal Component Analysis (PCA).
Eigenvalues in PCA show the majority weight of components, and eigenvectors show
weight of each factors that is used for calculation. PCA is also an approach to identify
significant indicators used for ranking (Xiaona and Qicheng, 2014; Al-Haji, 2007;
Xiaoyi et al., 2010).
The identification of hazardous highway locations is the important first step
for highway safety improvement. The accident rate, accident severity, and a newly
developed combination are applied as a methodology - weights given by DOH and

33
weights derived from Principal Component Analysis (PCA) - to determine the worst
locations in this chapter. Moreover, two methods are compared in this part.
4.1.1 Hazardous highway district area ranking
The data set of 105 highway districts which highlighted by DOH as
top hazardous location are obtained from Traffic Accident on National Highway annual
report by DOH in 2011 – 2014.
The correlation matrix of indicators by district areas is shown in Table
4.1. For each highway district the average accident rate, the death rate, and the injury
rate were compiled from most recent four years data. The correlation matrix shows that
indicators used in the analysis are moderately to highly correlated.
Table 4.1 Correlation matrix of indicators by district areas
Indicator Accident rate Death rate Injury rate
Accident rate 1 0.53 0.82
Death rate 1 0.79
Injury rate 1
Hazardous highway district areas ranking by using DOH criteria is
calculated based on the weighted score formula shown in Equation 1. The results of the
ranking based on the calculated weighted scores are given in Table 4.3. In part of the
hazardous highway district areas ranking by using PCA were determined to calculate.
The result as the analysis is shown in Table 4.2.
Table 4.2 Eigenvalue, proportion and eigenvector of each principal component
(district area)
Principle
components Eigenvalue
Proportion
(%)
Eigenvector
v1 v2 v3
PC1
PC2
PC3
2.43
0.47
0.09
81.07
15.68
3.26
0.56
-0.68
-0.47
0.55
0.73
-0.40
0.62
-0.40
0.78

34
Only the first principal component was considered from the result as
could explain more than 80% (81.07%) of total variance. The score for the first
principal component is shown in Equation 1.
PC1 = 0.56X1 + 0.55X2 + 0.62X3 (1)
From Equation 1, could adjusted to be the final equation of PCA. The
equation is given as;
PCA = 0.32X1 + 0.32 X2 + 0.36X3 (2)
The results of ranking of hazardous highway district area ranking by
using PCA is identical with ranking by DOH criteria. From 105 highway districts,
Phatthalung is the top on the rank. Whereas, the second rank to the tenth rank were
switched. The ranking is shown in Table 4.3. Moreover, the top ranking results from
both methods are almost the same set of highway districts.
Table 4.3 Comparison of ranking results for hazardous highway district areas
District area Ranking
DOH criteria PCA
Phatthalung
Chanthaburi
Uthai Thani
Phrae
Tak 1
Loei 2
Prachin Buri
Uttaradit 1
Songkhla 2
Nakhon Sawan
Samut Sakhon
1
2
3
4
5
6
7
8
9
10
11
1
3
2
4
7
6
10
9
8
11
5

35
4.1.2 Hazardous highway section ranking
This section data consist of 38 hazardous highway sections reported by
DOH. Due to the limited data, the reports in 2011 – 2014 are used for hazardous
highway district areas ranking, and the ranking of hazardous highway sections used the
data form the report in 2013.
The correlation matrix of indicators by highway sections is shown in
Table 4.4. The result of correlation is similar to the result derived by using highway
district data which indictors show moderate to high level of correlation.
Table 4.4 Correlation matrix of indicators by highway sections
Indicator Accident rate Death rate Injury rate
Accident rate 1 0.48 0.80
Death rate 1 0.70
Injury rate 1
The result of ranking by using DOH criteria for highway sections is
shown in Table 3.6. Wang Chao – Tak being on the top ranking for the hazardous
highway section. In section of the hazardous highway section ranking by using PCA is
estimated to calculate the eigenvalues, proportions and eigenvectors of each PC. The
result of the analysis is shown in Table 4.5.
Table 4.5 Eigenvalue, proportion and eigenvector of each principal component
(by sections)
Principle
components Eigenvalue
Proportion
(%)
Eigenvector
v1 v2 v3
PC1
PC2
PC3
1.84
0.89
0.26
61.46
29.81
8.73
0.58
-0.57
-0.58
0.45
0.82
-0.36
0.68
-0.05
0.73
In this part, first and the second principal components are considered
because they could explain more than 80% (95.33%) of total variance. In this case, the
calculation of total scores should include two principal components.

36
PC1 = 0.58X1 + 0.45X2 + 0.68X3 (3)
PC2 = - 0.57X1 + 0.82X2 – 0.36X3 (4)
From PC1 and PC2, the combined equation of PCA is given as;
PCA = 0.17X1 + 0.47X2 + 0.36X3 (5)
The first ranking of hazardous highway section ranking by using DOH
criteria and PCA has identical results while the first rank switch place with the second
rank. The comparison of hazardous highway section ranking by using DOH criteria and
PCA is shown in Table 4.6.
Table 4.6 Comparison of ranking results for hazardous highway sections
District area Ranking
DOH criteria PCA
Wang Chao - Tak
Huai Sai -Phru Pho
Pa Tian - Ban Sio
Samut Sakhon - Bang Bon
Samae Dam - Tha Chin Bridge (West)
Sra Phang - Khao Wang
Om Noi - Samut Sakhon
Krathum Lom - Phutthamonthon
Tan Diao - Sap Bon
Phra Nang Klao Bridge - Bang Yai
Interchange
1
2
3
4
5
6
7
8
9
10
2
1
3
4
5
7
6
8
9
10
4.1.3 Weighted score comparison
To identify hazardous highway locations in Thailand, both DOH
criteria and PCA techniques are applied. The results of two techniques would be
compared and shown as below.
37
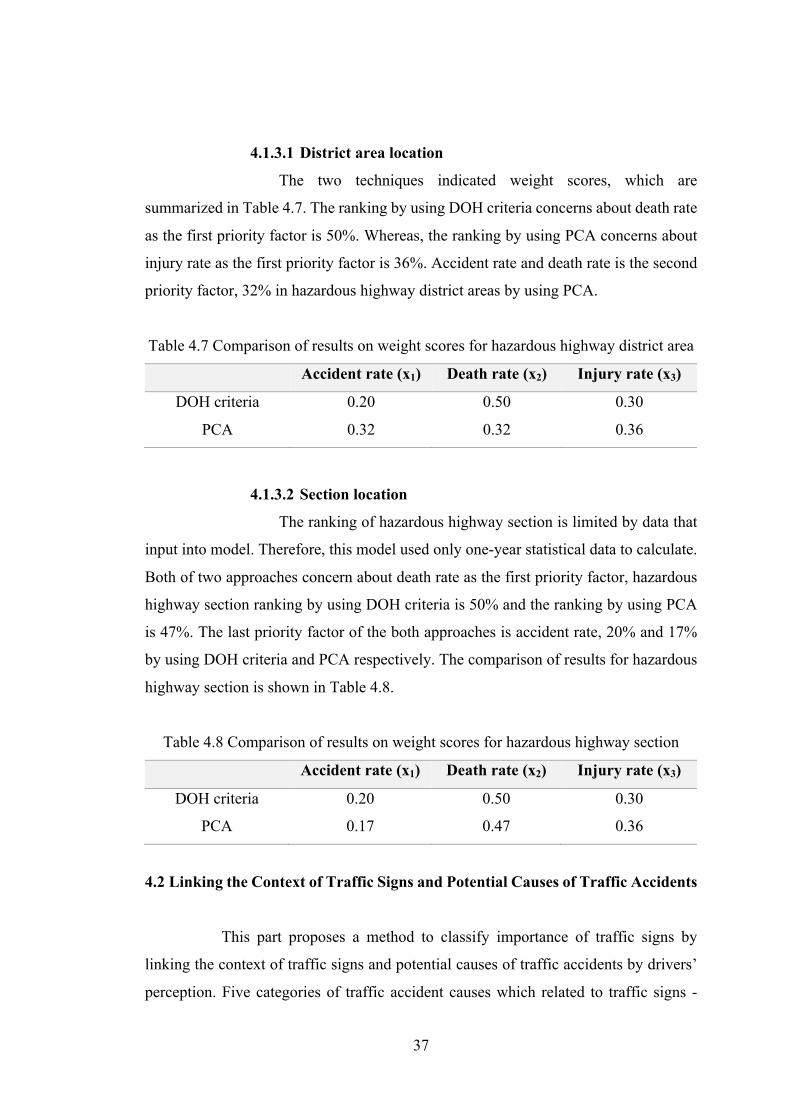
4.1.3.1 District area location
The two techniques indicated weight scores, which are
summarized in Table 4.7. The ranking by using DOH criteria concerns about death rate
as the first priority factor is 50%. Whereas, the ranking by using PCA concerns about
injury rate as the first priority factor is 36%. Accident rate and death rate is the second
priority factor, 32% in hazardous highway district areas by using PCA.
Table 4.7 Comparison of results on weight scores for hazardous highway district area
Accident rate (x1) Death rate (x2) Injury rate (x3)
DOH criteria 0.20 0.50 0.30
PCA 0.32 0.32 0.36
4.1.3.2 Section location
The ranking of hazardous highway section is limited by data that
input into model. Therefore, this model used only one-year statistical data to calculate.
Both of two approaches concern about death rate as the first priority factor, hazardous
highway section ranking by using DOH criteria is 50% and the ranking by using PCA
is 47%. The last priority factor of the both approaches is accident rate, 20% and 17%
by using DOH criteria and PCA respectively. The comparison of results for hazardous
highway section is shown in Table 4.8.
Table 4.8 Comparison of results on weight scores for hazardous highway section
Accident rate (x1) Death rate (x2) Injury rate (x3)
DOH criteria 0.20 0.50 0.30
PCA 0.17 0.47 0.36
4.2 Linking the Context of Traffic Signs and Potential Causes of Traffic Accidents
This part proposes a method to classify importance of traffic signs by
linking the context of traffic signs and potential causes of traffic accidents by drivers’
perception. Five categories of traffic accident causes which related to traffic signs -

38
speeding, road way channelization, overtaking, hazardous road conditions, and causes
related to pedestrians and animals - are considered. Results of study show distribution
of related causes of traffic accidents which are relevant to each sign.
4.2.1 Background
Traffic sign comprehension is critical for effective driving. The driver
comprehension process will have increased by level of education, level of urbanization
of the residence, and driving daily practice of drivers (Ismali, 2012). The majority of
causes of traffic accidents are due to driver mistakes and traffic violations. One major
factor affecting safe driving is the comprehensibility of traffic signs by drivers
(Kirmizioglu and Tuydes-Yaman, 2012).
The drivers’ comprehension of traffic sings are able to understand and
correctly identify 50 - 60% of the signs. Education, gender, income, and nationality
have significant effect to understanding (Al-Madani and Al-Janahia, 2002).
Furthermore, another study by Al-Madani and Al-Janahib (2002), role of drivers’
personal characteristic in understanding traffic sign symbols. The study showed that
percentage of correctly response to the signs by drivers is low. Middle-aged drivers (35
- 44 years) understand the signs significantly well than other groups.
4.2.2 Descriptive statistics
Questionnaires (Appendix B) were distributed to 124 drivers. The
gender distribution is 53.23% female and 46.77% male, and the young age group (26-
35) is the majority of respondents.
Table 4.9 Summary of driver characteristics (%) Age Group Educational Background Driving Experience
Secondary
School
Bachelor’s
Degree
Master’s
Degree or
Higher
1-5
years
6-10
years
11-15
years
Over 16
years
18-25 0.81 21.77 6.45 22.58 6.45 - -
26-35 0.00 12.90 8.06 12.10 6.45 2.42 -
36-45 0.81 20.16 8.06 1.61 7.26 12.90 7.26
46-60 2.42 10.48 4.03 0.00 0.00 5.65 11.29
61 and over 0.81 3.23 0.00 0.00 0.00 0.00 4.03

39
4.2.3 Relevance of traffic signs and potential causes of traffic accident
The results present drivers’ comprehension of relevancies between
traffic signs and traffic accident causes. In this study, only regulatory signs and warning
signs were selected for analysis. Five potential causes of traffic accident are considered
– speeding (Sp.), road way channelization (Ch.), Overtaking (Ov.), Hazardous road
condition (Hr.), and causes related to pedestrians and animals (Pa.).
Selected 91 traffic signs consist of 40 regulatory signs and 51 warning
signs. Examples of results selected from the highest relevancies in each potential cause
of traffic accident are shown in Table 4.10, and whole results are shown in Appendix
A.
The results can be interpreted as, for example, missing/damaged minimum
speed limit sign has the highest degree of relevancy to the speeding. Interpretation in
case of other signs can be done in similar way.
Table 4.10 Examples of results:
potential causes of traffic accident when the traffic sign is missing/damaged
Traffic sign Degree of relevancy Potential cause of traffic accident
Sp. Ch. Ov. Hr. Pa.
Minimum speed limit
0.60* 0.09 0.10 0.09 0.14
Left/Right turn prohibited
0.06 0.73* 0.07 0.09 0.05
0
0.4
0.8
Sp.
Ch.
Ov.
Hr.
Pa.
0
0.4
0.8
Sp.
Ch.
Ov.
Hr.
Pa.

40
Traffic sign Degree of relevancy Potential cause of traffic accident
Sp. Ch. Ov. Hr. Pa.
Overtaking prohibited
0.23 0.23 0.43* 0.10 0.01
Beware of fallen rocks
0.30 0.09 0.08 0.53* 0.00
Animal crossing
0.33 0.09 0.09 0.02 0.47*
* The highest degree of relevancy
Further analysis shows that the context of regulatory signs are mostly
related to channelization, while the context of warning signs are mostly related to
speeding.
0
0.4
0.8
Sp.
Ch.
Ov.
Hr.
Pa.
0
0.4
0.8
Sp.
Ch.
Ov.
Hr.
Pa.
0
0.4
0.8
Sp.
Ch.
Ov.
Hr.
Pa.

41
Figure 4.1 Comparison of the context of regulatory signs and warning signs related to
potential causes of traffic accident
4.3 Prioritization of Traffic Sign Replacement
In this section, an approach to priority traffic signs for replacement will be
presented. Data analysis were followed the ANP technique. Physical locations of traffic
signs, levels of damaged signs, and traffic accident causes that related with the context
of traffic sign (classification of traffic sign) are considered as indicators.
In order to data collection, face-to-face interviews were conducted by three
selected experts with a transportation background. Their personal profiles are shown in
Table 4.11.
Table 4.11 Personal profile of experts
Expert Educational level Experience
(years)
Career and Organization
1 Bachelor’s Degree 29 Government officer
Department of Highway, Thailand
2 Bachelor’s Degree 5 Government officer
Department of Highway, Thailand
3 Master’s Degree
or above
15 Lecturer/Researcher
University
01020304050
Speeding (Sp.) Channelization (Ch.)
Overtaking (Ov.) Hazardous road condition (Hr.)
Causes related to pedestrians and animals (Pa.)
Perc
enta
ge
Regulatory signs Warning sings

42
As earlier mentioned in section 3.3, pairwise comparison method was
selected to evaluate criteria, and ranking by the Likert scale was selected for elements.
In making paired comparisons of clusters, ratios were evaluated by using a 1 to 5
fundamental scale as given in Table 3.3 to compare two criteria with respect to an
attribute. The paired comparisons for every pair are shown in Table 4.12 to 4.20 –
criteria judgments with respect to physical location of traffic sign, level of damage of
sign, and the context of traffic sign.
The pairwise comparisons with respect to location of traffic sign criteria
are shown in Table 4.12 – 4.14. The first and the third experts considered that level of
damage of sign criteria and the context of traffic sign criteria are equal importance.
While, the second expert considered that the context of traffic sign criteria is very
stronger or demonstrated important than level of damage of sign criteria.
Table 4.12 Pairwise comparison of the first expert: location of traffic sign Location of traffic sign Level of damage of
sign
The context of
traffic sign
Priorities
Level of damage of sign 1/1 1/1 0.50
The context of traffic sign 1/1 1/1 0.50
Table 4.13 Pairwise comparison of the second expert: location of traffic sign Location of traffic sign Level of damage of
sign
The context of
traffic sign
Priorities
Level of damage of sign 1/1 1/4 0.20
The context of traffic sign 4/1 1/1 0.80
Table 4.14 Pairwise comparison of the third expert: location of traffic sign Location of traffic sign Level of damage of
sign
The context of
traffic sign
Priorities
Level of damage of sign 1/1 1/1 0.50
The context of traffic sign 1/1 1/1 0.50
The paired comparisons with respect to level of damage of sign are shown
in Table 4.15 – 4.17. The considering of the first expert, the context of traffic sign
criteria is more extremely important than physical location of traffic sign. The second

43
expert the context of traffic sign criteria is stronger important than physical location of
traffic sign. Nevertheless, the third expert considered that the both criteria are equal
importance.
Table 4.15 Pairwise comparison of the first expert: Level of damage of sign Level of damage of sign Location of traffic
sign
The context of
traffic sign
Priorities
Location of traffic sign 1/1 1/5 0.17
The context of traffic sign 5/1 1/1 0.83
Table 4.16 Pairwise comparison of the second expert: Level of damage of sign Level of damage of sign Location of traffic
sign
The context of
traffic sign
Priorities
Location of traffic sign 1/1 1/4 0.20
The context of traffic sign 4/1 1/1 0.80
Table 4.17 Pairwise comparison of the third expert: Level of damage of sign Level of damage of sign Location of traffic
sign
The context of
traffic sign
Priorities
Location of traffic sign 1/1 1/1 0.50
The context of traffic sign 1/1 1/1 0.50
The comparisons with respect to the context of traffic sign (traffic accident
causes related with the context of traffic sign) are shown in Table 4.18 – 4.20.
Considering of the first and the third expert is different, which the first expert
considered level of damage of sign criteria as the first priority while the second expert
considered physical location of traffic sign as the first priority. Nevertheless, the third
expert still considered that the both criteria are equal importance.
Table 4.18 Pairwise comparison of the first expert: The context of traffic sign The context of traffic sign Location of traffic
sign
Level of damage of
sign
Priorities
Location of traffic sign 1/1 1/3 0.25
Level of damage of sign 3/1 1/1 0.75

44
Table 4.19 Pairwise comparison of the second expert: The context of traffic sign The context of traffic sign Location of traffic
sign
Level of damage of
sign
Priorities
Location of traffic sign 1/1 3/1 0.75
Level of damage of sign 1/3 1/1 0.25
Table 4.20 Pairwise comparison of the third expert: The context of traffic sign The context of traffic sign Location of traffic
sign
Level of damage of
sign
Priorities
Location of traffic sign 1/1 1/1 0.50
Level of damage of sign 1/1 1/1 0.50
The Linkert scale method were used to evaluate the elements with each
respect cluster. The priority vectors that are normalized from the Linkert scale method
present in the appropriate column of the initial supermatrix (Table 4.21 to 4.23). Then,
the priority weights obtained from the ANP model were multiplied with the cell
attributes (weighted score of elements in each cluster multiply by priority of each
criteria which respect to each attribute). The weighted supermatrix are presented in
Table 4.24 to 4.26. Generated the limiting supermatrix presented in Table 4.27 to 4.29.

45
Table 4.21 Initial supermatrix: The first expert
Initial Physical location of traffic sign
Level of damage of
sign The context of traffic sign
P1 P2 P3 P4 P5 P6 P7 P8 L1 L2 L3 C1 C2 C3 C4 C5
Phys
ical
loca
tion
of tr
affic
sign
P1 0.0000 0.0000 0.0000 0.0000 0.0000 0.0000 0.0000 0.0000 0.1250 0.1304 0.1333 0.1316 0.0345 0.0789 0.1000 0.1515
P2 0.0000 0.0000 0.0000 0.0000 0.0000 0.0000 0.0000 0.0000 0.1875 0.1739 0.1667 0.1053 0.0690 0.1316 0.1333 0.1212
P3 0.0000 0.0000 0.0000 0.0000 0.0000 0.0000 0.0000 0.0000 0.1875 0.1739 0.1667 0.1053 0.0345 0.1316 0.1000 0.1515
P4 0.0000 0.0000 0.0000 0.0000 0.0000 0.0000 0.0000 0.0000 0.1250 0.1304 0.1333 0.1316 0.1724 0.1316 0.1333 0.1515
P5 0.0000 0.0000 0.0000 0.0000 0.0000 0.0000 0.0000 0.0000 0.1250 0.1304 0.1333 0.1316 0.1724 0.1316 0.1333 0.1515
P6 0.0000 0.0000 0.0000 0.0000 0.0000 0.0000 0.0000 0.0000 0.1250 0.1304 0.1333 0.1316 0.1724 0.1316 0.1333 0.1515
P7 0.0000 0.0000 0.0000 0.0000 0.0000 0.0000 0.0000 0.0000 0.0625 0.0870 0.1000 0.1316 0.1724 0.1316 0.1333 0.0606
P8 0.0000 0.0000 0.0000 0.0000 0.0000 0.0000 0.0000 0.0000 0.0625 0.0435 0.0333 0.1316 0.1724 0.1316 0.1333 0.0606
Lev
el o
f da
mag
e of
sig
n
L1 0.2222 0.2500 0.2500 0.2222 0.2222 0.2222 0.1667 0.3333 0.0000 0.0000 0.0000 0.2222 0.2222 0.2500 0.2222 0.2222
L2 0.3333 0.3333 0.3333 0.3333 0.3333 0.3333 0.3333 0.3333 0.0000 0.0000 0.0000 0.3333 0.3333 0.3333 0.3333 0.3333
L3 0.4444 0.4167 0.4167 0.4444 0.4444 0.4444 0.5000 0.3333 0.0000 0.0000 0.0000 0.4444 0.4444 0.4167 0.4444 0.4444
The
con
text
of
traf
fic s
ign
C1 0.2941 0.2105 0.2222 0.2083 0.2083 0.2083 0.2381 0.2381 0.1818 0.1875 0.1905 0.0000 0.0000 0.0000 0.0000 0.0000
C2 0.0588 0.1053 0.0556 0.2083 0.2083 0.2083 0.2381 0.2381 0.1818 0.1875 0.1905 0.0000 0.0000 0.0000 0.0000 0.0000
C3 0.1765 0.2632 0.2778 0.2083 0.2083 0.2083 0.2381 0.2381 0.2727 0.2500 0.2381 0.0000 0.0000 0.0000 0.0000 0.0000
C4 0.1765 0.2105 0.1667 0.1667 0.1667 0.1667 0.1905 0.1905 0.1818 0.1875 0.1905 0.0000 0.0000 0.0000 0.0000 0.0000
C5 0.2941 0.2105 0.2778 0.2083 0.2083 0.2083 0.0952 0.0952 0.1818 0.1875 0.1905 0.0000 0.0000 0.0000 0.0000 0.0000

46
Table 4.22 Initial supermatrix: The second expert
Initial Physical location of traffic sign
Level of damage of
sign The context of traffic sign
P1 P2 P3 P4 P5 P6 P7 P8 L1 L2 L3 C1 C2 C3 C4 C5
Phys
ical
loca
tion
of tr
affic
sign
P1 0.0000 0.0000 0.0000 0.0000 0.0000 0.0000 0.0000 0.0000 0.1250 0.1600 0.1600 0.1923 0.1250 0.1923 0.1316 0.1786
P2 0.0000 0.0000 0.0000 0.0000 0.0000 0.0000 0.0000 0.0000 0.1875 0.1600 0.1600 0.1154 0.0833 0.1154 0.1316 0.1071
P3 0.0000 0.0000 0.0000 0.0000 0.0000 0.0000 0.0000 0.0000 0.1250 0.0800 0.0800 0.1154 0.1250 0.1154 0.1316 0.1071
P4 0.0000 0.0000 0.0000 0.0000 0.0000 0.0000 0.0000 0.0000 0.1250 0.1200 0.1200 0.1154 0.1250 0.1154 0.1316 0.1429
P5 0.0000 0.0000 0.0000 0.0000 0.0000 0.0000 0.0000 0.0000 0.1250 0.1200 0.1200 0.1154 0.1250 0.1154 0.1316 0.1429
P6 0.0000 0.0000 0.0000 0.0000 0.0000 0.0000 0.0000 0.0000 0.1250 0.1200 0.1200 0.1154 0.1250 0.1154 0.1316 0.1429
P7 0.0000 0.0000 0.0000 0.0000 0.0000 0.0000 0.0000 0.0000 0.1250 0.1200 0.1200 0.1154 0.1250 0.1154 0.0789 0.0714
P8 0.0000 0.0000 0.0000 0.0000 0.0000 0.0000 0.0000 0.0000 0.0625 0.1200 0.1200 0.1154 0.1667 0.1154 0.1316 0.1071
Lev
el o
f da
mag
e of
sig
n
L1 0.2000 0.2727 0.3333 0.2500 0.2500 0.2500 0.2500 0.1429 0.0000 0.0000 0.0000 0.2222 0.1667 0.1667 0.2222 0.2500
L2 0.4000 0.3636 0.3333 0.3750 0.3750 0.3750 0.3750 0.4286 0.0000 0.0000 0.0000 0.3333 0.3333 0.3333 0.3333 0.3333
L3 0.4000 0.3636 0.3333 0.3750 0.3750 0.3750 0.3750 0.4286 0.0000 0.0000 0.0000 0.4444 0.5000 0.5000 0.4444 0.4167
The
con
text
of
traf
fic s
ign
C1 0.2174 0.1875 0.1765 0.1667 0.1667 0.1667 0.2143 0.1364 0.2222 0.2143 0.2105 0.0000 0.0000 0.0000 0.0000 0.0000
C2 0.1304 0.1250 0.1765 0.1667 0.1667 0.1667 0.2143 0.1818 0.1111 0.1429 0.1579 0.0000 0.0000 0.0000 0.0000 0.0000
C3 0.2174 0.1875 0.1765 0.1667 0.1667 0.1667 0.2143 0.2273 0.1111 0.1429 0.1579 0.0000 0.0000 0.0000 0.0000 0.0000
C4 0.2174 0.3125 0.2941 0.2778 0.2778 0.2778 0.2143 0.2273 0.2222 0.2143 0.2105 0.0000 0.0000 0.0000 0.0000 0.0000
C5 0.2174 0.1875 0.1765 0.2222 0.2222 0.2222 0.1429 0.2273 0.3333 0.2857 0.2632 0.0000 0.0000 0.0000 0.0000 0.0000

47
Table 4.23 Initial supermatrix: The third expert
Initial Physical location of traffic sign
Level of damage of
sign The context of traffic sign
P1 P2 P3 P4 P5 P6 P7 P8 L1 L2 L3 C1 C2 C3 C4 C5
Phys
ical
loca
tion
of tr
affic
sign
P1 0.0000 0.0000 0.0000 0.0000 0.0000 0.0000 0.0000 0.0000 0.0800 0.0909 0.0909 0.1250 0.1000 0.0909 0.1111 0.1250
P2 0.0000 0.0000 0.0000 0.0000 0.0000 0.0000 0.0000 0.0000 0.1600 0.1515 0.1515 0.1563 0.1000 0.1515 0.1852 0.1250
P3 0.0000 0.0000 0.0000 0.0000 0.0000 0.0000 0.0000 0.0000 0.1600 0.1515 0.1515 0.1563 0.1667 0.1515 0.1481 0.1250
P4 0.0000 0.0000 0.0000 0.0000 0.0000 0.0000 0.0000 0.0000 0.1200 0.1212 0.1212 0.1250 0.1333 0.1212 0.1111 0.1250
P5 0.0000 0.0000 0.0000 0.0000 0.0000 0.0000 0.0000 0.0000 0.1200 0.1212 0.1212 0.1250 0.1333 0.1212 0.1111 0.1250
P6 0.0000 0.0000 0.0000 0.0000 0.0000 0.0000 0.0000 0.0000 0.1200 0.1212 0.1212 0.1250 0.1333 0.1212 0.1111 0.1250
P7 0.0000 0.0000 0.0000 0.0000 0.0000 0.0000 0.0000 0.0000 0.0800 0.0909 0.0909 0.0938 0.1333 0.1212 0.1111 0.1250
P8 0.0000 0.0000 0.0000 0.0000 0.0000 0.0000 0.0000 0.0000 0.1600 0.1515 0.1515 0.0938 0.1000 0.1212 0.1111 0.1250
Lev
el o
f da
mag
e of
sig
n
L1 0.2222 0.2500 0.2500 0.2500 0.2500 0.2500 0.2222 0.2500 0.0000 0.0000 0.0000 0.2500 0.2500 0.2308 0.2500 0.2727
L2 0.3333 0.3333 0.3333 0.3333 0.3333 0.3333 0.3333 0.3333 0.0000 0.0000 0.0000 0.3333 0.3333 0.3846 0.3333 0.2727
L3 0.4444 0.4167 0.4167 0.4167 0.4167 0.4167 0.4444 0.4167 0.0000 0.0000 0.0000 0.4167 0.4167 0.3846 0.4167 0.4545
The
con
text
of
traf
fic s
ign
C1 0.2500 0.2174 0.1905 0.2500 0.2500 0.2500 0.2000 0.2667 0.1875 0.2000 0.2000 0.0000 0.0000 0.0000 0.0000 0.0000
C2 0.2000 0.2174 0.1905 0.2000 0.2000 0.2000 0.2667 0.2000 0.1875 0.2000 0.2000 0.0000 0.0000 0.0000 0.0000 0.0000
C3 0.2000 0.2174 0.2381 0.2000 0.2000 0.2000 0.2000 0.2000 0.2500 0.2000 0.2000 0.0000 0.0000 0.0000 0.0000 0.0000
C4 0.2000 0.2174 0.2381 0.2000 0.2000 0.2000 0.2000 0.2000 0.2500 0.2500 0.2500 0.0000 0.0000 0.0000 0.0000 0.0000
C5 0.1500 0.1304 0.1429 0.1500 0.1500 0.1500 0.1333 0.1333 0.1250 0.1500 0.1500 0.0000 0.0000 0.0000 0.0000 0.0000

48
Table 4.24 Weighted supermatrix: The first expert
Weighted Physical location of traffic sign
Level of damage of
sign The context of traffic sign
P1 P2 P3 P4 P5 P6 P7 P8 L1 L2 L3 C1 C2 C3 C4 C5
Phys
ical
loca
tion
of tr
affic
sign
P1 0.0000 0.0000 0.0000 0.0000 0.0000 0.0000 0.0000 0.0000 0.0213 0.0222 0.0227 0.0329 0.0086 0.0197 0.0250 0.0379
P2 0.0000 0.0000 0.0000 0.0000 0.0000 0.0000 0.0000 0.0000 0.0319 0.0296 0.0283 0.0263 0.0172 0.0329 0.0333 0.0303
P3 0.0000 0.0000 0.0000 0.0000 0.0000 0.0000 0.0000 0.0000 0.0319 0.0296 0.0283 0.0263 0.0086 0.0329 0.0250 0.0379
P4 0.0000 0.0000 0.0000 0.0000 0.0000 0.0000 0.0000 0.0000 0.0213 0.0222 0.0227 0.0329 0.0431 0.0329 0.0333 0.0379
P5 0.0000 0.0000 0.0000 0.0000 0.0000 0.0000 0.0000 0.0000 0.0213 0.0222 0.0227 0.0329 0.0431 0.0329 0.0333 0.0379
P6 0.0000 0.0000 0.0000 0.0000 0.0000 0.0000 0.0000 0.0000 0.0213 0.0222 0.0227 0.0329 0.0431 0.0329 0.0333 0.0379
P7 0.0000 0.0000 0.0000 0.0000 0.0000 0.0000 0.0000 0.0000 0.0106 0.0148 0.0170 0.0329 0.0431 0.0329 0.0333 0.0152
P8 0.0000 0.0000 0.0000 0.0000 0.0000 0.0000 0.0000 0.0000 0.0106 0.0074 0.0057 0.0329 0.0431 0.0329 0.0333 0.0152
Lev
el o
f da
mag
e of
sig
n
L1 0.1111 0.1250 0.1250 0.1111 0.1111 0.1111 0.0833 0.1667 0.0000 0.0000 0.0000 0.1667 0.1667 0.1875 0.1667 0.1667
L2 0.1667 0.1667 0.1667 0.1667 0.1667 0.1667 0.1667 0.1667 0.0000 0.0000 0.0000 0.2500 0.2500 0.2500 0.2500 0.2500
L3 0.2222 0.2083 0.2083 0.2222 0.2222 0.2222 0.2500 0.1667 0.0000 0.0000 0.0000 0.3333 0.3333 0.3125 0.3333 0.3333
The
con
text
of
traf
fic s
ign
C1 0.1471 0.1053 0.1111 0.1042 0.1042 0.1042 0.1190 0.1190 0.1509 0.1556 0.1581 0.0000 0.0000 0.0000 0.0000 0.0000
C2 0.0294 0.0526 0.0278 0.1042 0.1042 0.1042 0.1190 0.1190 0.1509 0.1556 0.1581 0.0000 0.0000 0.0000 0.0000 0.0000
C3 0.0882 0.1316 0.1389 0.1042 0.1042 0.1042 0.1190 0.1190 0.2264 0.2075 0.1976 0.0000 0.0000 0.0000 0.0000 0.0000
C4 0.0882 0.1053 0.0833 0.0833 0.0833 0.0833 0.0952 0.0952 0.1509 0.1556 0.1581 0.0000 0.0000 0.0000 0.0000 0.0000
C5 0.1471 0.1053 0.1389 0.1042 0.1042 0.1042 0.0476 0.0476 0.1509 0.1556 0.1581 0.0000 0.0000 0.0000 0.0000 0.0000

49
Table 4.25 Weighted supermatrix: The second expert
Weighted Physical location of traffic sign
Level of damage of
sign The context of traffic sign
P1 P2 P3 P4 P5 P6 P7 P8 L1 L2 L3 C1 C2 C3 C4 C5
Phys
ical
loca
tion
of tr
affic
sign
P1 0.0000 0.0000 0.0000 0.0000 0.0000 0.0000 0.0000 0.0000 0.0250 0.0320 0.0320 0.1442 0.0938 0.1442 0.0987 0.1339
P2 0.0000 0.0000 0.0000 0.0000 0.0000 0.0000 0.0000 0.0000 0.0375 0.0320 0.0320 0.0865 0.0625 0.0865 0.0987 0.0804
P3 0.0000 0.0000 0.0000 0.0000 0.0000 0.0000 0.0000 0.0000 0.0250 0.0160 0.0160 0.0865 0.0938 0.0865 0.0987 0.0804
P4 0.0000 0.0000 0.0000 0.0000 0.0000 0.0000 0.0000 0.0000 0.0250 0.0240 0.0240 0.0865 0.0938 0.0865 0.0987 0.1071
P5 0.0000 0.0000 0.0000 0.0000 0.0000 0.0000 0.0000 0.0000 0.0250 0.0240 0.0240 0.0865 0.0938 0.0865 0.0987 0.1071
P6 0.0000 0.0000 0.0000 0.0000 0.0000 0.0000 0.0000 0.0000 0.0250 0.0240 0.0240 0.0865 0.0938 0.0865 0.0987 0.1071
P7 0.0000 0.0000 0.0000 0.0000 0.0000 0.0000 0.0000 0.0000 0.0250 0.0240 0.0240 0.0865 0.0938 0.0865 0.0592 0.0536
P8 0.0000 0.0000 0.0000 0.0000 0.0000 0.0000 0.0000 0.0000 0.0125 0.0240 0.0240 0.0865 0.1250 0.0865 0.0987 0.0804
Lev
el o
f da
mag
e of
sig
n
L1 0.0400 0.0545 0.0667 0.0500 0.0500 0.0500 0.0500 0.0286 0.0000 0.0000 0.0000 0.0556 0.0417 0.0417 0.0556 0.0625
L2 0.0800 0.0727 0.0667 0.0750 0.0750 0.0750 0.0750 0.0857 0.0000 0.0000 0.0000 0.0833 0.0833 0.0833 0.0833 0.0833
L3 0.0800 0.0727 0.0667 0.0750 0.0750 0.0750 0.0750 0.0857 0.0000 0.0000 0.0000 0.1111 0.1250 0.1250 0.1111 0.1042
The
con
text
of
traf
fic s
ign
C1 0.1739 0.1500 0.1412 0.1333 0.1333 0.1333 0.1714 0.1091 0.1778 0.1714 0.1684 0.0000 0.0000 0.0000 0.0000 0.0000
C2 0.1043 0.1000 0.1412 0.1333 0.1333 0.1333 0.1714 0.1455 0.0889 0.1143 0.1263 0.0000 0.0000 0.0000 0.0000 0.0000
C3 0.1739 0.1500 0.1412 0.1333 0.1333 0.1333 0.1714 0.1818 0.0889 0.1143 0.1263 0.0000 0.0000 0.0000 0.0000 0.0000
C4 0.1739 0.2500 0.2353 0.2222 0.2222 0.2222 0.1714 0.1818 0.1778 0.1714 0.1684 0.0000 0.0000 0.0000 0.0000 0.0000
C5 0.1739 0.1500 0.1412 0.1778 0.1778 0.1778 0.1143 0.1818 0.2667 0.2286 0.2105 0.0000 0.0000 0.0000 0.0000 0.0000

50
Table 4.26 Weighted supermatrix: The third expert
Weighted Physical location of traffic sign
Level of damage of
sign The context of traffic sign
P1 P2 P3 P4 P5 P6 P7 P8 L1 L2 L3 C1 C2 C3 C4 C5
Phys
ical
loca
tion
of tr
affic
sign
P1 0.0000 0.0000 0.0000 0.0000 0.0000 0.0000 0.0000 0.0000 0.0400 0.0455 0.0455 0.0625 0.0500 0.0455 0.0556 0.0625
P2 0.0000 0.0000 0.0000 0.0000 0.0000 0.0000 0.0000 0.0000 0.0800 0.0758 0.0758 0.0781 0.0500 0.0758 0.0926 0.0625
P3 0.0000 0.0000 0.0000 0.0000 0.0000 0.0000 0.0000 0.0000 0.0800 0.0758 0.0758 0.0781 0.0833 0.0758 0.0741 0.0625
P4 0.0000 0.0000 0.0000 0.0000 0.0000 0.0000 0.0000 0.0000 0.0600 0.0606 0.0606 0.0625 0.0667 0.0606 0.0556 0.0625
P5 0.0000 0.0000 0.0000 0.0000 0.0000 0.0000 0.0000 0.0000 0.0600 0.0606 0.0606 0.0625 0.0667 0.0606 0.0556 0.0625
P6 0.0000 0.0000 0.0000 0.0000 0.0000 0.0000 0.0000 0.0000 0.0600 0.0606 0.0606 0.0625 0.0667 0.0606 0.0556 0.0625
P7 0.0000 0.0000 0.0000 0.0000 0.0000 0.0000 0.0000 0.0000 0.0400 0.0455 0.0455 0.0469 0.0667 0.0606 0.0556 0.0625
P8 0.0000 0.0000 0.0000 0.0000 0.0000 0.0000 0.0000 0.0000 0.0800 0.0758 0.0758 0.0469 0.0500 0.0606 0.0556 0.0625
Lev
el o
f da
mag
e of
sig
n
L1 0.1111 0.1250 0.1250 0.1250 0.1250 0.1250 0.1111 0.1250 0.0000 0.0000 0.0000 0.1250 0.1250 0.1154 0.1250 0.1364
L2 0.1667 0.1667 0.1667 0.1667 0.1667 0.1667 0.1667 0.1667 0.0000 0.0000 0.0000 0.1667 0.1667 0.1923 0.1667 0.1364
L3 0.2222 0.2083 0.2083 0.2083 0.2083 0.2083 0.2222 0.2083 0.0000 0.0000 0.0000 0.2083 0.2083 0.1923 0.2083 0.2273
The
con
text
of
traf
fic s
ign
C1 0.1250 0.1087 0.0952 0.1250 0.1250 0.1250 0.1000 0.1333 0.0938 0.1000 0.1000 0.0000 0.0000 0.0000 0.0000 0.0000
C2 0.1000 0.1087 0.0952 0.1000 0.1000 0.1000 0.1333 0.1000 0.0938 0.1000 0.1000 0.0000 0.0000 0.0000 0.0000 0.0000
C3 0.1000 0.1087 0.1190 0.1000 0.1000 0.1000 0.1000 0.1000 0.1250 0.1000 0.1000 0.0000 0.0000 0.0000 0.0000 0.0000
C4 0.1000 0.1087 0.1190 0.1000 0.1000 0.1000 0.1000 0.1000 0.1250 0.1250 0.1250 0.0000 0.0000 0.0000 0.0000 0.0000
C5 0.0750 0.0652 0.0714 0.0750 0.0750 0.0750 0.0667 0.0667 0.0625 0.0750 0.0750 0.0000 0.0000 0.0000 0.0000 0.0000

51
Table 4.27 Limiting supermatrix: The first expert
Limiting Physical location of traffic sign
Level of damage of
sign The context of traffic sign
P1 P2 P3 P4 P5 P6 P7 P8 L1 L2 L3 C1 C2 C3 C4 C5
Phys
ical
loca
tion
of tr
affic
sign
P1 0.0194 0.0194 0.0194 0.0194 0.0194 0.0194 0.0194 0.0194 0.0194 0.0194 0.0194 0.0194 0.0194 0.0194 0.0194 0.0194
P2 0.0239 0.0239 0.0239 0.0239 0.0239 0.0239 0.0239 0.0239 0.0239 0.0239 0.0239 0.0239 0.0239 0.0239 0.0239 0.0239
P3 0.0232 0.0232 0.0232 0.0232 0.0232 0.0232 0.0232 0.0232 0.0232 0.0232 0.0232 0.0232 0.0232 0.0232 0.0232 0.0232
P4 0.0241 0.0241 0.0241 0.0241 0.0241 0.0241 0.0241 0.0241 0.0241 0.0241 0.0241 0.0241 0.0241 0.0241 0.0241 0.0241
P5 0.0241 0.0241 0.0241 0.0241 0.0241 0.0241 0.0241 0.0241 0.0241 0.0241 0.0241 0.0241 0.0241 0.0241 0.0241 0.0241
P6 0.0241 0.0241 0.0241 0.0241 0.0241 0.0241 0.0241 0.0241 0.0241 0.0241 0.0241 0.0241 0.0241 0.0241 0.0241 0.0241
P7 0.0192 0.0192 0.0192 0.0192 0.0192 0.0192 0.0192 0.0192 0.0192 0.0192 0.0192 0.0192 0.0192 0.0192 0.0192 0.0192
P8 0.0163 0.0163 0.0163 0.0163 0.0163 0.0163 0.0163 0.0163 0.0163 0.0163 0.0163 0.0163 0.0163 0.0163 0.0163 0.0163
Lev
el o
f da
mag
e of
sig
n
L1 0.0929 0.0929 0.0929 0.0929 0.0929 0.0929 0.0929 0.0929 0.0929 0.0929 0.0929 0.0929 0.0929 0.0929 0.0929 0.0929
L2 0.1346 0.1346 0.1346 0.1346 0.1346 0.1346 0.1346 0.1346 0.1346 0.1346 0.1346 0.1346 0.1346 0.1346 0.1346 0.1346
L3 0.1762 0.1762 0.1762 0.1762 0.1762 0.1762 0.1762 0.1762 0.1763 0.1763 0.1763 0.1762 0.1762 0.1762 0.1762 0.1762
The
con
text
of
traf
fic s
ign
C1 0.0825 0.0825 0.0825 0.0825 0.0825 0.0825 0.0825 0.0825 0.0825 0.0825 0.0825 0.0825 0.0825 0.0825 0.0825 0.0825
C2 0.0770 0.0770 0.0770 0.0770 0.0770 0.0770 0.0770 0.0770 0.0770 0.0770 0.0770 0.0770 0.0770 0.0770 0.0770 0.0770
C3 0.1036 0.1036 0.1036 0.1036 0.1036 0.1036 0.1036 0.1036 0.1036 0.1036 0.1036 0.1036 0.1036 0.1036 0.1036 0.1036
C4 0.0784 0.0784 0.0784 0.0784 0.0784 0.0784 0.0784 0.0784 0.0784 0.0784 0.0784 0.0784 0.0784 0.0784 0.0784 0.0784
C5 0.0806 0.0806 0.0806 0.0806 0.0806 0.0806 0.0806 0.0806 0.0806 0.0806 0.0806 0.0806 0.0806 0.0806 0.0806 0.0806

52
Table 4.28 Limiting supermatrix: The second expert
Limiting Physical location of traffic sign
Level of damage of
sign The context of traffic sign
P1 P2 P3 P4 P5 P6 P7 P8 L1 L2 L3 C1 C2 C3 C4 C5
Phys
ical
loca
tion
of tr
affic
sign
P1 0.0602 0.0602 0.0602 0.0602 0.0602 0.0602 0.0602 0.0602 0.0602 0.0602 0.0602 0.0602 0.0602 0.0602 0.0602 0.0602
P2 0.0436 0.0436 0.0436 0.0436 0.0436 0.0436 0.0436 0.0436 0.0436 0.0436 0.0436 0.0436 0.0436 0.0436 0.0436 0.0436
P3 0.0430 0.0430 0.0430 0.0430 0.0430 0.0430 0.0430 0.0430 0.0430 0.0430 0.0430 0.0430 0.0430 0.0430 0.0430 0.0430
P4 0.0469 0.0469 0.0469 0.0469 0.0469 0.0469 0.0469 0.0469 0.0469 0.0469 0.0469 0.0469 0.0469 0.0469 0.0469 0.0469
P5 0.0469 0.0469 0.0469 0.0469 0.0469 0.0469 0.0469 0.0469 0.0469 0.0469 0.0469 0.0469 0.0469 0.0469 0.0469 0.0469
P6 0.0469 0.0469 0.0469 0.0469 0.0469 0.0469 0.0469 0.0469 0.0469 0.0469 0.0469 0.0469 0.0469 0.0469 0.0469 0.0469
P7 0.0371 0.0371 0.0371 0.0371 0.0371 0.0371 0.0371 0.0371 0.0371 0.0371 0.0371 0.0371 0.0371 0.0371 0.0371 0.0371
P8 0.0458 0.0458 0.0458 0.0458 0.0458 0.0458 0.0458 0.0458 0.0458 0.0458 0.0458 0.0458 0.0458 0.0458 0.0458 0.0458
Lev
el o
f da
mag
e of
sig
n
L1 0.0412 0.0412 0.0412 0.0412 0.0412 0.0412 0.0412 0.0412 0.0412 0.0412 0.0412 0.0412 0.0412 0.0412 0.0412 0.0412
L2 0.0651 0.0651 0.0651 0.0651 0.0651 0.0651 0.0651 0.0651 0.0651 0.0651 0.0651 0.0651 0.0651 0.0651 0.0651 0.0651
L3 0.0788 0.0788 0.0788 0.0788 0.0788 0.0788 0.0788 0.0788 0.0788 0.0788 0.0788 0.0788 0.0788 0.0788 0.0788 0.0788
The
con
text
of
traf
fic s
ign
C1 0.0850 0.0850 0.0850 0.0850 0.0850 0.0850 0.0850 0.0850 0.0850 0.0850 0.0850 0.0850 0.0850 0.0850 0.0850 0.0850
C2 0.0696 0.0696 0.0696 0.0696 0.0696 0.0696 0.0696 0.0696 0.0696 0.0696 0.0696 0.0696 0.0696 0.0696 0.0696 0.0696
C3 0.0776 0.0776 0.0776 0.0776 0.0776 0.0776 0.0776 0.0776 0.0776 0.0776 0.0776 0.0776 0.0776 0.0776 0.0776 0.0776
C4 0.1092 0.1092 0.1092 0.1092 0.1092 0.1092 0.1092 0.1092 0.1092 0.1092 0.1092 0.1092 0.1092 0.1092 0.1092 0.1092
C5 0.1031 0.1031 0.1031 0.1031 0.1031 0.1031 0.1031 0.1031 0.1031 0.1031 0.1031 0.1031 0.1031 0.1031 0.1031 0.1031

53
Table 4.29 Limiting supermatrix: The third expert
Limiting Physical location of traffic sign
Level of damage of
sign The context of traffic sign
P1 P2 P3 P4 P5 P6 P7 P8 L1 L2 L3 C1 C2 C3 C4 C5
Phys
ical
loca
tion
of tr
affic
sign
P1 0.0330 0.0330 0.0330 0.0330 0.0330 0.0330 0.0330 0.0330 0.0330 0.0330 0.0330 0.0330 0.0330 0.0330 0.0330 0.0330
P2 0.0499 0.0499 0.0499 0.0499 0.0499 0.0499 0.0499 0.0499 0.0499 0.0499 0.0499 0.0499 0.0499 0.0499 0.0499 0.0499
P3 0.0508 0.0508 0.0508 0.0508 0.0508 0.0508 0.0508 0.0508 0.0508 0.0508 0.0508 0.0508 0.0508 0.0508 0.0508 0.0508
P4 0.0406 0.0406 0.0406 0.0406 0.0406 0.0406 0.0406 0.0406 0.0406 0.0406 0.0406 0.0406 0.0406 0.0406 0.0406 0.0406
P5 0.0406 0.0406 0.0406 0.0406 0.0406 0.0406 0.0406 0.0406 0.0406 0.0406 0.0406 0.0406 0.0406 0.0406 0.0406 0.0406
P6 0.0406 0.0406 0.0406 0.0406 0.0406 0.0406 0.0406 0.0406 0.0406 0.0406 0.0406 0.0406 0.0406 0.0406 0.0406 0.0406
P7 0.0340 0.0340 0.0340 0.0340 0.0340 0.0340 0.0340 0.0340 0.0340 0.0340 0.0340 0.0340 0.0340 0.0340 0.0340 0.0340
P8 0.0438 0.0438 0.0438 0.0438 0.0438 0.0438 0.0438 0.0438 0.0438 0.0438 0.0438 0.0438 0.0438 0.0438 0.0438 0.0438
Lev
el o
f da
mag
e of
sig
n
L1 0.0823 0.0823 0.0823 0.0823 0.0823 0.0823 0.0823 0.0823 0.0823 0.0823 0.0823 0.0823 0.0823 0.0823 0.0823 0.0823
L2 0.1115 0.1115 0.1115 0.1115 0.1115 0.1115 0.1115 0.1115 0.1115 0.1115 0.1115 0.1115 0.1115 0.1115 0.1115 0.1115
L3 0.1396 0.1396 0.1396 0.1396 0.1396 0.1396 0.1396 0.1396 0.1396 0.1396 0.1396 0.1396 0.1396 0.1396 0.1396 0.1396
The
con
text
of
traf
fic s
ign
C1 0.0717 0.0717 0.0717 0.0717 0.0717 0.0717 0.0717 0.0717 0.0717 0.0717 0.0717 0.0717 0.0717 0.0717 0.0717 0.0717
C2 0.0675 0.0675 0.0675 0.0675 0.0675 0.0675 0.0675 0.0675 0.0675 0.0675 0.0675 0.0675 0.0675 0.0675 0.0675 0.0675
C3 0.0701 0.0701 0.0701 0.0701 0.0701 0.0701 0.0701 0.0701 0.0701 0.0701 0.0701 0.0701 0.0701 0.0701 0.0701 0.0701
C4 0.0764 0.0764 0.0764 0.0764 0.0764 0.0764 0.0764 0.0764 0.0764 0.0764 0.0764 0.0764 0.0764 0.0764 0.0764 0.0764
C5 0.0477 0.0477 0.0477 0.0477 0.0477 0.0477 0.0477 0.0477 0.0477 0.0477 0.0477 0.0477 0.0477 0.0477 0.0477 0.0477
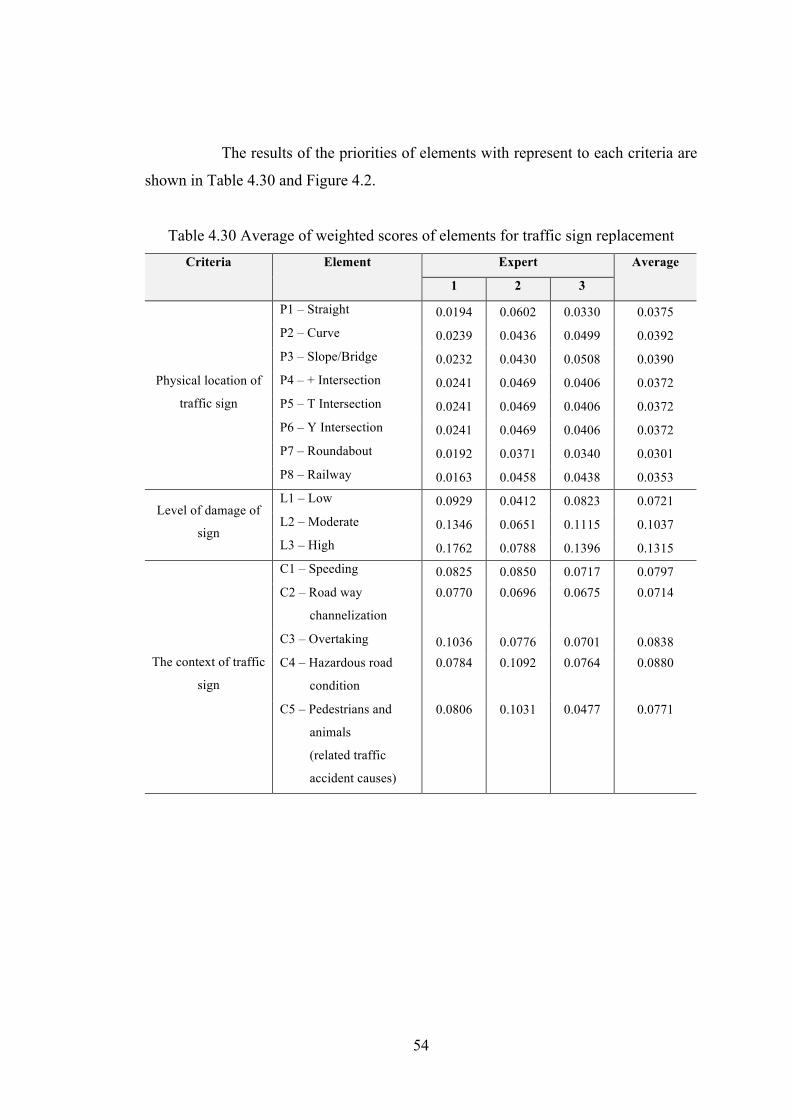
54
The results of the priorities of elements with represent to each criteria are
shown in Table 4.30 and Figure 4.2.
Table 4.30 Average of weighted scores of elements for traffic sign replacement Criteria Element Expert Average
1 2 3
Physical location of
traffic sign
P1 – Straight 0.0194 0.0602 0.0330 0.0375 P2 – Curve 0.0239 0.0436 0.0499 0.0392 P3 – Slope/Bridge 0.0232 0.0430 0.0508 0.0390 P4 – + Intersection 0.0241 0.0469 0.0406 0.0372 P5 – T Intersection 0.0241 0.0469 0.0406 0.0372 P6 – Y Intersection 0.0241 0.0469 0.0406 0.0372 P7 – Roundabout 0.0192 0.0371 0.0340 0.0301 P8 – Railway 0.0163 0.0458 0.0438 0.0353
Level of damage of
sign
L1 – Low 0.0929 0.0412 0.0823 0.0721 L2 – Moderate 0.1346 0.0651 0.1115 0.1037 L3 – High 0.1762 0.0788 0.1396 0.1315
The context of traffic
sign
C1 – Speeding 0.0825 0.0850 0.0717 0.0797 C2 – Road way
channelization
0.0770 0.0696 0.0675 0.0714
C3 – Overtaking 0.1036 0.0776 0.0701 0.0838 C4 – Hazardous road
condition
0.0784 0.1092 0.0764 0.0880
C5 – Pedestrians and
animals
(related traffic
accident causes)
0.0806 0.1031 0.0477 0.0771

55
Figure 4.2 Weighted scores of priority of traffic sign replacement
The results show traffic signs that of high damaged level is the first priority
(13.15%). The second priority is traffic signs that are moderate damaged level
(10.37%). The third priority is physical location of traffic sign where is roundabout
(3.01%). For 12th ranking, physical location of traffic sign at + intersection, T
intersection, and Y intersection are same ranking and priority (3.72%).
4.4 Application for traffic sign replacement prioritization
This hypothetical example shows to how the method can be used to
prioritize the replacement of traffic signs in various situations. In this example,
minimum speed limit sign and no right turn sign are to be replaced. For the sake of
illustration, only locations of traffic signs and potential causes of traffic accident are
considered as related factors in the decision making. The criteria and its weight are
supposed to be provided as shown in Table 4.10 and 4.30.
Suppose a minimum speed limit sign was installed at the vicinity of a
highway’s curve (0.3920) and no right turn sign was installed at the vicinity of an
intersection (0.0372). In addition, a minimum speed limit sign is dirty sign (0.0721),
0
2
4
6
8
10
12
14
P1 P2 P3 P4 P5 P6 P7 P8 L1 L2 L3 C1 C2 C3 C4 C5
Perc
enta
ge (%
)
Element
Traffic sign location Level of
damage of sign
The context of traffic sign
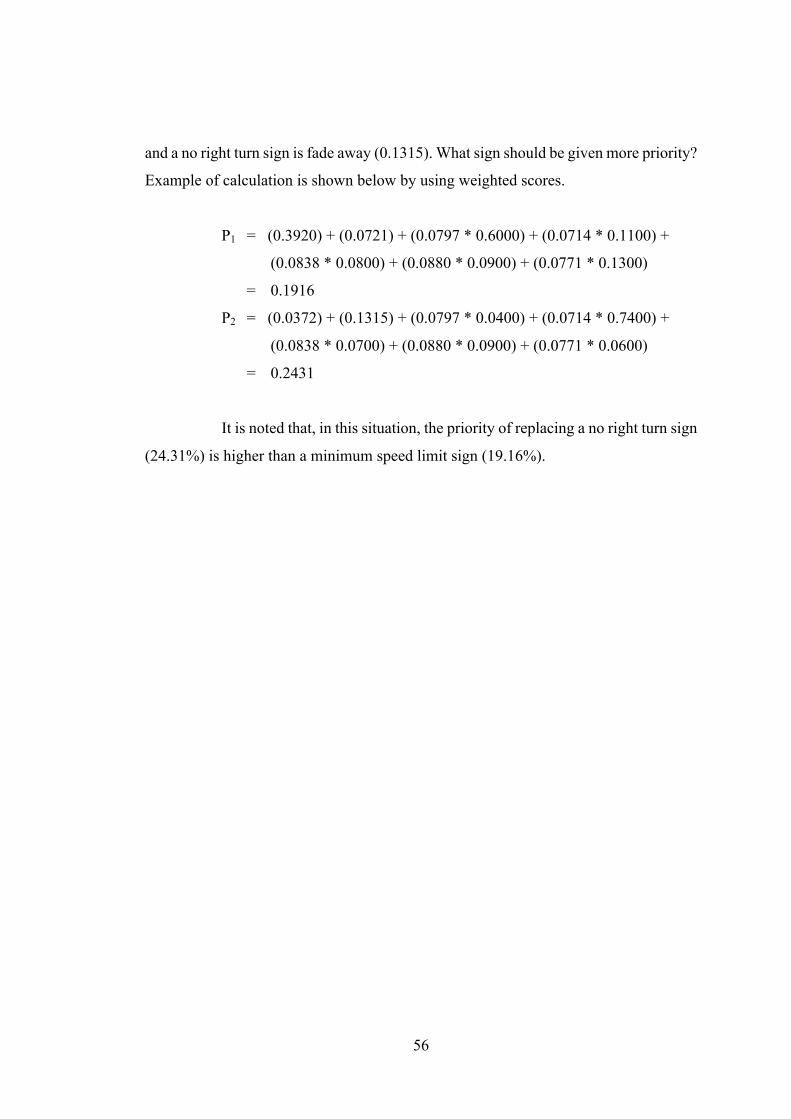
56
and a no right turn sign is fade away (0.1315). What sign should be given more priority?
Example of calculation is shown below by using weighted scores.
P1 = (0.3920) + (0.0721) + (0.0797 * 0.6000) + (0.0714 * 0.1100) +
(0.0838 * 0.0800) + (0.0880 * 0.0900) + (0.0771 * 0.1300)
= 0.1916
P2 = (0.0372) + (0.1315) + (0.0797 * 0.0400) + (0.0714 * 0.7400) +
(0.0838 * 0.0700) + (0.0880 * 0.0900) + (0.0771 * 0.0600)
= 0.2431
It is noted that, in this situation, the priority of replacing a no right turn sign
(24.31%) is higher than a minimum speed limit sign (19.16%).

57
Chapter 5
Conclusion and Recommendations
5.1 Conclusion and Discussion
The first part of analysis to rank hazardous highway locations in Thailand.
The hazardous highway ranking could be used to road prioritization for implementation
or maintenance. Nowadays, Department of Highway (DOH) assigns weights to
evaluate hazardous highway locations. Death rate (50%) is the highest priority in DOH
criteria. Second priority of weighted score by DOH criteria is injury rate (30%). The
least priority of weights by DOH criteria is accident rate (20%).
In practice, highways where there are more traffic accidents (high accident
rate) but less death rate is difficult to compare with highways where less accident rate
and less death rate are. Therefore, the author applied PCA technique to find weighted
scores of each factors (accident rate, injury rate, and death rate). The results found that
the weighted scores by DOH criteria and derived from PCA technique are different for
the ranking hazardous highway district area. But, the weighted scores of the both
approaches at hazardous highway section are similar. The results of implantation for
ranking the hazardous highway district areas are similar. The hazardous highway
district areas were ranked by the weights given from DOH criteria and derived from
PCA technique is resemble as Phatthalung is the top rank of the hazardous highway
district areas. From the traffic accident report, Phatthalung has high accident rate and
injury rate, although death rate is lower than other districts. Moreover, during New Year
in 2016, the statistic of accident rate and injury rate in Patthalung are decreased but
death rate is increased. It shows that the severity of traffic accident has been increasing
in the district. The main factor that cause traffic accidents is speeding (Provincial Public
Relations Office, Phatthalung, 2016).
Two approaches have given almost similar results and ranking on
hazardous highway sections. Although, the weighted scores of hazardous highway
district area were ranked by DOH criteria and PCA technique are different. Thus, PCA
technique provides an alternative ranking scheme which does not require subjective
58
judgment of weights aside from the state of practice that the DOH criteria is currently
using.
To identify the importance of traffic signs, linking between the context of
traffic signs and potential causes of traffic accident by drivers’ perception was applied.
Not only a traffic accident cause relates pre a traffic sign, but a traffic sign can be related
to several traffic accident causes, which depended on road users’ comprehension. The
results found that drivers comprehend more than one meaning of traffic signs. The
context of traffic signs can be related to potential causes of traffic accidents (speeding,
roadway channelization, overtaking, hazardous road condition, and causes related to
pedestrian and animal). However, the importance of traffic signs does not only depend
on type of their meaning, but also their surrounding conditions.
In order to prioritize traffic signs replacement in Thailand, Analytic
Network Process (ANP) technique was applied in this study. Three criteria – physical
locations of traffic signs, level of damage of signs, and the context of traffic signs –
were considered as a control criterion for prioritization. At cluster level, the level of
damage of sign reveals the highest priority. The second priority is the context of traffic
signs, and the lowest priority is locations of traffic signs. While the element level, a
fade away or unclear message sign is the most important factor for traffic sign
replacement.
In practice, nowadays, an agency who is response to replace traffic signs
does not priority traffic signs. Moreover, there is no guideline for prioritization of traffic
sign replacement. Therefore, weighted scores of element or criteria can be applied to
be a replacement plan for priority the importance of traffic signs by considering the
relative elements surrounding damaged signs.
The prioritization of traffic sign replacement, it should be noted that, not
only importance of traffic signs but also other criteria such as traffic sign location,
history of traffic accidents, level of damage of traffic sign, etc. should be considered
too. Assessment of importance of traffic sign using the concept proposed in this study
can be applied as a part of the prioritization process of traffic sign replacement.

59
5.2 Recommendations
This study applied statistical data from traffic accident report to identify
ranking of hazardous highway location. Because of limited data were used in this study,
the ranking of hazardous highway section was calculated using only one year statistics.
Moreover, investigating the significant factors that causes these highway areas and
sections hazardous can be explored in the future.
In this study only damaged signs were considered which related factors
such as location of traffic signs, level of damage of signs, and the context of traffic
signs. However, deterioration of coloring and character of traffic signs was not
considered and it is recommended for future studies.

60
References
Agarwal, P. K., Patil, P. K., and Mehar, R. (2013). A methodology for ranking road
safety hazardous locations using Analytical Hierarchy Process. Procedia -
Social and Behavioral Sciences, 104(0), 1030-1037.
Al-Haji, G. (2007). Road safety development index (RSDI). (Ph.D.), Linköping
University.
Al-Madani, H. and Al-Janahi, A. R.(a) (2002). Assessment of drivers' comprehension
of traffic signs based on their traffic, personal and social characteristics.
Transportation Research Part F: Traffic Psychology and Behaviour, 5(1),
63-76.
Al-Madani, H. and Al-Janahi, A. R.(b) (2002). Role of drivers’ personal characteristics
in understanding traffic sign symbols. Accident Analysis & Prevention.
34(2), 185-196.
Aragonés-Beltrán, P., Chaparro-González, F., Pastor-Ferrando, J.-P. and Pla-Rubio, A.
(2014). An AHP (Analytic Hierarchy Process)/ANP (Analytic Network
Process)-based multi-criteria decision approach for the selection of solar-
thermal power plant investment projects. Energy, 66, 222-238.
Bayazıt, O. (2002). A New Methodology in Multiple Criteria Decision-Making
Systems: Analytical Network Process (ANP) and an Application. Ankara
University, Journal of Faculty of Political Sciences, 57, 15-34.
Black, K. L., Hussain, S. F. and Paniati, J. F. (1992). Deterioration of retroreflective
traffic signs. ITE Journal, 16-22.
Bottero, M., Modini, G. and Valle, M. (2007). Use of the analytic network process for
the sustainability assessment of an urban transformation project.
Proceedings of International Conference on Whole Life Urban Sustainability
and its Assessment, Glasgow (Horner M et al. (eds)) (pp. 209–231). Glasgow
Caledonian University, Glasgow.
Carlson, P.J. and Lupes, M.S. (2007, November). Methods for Maintaining Traffic Sign
Retroreflectivity. (Report no. FHWA-HRT-08-026) Retrieved from April
14, 2014, http://safety.fhwa.dot.gov/roadway_dept/night_visib/policy_guide
/fhwahrt08026/fhwahrt08026.pdf.
61
DeGroat, B. (2014). Thai roads ranked No. 2 for traffic deaths. Retrieved from June
11, 2015, http://global.umich.edu/2014/02/thai-roads-ranked-no-2-for-
traffic-deaths/.
Department for Transport/Highways Agency, Department for Regional Development
(Northern Ireland), Transport Scotland, Welsh Assembly Government.
(2004). Traffic Signs Manual: Chapter 1 Introduction. Belfast: TSO Ireland.
Department for Transport/Highways Agency, Department for Regional Development
(Northern Ireland), Transport Scotland, Welsh Assembly Government.
(2009). Chapter 8 traffic safety measures and signs for road works and
temporary situations part 2: operations. Belfast: TSO Ireland.
Department of Disaster Prevention and Mitigation, Ministry of Interior. (2014). Basic
traffic signs. Retrieved from January 2, 2014,
http://122.155.1.145/upload/minisite/file_attach/137/53c64210563aa.pdf
Government of Alberta: Transportation. (2010). Placement of signs. Retrieved from
January 5, 2016, http://www.transportation.alberta.ca/Content/docType233/
Production/29SignPlacement-General.pdf
Hummer, J. E., Harris, E. A. and Rasdorf, W. (2013). Simulation-based evaluation of
traffic sign retroreflectivity maintenance practices. Journal of Transpor-
tation Engineering, 139, 556-564.
Hynes, C. (2014). Study: Thailand’s roads 2nd most dangerous in the world. Retrieved
from June 11, 2015, http://asiancorrespondent.com/119892/study-thailand-
roads-2nd-most-dangerous-in-the-world/
Ismail, A. A.-I. (2012). Comprehension of posted highway traffic signs in Iraq. Tikrit
Journal of Engineering Sciences, 19(1), 62-70.
Israel, G. D. (2013). Determining Sample Size. Retrieved from June 30, 2014,
http://edis.ifas.ufl.edu/pdffiles/PD/PD00600.pdf
Kirmizioglu, E. and Tuydes-Yaman, H. (2012). Comprehensibility of traffic signs
among urban drivers in Turkey. Accident Analysis & Prevention, 45(0), 131-
141.

62
Liu, Z. and Xu, Q. (2011). Comparison and Prioritization among Evaluation Models
with Principal Component Analysis in Suppliers Selecting. 2011
International Conference on Management and Service Science (MASS) (pp
1-4). Wuhan, China: IEEE
Mindtools. (2016). Prioritization: Making Best Use of Your Time and Resources.
Retrieved from May 29, 2016,
https://www.mindtools.com/pages/article/newHTE_92.htm
Neaupane, K.M. and Piantanakulchai, M. (2006). Analytic network process model for
landslide hazard zonation. Engineering Geology, 85, 281-294.
Ng, A. and Chan, A. (2008). The effects of driver factors and sign design features on
the comprehensibility of traffic signs. Journal of Safety Research, 39, 321-
328.
Office of transport and traffic policy and planning, Ministry of Transport. (2003).
Manual of maintenance for traffic control device (ISBN 974-456-456-3)
Retrieved from January 2, 2014,
http://www.otp.go.th/pdf/safetytransport/safetytransport05.pdf
Office of transport and traffic policy and planning, Ministry of Transport. (2004).
Traffic signs standard and manual 1 (ISBN 974-456-451-2) Retrieved from
January 2, 2014,
http://www.otp.go.th/pdf/safetytransport/safetytransport01.pdf
Paclı́k, P., Novovičová, J., Pudil, P. and Somol, P. (2000). Road sign classification
using Laplace kernel classifier. Pattern Recognition Letters, 21, 1165-1173.
Pakalnis, A., Gužys, A., and Dimaitis, M. (2003, August 25-27). Interactions between
accident rate and traffic volume. Paper presented at the 25th International
Baltic Road Conference, Vilnius, Lithuania.
Provincial Public Relations Office, Phatthalung. (2016). Traffic accident. Retrieved
from May 27, 2016,
http://pr.prd.go.th/phatthalung/ewt_news.php?nid=1457&filename=index
Promentilla, M.A.B., Tapia, J.F.D., Arcilla, C.A., Dugos, N.P., Gaspillo, P.D., Roces,
S.A. and Tan, R. R. (2013). Interdependent ranking of sources and sinks in
CCS systems using the analytic network process. Environmental Modelling
& Software, 50, 21-24.

63
Saaty, T.L. (2005). Theory and Applications of the Analytic Network Process: Decision
Making with Benefits, Opportunities, Costs, and Risks. Pittsburgh, PA: RWS
Publications.
Saaty, T.L. (2010). Principia Mathematica Decernendi: Mathematical Principles of
Decision Making. Pennsylvania: RWS Publications.
Shiue, Y.C. and Lin, C.Y. (2012). Applying analytic network process to evaluate the
optimal recycling strategy in upstream of solar energy industry. Energy and
Buildings, 54, 266-277.
Smith, L. I. (2002). A tutorial on Principal Components Analysis. Retrieved from June
19, 2015, http://www.cs.otago.ac.nz/cosc453/student_tutorials/
principal_components.pdf
Statistical Information Group, B.O.H.S. (2010). Traffic Accident on National
Highways 2010. Retrieved from September 15, 2014,
http://bhs.doh.go.th/files/accident/53/report_accident53.pdf
Statistical Information Group, B.O.H.S. (2011). Traffic Accident on National
Highways 2011. Retrieved from September 15, 2014,
http://bhs.doh.go.th/files/accident/54/report_accident54.pdf
Statistical Information Group, B.O.H.S. (2012). Traffic Accident on National
Highways 2012. Retrieved from September 15, 2014,
http://bhs.doh.go.th/files/accident/55/report_accident55.pdf
Statistical Information Group, B.O.H.S. (2013). Traffic Accident on National
Highways 2013. Retrieved from September 15, 2014,
http://bhs.doh.go.th/files/Carnival/New%20Year/report_newyear56.pdf
Traffic Engineering and Safety Unit Design Branch, Department of Roads Ministry of
Work and Transport. (1997). Traffic signs manual volume 1 of 2. Retrieved
from June 21, 2016, http://dor.gov.np/documents/traffic%20signs%201.pdf
United States Department of Transportation Federal Highway Administration. (2002).
United States Road Symbol Signs (FHWA-OP-02-084) Retrieved from
January 31, 2014, http://mutcd.fhwa.dot.gov/services/publications/
fhwaop02084/us_road_symbol_signs.pdf
Weisstein, E. (2014). Eigenvalue. Retrieved from December 28, 2014,
http://mathworld.wolfram.com/Eigenvalue.html

64
Wen-hong, H., Li-qin, H., and Ming, J. (2013). Retroreflectivity and deterioration
characteristics of sheeting used for in-service guide signs. Journal of
Highway and Transportation Research and Development, 7(2), 88-93.
World Health Organization. Road Traffic Injuries Fact Sheet N0358, Retrieved from
May 22, 2016, http://www.who.int/mediacentre/factsheets/fs358/en/
Xiaona, Z., and Qicheng, W. (2014). Chinese sports development status research based
on SPSS principal component analysis and GM model. Journal of Chemical
& Pharmaceutical Research, 6(3), 272-277.
Xiaoyi, Z., Liying, Z., Xuemei, F., and Yinsheng, Y. (2010, May 26-28). Research on
evaluation of third-party logistics enterprises in agricultural product logistics
based on PCA-priority-degree evaluation method. Paper presented at the
Control and Decision Conference (CCDC), Chinese.
Yüksel, İ. and Dagˇdeviren, M. (2007). Using the analytic network process (ANP) in a
SWOT analysis – A case study for a textile firm. Information Sciences, 177,
3364-3382.
Zhang, X., Zhang, L., Fan, X., and Yang, Y. (2010). Research on evaluation of third-
party logistics enterprises in agricultural product logistics based on PCA-
priority-degree evaluation method. 2010 Chinese Control and Decision
Conference (pp 3660-3665), Xuzhou, China: IEEE

65
Appendices

66
Appendix A
Traffic Signs in Thailand (Regulatory Signs and Warning Signs)
and Scores Related to Potential Causes of Traffic Accident
Traffic sign Potential cause of traffic accident
Sp. Ch. Ov. Hr. Pa.
Regulatory sign
STOP
0.39 0.06 0.10 0.14 0.32
Give way
0.22 0.24 0.22 0.07 0.25
Priority for oncoming traffic
0.16 0.36 0.31 0.13 0.05
Overtaking prohibited
0.23 0.23 0.43 0.10 0.01
No entry
0.07 0.37 0.02 0.35 0.20
U-turns prohibited
0.09 0.71 0.07 0.07 0.05
* Sp. – Speeding Ch. – Roadway chanelization Ov. – Overtaking Hr. –Hazardous road condition
Pa. – Causes related to pedestrians and animals

67
Traffic sign Potential cause of traffic accident
Sp. Ch. Ov. Hr. Pa.
Left/Right turn prohibited
0.06 0.73 0.07 0.09 0.05
Lane change prohibited
0.13 0.49 0.25 0.11 0.03
Left/Right or U-turn prohibited
0.10 0.69 0.10 0.07 0.03
Motor vehicles except solo motor cycles prohibited
0.09 0.34 0.01 0.29 0.27
Truck prohibited
0.10 0.36 0.01 0.32 0.20
Solo motor cycles prohibited
0.13 0.42 0.04 0.22 0.19
Caravan prohibited
0.07 0.41 0.04 0.32 0.17
Three-wheel motor vehicles prohibited
0.12 0.43 0.03 0.28 0.14
* Sp. – Speeding Ch. – Roadway chanelization Ov. – Overtaking Hr. –Hazardous road condition
Pa. – Causes related to pedestrians and animals

68
Traffic sign Potential cause of traffic accident
Sp. Ch. Ov. Hr. Pa.
Three-wheel prohibited
0.15 0.45 0.02 0.24 0.14
Cycles prohibited
0.20 0.41 0.02 0.23 0.14
Hand carts direction prohibited
0.21 0.43 0.06 0.19 0.11
Bullock carts prohibited
0.18 0.40 0.06 0.25 0.11
Animal-drawn vehicles prohibited
0.17 0.42 0.02 0.23 0.16
Motor vehicles prohibited
0.15 0.32 0.07 0.24 0.22
Cycles, three-wheeler, and hand carts direction
prohibited
0.18 0.44 0.02 0.21 0.16
Solo motor cycles and three-wheel motor vehicles
prohibited
0.16 0.42 0.05 0.21 0.16
* Sp. – Speeding Ch. – Roadway chanelization Ov. – Overtaking Hr. –Hazardous road condition
Pa. – Causes related to pedestrians and animals

69
Traffic sign Potential cause of traffic accident
Sp. Ch. Ov. Hr. Pa.
Horn prohibited
0.09 0.14 0.07 0.00 0.71
Pedestrian prohibited
0.19 0.17 0.02 0.22 0.41
Restricted zone
0.10 0.48 0.03 0.18 0.21
No stopping or standing
0.21 0.45 0.07 0.14 0.13
STOP Police
0.40 0.29 0.10 0.07 0.14
Left/right turn
0.14 0.59 0.17 0.08 0.03
Keep left/right
0.16 0.59 0.16 0.07 0.01
Pass either side
0.17 0.60 0.16 0.04 0.03
* Sp. – Speeding Ch. – Roadway chanelization Ov. – Overtaking Hr. –Hazardous road condition
Pa. – Causes related to pedestrians and animals

70
Traffic sign Potential cause of traffic accident
Sp. Ch. Ov. Hr. Pa.
Turn left/right
0.17 0.62 0.14 0.05 0.03
Left/Right optional lane
0.17 0.63 0.12 0.06 0.02
Left/Right straight optional lane
0.17 0.59 0.17 0.06 0.02
Roundabout
0.25 0.49 0.18 0.03 0.05
Compulsory bus lane
0.16 0.72 0.00 0.00 0.12
Compulsory mass transit lane
0.15 0.68 0.08 0.06 0.04
Compulsory solo motor cycles
0.17 0.65 0.08 0.05 0.05
Compulsory cycles
0.15 0.64 0.08 0.03 0.10
* Sp. – Speeding Ch. – Roadway chanelization Ov. – Overtaking Hr. –Hazardous road condition
Pa. – Causes related to pedestrians and animals

71
Traffic sign Potential cause of traffic accident
Sp. Ch. Ov. Hr. Pa.
Compulsory pedestrian
0.16 0.46 0.05 0.00 0.34
Minimum speed limit
0.59 0.09 0.10 0.09 0.14
Restriction ends sign
0.32 0.33 0.17 0.10 0.09
Warning sign
Bend ahead
0.35 0.25 0.24 0.14 0.01
Turn left/right ahead
0.33 0.23 0.24 0.19 0.00
Bend ahead
0.32 0.26 0.23 0.18 0.01
Bend ahead
0.33 0.23 0.23 0.20 0.00
Double bend ahead
0.32 0.22 0.24 0.22 0.00
* Sp. – Speeding Ch. – Roadway chanelization Ov. – Overtaking Hr. –Hazardous road condition
Pa. – Causes related to pedestrians and animals
72
Traffic sign Potential cause of traffic accident
Sp. Ch. Ov. Hr. Pa.
Crossroads ahead
0.31 0.32 0.20 0.10 0.07
Y-intersection ahead
0.33 0.33 0.22 0.11 0.01
Side road left/right ahead
0.34 0.33 0.21 0.10 0.01
Staggered intersection ahead
0.34 0.35 0.20 0.10 0.01
Traffic merges ahead from the left/right
0.36 0.33 0.19 0.10 0.03
Escape lane ahead
0.36 0.35 0.18 0.09 0.01
Roundabout ahead
0.33 0.35 0.17 0.12 0.02
Road narrow on both sides ahead
0.28 0.27 0.22 0.22 0.00
* Sp. – Speeding Ch. – Roadway chanelization Ov. – Overtaking Hr. –Hazardous road condition
Pa. – Causes related to pedestrians and animals

73
Traffic sign Potential cause of traffic accident
Sp. Ch. Ov. Hr. Pa.
Road narrow on left/right sides ahead
0.29 0.28 0.22 0.22 0.00
Narrow bridge
0.30 0.22 0.20 0.26 0.02
Left/Right lane end
0.23 0.36 0.20 0.21 0.00
Level crossing without barriers
0.35 0.16 0.13 0.18 0.18
Level crossing with barriers
0.33 0.19 0.14 0.20 0.15
Highway-Rail Grade crossing closed to junction
0.32 0.21 0.13 0.20 0.14
Road narrows
0.20 0.28 0.15 0.37 0.00
Low clearance
0.23 0.28 0.10 0.39 0.00
* Sp. – Speeding Ch. – Roadway chanelization Ov. – Overtaking Hr. –Hazardous road condition
Pa. – Causes related to pedestrians and animals

74
Traffic sign Potential cause of traffic accident
Sp. Ch. Ov. Hr. Pa.
Dangerous descent / Steep ascent
0.31 0.13 0.17 0.39 0.00
Road hump or series of road ahead
0.36 0.09 0.10 0.40 0.05
Uneven road
0.35 0.08 0.07 0.44 0.05
Dangerous dip
0.37 0.06 0.09 0.46 0.01
Slippery road
0.36 0.06 0.12 0.45 0.01
Loose chipping
0.36 0.04 0.11 0.49 0.00
Falling rocks
0.30 0.09 0.08 0.52 0.00
Opening bridge ahead
0.28 0.20 0.07 0.44 0.01
* Sp. – Speeding Ch. – Roadway chanelization Ov. – Overtaking Hr. –Hazardous road condition
Pa. – Causes related to pedestrians and animals

75
Traffic sign Potential cause of traffic accident
Sp. Ch. Ov. Hr. Pa.
Lane cross over
0.27 0.34 0.22 0.16 0.00
Exit to frontage road
0.31 0.39 0.19 0.10 0.00
Main road entry
0.31 0.39 0.19 0.11 0.00
Merging traffic
0.29 0.39 0.24 0.08 0.00
Divided highway
0.28 0.39 0.19 0.15 0.00
End of divided highway
0.30 0.37 0.21 0.12 0.00
U-Turn ahead
0.25 0.48 0.19 0.07 0.00
Two-way traffic ahead
0.29 0.41 0.23 0.07 0.00
* Sp. – Speeding Ch. – Roadway chanelization Ov. – Overtaking Hr. –Hazardous road condition
Pa. – Causes related to pedestrians and animals

76
Traffic sign Potential cause of traffic accident
Sp. Ch. Ov. Hr. Pa.
Traffic signal ahead
0.51 0.19 0.18 0.04 0.09
Stop sign ahead
0.55 0.16 0.16 0.05 0.08
Yield sign ahead
0.56 0.16 0.16 0.04 0.07
Pedestrian crossing
0.33 0.11 0.12 0.02 0.41
School
0.33 0.13 0.10 0.01 0.43
Animal crossing
0.33 0.09 0.09 0.02 0.47
Low flying aircraft
0.37 0.19 0.05 0.10 0.29
Other danger ahead
0.30 0.12 0.13 0.25 0.20
* Sp. – Speeding Ch. – Roadway chanelization Ov. – Overtaking Hr. –Hazardous road condition
Pa. – Causes related to pedestrians and animals
77
Traffic sign Potential cause of traffic accident
Sp. Ch. Ov. Hr. Pa.
No passing zone
0.26 0.16 0.35 0.13 0.09
Double arrow
0.25 0.36 0.18 0.19 0.02
Transition alignment
0.30 0.46 0.17 0.07 0.00
Transition alignment
0.30 0.46 0.17 0.07 0.00
Transition alignment
0.33 0.43 0.16 0.08 0.00
Transition alignment
0.33 0.31 0.12 0.22 0.03
Alternate Merging
0.29 0.38 0.21 0.11 0.00
* Sp. – Speeding Ch. – Roadway chanelization Ov. – Overtaking Hr. –Hazardous road condition
Pa. – Causes related to pedestrians and animals

78
Appendix B
Questionnaire – Linking the Context of Traffic Signs and
Potential Causes of Traffic Accident
Linking the context of traffic sign and traffic
accident causes questionnaire
The questionnaire is to survey a linking the context of traffic signs and
potential causes of traffic accident for prioritization of replacement of traffic signs in
Thailand.
Direction Please check P the potential cause(s) of traffic accident that involve
missing/damaged of the specified traffic sign.
Traffic sign
Spee
ding
Roa
d w
ay
chan
neliz
atio
n
Ove
rtak
ing
Haz
ardo
us r
oad
cond
ition
s
Cau
ses r
elat
ed
to p
edes
tria
ns
and
anim
als
1. STOP
2. Give way
3. Priority for oncoming traffic
4. Overtaking prohibited

79
Traffic sign
Spee
ding
Roa
d w
ay
chan
neliz
atio
n
Ove
rtak
ing
Haz
ardo
us r
oad
cond
ition
s
Cau
ses r
elat
ed
to p
edes
tria
ns
and
anim
als
5. No entry
6. U-turns prohibited
7. Left/Right turn prohibited
8. Lane change prohibited
9. Left/Right or U-turn prohibited
10. Motor vehicles except solo
motor cycles prohibited
11. Truck prohibited

80
Traffic sign
Spee
ding
Roa
d w
ay
chan
neliz
atio
n
Ove
rtak
ing
Haz
ardo
us r
oad
cond
ition
s
Cau
ses r
elat
ed
to p
edes
tria
ns
and
anim
als
12. Solo motor cycles prohibited
13. Caravan prohibited
14. Three-wheel motor vehicles
prohibited
15. Three-wheel prohibited
16. Cycles prohibited
17. Hand carts direction prohibited
18. Bullock carts prohibited

81
Traffic sign
Spee
ding
Roa
d w
ay
chan
neliz
atio
n
Ove
rtak
ing
Haz
ardo
us r
oad
cond
ition
s
Cau
ses r
elat
ed
to p
edes
tria
ns
and
anim
als
19. Animal-drawn vehicles
prohibited
20. Motor vehicles prohibited
21. Cycles, three-wheeler, and
hand carts direction prohibited
22. Solo motor cycles and three-
wheel motor vehicles
prohibited
23. Horn prohibited
24. Pedestrian prohibited
25. Restricted zone

82
Traffic sign
Spee
ding
Roa
d w
ay
chan
neliz
atio
n
Ove
rtak
ing
Haz
ardo
us r
oad
cond
ition
s
Cau
ses r
elat
ed
to p
edes
tria
ns
and
anim
als
26. No stopping or standing
27. STOP Check
28. Left/right turn
29. Keep left/right
30. Pass either side
31. Turn left/right
32. Left/Right optional lane
33. Left/Right straight optional
lane

83
Traffic sign
Spee
ding
Roa
d w
ay
chan
neliz
atio
n
Ove
rtak
ing
Haz
ardo
us r
oad
cond
ition
s
Cau
ses r
elat
ed
to p
edes
tria
ns
and
anim
als
34. Roundabout
35. Compulsory bus lane
36. Compulsory mass transit lane
37. Compulsory solo motor cycles
38. Compulsory cycles
39. Compulsory pedestrian
40. Minimum speed limit
41. Restriction ends sign
84
Traffic sign
Spee
ding
Roa
d w
ay
chan
neliz
atio
n
Ove
rtak
ing
Haz
ardo
us r
oad
cond
ition
s
Cau
ses r
elat
ed
to p
edes
tria
ns
and
anim
als
42. Bend ahead
43. Turn left/right ahead
44. Bend ahead
45. Bend ahead
46. Double bend ahead
47. Crossroads ahead
48. Y-intersection ahead
49. Side road left/right ahead

85
Traffic sign
Spee
ding
Roa
d w
ay
chan
neliz
atio
n
Ove
rtak
ing
Haz
ardo
us r
oad
cond
ition
s
Cau
ses r
elat
ed
to p
edes
tria
ns
and
anim
als
50. Staggered intersection ahead
51. Traffic merges ahead from the
left/right
52. Escape lane ahead
53. Roundabout ahead
54. Road narrow on both sides
ahead
55. Road narrow on left/right
sides ahead
56. Narrow bridge

86
Traffic sign
Spee
ding
Roa
d w
ay
chan
neliz
atio
n
Ove
rtak
ing
Haz
ardo
us r
oad
cond
ition
s
Cau
ses r
elat
ed
to p
edes
tria
ns
and
anim
als
57. Left/Right lane end
58. Level crossing without
barriers
59. Level crossing with barriers
60. Highway-Rail Grade crossing
closed to junction
61. Road narrows
62. Low clearance
63. Dangerous descent / Steep
ascent

87
Traffic sign
Spee
ding
Roa
d w
ay
chan
neliz
atio
n
Ove
rtak
ing
Haz
ardo
us r
oad
cond
ition
s
Cau
ses r
elat
ed
to p
edes
tria
ns
and
anim
als
64. Road hump or series of road
ahead
65. Uneven road
66. Dangerous dip
67. Slippery road
68. Loose chipping
69. Falling rocks
70. Opening bridge ahead

88
Traffic sign
Spee
ding
Roa
d w
ay
chan
neliz
atio
n
Ove
rtak
ing
Haz
ardo
us r
oad
cond
ition
s
Cau
ses r
elat
ed
to p
edes
tria
ns
and
anim
als
71. Lane cross over ahead
72. Exit to frontage road ahead
73. Main road entry ahead
74. Merging traffic
75. Divided highway
76. End of divided highway
77. U-Turn ahead
78. Two-way traffic ahead

89
Traffic sign
Spee
ding
Roa
d w
ay
chan
neliz
atio
n
Ove
rtak
ing
Haz
ardo
us r
oad
cond
ition
s
Cau
ses r
elat
ed
to p
edes
tria
ns
and
anim
als
79. Traffic signal ahead
80. Stop sign ahead
81. Yield sign ahead
82. Pedestrian crossing
83. School
84. Animal crossing
85. Low flying aircraft
86. Other danger ahead

90
Traffic sign
Spee
ding
Roa
d w
ay
chan
neliz
atio
n
Ove
rtak
ing
Haz
ardo
us r
oad
cond
ition
s
Cau
ses r
elat
ed
to p
edes
tria
ns
and
anim
als
87. No passing zone
88. Double arrow
89. Transition alignment
90. Transition alignment
91. Transition alignment
92. Transition alignment
93. Alternate Merging
Personal information
Gender * Male * Female
Age __________ years
Education * Master’s Degree or Higher * Bachelor’s Degree
* Secondary School
Occupation _________________
Driving License * Have * Do not have
Driving Experience __________ years

91
Appendix C
Questionnaire – Analytic Network Process
Prioritization of traffic sign replacement in
Thailand using Analytic Network Process
The questionnaire is to identify the priority of criteria and elements of
prioritization for traffic sign replacement in Thailand. There are three parts in this
questionnaire including Part I Expert information, Part II Pairwise comparison of the
criteria, and Part III Evaluation the level of elements.
Part I Expert information
Gender * Male * Female
Age __________ years
Education * Master’s Degree or Higher * Bachelor’s Degree
* Secondary School
Occupation/Position ________________________________________________
Working Experience __________ years
Part II Pairwise comparison of the criteria
Direction Comparing the criteria in different context will be required. The
definition of comparison scale will be shown in the table below. Intensity of
Importance
Definition Explanation
1
2
3
4
5
Equal importance
Moderate importance
Strong importance
Very strong or
demonstrated importance
Extreme importance
Two criteria contribute equally to the objective
Experience and judgement slightly favor one criteria
over another
Experience and judgement strongly favor one criteria
over another
A criteria is favored very strongly over another; its
dominance demonstrated in practice
The evidence favoring one criteria over another is of the
highest possible order of affirmation

92
Example for answering the question
Criteria 5 4 3 2 1 2 3 4 5 Criteria
X1 P X2
“Criteria X1 is more strong importance than criteria X2 (level 3)”
1) Comparing the criteria will be required, if knowing the traffic sign location.
Criteria 5 4 3 2 1 2 3 4 5 Criteria
Level of damage
of traffic sign* Context of traffic sign
2) Comparing the criteria will be required, if knowing the level of damage of traffic
sign.*
Criteria 5 4 3 2 1 2 3 4 5 Criteria
Traffic sign location Context of traffic sign
3) Comparing the criteria will be required, if knowing the the context of traffic sign.
Criteria 5 4 3 2 1 2 3 4 5 Criteria
Traffic sign location Level of damage
of traffic sign*
* Level of damage of traffic sign
Low effectiveness - Dirty sign
Moderate effectiveness - Damage sign,
- Less retroreflectivity
High effectiveness - Fade away
- Unclear message

93
Part III Evaluation the level of elements Very high High Moderate Low Very low
5 4 3 2 1
Example for answering the question
Element Factor 1 Factor 2
A 4 2
“Element A has high effect in Factor 1, and low effect in Factor 2”
1) Traffic sign location
Element
Stra
ight
Cur
ve
Slop
e/B
ridge
+ In
ters
ectio
n
T In
ters
ectio
n
Y in
ters
ectio
n
Rou
ndab
out
Rai
lway
Low level of damage of traffic sign
Moderate level of damage of traffic
sign
High level of damage of traffic sign
Element
Stra
ight
Cur
ve
Slop
e/B
ridge
+ In
ters
ectio
n
T In
ters
ectio
n
Y in
ters
ectio
n
Rou
ndab
out
Rai
lway
Speeding
Road way channelization
Overtaking
Hazardous road condition
Causes related to pedestrians and
animals
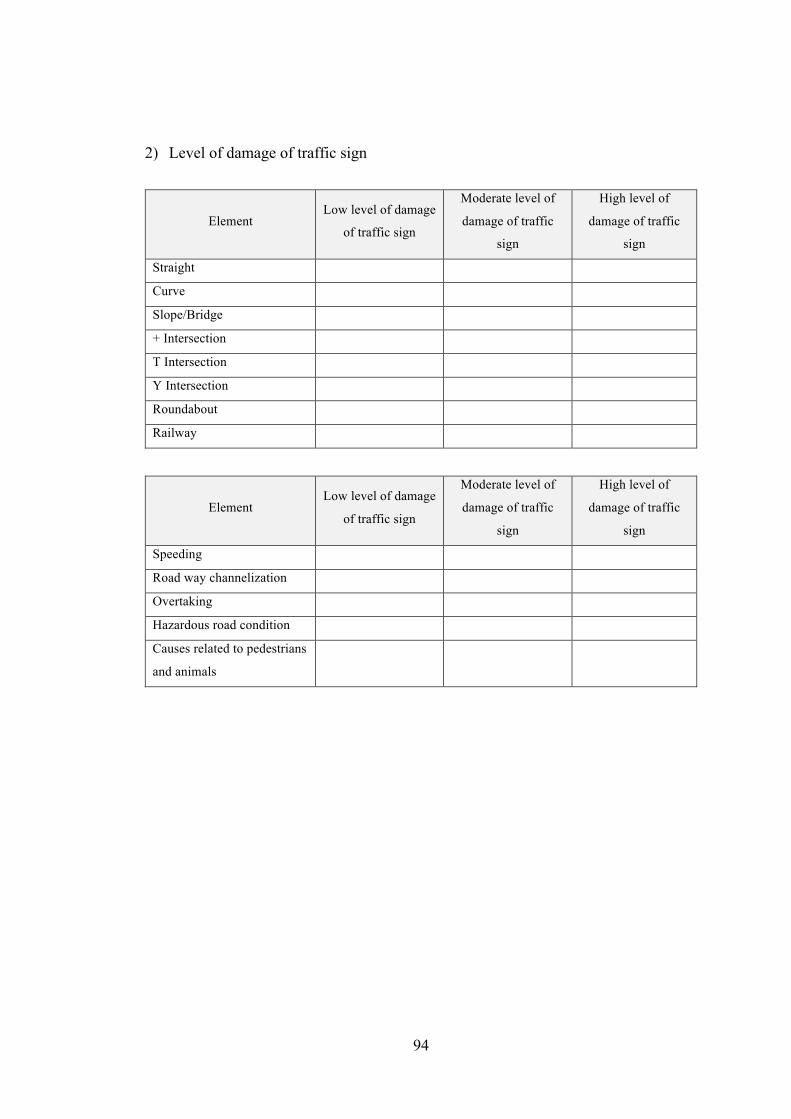
94
2) Level of damage of traffic sign
Element Low level of damage
of traffic sign
Moderate level of
damage of traffic
sign
High level of
damage of traffic
sign
Straight
Curve
Slope/Bridge
+ Intersection
T Intersection
Y Intersection
Roundabout
Railway
Element Low level of damage
of traffic sign
Moderate level of
damage of traffic
sign
High level of
damage of traffic
sign
Speeding
Road way channelization
Overtaking
Hazardous road condition
Causes related to pedestrians
and animals

95
3) The context of traffic sign
Element
Spee
ding
Roa
d w
ay
chan
neliz
atio
n
Ove
rtaki
ng
Haz
ardo
us ro
ad
cond
ition
Cau
ses r
elat
ed to
pede
stria
ns a
nd a
nim
als
Straight
Curve
Slope/Bridge
+ Intersection
T Intersection
Y Intersection
Roundabout
Railway
Element
Spee
ding
Roa
d w
ay
chan
neliz
atio
n
Ove
rtaki
ng
Haz
ardo
us ro
ad
cond
ition
Cau
ses r
elat
ed to
pede
stria
ns a
nd a
nim
als
Low level of damage of traffic sign
Moderate level of damage of traffic sign
High level of damage of traffic sign