principles of the calux method - foodlife international for the envi- carb column ... 57.662 25.233...
TRANSCRIPT

1
Dr. Peter A. Behnisch
Commercial Director BDS
Principles of the CALUX® method

2
What are dioxins?
C ly
O
O
C lx C ly C lxO
C ly C lx
Dioxins (75) Dibenzofurans (135)
PCBs (209)

3
vd Berg et al., 1998; vd Berg et al., 2006;
PCDDs / PCDFs PCBs Structure *WHO -TEF
1998
**WHO-TEF 2006
***CALUX REP
Structure *WHO -TEF 1998
**WHO-TEF 2006
***CALUXREP
Dioxins Non- ortho 2,3,7,8-TCDD 1 1 1 3,3,4,4,-tetraCB PCB-77 0.0001 0.0001 0.0013 1,2,3,7,8 -PeCDD 1 1 0.54 3,4,4,5-tetraCB PCB-81 0.0001 0.0003 0.0001 1,2,3,4,7,8 -HxCDD 0.1 0.1 0.3 3,3,4,4,5 -pentaCB PCB-126 0.1 0.1 0.067 1,2,3,6,7,8 -HxCDD 0.1 0.1 0.14 3,3,4,4,5,5 -hexaCB PCB-169 0.01 0.03 0.0034 1,2,3,7,8,9 -HxCDD 0.1 0.1 0.066 1,2,3,4,6,7,8 -HpCDD 0.01 0.01 0.05 Mono- ortho OCDD 0.0001 0.0003 0.0001 2,3,3,4,4 -pentaCB PCB-105 0.0001 0.00003 0.000012 2,3,4,4,5 -pentaCB PCB-114 0.0005 0.00003 0.000048 Furans 2,3,4,4,5 -pentaCB PCB-118 0.0001 0.00003 0.0000073 2,3,7,8-TCDF 0.1 0.1 0.32 2,3,4,4,5-pentaCB PCB-123 0.0001 0.00003 0.000024 1,2,3,7,8 -PeCDF 0.05 0.03 0.21 2,3,3,4,4,5 -hexaCB PCB-156 0.0005 0.00003 0.00021 2,3,4,7,8 -PeCDF 0.5 0.3 0.5 2,3,3,4,4,5 -hexaCB PCB-157 0.0005 0.00003 0.00008 1,2,3,4,7,8 -HxCDF 0.1 0.1 0.13 2,3,4,4,5,5 -hexaCB PCB-167 0.00001 0.00003 0.00001 1,2,3,6,7,8 -HxCDF 0.1 0.1 0.039 2,3,3,4,4,5,5 -heptaCB PCB-189 0.0001 0.00003 0.0001 1,2,3,7,8,9 -HxCDF 0.1 0.1 0.11 2,3,4,6,7,8 -HxCDF 0.1 0.1 0.18 1,2,3,4,6,7,8 -HpCDF 0.01 0.01 0.032 1,2,3,6,7,8,9 -HpCDF 0.01 0.01 0.041 OCDF 0.0001 0.0003 0.0001 * ** ***Hosoe et al., 2002
WHO-TEF values (1998 and 2006) vs CALUX-REP

4
GC-HRMS analysis of dioxins
Retention time
Rel
ativ
e pe
ek h
eigh
t

5
Toxic Equivalent (TEQ) calculation
concentration 1 x TEF1 = TEQ1concentration 2 x TEF2 = TEQ2concentration 3 x TEF3 = TEQ3
Compound 1: Compound 2: Compound 3: Compound n: concentration n x TEFn = TEQnTotal dioxin toxicity of mixture: SumTEQ
GCMS method
CALUX® methodDirect measurement of TEQ value of sample ≈
+
6
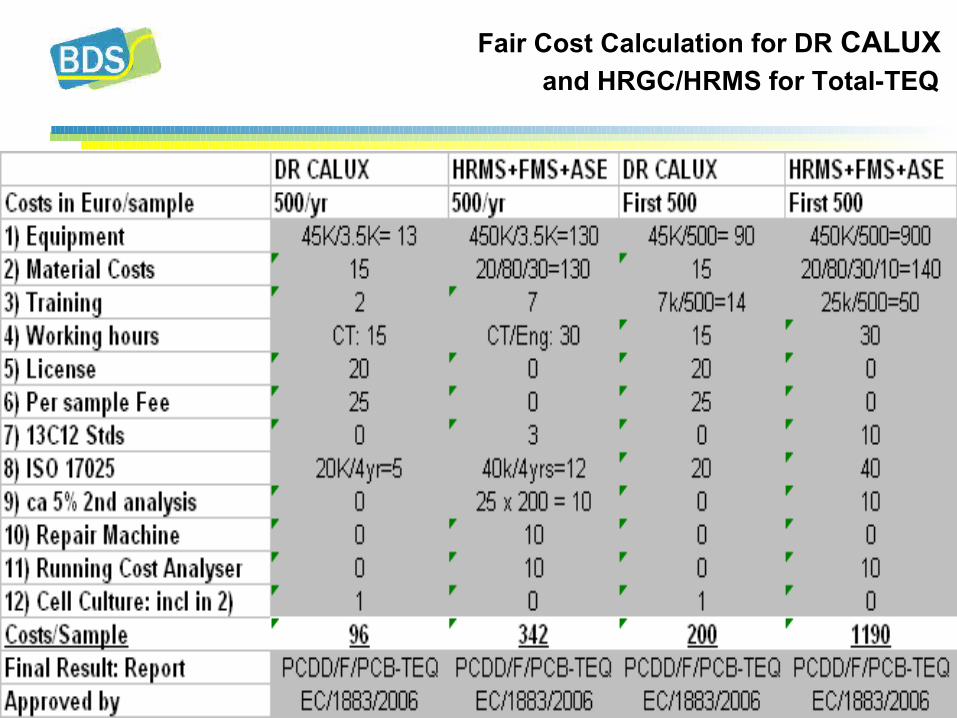
Fair Cost Calculation for DR CALUX and HRGC/HRMS for Total-TEQ
7
Advantages DR CALUX

8
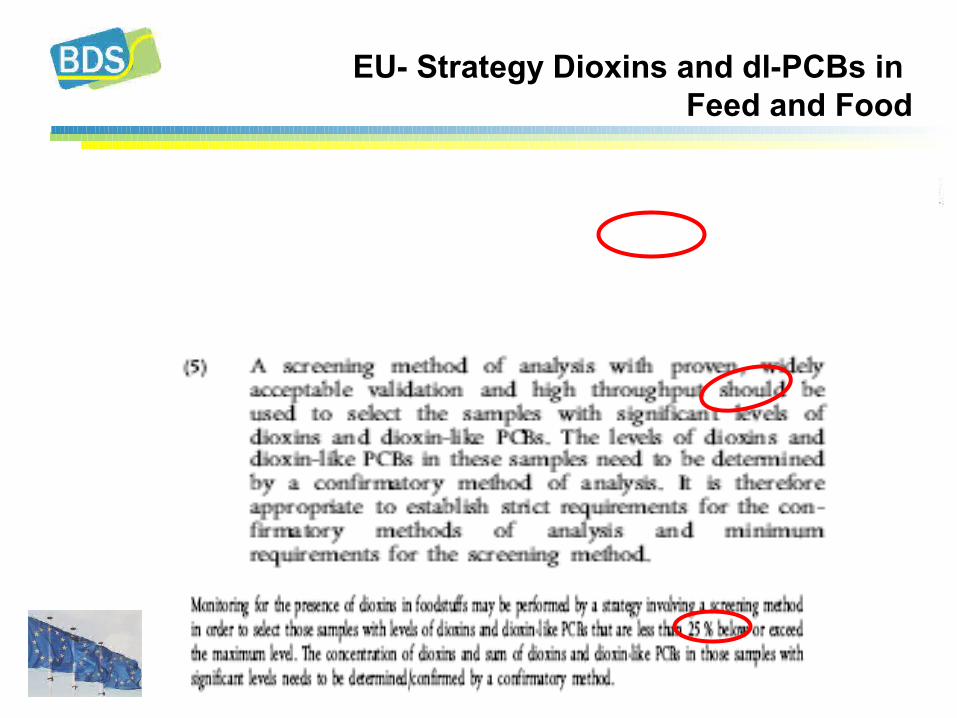
EU- Strategy Dioxins and dl-PCBs in Feed and Food

9
EC Project DIFFERENCE
• Food/Feed dioxin/PCB Testing according to EC/1883/2006 guideline
• 9 EU partners from 5 European Countries• 2002 to 2005 with a budget of ca. 500.000 Euro• Rapid (min. 24 hrs) and cost efficient (60% reduction) dioxin/dl-
PCB analysis by DR CALUX• See at www.dioxins.nl
Conclusion: International intercalibration test shows benefits (speed, cost, reliable, easy to learn) of using CALUX screening technology for PCDD/PCDF/co-PCBs analysis of a wide range of food/feed
10
EU- Strategy Dioxins and dl-PCBs in Feed and Food

11
DR CALUX® bioassay: analysis scheme
Methodology
Total TEQ “PCB” TEQ
1
2
3 4
5
6
7
5
6
7
1. Sampling
2. Standard fat
extraction3. Acid silica clean-
up4. Separation of dioxins andPCBs on carbon (75/25 %hexane/toluene)
5. Exposure in 96-well
plates6. Quantification light
emission7. Data
handlingDioxin/furan TEQs = Total TEQs – “PCB” TEQs

12
Extraction equipment
CALUX Exchange 2006

13
fluid
Shake extraction ASE
fat and oil
sonication
tissue food / feed
data
sediment / soil
sulfuric acid coated silica
sulfuric acid coated silica
sulfur removal
bio degradation(DR CALUX cell incubation)
Extraction and clean-up Overview

14
Matrix
AS
E
So
xh
let
Sh
ak
e-ex
tra
cti
on
wit
h HC
l A
Sh
ak
e-ex
tra
cti
on
wit
ho
ut
HC
L
son
ifica
tio
n
Palm oil fatty acids Soya fatty acids Palm oil Sunflower oil Technical fat (animal) Poultry fat Pig fat Citruspulp Maize gluten feed Soya shred Cocos shred Koekjesmeel Pig feed Poultry feed Palm kernel cake Sunflower shred Milk Butter Egg Fish feed Fish Fish meal Fish oil Meat Meat products
X X
X X X X
X X X X X X X X X X
X X X X X X X X X
X X X X X X X
X
Extraction methods for Food and Feed
15
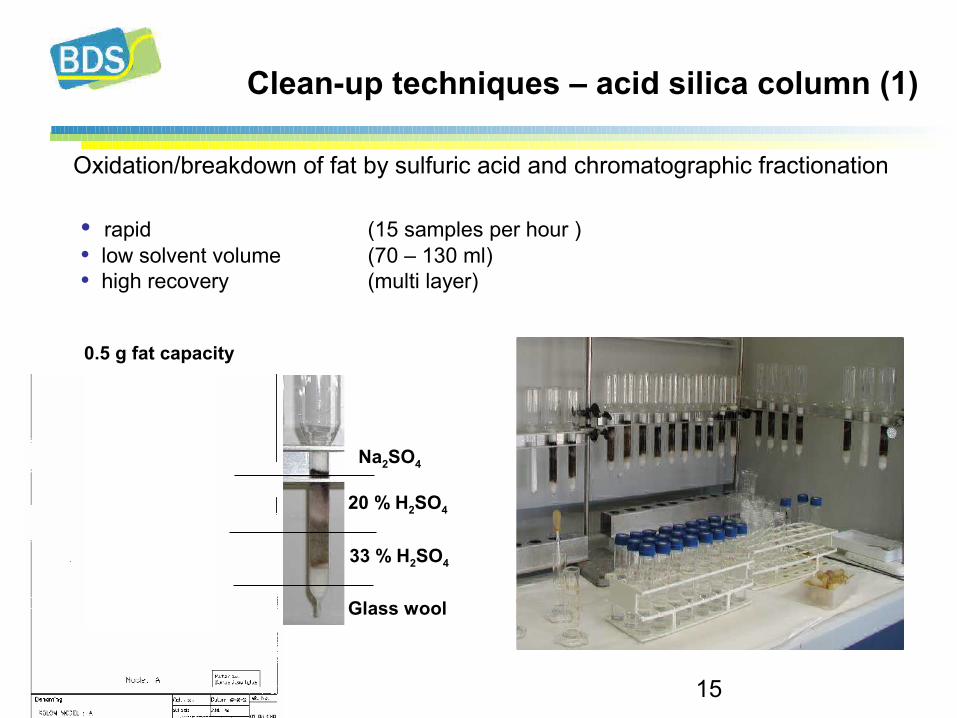
• rapid (15 samples per hour )• low solvent volume (70 – 130 ml)• high recovery (multi layer)
Glass wool
33 % H2SO4
20 % H2SO4
Na2SO4
0.5 g fat capacity
Oxidation/breakdown of fat by sulfuric acid and chromatographic fractionation
Clean-up techniques – acid silica column (1)

16
Clean-up techniques – carbon column (2) Separation coplanar PCBs dioxins/furans
Protocol for the Envi- Carb column from Supelco see at:
Concejero et al. J. of Chromatography A, 917 (2001), 227

17
Robustness - sonification vs shake extraction
1
2
3
4
5
67
8
0
1
10
100
0 1 10 100
Shake extraction (pg TEQ / g fat)
soni
ficat
ion
(pg
TEQ
/ g
fat)
y = 1.0714xR = 0.95442
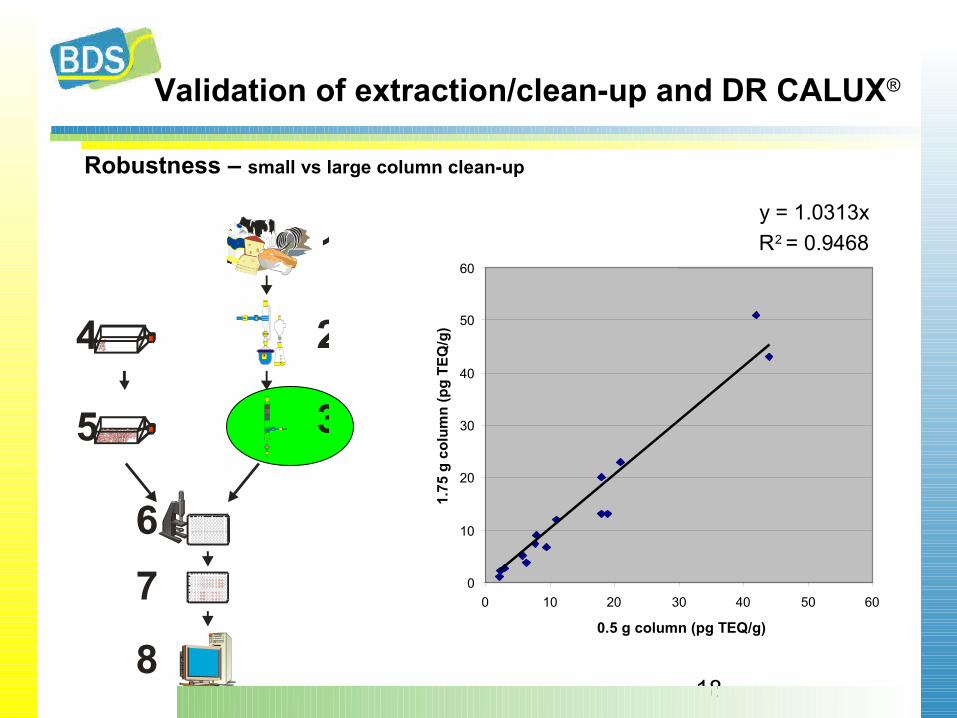
Validation of extraction/clean-up and DR CALUX®
18
y = 1.0313xR = 0.94682
0
10
20
30
40
50
60
0 10 20 30 40 50 60
0.5 g column (pg TEQ/g)
1.75
g c
olum
n (p
g TE
Q/g
)
1
2
3
4
5
67
8
Robustness – small vs large column clean-up
Validation of extraction/clean-up and DR CALUX®
19
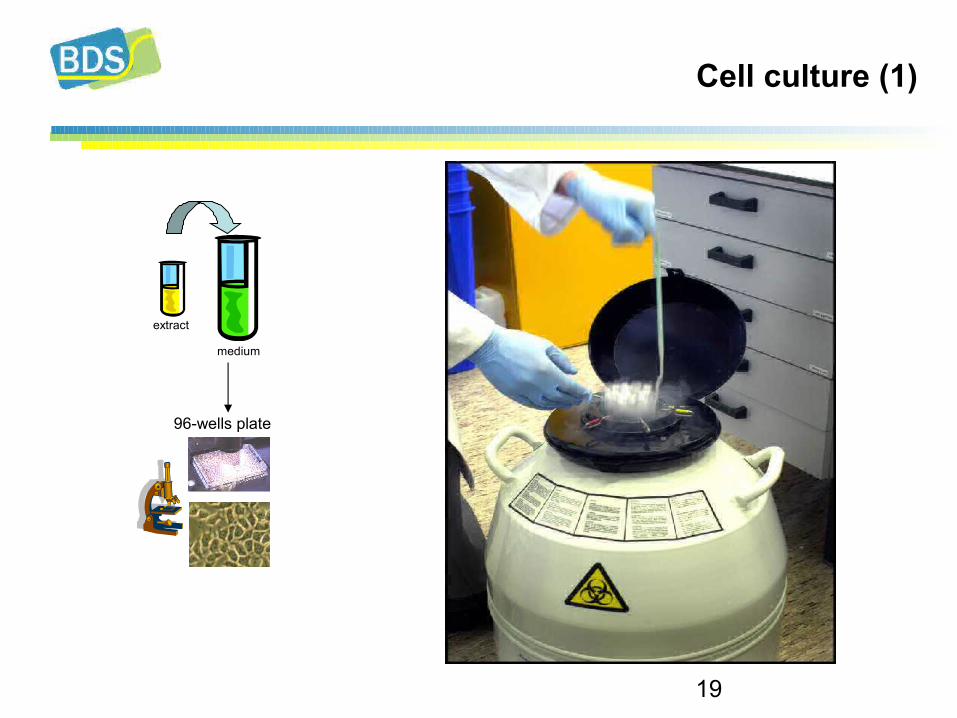
Cell culture (1)
extract
medium
96-wells plate
20
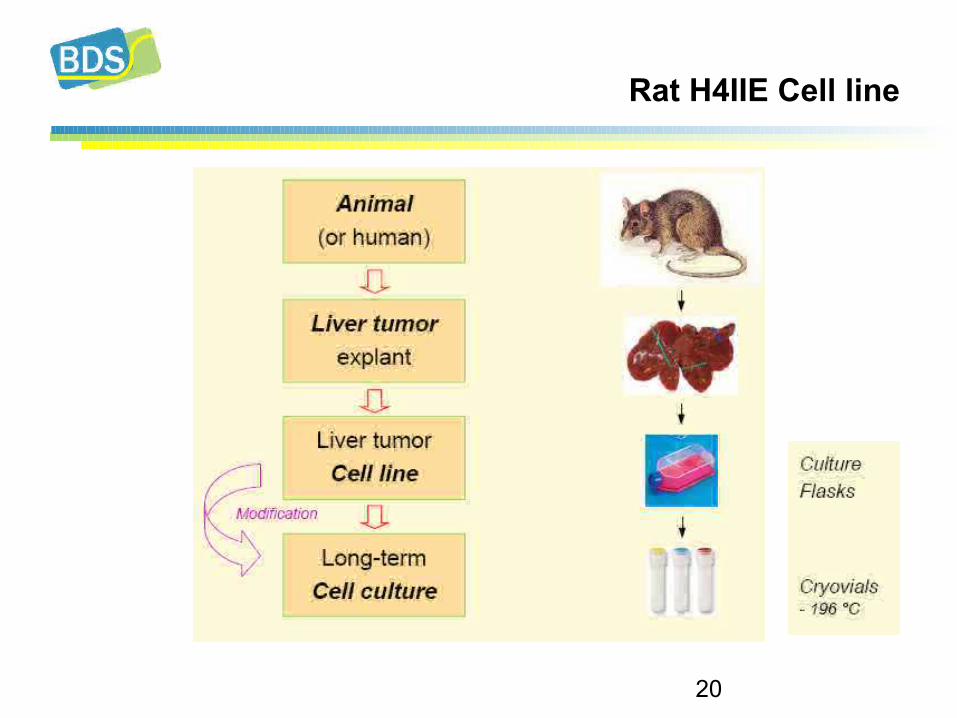
Rat H4IIE Cell line

21
DR CALUX: Monolayer Cell Lines

22
Main steps in Cell Culturing

23
Typical Cell Culture Room

24
Cell culture (3)

25
Preparing Microtiter Plates
26BDS Overview 2006
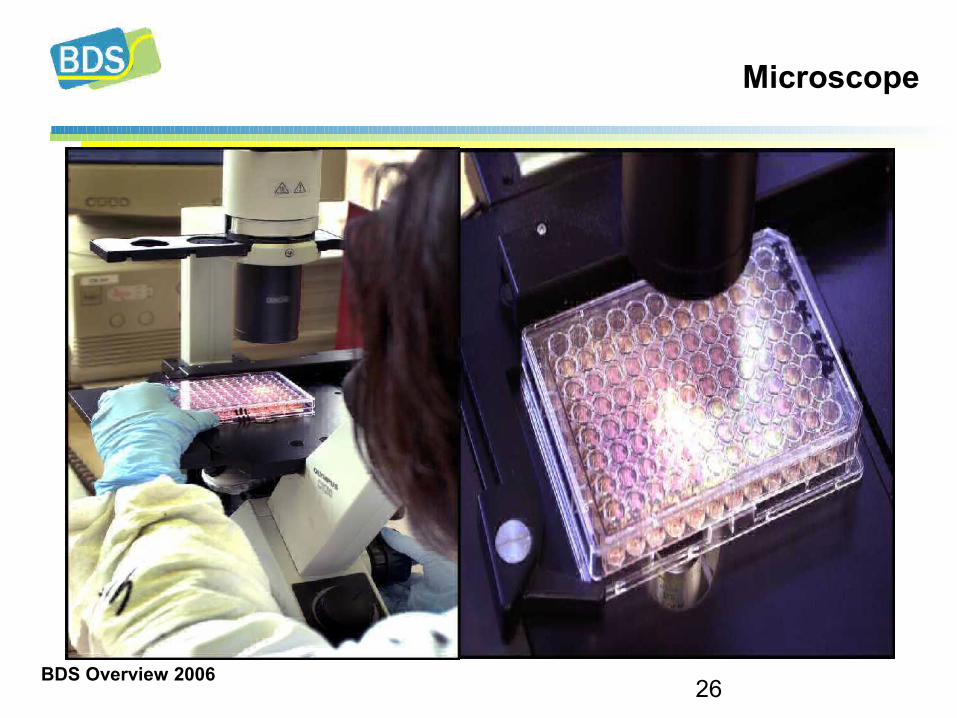
Microscope

27
Easy detection of light emission (6)
DR CALUX cells emit light whenever dioxin-like substances are present
Luminometer Centro XS3
Berthold Detection Systems

28
Comparison GC/MS vs CALUX of individual eel samples
0 10 20 30 40 50 60 70 80 90
CALUX content (pg TEQ/g)
0
10
20
30
40
50
60
70
GC/
MS
cont
ent (
pg T
EQ/g
)
Good relation total TEQ and CALUX-response
Virtual limitAction limit

29
0 20 40 60 80 100 120
GC/MS determined (pg i-TEQ/g fat)
0
20
40
60
80
100
120
CA
LUX
det
erm
ined
(pg
TC
DD
eq/
g fa
t)GC/MS vs DR CALUX®: fish oil

30
Dioxins and dl-PCBs in free-range eggs (2005)
0,0
2,0
4,0
6,0
8,0
10,0
12,0
14,0
16,0
18,0
-4,0 -2,0 0,0 2,0 4,0 6,0 8,0 10,0 12,0 14,0 16,0 18,0
GC/MS (pg TEQ/g vet)
CA
LU
X (p
g T
CD
D e
q/g
vet)
31
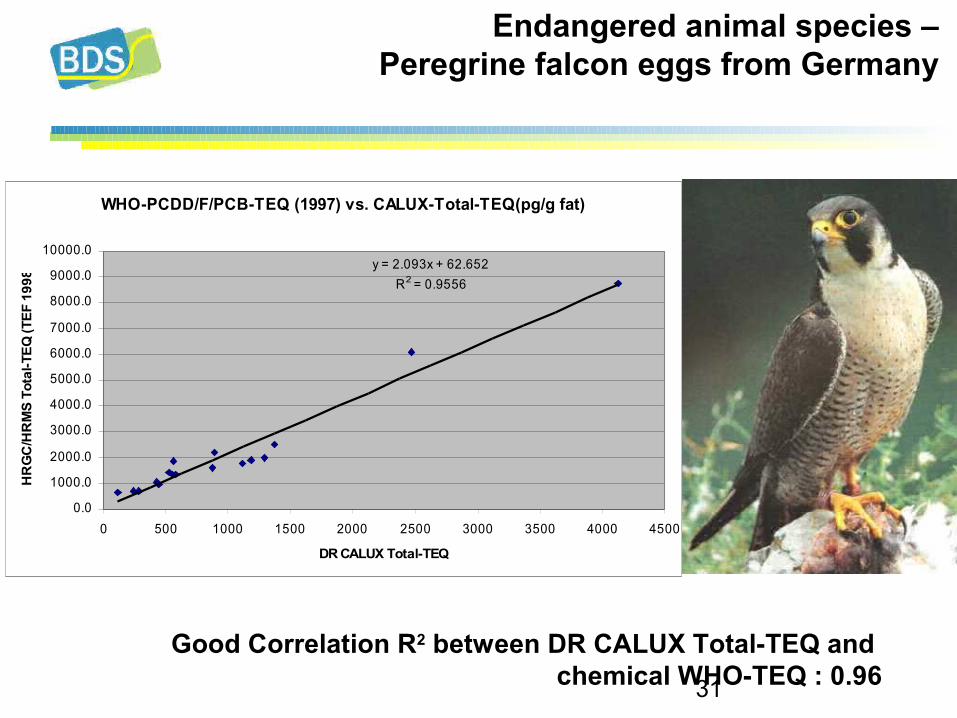
Good Correlation R2 between DR CALUX Total-TEQ and chemical WHO-TEQ : 0.96
Endangered animal species – Peregrine falcon eggs from Germany
WHO-PCDD/F/PCB-TEQ (1997) vs. CALUX-Total-TEQ(pg/g fat)
y = 2.093x + 62.652R2 = 0.9556
0.0
1000.0
2000.0
3000.0
4000.0
5000.0
6000.0
7000.0
8000.0
9000.0
10000.0
0 500 1000 1500 2000 2500 3000 3500 4000 4500
DR CALUX Total-TEQ
HR
GC
/HR
MS
Tota
l-TEQ
(TEF
199
8)
32
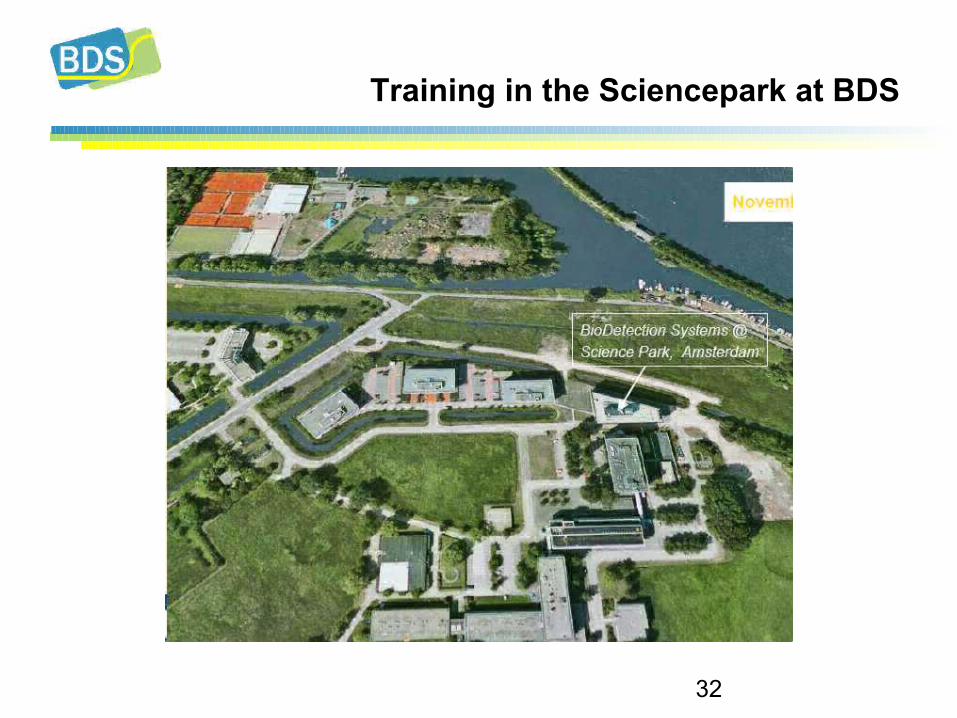
Training in the Sciencepark at BDS

33
Training at BDS

34
• Introduction training• BDS safety-rules• Extraction and clean up • TEF/REP/TEQ concept • Analysis strategy and EU-directives • QA/QC and troubleshooting• Validation
Presentations
• DR CALUX® analysis plan• Workplan• Calculations DR CALUX® results
Desk-work
• Extraction• Clean up • Cell maintenance /cultivation• Exposure of cells• Detection of luminescence
Lab-work
Training program
BDS Overview 2006

35
Training Overview

36
Lab equipment
ShakerAutoclav
Microvial-Evaporator
CO2 Incubator
Microscope, N2 Tank
Luminometer
37
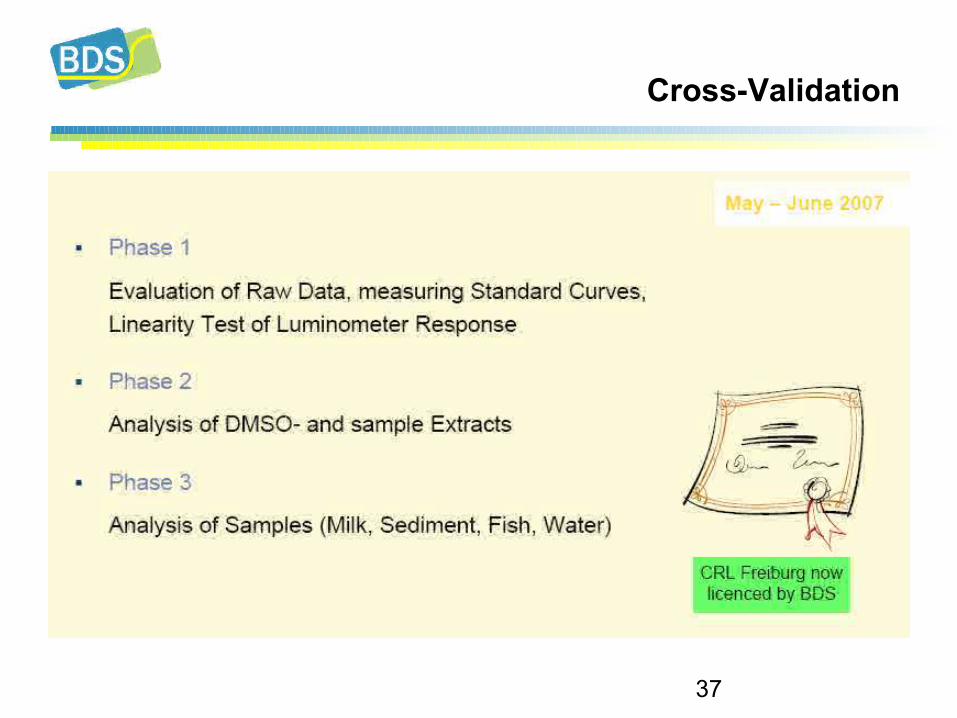
Cross-Validation
38
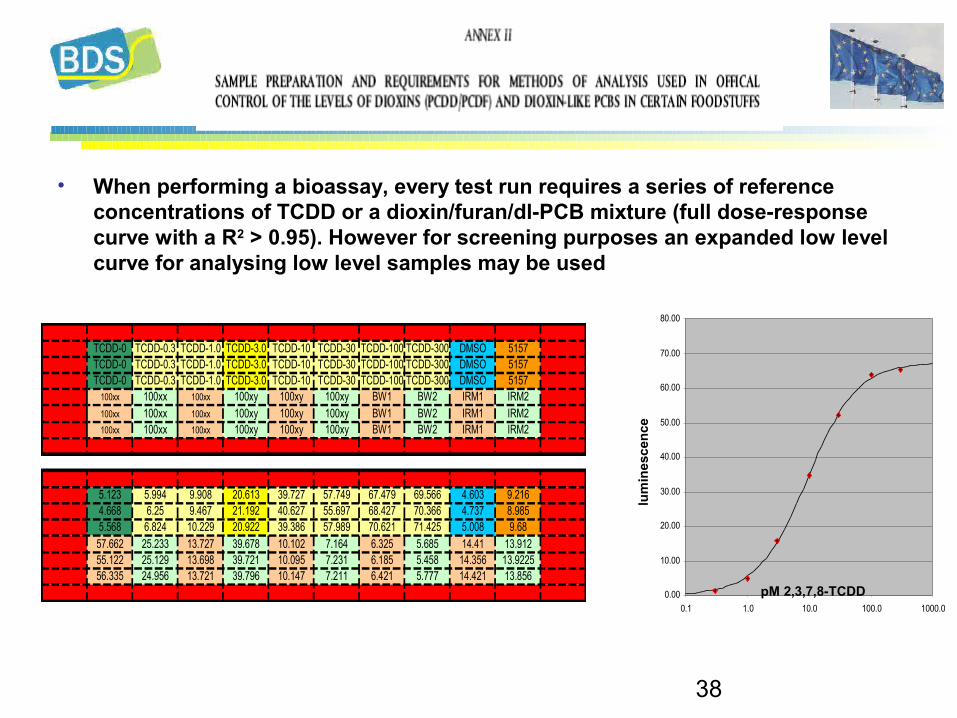
• When performing a bioassay, every test run requires a series of reference concentrations of TCDD or a dioxin/furan/dl-PCB mixture (full dose-response curve with a R2 > 0.95). However for screening purposes an expanded low level curve for analysing low level samples may be used
0.00
10.00
20.00
30.00
40.00
50.00
60.00
70.00
80.00
0.1 1.0 10.0 100.0 1000.0pM 2,3,7,8-TCDD
lum
ines
cenc
e
TCDD-0 TCDD-0.3 TCDD-1.0 TCDD-3.0 TCDD-10 TCDD-30 TCDD-100 TCDD-300 DMSO 5157TCDD-0 TCDD-0.3 TCDD-1.0 TCDD-3.0 TCDD-10 TCDD-30 TCDD-100 TCDD-300 DMSO 5157TCDD-0 TCDD-0.3 TCDD-1.0 TCDD-3.0 TCDD-10 TCDD-30 TCDD-100 TCDD-300 DMSO 5157
100xx 100xx 100xx 100xy 100xy 100xy BW1 BW2 IRM1 IRM2100xx 100xx 100xx 100xy 100xy 100xy BW1 BW2 IRM1 IRM2100xx 100xx 100xx 100xy 100xy 100xy BW1 BW2 IRM1 IRM2
5.123 5.994 9.908 20.613 39.727 57.749 67.479 69.566 4.603 9.2164.668 6.25 9.467 21.192 40.627 55.697 68.427 70.366 4.737 8.9855.568 6.824 10.229 20.922 39.386 57.989 70.621 71.425 5.008 9.6857.662 25.233 13.727 39.678 10.102 7.164 6.325 5.685 14.41 13.91255.122 25.129 13.698 39.721 10.095 7.231 6.185 5.458 14.356 13.922556.335 24.956 13.721 39.796 10.147 7.211 6.421 5.777 14.421 13.856
39
• A TCDD reference concentration (about 3 times the limit of quantification) on a quality control sheet shall be used for the outcome of the bioassay over a constant time period. An alternative may be the relative response of a reference sample in comparison to the TCDD calibration line since the response of the cells may depend on many factors
• A quality control (QC) chart for each type of reference material shall be recorded and checked to make sure the outcome is in accordance with the stated guidelines
Shewhartkaart 3 pM punt
2.5
2.7
2.9
3.1
3.3
3.5
1 2 3 4 5 6 7 8 9 10 11 12 13 14 15 16 17 18 19 20 21 22 23 24 25 26 27 28 29 30 31 32 33
nr
-->
pM
2,3
,7,8
-TC
DD
in
we
ll
-2 * s
+2 * s
-3 * s
+3 * s
gem

40
DR C ALU X ® rec overy
Food/feed analysis by DR CALUX®
3.0
matrix final TEQ avg TEQ % std % recovery
animal fat 2.0 2.5 9.2 124
egg 5.0 3.6 3.5 72
milk products 3.0 3.0 8.1 98
vegetable fat 1.5 1.1 7.6 73
feed components 1.5 1.4 12.6 89
feed 3.8 21.9 79

41
Overview of DR CALUX reference materials
BDDs reference materials fish oil and feed material:• half of the EU limit value for dioxins, • at the EU level for dioxins and • at the EU limit for Total TEQ (Dioxins and dl- PCBs)

42
Performanc e of DR C ALU X ® for various food and feeding s tuffs
Foodstuffs Weig ht (g )
EU -Lim it
TE Q pg /g lipid
LOQ R epeatability (% )
R eproduc ibility (% )
Oils /fa ts plant orig in
7.0 0.75 0.14 18 32
Animal oils /fa ts 5.0 1.0 0.20 16 13
M ilk/M ilk produc ts
2-50 3 0.60 11 16
E g g 17 3 0.60 10 21
Fis h/Fis hproducts
9 4 0.11 13 25
Fis h oil 3.5 2 0.28 26 14Feedingstuffs
Feed plant orig in*
9 0.75 0.11 11-19 13-26
Feeding s tuff for fis h
9 2.25 0.11 14 27
Fis h/Fis h produc ts
9 1.25 0.11 13 25
Fis h oil 1 6 1.0 26 14
* ng TEQ/kg

43
Proficiency test performance BDS
-2
-1.5
-1
-0.5
0
0.5
1
1.5
2
0 5 10 15 20 25 30 35 40 45 50Z-SC
OR
E
Orebro univeristy, round 1
Dutch National Institute for Coastal and Marine Management
European Commission, Joint Research Centre
Norwegian Institute of Public Health in Oslo, Norway
BICS 2005
Orebro univeristy, round 2
Goeyens, Belgium
Quasimeme round 48

44
Sample report of DR CALUX® results
Table 2. Results of the DR CALUX bioassay.
DR CALUX® TEQ Client code BDS-code
PCDD/F specific dl-PCB specific
ISO17025 (RvA-L401)
C 12 1.5 4.7 (pg TEQ/g fresh weight) yes F 15 0.85 1.5 (pg TEQ/g fat) yes
Note 1: All DR CALUX® analysis results comply with EU requirements as indicated in COMMISSION DIRECTIVE 2002/70/EC (laying down the sampling methods and the methods of analysis for the official control of dioxins and the determination of dioxin-like PCBs in feedstuffs) and in COMMISSION REGULATION (EC) No 1883/2006 (laying down the sampling methods and the methods of analysis for the official control of dioxins and the determination of dioxin-like PCBs in foodstuffs). Intralaboratory repeatability and reproducibility are less than 15 and 30% respectively.
Note 2: Data are quantifiable between the limit of quantification (LOQ) and the EC50. Only results within this range are included in the final analysis results. For results below the limit of quantification, an estimate is given (between parentheses).
Note 3: PCDD/F-PCB-TEQ are analysed as DR CALUX® TEQs and benchmarked against a 2,3,7,8-TCDD calibration curve

45
Council Requirements 1883/2006 and 152/2009

46
Council Requirements 1883/2006 and 152/2009

47
ISO 17025 Accreditation