principles of gis lab notes · pdf filethe hong kong polytechnic university department of...
TRANSCRIPT

THE HONG KONG POLYTECHNIC UNIVERSITY
DEPARTMENT OF LAND SURVEYING &
GEO-INFORMATICS
LSGI521 PRINCIPLES OF GIS
Student name:
Student ID:

Table of Content
Working with files, folders, various software and hardware…………………………………………….2
Exercise 1 – Data preparation for LIC Basemap ...................................................................................... 6 A. Import data from e00 to coverage ............................................................................................... 6
B. Merge data .................................................................................................................................. 7
Exercise 2 – Displaying data and Querying data ...................................................................................... 8
A. Symbolize your data ................................................................................................................... 8
B. Label your data.......................................................................................................................... 11
C. Display the attributes of a particular feature on a view ............................................................. 11
D. Select features with the mouse .................................................................................................. 11
E. Select features with graphics ..................................................................................................... 12
F. Select features by querying attribute table ................................................................................ 13
G. Find features by spatial query ................................................................................................... 13
Exercise 3 - Editing data ........................................................................................................................ 15
A. Start an edit session ................................................................................................................... 16
B. Set the snapping environment ................................................................................................... 16
C. Skills of working with mouse ................................................................................................... 17
D. Digitize features ........................................................................................................................ 17
E. Stop editing and save you work................................................................................................. 17
F. Calculate Value ......................................................................................................................... 18
Exercise 4 - Plotting your map ............................................................................................................... 19
A. Create a layout.......................................................................................................................... 19
B. Control scale ........................................................................................................................... 20
C. Add elements on the map ......................................................................................................... 20
D. Make grid line .......................................................................................................................... 20
Exercise 5 - Making 3D TIN model and terrain analysis ....................................................................... 22
A. Create TIN model ..................................................................................................................... 22
B. 3D Visualization....................................................................................................................... 23
C. Analysis slope aspect with TIN model ..................................................................................... 23
Assignments to be submitted. ................................................................................................................. 25

2
Working with files, folders, various software and hardware
How to get the lecture notes and other related facilities
1. Using computers inside LSGI computing labs,
Start Menu � LSGI, PolyU Directory � Homework Submit- Students paste any online
submission.
Local D Drive - Access the local D drive of your
occupied computer.
Network_Home_Folders_(All students) – Students keep
any storage inside the LSGI server.
Teaching Materials – Students download any teaching
materials here.
Please click LSGI521 for downloading both the lecture notes and lab handouts.
OR
2. Using Intranet of LSGI website
Go to LSGI Website and click Intranet ���� Student. After the insertion of username and password,
please click “I agree & answer truthfully” for proceeding.
Homework Submit
Teaching
FoldersMaterial
Local_D_Drive
Network_Home_Folders_
(All students)

3
Come to a new page and select “Download Resources”, click “Teaching Materials”. You can similarly
retrieve to the above materials.
How to access your own student directory
In Room FG311/FG307, every time you finish doing something and before you leave the room, it is
extremely important and safe to save the file (i.e. the folder and/or data you created) into your own
student directory in both ways:
Start – Programs – LSGI, PolyU Directory – Local D drive. You can save your files temporarily in
d:\00-temp\. Here, you’ll create a folder with your own student no. Once you finish every practical,
please backup your files into Student Storage inside LSGI server or MYDRIVE system every time.

4
After you have inputted the required username and password to access the MYDRIVE, you may click
to this page “Access myStore” for storage.
How to open ArcView 9.2
Go to start -> All Programs -> ArcGIS. ArcView 9.2 is composed of ArcCatalog, ArcMap, ArcToolbox
and so on.
ArcCatalog is used for:
• Browse your graphical or textual data
• Manage and define your data
• Set and view metadata
ArcMap is used for perfoming map-based tasks such as mapping, editing, queries, analysis, graphing
and reporting.
ArcToolbox is used for data conversion and advanced geoprocessing functions.

5
In the exercise, you will use ArcCatalog and ArcMap frequently. You can try to browse data in
ArcCatalog and add data into ArcMap in this lesson.
How to submit assignments
You should submit your assignments before deadline either using Homework_Submit\LSGI521\
“Submission No” \Stud ID, or using LSGI website with same path.
Practical for Continuous Assessment: 50%

6
Exercise 1 – Data preparation for LIC Basemap
In this exercise, you will learn how to import Basemap data into ArcView 9.2 software. Since Hong
Kong basemap data supplied by the Government (Land Information Centre, Survey and Mapping
Office of Lands Department) is provided in ArcInfo export format – e00, data should be converted
from e00 to coverage format and therefore you can view data in this software.
A. Import data from e00 to coverage
Please download the Basemap folder inside the lab folder of LSGI521teaching materials.
In this part, you learn to convert e00 files into ArcInfo coverage format for BLDG and CONT layers.
And you have to convert total 14 tiles (11swa, 11swb, 11swc, 11swd, 11sea, 11seb, 11sec, 11sed,
15nwa, 15nwb, 15nea, 15neb, 15nec, 15ned). Inside it, there are 13 files showing the topographic
information in Hong Kong.
These tiles are B5000 Hong Kong digital maps in a scale of 1:5000, supplied by the Lands Department.
The reason why you do such data conversion is the e00 cannot be directly read by the ArcGIS software.
Steps:
1. Copy e00 files in teaching materials server.
2. Create a new folder to store coverage files temporarily in local d drive, e.g d:\00-temp\stud-
id\LSGI521\coverage\
3. In ArcCatalog, click the View menu, click Toolbars, then click the ArcView 8.x Tools toolbar.
4. Click the Conversion tools drop-down menu and click Import from Interchange File. (It is
a conversion program that converts an ARC/INFO interchange file created on any other
operating system into an ARC/INFO 7.x coverage. If you receive ARC/INFO data in
interchange format you can use ArcToolbox to convert it to a data source in a format that can
be added to map document in ArcView 9.2).
5. Click the Input file Browse
button and navigate to the .e00
file to be imported.
6. Click the .e00 file and click
Open.
7. Click the
Output
dataset
Browse
button and
navigate to
the location
for the
output
dataset to be
stored, then
click Save.
8. Click OK.
7
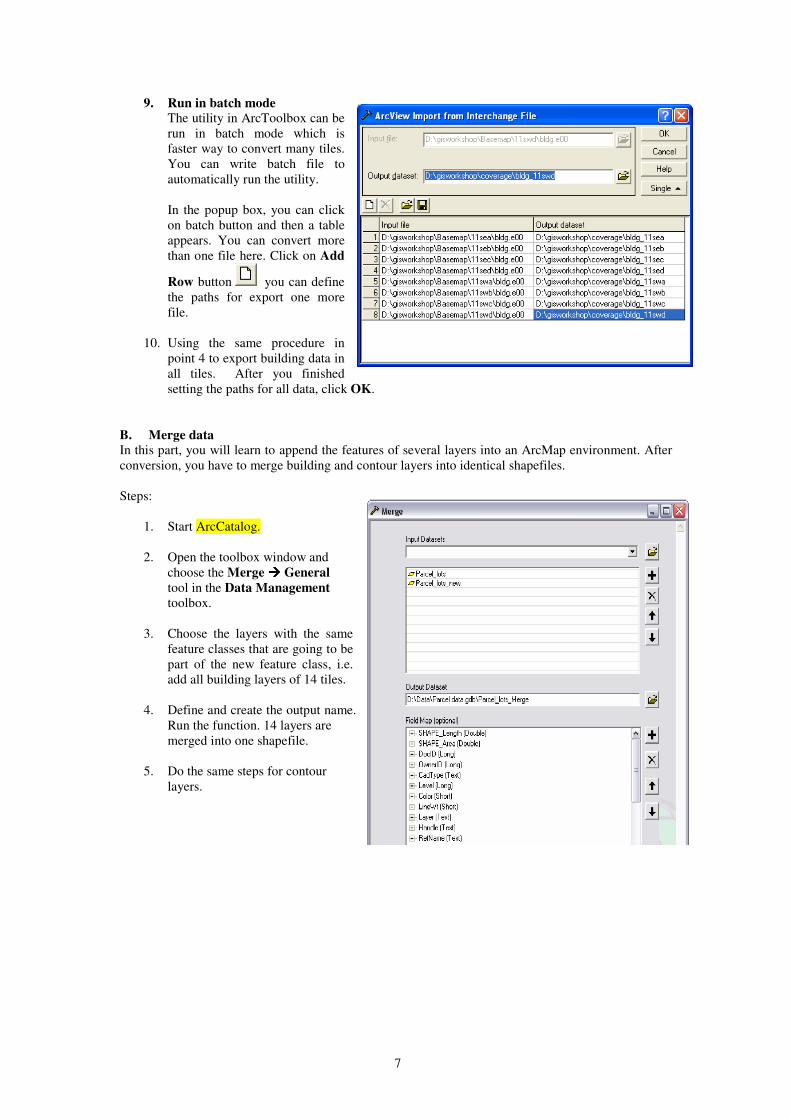
9. Run in batch mode
The utility in ArcToolbox can be
run in batch mode which is
faster way to convert many tiles.
You can write batch file to
automatically run the utility.
In the popup box, you can click
on batch button and then a table
appears. You can convert more
than one file here. Click on Add
Row button you can define
the paths for export one more
file.
10. Using the same procedure in
point 4 to export building data in
all tiles. After you finished
setting the paths for all data, click OK.
B. Merge data
In this part, you will learn to append the features of several layers into an ArcMap environment. After
conversion, you have to merge building and contour layers into identical shapefiles.
Steps:
1. Start ArcCatalog.
2. Open the toolbox window and
choose the Merge ���� General
tool in the Data Management
toolbox.
3. Choose the layers with the same
feature classes that are going to be
part of the new feature class, i.e.
add all building layers of 14 tiles.
4. Define and create the output name.
Run the function. 14 layers are
merged into one shapefile.
5. Do the same steps for contour
layers.

8
Exercise 2 – Displaying data and Querying data
In this exercise, you will learn the basic functions of ArcView 9.2 software. It involves representing
our data by different color and symbols and querying spatial data by attribute table and their spatial
relationships.
Please download the Coverage folder into your local D drive.
A. Symbolize your data
You will learn how to symbolize your data involves choosing colors and symbols that will represent
features. It also involves grouping or classifying features according to their attribute values.
Drawing a layer using a single symbol
Steps:
1. Add wanchai_road.shp in ArcMap .
2. In the table of contents, right click wanchai_road layer you want to draw with a single symbol
and click properties.
3. Click the
Symbology tab.
4. Click Features.
Because Single
symbol is the
only option,
ArcMap
automatically
selects it.
5. Click the Symbol
button to change
the symbol.
6. In the Symbol
Selector dialog
box, click a new
symbol or change
specific properties,
e.g. color and width of the symbol.
7. Click OK on the Symbol Selector dialog box.
8. Click OK.

9
Drawing a layer showing unique values
Steps:
1. Add bldg.shp in ArcMap .
2. In the table of contents, right click the building layer you want to draw showing unique values
and click Properties.
3. Click the Symbology tab.
4. Click Categories. ArcMap automatically selects the Unique values option.
5. Click the Value
Field dropdown
arrow and select
Type from value
field.
6. Click the Color
Scheme
dropdown arrow
and click a color
scheme.
7. Click Add All
Values. This
adds all unique
values to the list.
Alternatively,
click the Add
Values button to
choose which
unique values to
display.
8. Since BLK value
represents no
building, set blank
color for BLK
value and set
same color for the
other values.
9. You can group
other types into
one type. Select
other types and
right click.
Choose Group
Values.

10
10. If you want to
have more
descriptive labels,
click a label in
the Label column
and type a new
one, e.g.
buildings.
11. Click OK.
12. Add the other
layers:
coastline.shp,
bus_stop.shp and
set symbols for
those layers.

11
B. Label your data
You will learn how to label layers with information from attribute tables. You can also add additional
information by typing text directly on your map. It is useful to label building name, road name etc
when producing map.
Steps:
1. Select
wanchai_road
layer.
2. Right click �
properties �
click Labels Tab.
3. Tick the option
‘Label Features in
this layer. Select
Label Field is
STREET_ENG.
And you can set
the font size and
color of labels by
clicking Symbol
button. Press OK.
4. Therefore, the
road layer is
labeled with English road name.
C. Display the attributes of a particular feature on a view
The Identify tool
lets you display the
attributes of features on
a view by clicking on
them with the mouse.
Choose the Identify tool
and click on any feature
on the map to display its
attributes. Click the
Layers dropdown arrow
in the dialog box to
specific which layers
you want to identify.
Try to use the identify Tool until you feel familiar with it.
D. Select features with the mouse
The Select Feature tool lets you select features with the mouse by pointing at them or by
dragging a selection box over them. Features that fall partly or wholly inside the box you define will be
selected. Features will be selected from all of layers (default).
To specific which layer(s) to be selected, click Selection on the main menu and click Set Selectable
Layers.

12
You can also select features in attribute table.
Steps:
1. Select the layer.
2. Right click Open Attribute Table button. The attribute table is displayed and the records for
the features you selected are highlighted.
3. To display the highlighted records only, click Selected button at the button of table.
4. You can deselect the selected features in the layer by clicking Selection menu � the Clear
Selected Features button .
Try to use Select Feature tool to select some features, show selected records and clear selection until
you feel familiar with these tools.
E. Select features with graphics
Using the Drawing tool palette you can draw a circle, rectangle or irregular graphic to select features. If
you can’t find the draw tool bar, go to View menu � Toolbar � Tick Draw.
Steps:
1. Click Polygon button from draw toolbar and draw the polygon on the map.
2. To specific which layer(s) to be selected, click Selection on the main menu and click Set
Selectable Layers. For example, you make wanchai_road is selectable only.
3. Click Selection menu � Select by Graphics .

13
F. Select features by querying attribute table
Build a query with the when you want to select features according to their
attribute values.
Steps:
1. Suppose you are going to find out all
buildings in the “building” layer
whose area is larger than 500 square
metres. Make the “building” them
active.
2. Click on the Select menu � Select By
Attributes.
3. Select building layer and specify you
conditions as shown in the following
figure.
4. Click the Apply button.
5. If there are any features satisfying the
conditions, they will be selected and
highlighted in yellow in the view
window.
Try using this method to find features from your
layers and record your queries (no less than 3)
in the following table.
Query Query conditions in Query builder Number of selected features
Select buildings which are not
BLK type and area > 500
Select the name of Wan Chai
roads include this word
“QUEEN”
Select road with name
starting with the letters “R to
Z”
G. Find features by spatial query
You will learn how to do spatial query using the tool to make queries of
spatial relationship like “within distance of” and “completely within (i.e. inside)”.
Steps:
1. Suppose you want to find out bus stop which are within the buildings, i.e those stops may has
problem.
2. Select building layer � Properties � Definition Query � Query Builder. Select type is
not equal to BLK. Therefore, only type is not equal to BLK will be displayed. Since blank
polygons are also in the building layer, if we don’t exclude those polygons, the software will
query the bus_stops and blank polygons and therefore all bus stops will be selected.

14
3. Go to Select menu �
Select by Location.
4. Select bus_stop.
5. Select Interest first
combo box and select
layer which overlay
with building layer.
6. Click Apply.

15
Here, you are required to use at least two more spatial relations, “intersect” and “complete contain”.
You are encouraged to try all spatial relationships available in the tool. Record you spatial queries (no
less than 4) in the following table.
(a) Name of
layers(s) to select
features from
(the first
dropdown box)
The shape type of (a)
(e.g. line, point or
polygon)
the spatial
relation
(b) Name of layer
to select by
The shape type of
(b)

16
Exercise 3 - Editing data
In this exercise, you will learn editing skills for spatial data. You shall create one line shapefile and one
polygon shapefile in ArcCatalog to practise the following edit functions.
Preparation - Creating a new shapefile
1. Select a folder or folder connection in the Catalog tree.
2. Click the File menu, point to New, and click Shapefile.
3. Click in the Name text box and type a name for the new shapefile.
4. Click the Feature Type drop-down arrow and click the type of geometry the shapefile will
contain.
5. Click OK.
The new shapefile appears in the folder's contents.
A. Start an editing session
1. Add the shapefile you want to edit in ArcMap by clicking the Add Data button . If the
shapefile is already added, skip this step.
2. Click Editor and click Start Editing. If you can’t find Editor toolbar, click View � Toolbars
� Editor.
3. Click Create New Feature in the Task dropdown arrow.
4. Click the Target layer you want to edit.
5. Click the tool palette dropdown arrow and click the Sketch tool.
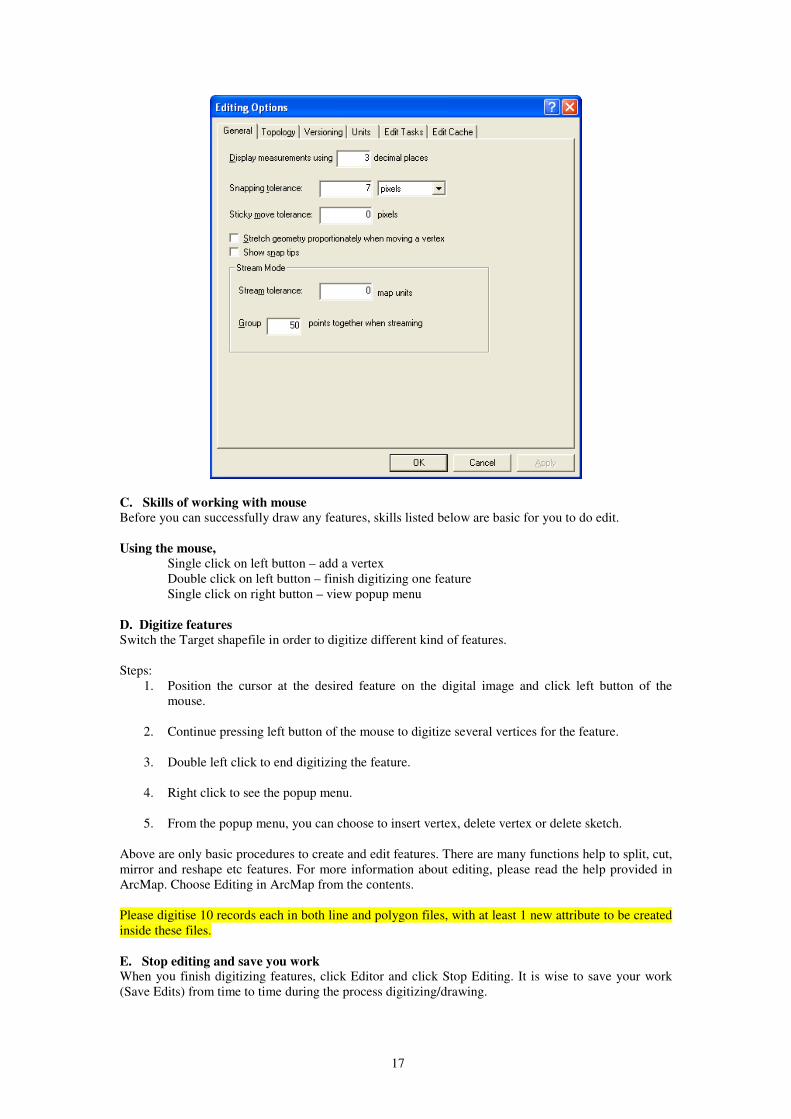
B. Set the snapping environment
When you edit the lines, you may not sure whether the line is snapped and therefore it may affect the
data accuracy. Setting the snapping environment can help snap the lines automatically.
Steps:
1. Go to Editor � Start editing.
2. Go to Editor � Snapping.
3. In the Snapping Environment dialog,
choose which layer you want to snap and
also you want to snap to vertex, edge and
end.
4. If you want to set snapping tolerance, go to
Editor � options � General tab.
17
C. Skills of working with mouse
Before you can successfully draw any features, skills listed below are basic for you to do edit.
Using the mouse,
Single click on left button – add a vertex
Double click on left button – finish digitizing one feature
Single click on right button – view popup menu
D. Digitize features
Switch the Target shapefile in order to digitize different kind of features.
Steps:
1. Position the cursor at the desired feature on the digital image and click left button of the
mouse.
2. Continue pressing left button of the mouse to digitize several vertices for the feature.
3. Double left click to end digitizing the feature.
4. Right click to see the popup menu.
5. From the popup menu, you can choose to insert vertex, delete vertex or delete sketch.
Above are only basic procedures to create and edit features. There are many functions help to split, cut,
mirror and reshape etc features. For more information about editing, please read the help provided in
ArcMap. Choose Editing in ArcMap from the contents.
Please digitise 10 records each in both line and polygon files, with at least 1 new attribute to be created
inside these files.
E. Stop editing and save you work When you finish digitizing features, click Editor and click Stop Editing. It is wise to save your work
(Save Edits) from time to time during the process digitizing/drawing.

18
F. Calculate Value
When editing the attribute table, you can use Field Calculator to calculate the value of the field. For
example, you can calculate length and area.
Steps:
1. Open the attribute table.
2. Choose Start Editing from the Editor toolbar.
3. Add a numeric field to the table e.g length, click the name of the field to select it.
4. Click the length column and right click and choose the Calculate button to display the
Field Calculator dialog.
5. In dialog, click on the Length field name so that it looks pushed down. Then, right click the
function Calculate Values. The following window prompts. Check the Advanced box. Type
the following VBA script inside that box.
Dim length as double
Dim pCurve as ICurve
Set pCurve = [Shape]
Length = pCurve.Length
Then also type “pCurve.Length” in the Length box, and then click OK.
6. Think about how to get the area, perimeter, x or y coordinates using VBA Script code.
Remark: For more information about making field calculations, please go to ArcGIS Desktop
help and search ‘making field calculations’ about the VBA script details.

19
Exercise 4 - Plotting your map
After having done analysis, you have to plot your result in previous exercise in paper map. In this
section, you learn to design and produce quality map and plot it out in A3 size.
A. Create a layout
Steps:
1. At the left lower corner, switch to Layout View .
2. In the Layout toolbar, you can change the template by using select template button .
3. Select the template you want.

20
B. Control scale
Steps:
1. Click View � Data Frame
Properties.
2. Set Map and Display units to
Meters.
3. Select Data Frame Tab, you can
choose Fix Scale, e.g. 1:5000.
C. Add elements on the map
Steps:
1. Go to Insert menu, you can add new
components to a layout such as scale
bar, north arrow frame, text, image
and chart.
2. You can also use draw toolbar to
add graphics such as neatlines,
boxes, circles and arrows anywhere
on your layout.
D. Make grid line Steps:
1. Click View � Data Frame
Properties.
2. Select Grids Tab.
3. Click New Grid and select
Measure Grid. Click Next.
4. Select Grid and labels. Type
in the interval is 500. You
can change symbol style by
clicking Style button. Click
Next.

21
5. You can change the style for border and the font size.
6. Tick the options in Measured Grid Border and Neatline. Click Finish.

22
Exercise 5 - Making 3D TIN model and terrain analysis
For this final exercise, you will learn to TIN model by using contour data. Also, you will perform some
terrain analysis based on the TIN model. To perform this exercise using the Coverage folder, 3D
analyst extension is required.
A. Create TIN model
Steps:
1. Go to View � Toolbars � 3D Analyst.
2. Also, go to Tool menu � Extensions �
Tick 3D Analyst Option. Otherwise, the
function in 3D Analyst toolbar will be
enabled.
3. In ArcMap, add Contour layer by Add Data
button and select one part of contour.
4. In 3D Analyst toolbar, go to Create/Modify
TIN � Create TIN from features.
5. In the dialog, tick Contour layer, select you
Cont_ht from Height source and input as hard
or soft breaklines. Define the output file path
and name. Then press OK.

23
B. 3D Visualization
With TIN model, you can have 3D view of terrain. Go to All Programs � ArcGIS � ArcScene. All
the tin layer in ArcScene and therefore you can visual 3D view of the terrain model.
C. Analysis slope aspect with TIN model
One of application for TIN model is to analysis
slope aspect. Slope aspect is useful for
engineering project to indicate the steepness of
slope, especially for those slopes near roads.
Steps:
1. In ArcMap or ArcScene, click the 3D
Analyst menu on the toolbar, point to
Surface Analysis, and click Slope.
2. Select the surface
from which you want
to derive a raster of
slope values.
3. Click Degree or
Percent.
4. Type a z-factor. This
is calculated
automatically if the
input has a defined
spatial reference that
includes z unit
information.

24
5. Type an output cell size.
6. Type the name of the output raster.
7. Click OK.

25
Submission Criteria
1. Tables in Section F and G of Exercise 2.
2. One line and polygon shapefiles after performing editing functions in Exercise 3.
After editing your shapefiles inside ArcMap, you are necessary to select and copy your shapefiles.
A group of 5 or 6 relevant files with the same file name (e.g. bus_stop, coast) with 5 or 6 different
extensions. Please keep save all relevant files for submission.
3. The A3 paper map in digital format saved as student ID.
In order to export your map in jpeg or pdf format, goto File � Export Map. Save your map as
either jpeg or pdf format.
4. The printed screen images for the result of section A, B and C in exercise 5.