principles of engineering system design
DESCRIPTION
Principles of Engineering System Design. Dr T Asokan [email protected]. System Modelling and Simulation. - What kind of trade-off I can have. Modelling Heuristic Modelling Mathematical Modelling Physical system modelling (Bondgraph etc.) Dimensional Analysis - PowerPoint PPT PresentationTRANSCRIPT

Principles of
Engineering System Design
Dr T Asokan

Asokan T ED 309
System Modelling and Simulation

- What kind of trade-off I can have

Asokan T ED 309
• Modelling– Heuristic Modelling– Mathematical Modelling– Physical system modelling (Bondgraph etc.)– Dimensional Analysis– Numerical modelling (Finite difference, finite
element etc.)• Simulation– Time domain analysis– Frequency domain analysis

Asokan T ED 309
Heuristic modeling
Case study:• Atlas Missile Project: Managed by US Air force and Corps of
Engineers (COE).• Install missile and supporting equipment in a vertical
underground concrete silo.• Missile to be lowered to the silo through open doors at the
ground. • One of the propellant lines (prefabricated piping sections)
could not be maneuvered into the propellant systems shaft.• Cost of redoing the section~ 300,000 dollars (for 70 sites)
Common-sense/ minimum cost physical modeling.

Asokan T ED 309
• Physical modelling provides a grasp of the problem, that cannot be achieved by any other technique.
• Crude models can be easily developed from basic materials at minimal cost.
• A good bit of caution needs to be applied to any conclusions reached.
Asokan T ED 309
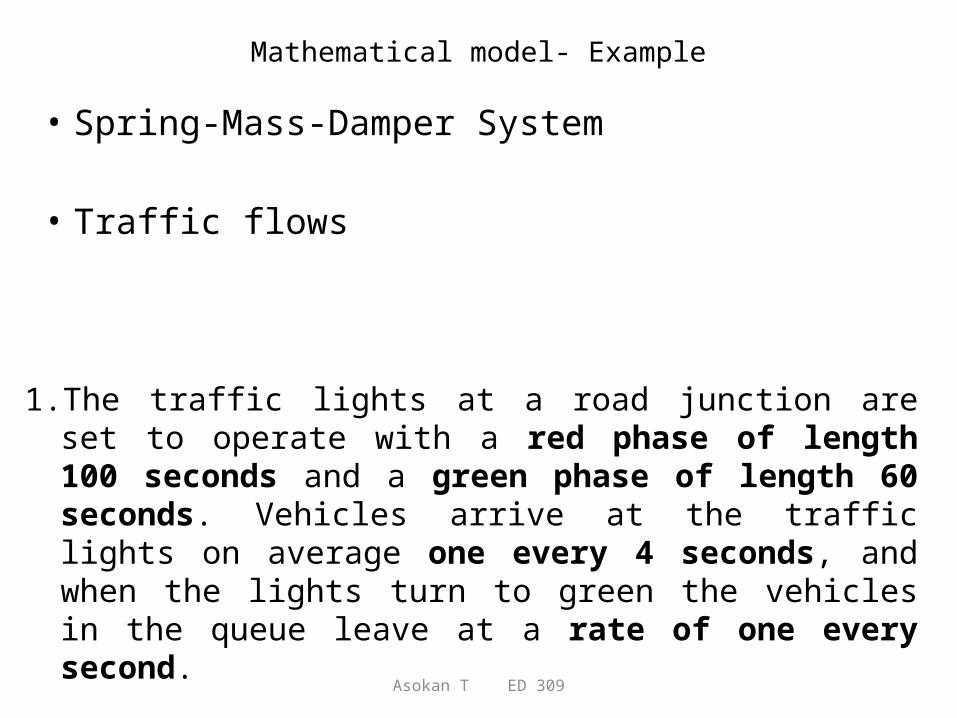
Mathematical model- Example
• Spring-Mass-Damper System
• Traffic flows
1. The traffic lights at a road junction are set to operate with a red phase of length 100 seconds and a green phase of length 60 seconds. Vehicles arrive at the traffic lights on average one every 4 seconds, and when the lights turn to green the vehicles in the queue leave at a rate of one every second.

A red and green cycle is hence of length 160 seconds during which, on average, 40 vehicles arrive. During the green phase a maximum of 60 vehicles may pass through the road junction. Hence we would expect all the vehicles arriving during one cycle to pass through the junction during that cycle.
The system may be modelled by assuming that the vehicles arrive every 4 seconds precisely i.e. at times 2, 6, 10,….., 154, 158, after the start of the red phase, and that the first vehicle in the queue leaves at the start of the green phase, the next one second later, etc.

• Average delay per vehicle: 1/40 ΣDelay(s)=1650/40=41.25 secs
= length of red phase (seconds).
= length of green phase (seconds).
a = time between arrivals of vehicles (seconds).
d = time between departure of vehicles in the queue (seconds).
vr
vrgr
Delay1
NAverage Delay per vehicle =
N = number of vehicles =a
gr vv

Asokan T ED 309
Numerical Methods
• When analytical solutions not available for the constitutive equation.
– Finite difference method– Finite element method
• FDM gives a point wise approximation to the exact solution of a Partial Differential Equation.

Asokan T ED 309
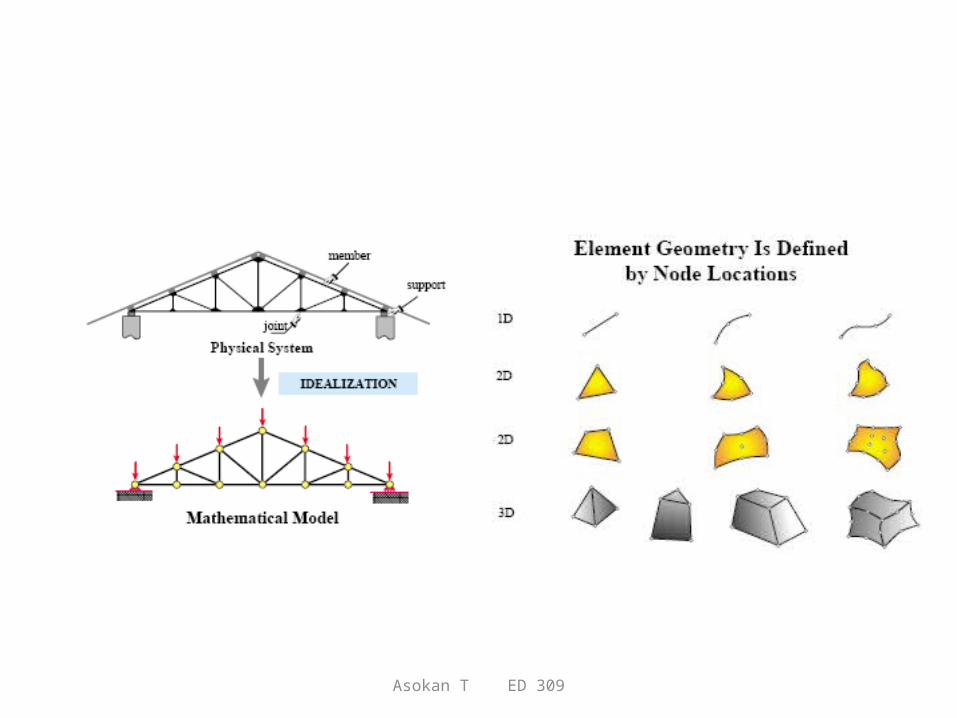
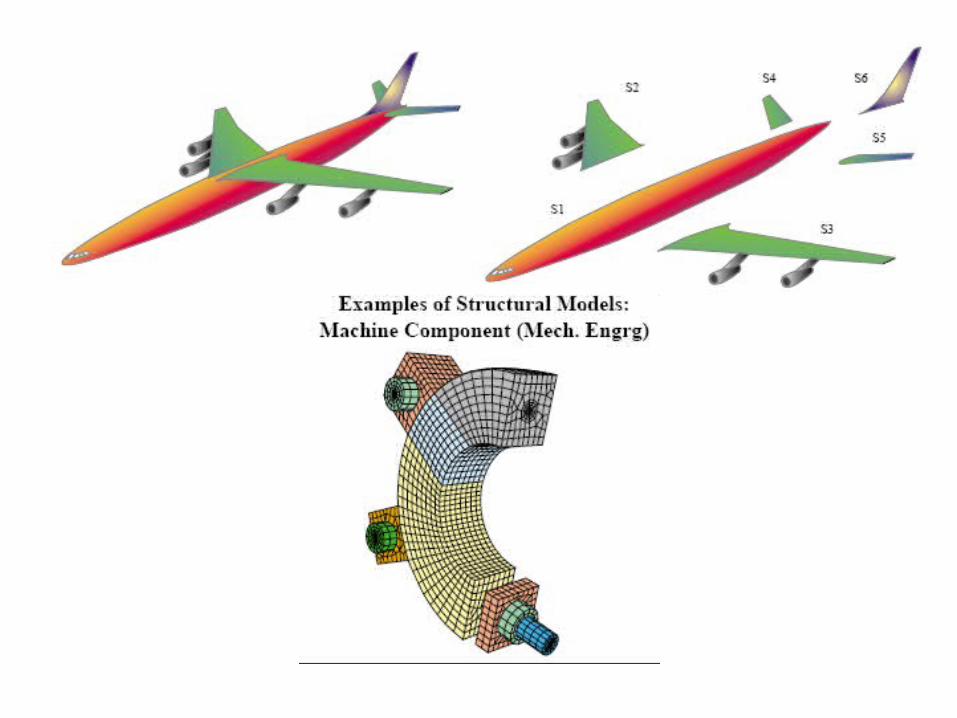
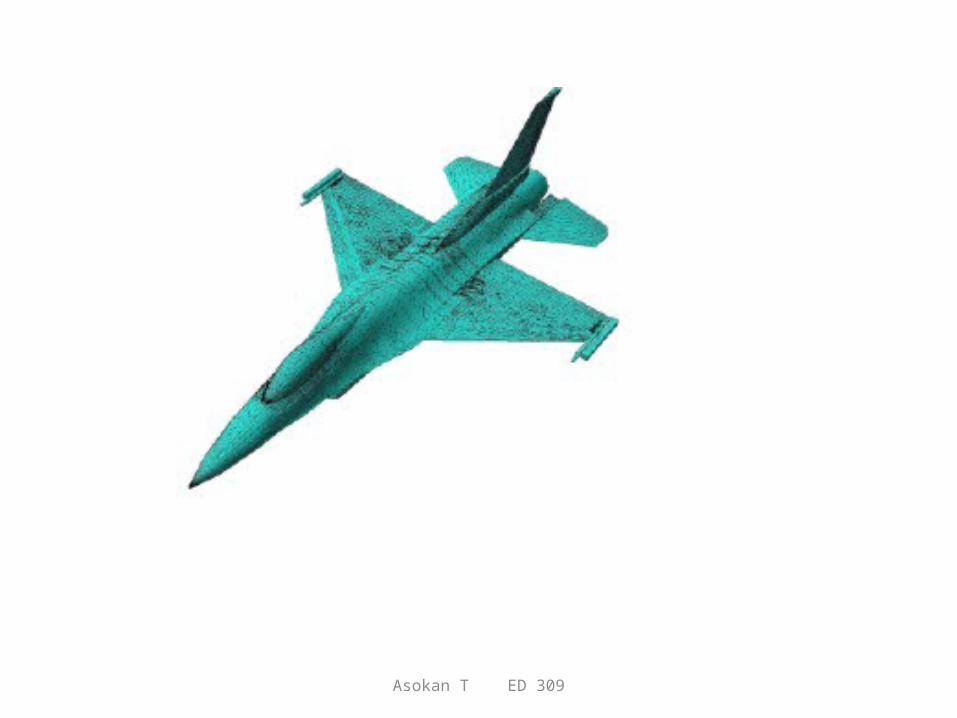
Finite Element Method
• The domain can be analytically modeled or approximated by replacing it with an assemblage of discrete elements.
Asokan T ED 309
Asokan T ED 309