principal variable annuity investment options trading – of the principal financial group®. he has...
TRANSCRIPT

PrincipalVariable AnnuityInvestment OptionsQuarter Ending September 30, 2004
W E U N D E R S T A N D W H A T Y O U ’ R E W O R K I N G F O R. ®
RF 658-13 2/11/05 4:33 PM Page 2

contentsSTABLE FUNDS
Money Market Subaccount . . . . . . . . . . . . . . . . . 1Limited Term Bond Subaccount . . . . . . . . . . . . . . 2
CONSERVATIVE FUNDS
Government Securities Subaccount . . . . . . . . . . . 3Bond Subaccount. . . . . . . . . . . . . . . . . . . . . . . . . 4
MODERATE FUNDS
Balanced Subaccount . . . . . . . . . . . . . . . . . . . . . . 5Asset Allocation Subaccount. . . . . . . . . . . . . . . . . 6Fidelity VIP Equity-Income Subaccount. . . . . . . . . 7Capital Value Subaccount. . . . . . . . . . . . . . . . . . . 8LargeCap Value Subaccount. . . . . . . . . . . . . . . . . 9LargeCap Stock Index Subaccount . . . . . . . . . . . 10Equity Income Subaccount. . . . . . . . . . . . . . . . . 11LargeCap Blend Subaccount . . . . . . . . . . . . . . . 12AIM V.I. Core Equity Subaccount . . . . . . . . . . . . 13AIM V.I. Premier Equity Subaccount . . . . . . . . . . 14American Century VP
Income and Growth Subaccount . . . . . . . . . . . 15American Century VP Value Subaccount . . . . . . 16MidCap Value Subaccount . . . . . . . . . . . . . . . . . 17
AGGRESSIVE FUNDS
Equity Growth Subaccount . . . . . . . . . . . . . . . . 18Growth Subaccount . . . . . . . . . . . . . . . . . . . . . . 19Fidelity VIP Growth Subaccount . . . . . . . . . . . . . 20AIM V.I. Growth Subaccount . . . . . . . . . . . . . . . 21American Century VP Ultra Subaccount . . . . . . . 22Fidelity VIP II Contrafund® Subaccount. . . . . . . . 23LargeCap Growth Equity Subaccount. . . . . . . . . 24MidCap Subaccount . . . . . . . . . . . . . . . . . . . . . 25MidCap Growth Subaccount . . . . . . . . . . . . . . . 26Janus Aspen MidCap Growth Subaccount . . . . . 27INVESCO VIF-Dynamics Subaccount . . . . . . . . . 28Real Estate Securities Subaccount. . . . . . . . . . . . 29SmallCap Value Subaccount . . . . . . . . . . . . . . . . 30SmallCap Subaccount . . . . . . . . . . . . . . . . . . . . 31SmallCap Growth Subaccount . . . . . . . . . . . . . . 32Dreyfus IP Founders Discovery Subaccount . . . . 33INVESCO VIF-Small Company
Growth Subaccount. . . . . . . . . . . . . . . . . . . . . 34INVESCO VIF-Health Sciences Subaccount . . . . . 35INVESCO VIF-Technology Subaccount . . . . . . . . 36
DYNAMIC FUNDS
International Subaccount . . . . . . . . . . . . . . . . . . 37International SmallCap Subaccount . . . . . . . . . . 38International Emerging Markets Subaccount . . . 39
RF 658-13 2/11/05 4:33 PM Page 3
P E R F O R M A N C E S U M M A R Y
1
Money Market SubaccountPortfolio Information as of September 30, 2004
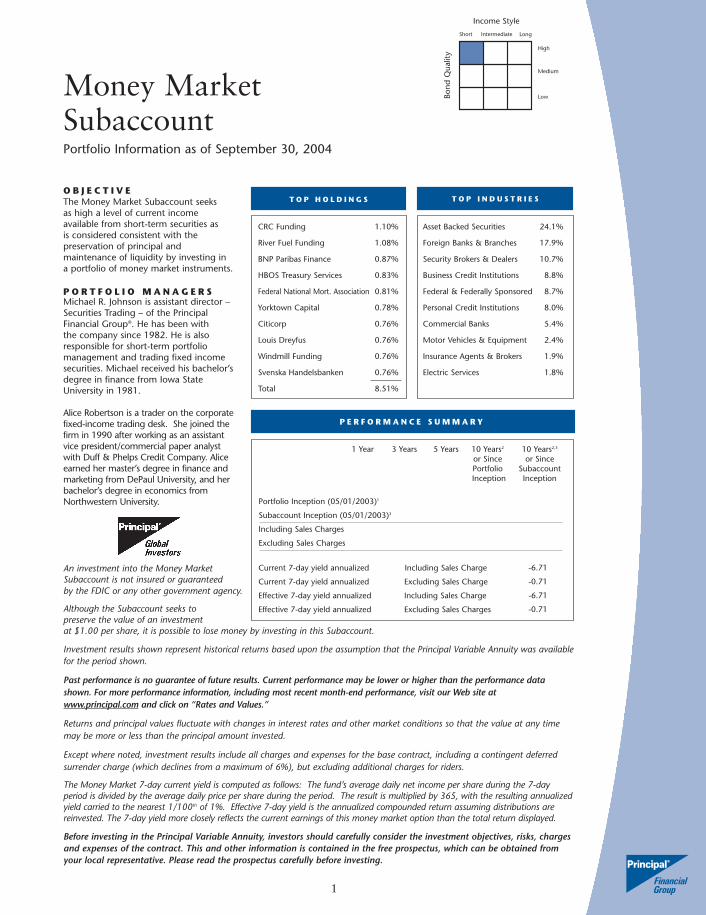
O B J E C T I V EThe Money Market Subaccount seeks as high a level of current incomeavailable from short-term securities as is considered consistent with thepreservation of principal andmaintenance of liquidity by investing in a portfolio of money market instruments.
P O R T F O L I O M A N A G E R SMichael R. Johnson is assistant director –Securities Trading – of the PrincipalFinancial Group®. He has been with the company since 1982. He is alsoresponsible for short-term portfoliomanagement and trading fixed incomesecurities. Michael received his bachelor’sdegree in finance from Iowa StateUniversity in 1981.
Alice Robertson is a trader on the corporatefixed-income trading desk. She joined thefirm in 1990 after working as an assistantvice president/commercial paper analystwith Duff & Phelps Credit Company. Aliceearned her master’s degree in finance andmarketing from DePaul University, and herbachelor’s degree in economics fromNorthwestern University.
An investment into the Money MarketSubaccount is not insured or guaranteed
High
Medium
Low
Short Intermediate Long
Income Style
Bond
Qua
lity
T O P H O L D I N G S T O P I N D U S T R I E S
-6.71
-0.71
-6.71
-0.71
Asset Backed Securities 24.1%
Foreign Banks & Branches 17.9%
Security Brokers & Dealers 10.7%
Business Credit Institutions 8.8%
Federal & Federally Sponsored 8.7%
Personal Credit Institutions 8.0%
Commercial Banks 5.4%
Motor Vehicles & Equipment 2.4%
Insurance Agents & Brokers 1.9%
Electric Services 1.8%
CRC Funding 1.10%
River Fuel Funding 1.08%
BNP Paribas Finance 0.87%
HBOS Treasury Services 0.83%
Federal National Mort. Association 0.81%
Yorktown Capital 0.78%
Citicorp 0.76%
Louis Dreyfus 0.76%
Windmill Funding 0.76%
Svenska Handelsbanken 0.76%
Total 8.51%
by the FDIC or any other government agency.
Although the Subaccount seeks to preserve the value of an investment at $1.00 per share, it is possible to lose money by investing in this Subaccount.
Investment results shown represent historical returns based upon the assumption that the Principal Variable Annuity was availablefor the period shown.
Past performance is no guarantee of future results. Current performance may be lower or higher than the performance datashown. For more performance information, including most recent month-end performance, visit our Web site atwww.principal.com and click on “Rates and Values.”
Returns and principal values fluctuate with changes in interest rates and other market conditions so that the value at any timemay be more or less than the principal amount invested.
Except where noted, investment results include all charges and expenses for the base contract, including a contingent deferredsurrender charge (which declines from a maximum of 6%), but excluding additional charges for riders.
The Money Market 7-day current yield is computed as follows: The fund’s average daily net income per share during the 7-dayperiod is divided by the average daily price per share during the period. The result is multiplied by 365, with the resulting annualizedyield carried to the nearest 1/100th of 1%. Effective 7-day yield is the annualized compounded return assuming distributions arereinvested. The 7-day yield more closely reflects the current earnings of this money market option than the total return displayed.
Before investing in the Principal Variable Annuity, investors should carefully consider the investment objectives, risks, chargesand expenses of the contract. This and other information is contained in the free prospectus, which can be obtained fromyour local representative. Please read the prospectus carefully before investing.
1 Year 3 Years 5 Years 10 Years2 10 Years2,3
or Since or Since Portfolio SubaccountInception Inception
Portfolio Inception (05/01/2003)1
Subaccount Inception (05/01/2003)3
Including Sales Charges
Excluding Sales Charges
Current 7-day yield annualized Including Sales Charge
Current 7-day yield annualized Excluding Sales Charge
Effective 7-day yield annualized Including Sales Charge
Effective 7-day yield annualized Excluding Sales Charges
RF 658-13 2/11/05 4:33 PM Page 4

2
Limited Term Bond SubaccountPortfolio Information as of September 30, 2004
O B J E C T I V EThe Limited Term Bond Subaccountseeks a high level of current incomeconsistent with a relatively high level ofprincipal stability by investing in aportfolio of securities with a dollar-weighted average maturity of five yearsor less.
P O R T F O L I O M A N A G E RMartin J. Schafer is a portfolio managerat the Principal Financial Group. Hespecializes in managing mortgage-backed securities and high-quality short,intermediate, and long durationportfolios. Marty joined The Principal® in1977. Marty holds a BBA in accountingand finance from the University of Iowa.
Investment results shown representhistorical returns based upon theassumption that the Principal VariableAnnuity was available for the periodshown.
Past performance is no guarantee offuture results. Current performance maybe lower or higher than the performancedata shown. For more performanceinformation, including most recentmonth-end performance, visit our Website at www.principal.com and click on“Rates and Values.”
T O P H O L D I N G S T O P I N D U S T R I E S
P E R F O R M A N C E S U M M A R Y
Federal & Federally Sponsored 35.2%
Asset Backed Securities 18.1%
Commercial Banks 5.6%
Collateralized Mortgage 4.7%
Personal Credit Institutions 3.8%
Mortgage Pass Thru Securities 2.7%
Telephone Communication 2.6%
Electric Services 2.4%
Security Brokers & Dealers 2.3%
General Government 2.1%
Federal National Mort. Association 5.92%
Federal Home Loan Mortgage 4.60%
Federal Home Loan Mortgage 3.94%
Federal National Mort. Association 3.82%
Federal Home Loan Bank 2.92%
Federal Home Loan Bank System 2.91%
Federal Farm Credit Bank 1.92%
Federal Home Loan Bank 1.65%
Bank One Issuance Trust 1.37%
Ford Credit Auto Owner Trust 1.31%
Total 30.36%
1 Year 3 Years 5 Years 10 Years2 10 Years2,3
or Since or Since Portfolio SubaccountInception Inception
Portfolio Inception (05/01/2003)1
Subaccount Inception (05/01/2003)3
Including Sales Charges
Excluding Sales Charges
-6.04 — — -4.22 -4.22
-0.04 — — 0.05 0.05
High
Medium
Low
Short Intermediate Long
Income Style
Bond
Qua
lity
Returns and principal values fluctuate with changes in interest rates and other market conditions so that the value at any timemay be more or less than the principal amount invested.
Except where noted, investment results include all charges and expenses for the base contract, including a contingent deferredsurrender charge (which declines from a maximum of 6%), but excluding additional charges for riders.
Before investing in the Principal Variable Annuity, investors should carefully consider the investment objectives, risks, chargesand expenses of the contract. This and other information is contained in the free prospectus, which can be obtained fromyour local representative. Please read the prospectus carefully before investing.
RF 658-13 2/11/05 4:33 PM Page 5

3
Government Securities SubaccountPortfolio Information as of September 30, 2004
O B J E C T I V EThe Government Securities Subaccountseeks a high level of current income,liquidity, and safety of principal.
P O R T F O L I O M A N A G E R SMark Karstrom is responsible for MBSportfolio management for core andgovernment fixed-income products,including mutual funds, separateaccounts and pension plans. He joinedThe Principal in 2001. Mark received abachelor’s degree in economics from theUniversity of Denver. He is a member ofthe Association for InvestmentManagement and Research (AIMR).
Martin J. Schafer is a portfolio manager at the Principal Financial Group. Hespecializes in managing mortgage-backed securities and high-quality short,intermediate, and long durationportfolios. Marty joined The Principal in1977. Marty holds a BBA in accountingand finance from the University of Iowa.
While underlying securities of thisinvestment option may be guaranteed bythe U.S. Government as to timely paymentof principal and interest, this investmentoption is not guaranteed.
T O P H O L D I N G S T O P I N D U S T R I E S
P E R F O R M A N C E S U M M A R Y
Federal & Federally Sponsored 84.7%
Investment Offices 7.5%
Mortgage Bankers & Brokers 4.0%
Electric Services 1.8%
Collateralized Mortgage 1.2%
Business Credit Institutions 0.8%
4.10% FNMA 5.79%
5.00% FHLMC 4.40%
5.50% FNMA 4.15%
6.00% FNMA 3.12%
Federal Home Loan Mortgage 2.97%
5.50% GNMA I 2.93%
5.00% FHLMC 2.70%
5.00% FHLMC 2.68%
4.00% FNMA 2.63%
5.00% FHLMC 2.12%
Total 33.49%
1 Year 3 Years 5 Years 10 Years2 10 Years2,3
or Since or Since Portfolio SubaccountInception Inception
Portfolio Inception (04/09/1987)1
Subaccount Inception (04/09/1987)3
Including Sales Charges
Excluding Sales Charges
-4.32 1.43 4.55 6.29 6.29
1.68 3.02 5.05 6.29 6.29
High
Medium
Low
Short Intermediate Long
Income Style
Bond
Qua
lity
Investment results shown represent historical returns based upon the assumption that the Principal Variable Annuity was availablefor the period shown.
Past performance is no guarantee of future results. Current performance may be lower or higher than the performance datashown. For more performance information, including most recent month-end performance, visit our Web site atwww.principal.com and click on “Rates and Values.”
Returns and principal values fluctuate with changes in interest rates and other market conditions so that the value at any timemay be more or less than the principal amount invested.
Except where noted, investment results include all charges and expenses for the base contract, including a contingent deferredsurrender charge (which declines from a maximum of 6%), but excluding additional charges for riders.
Before investing in the Principal Variable Annuity, investors should carefully consider the investment objectives, risks, chargesand expenses of the contract. This and other information is contained in the free prospectus, which can be obtained fromyour local representative. Please read the prospectus carefully before investing.
RF 658-13 2/11/05 4:33 PM Page 6

4
Bond SubaccountPortfolio Information as of September 30, 2004
O B J E C T I V EThe Bond Subaccount seeks to provide ashigh a level of income as is consistentwith preservation of capital and prudentinvestment risk.
P O R T F O L I O M A N A G E R SWilliam Armstrong is responsible for U.S.corporate and global credit portfolios at the Principal Financial Group. Heearned an MBA from the University ofIowa and a BA from Kearney StateCollege. Bill is a member of the IowaSociety of Financial Analysts and theAssociation for Investment Managementand Research (AIMR).
Timothy Warrick, CFA, is a portfoliomanager at the Principal Financial Groupwith responsibility for multiple asset class portfolios. Tim originally joined The Principal in 1990. In 1996, he joinedReliaStar Investment Research, Inc. andwas responsible for multiple asset classes,including corporate bonds and leveragedbank loans. Tim rejoined the PrincipalFinancial Group in 1998 as a portfoliomanager. He received an MBA in financefrom Drake University and a bachelor’sdegree in accounting and economicsfrom Simpson College. Tim is a memberof the Association for InvestmentManagement and Research (AIMR).
T O P H O L D I N G S T O P I N D U S T R I E S
P E R F O R M A N C E S U M M A R Y
Household Finance 4.85%
SBC Communications 2.47%
5.50% FNMA 2.25%
5.50% FNMA 1.87%
5.50% FHLMC 1.81%
U.S. Treasury Inflation-IndexedObligations 1.79%
5.00% FHLMC 1.77%
5.50% FNMA 1.70%
4.50% FNMA 1.69%
6.50% GNMA I 1.43%
Total 21.63%
Federal & Federally Sponsored 43.5%
Personal Credit Institutions 6.6%
Investment Offices 4.4%
Telephone Communication 3.7%
Asset Backed Securities 3.5%
Electric Services 3.0%
Commercial Banks 2.9%
Collateralized Mortgage 2.8%
Miscellaneous Chemical Products 2.7%
Security Brokers & Dealers 1.8%
1 Year 3 Years 5 Years 10 Years2 10 Years2,3
or Since or Since Portfolio SubaccountInception Inception
Portfolio Inception (12/18/1987)1
Subaccount Inception (12/18/1987)3
Including Sales Charges
Excluding Sales Charges
-3.07 2.71 4.77 6.65 6.65
2.93 4.26 5.26 6.65 6.65
High
Medium
Low
Short Intermediate Long
Income Style
Bond
Qua
lity
Investment results shown represent historical returns based upon the assumption that the Principal Variable Annuity was availablefor the period shown.
Past performance is no guarantee of future results. Current performance may be lower or higher than the performance datashown. For more performance information, including most recent month-end performance, visit our Web site atwww.principal.com and click on “Rates and Values.”
Returns and principal values fluctuate with changes in interest rates and other market conditions so that the value at any timemay be more or less than the principal amount invested.
Except where noted, investment results include all charges and expenses for the base contract, including a contingent deferredsurrender charge (which declines from a maximum of 6%), but excluding additional charges for riders.
Before investing in the Principal Variable Annuity, investors should carefully consider the investment objectives, risks, chargesand expenses of the contract. This and other information is contained in the free prospectus, which can be obtained fromyour local representative. Please read the prospectus carefully before investing.
RF 658-13 2/11/05 4:33 PM Page 7
Balanced SubaccountPortfolio Information as of September 30, 2004
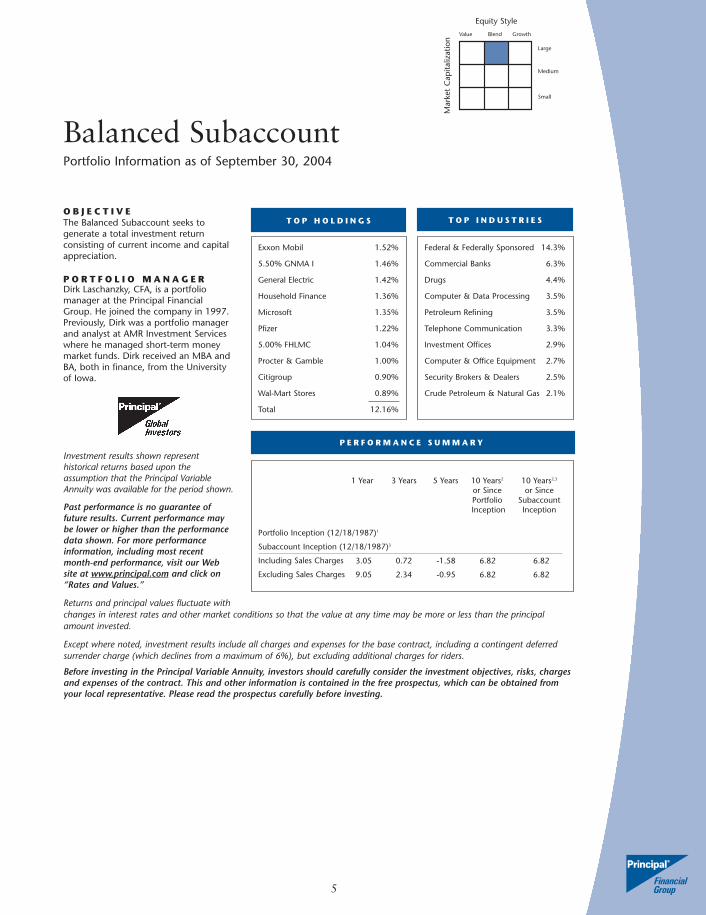
O B J E C T I V EThe Balanced Subaccount seeks togenerate a total investment returnconsisting of current income and capitalappreciation.
P O R T F O L I O M A N A G E RDirk Laschanzky, CFA, is a portfoliomanager at the Principal Financial Group. He joined the company in 1997.Previously, Dirk was a portfolio managerand analyst at AMR Investment Serviceswhere he managed short-term moneymarket funds. Dirk received an MBA andBA, both in finance, from the Universityof Iowa.
Investment results shown representhistorical returns based upon theassumption that the Principal VariableAnnuity was available for the period shown.
Past performance is no guarantee offuture results. Current performance maybe lower or higher than the performancedata shown. For more performanceinformation, including most recentmonth-end performance, visit our Website at www.principal.com and click on“Rates and Values.”
Returns and principal values fluctuate with
T O P H O L D I N G S T O P I N D U S T R I E S
P E R F O R M A N C E S U M M A R Y
Federal & Federally Sponsored 14.3%
Commercial Banks 6.3%
Drugs 4.4%
Computer & Data Processing 3.5%
Petroleum Refining 3.5%
Telephone Communication 3.3%
Investment Offices 2.9%
Computer & Office Equipment 2.7%
Security Brokers & Dealers 2.5%
Crude Petroleum & Natural Gas 2.1%
Exxon Mobil 1.52%
5.50% GNMA I 1.46%
General Electric 1.42%
Household Finance 1.36%
Microsoft 1.35%
Pfizer 1.22%
5.00% FHLMC 1.04%
Procter & Gamble 1.00%
Citigroup 0.90%
Wal-Mart Stores 0.89%
Total 12.16%
5
1 Year 3 Years 5 Years 10 Years2 10 Years2,3
or Since or Since Portfolio SubaccountInception Inception
Portfolio Inception (12/18/1987)1
Subaccount Inception (12/18/1987)3
Including Sales Charges
Excluding Sales Charges
3.05 0.72 -1.58 6.82 6.82
9.05 2.34 -0.95 6.82 6.82
Mar
ket
Cap
italiz
atio
n
Large
Medium
Small
Value Blend Growth
Equity Style
changes in interest rates and other market conditions so that the value at any time may be more or less than the principalamount invested.
Except where noted, investment results include all charges and expenses for the base contract, including a contingent deferredsurrender charge (which declines from a maximum of 6%), but excluding additional charges for riders.
Before investing in the Principal Variable Annuity, investors should carefully consider the investment objectives, risks, chargesand expenses of the contract. This and other information is contained in the free prospectus, which can be obtained fromyour local representative. Please read the prospectus carefully before investing.
RF 658-13 2/11/05 4:33 PM Page 8
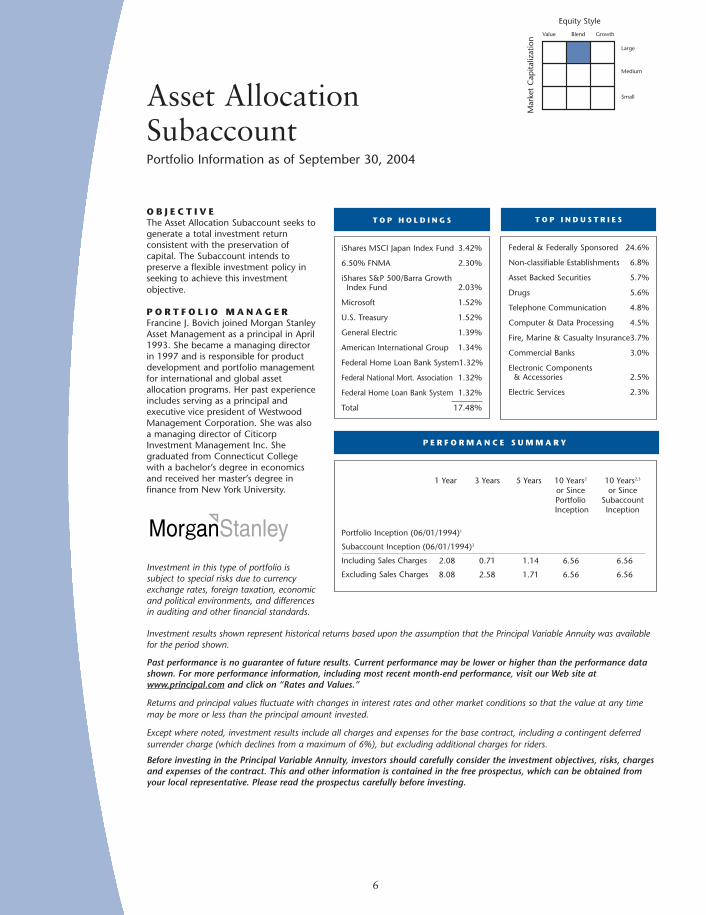
O B J E C T I V EThe Asset Allocation Subaccount seeks togenerate a total investment returnconsistent with the preservation ofcapital. The Subaccount intends topreserve a flexible investment policy inseeking to achieve this investmentobjective.
P O R T F O L I O M A N A G E RFrancine J. Bovich joined Morgan StanleyAsset Management as a principal in April1993. She became a managing directorin 1997 and is responsible for productdevelopment and portfolio managementfor international and global assetallocation programs. Her past experienceincludes serving as a principal andexecutive vice president of WestwoodManagement Corporation. She was alsoa managing director of CiticorpInvestment Management Inc. Shegraduated from Connecticut Collegewith a bachelor’s degree in economicsand received her master’s degree infinance from New York University.
Investment in this type of portfolio issubject to special risks due to currencyexchange rates, foreign taxation, economicand political environments, and differencesin auditing and other financial standards.
6
Asset AllocationSubaccountPortfolio Information as of September 30, 2004
T O P H O L D I N G S T O P I N D U S T R I E S
P E R F O R M A N C E S U M M A R Y
1 Year 3 Years 5 Years 10 Years2 10 Years2,3
or Since or Since Portfolio SubaccountInception Inception
Portfolio Inception (06/01/1994)1
Subaccount Inception (06/01/1994)3
Including Sales Charges
Excluding Sales Charges
2.08 0.71 1.14 6.56 6.56
8.08 2.58 1.71 6.56 6.56
Federal & Federally Sponsored 24.6%
Non-classifiable Establishments 6.8%
Asset Backed Securities 5.7%
Drugs 5.6%
Telephone Communication 4.8%
Computer & Data Processing 4.5%
Fire, Marine & Casualty Insurance3.7%
Commercial Banks 3.0%
Electronic Components & Accessories 2.5%
Electric Services 2.3%
iShares MSCI Japan Index Fund 3.42%
6.50% FNMA 2.30%
iShares S&P 500/Barra Growth Index Fund 2.03%
Microsoft 1.52%
U.S. Treasury 1.52%
General Electric 1.39%
American International Group 1.34%
Federal Home Loan Bank System1.32%
Federal National Mort. Association 1.32%
Federal Home Loan Bank System 1.32%
Total 17.48%
Mar
ket
Cap
italiz
atio
n
Large
Medium
Small
Value Blend Growth
Equity Style
Investment results shown represent historical returns based upon the assumption that the Principal Variable Annuity was availablefor the period shown.
Past performance is no guarantee of future results. Current performance may be lower or higher than the performance datashown. For more performance information, including most recent month-end performance, visit our Web site atwww.principal.com and click on “Rates and Values.”
Returns and principal values fluctuate with changes in interest rates and other market conditions so that the value at any timemay be more or less than the principal amount invested.
Except where noted, investment results include all charges and expenses for the base contract, including a contingent deferredsurrender charge (which declines from a maximum of 6%), but excluding additional charges for riders.
Before investing in the Principal Variable Annuity, investors should carefully consider the investment objectives, risks, chargesand expenses of the contract. This and other information is contained in the free prospectus, which can be obtained fromyour local representative. Please read the prospectus carefully before investing.
RF 658-13 2/11/05 4:34 PM Page 9

O B J E C T I V EThe Fidelity VIP Equity-IncomeSubaccount seeks reasonable income byinvesting primarily in income-producingequity securities. In choosing thesesecurities, it considers the potential for capitalappreciation. The Subaccount has asecondary goal to achieve a yield thatexceeds the composite yield on the securitiescomprising the S&P 500 Index®.
P O R T F O L I O M A N A G E RStephen R. Petersen is a vice presidentand portfolio manager for FidelityInvestments, the nation’s largest mutualfund company and a leading provider offinancial services. He manages FidelityPuritan Fund, Fidelity Equity-IncomeFund, and Fidelity Variable InsuranceProducts (VIP) Fund: Equity-IncomePortfolio. Mr. Petersen is also a seniorvice president for Fidelity ManagementTrust Company (FMTC) — the unit ofFidelity that serves institutionalinvestment businesses worldwide bymanaging assets for corporate and publicemployee retirement funds,endowments, foundations, and othermajor institutions.
Mr. Petersen joined Fidelity in 1980 as aresearch analyst covering the airline andinsurance industries. In 1981, he beganmanaging earnings growth portfolios forFMTC, including: Fidelity Large CapValue Discipline, Fidelity Income-Managed Equity Discipline, FidelityBalanced Discipline and FidelityConvertible Discipline portfolios. From1996 to 1997, Mr. Petersen managedFidelity Balanced Fund. Mr. Petersen was named manager of Fidelity Equity-Income Fund in 1993 and VIP: EquityIncome Portfolio in 1997. In February2000, he was named portfolio managerof Fidelity Puritan Fund.
Investment results shown representhistorical returns based upon theassumption that the Principal VariableAnnuity was available for the period shown.
T O P H O L D I N G S T O P I N D U S T R I E S
P E R F O R M A N C E S U M M A R Y
7
Fidelity VIP Equity-Income Subaccount6
Portfolio Information as of September 30, 2004
Past performance is no guarantee of future results. Current performance maybe lower or higher than the performance data shown. For more performanceinformation, including most recent month-end performance, visit our Web siteat www.principal.com and click on “Rates and Values.”
Returns and principal values fluctuate with changes in interest rates and othermarket conditions so that the value at any time may be more or less than theprincipal amount invested.
Except where noted, investment results include all charges and expenses for thebase contract, including a contingent deferred surrender charge (which declinesfrom a maximum of 6%), but excluding additional charges for riders.
Before investing in the Principal Variable Annuity, investors should carefullyconsider the investment objectives, risks, charges and expenses of the contract.This and other information is contained in the free prospectus, which can beobtained from your local representative. Please read the prospectus carefullybefore investing.
1 Year 3 Years 5 Years 10 Years2 10 Years2,3
or Since or Since Portfolio SubaccountInception Inception
Portfolio Inception (11/03/1986)1
Subaccount Inception (05/20/2002)3
Including Sales Charges
Excluding Sales Charges
9.04 — — — -0.18
15.04 5.11 1.85 9.12 1.91
Mar
ket
Cap
italiz
atio
n
Large
Medium
Small
Value Blend Growth
Equity Style
Financials
Industrials
Energy
Consumer Discretionary
Health Care
Materials
Information Technology
Consumer Staples
Telecommunication Services
Utilities
Exxon Mobil Corp.
Bank of America Corp.
JP Morgan Chase & Co.
Citigroup Inc.
Amer Intl Group Inc.
Total SA
SBC Communications Inc.
Fannie Mae
Verizon Communications Inc.
Bellsouth Corp.
Total 23.20%
RF 658-13 2/11/05 4:34 PM Page 10

8
Capital Value SubaccountPortfolio Information as of September 30, 2004
O B J E C T I V EThe Capital Value Subaccount’s primaryobjective is long-term capitalappreciation; the secondary objective isgrowth of investment income.
P O R T F O L I O M A N A G E RJohn Philblad, CFA, is director ofquantitative portfolio management forthe Principal Financial Group. He alsoserves as lead manager for the firm’slarge capitalization value equityportfolios. Previously, he was a partnerand co-founder of GlobeFlex Capitalwhere he was responsible for helpingdevelop and implement the investmentprocess for both domestic andinternational products. Prior to that,John was at Nicholas Applegate, wherehe developed one of the first globalsystematic investment processes. He wasalso director of research at Boatmen’sTrust Company, Kansas City, Mo. Johnreceived a BA from Westminster College.
Investment results shown representhistorical returns based upon theassumption that the Principal VariableAnnuity was available for the period shown.
Past performance is no guarantee of
T O P H O L D I N G S T O P I N D U S T R I E S
P E R F O R M A N C E S U M M A R Y
Exxon Mobil 4.58%
General Electric 3.50%
Citigroup 2.90%
JP Morgan Chase 2.38%
Bank of America 2.25%
ChevronTexaco 2.22%
Verizon Communications 1.96%
SBC Communications 1.65%
ConocoPhillips 1.51%
Time Warner 1.37%
Total 24.32%
Commercial Banks 16.4%
Petroleum Refining 9.3%
Telephone Communication 5.0%
Crude Petroleum & Natural Gas 4.5%
Security Brokers & Dealers 4.4%
Household Appliances 3.5%
Gas Production & Distribution 3.1%
Savings Institutions 2.9%
Electric Services 2.9%
Aircraft & Parts 2.9%
1 Year 3 Years 5 Years 10 Years2 10 Years2,3
or Since or Since Portfolio SubaccountInception Inception
Portfolio Inception (05/13/1970)1
Subaccount Inception (05/13/1970)3
Including Sales Charges
Excluding Sales Charges
7.53 3.13 -0.79 10.27 10.27
13.53 4.67 -0.18 10.27 10.27
Mar
ket
Cap
italiz
atio
n
Large
Medium
Small
Value Blend Growth
Equity Style
future results. Current performance may be lower or higher than the performance data shown. For more performanceinformation, including most recent month-end performance, visit our Web site at www.principal.com and click on “Rates and Values.”
Returns and principal values fluctuate with changes in interest rates and other market conditions so that the value at any timemay be more or less than the principal amount invested.
Except where noted, investment results include all charges and expenses for the base contract, including a contingent deferredsurrender charge (which declines from a maximum of 6%), but excluding additional charges for riders.
Before investing in the Principal Variable Annuity, investors should carefully consider the investment objectives, risks, chargesand expenses of the contract. This and other information is contained in the free prospectus, which can be obtained fromyour local representative. Please read the prospectus carefully before investing.
RF 658-13 2/11/05 4:34 PM Page 11
9
LargeCap Value SubaccountPortfolio Information as of September 30, 2004
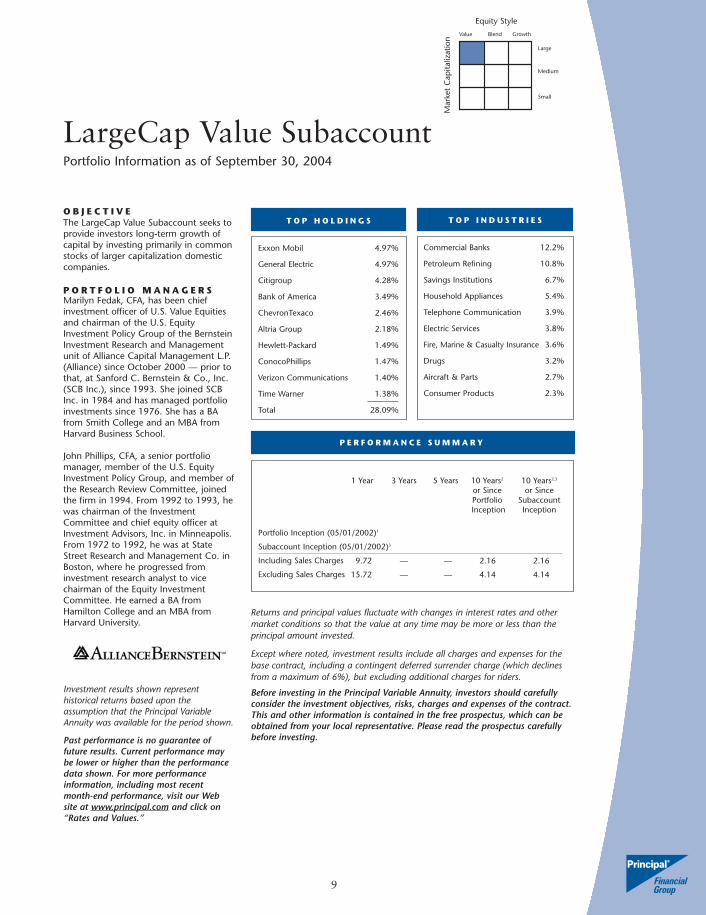
O B J E C T I V EThe LargeCap Value Subaccount seeks toprovide investors long-term growth ofcapital by investing primarily in commonstocks of larger capitalization domesticcompanies.
P O R T F O L I O M A N A G E R SMarilyn Fedak, CFA, has been chiefinvestment officer of U.S. Value Equitiesand chairman of the U.S. EquityInvestment Policy Group of the BernsteinInvestment Research and Managementunit of Alliance Capital Management L.P.(Alliance) since October 2000 — prior tothat, at Sanford C. Bernstein & Co., Inc.(SCB Inc.), since 1993. She joined SCBInc. in 1984 and has managed portfolioinvestments since 1976. She has a BAfrom Smith College and an MBA fromHarvard Business School.
John Phillips, CFA, a senior portfoliomanager, member of the U.S. EquityInvestment Policy Group, and member ofthe Research Review Committee, joinedthe firm in 1994. From 1992 to 1993, hewas chairman of the InvestmentCommittee and chief equity officer atInvestment Advisors, Inc. in Minneapolis.From 1972 to 1992, he was at StateStreet Research and Management Co. inBoston, where he progressed frominvestment research analyst to vicechairman of the Equity InvestmentCommittee. He earned a BA fromHamilton College and an MBA fromHarvard University.
Investment results shown representhistorical returns based upon theassumption that the Principal VariableAnnuity was available for the period shown.
Past performance is no guarantee offuture results. Current performance maybe lower or higher than the performancedata shown. For more performanceinformation, including most recentmonth-end performance, visit our Website at www.principal.com and click on“Rates and Values.”
T O P H O L D I N G S T O P I N D U S T R I E S
P E R F O R M A N C E S U M M A R Y
Exxon Mobil 4.97%
General Electric 4.97%
Citigroup 4.28%
Bank of America 3.49%
ChevronTexaco 2.46%
Altria Group 2.18%
Hewlett-Packard 1.49%
ConocoPhillips 1.47%
Verizon Communications 1.40%
Time Warner 1.38%
Total 28.09%
Commercial Banks 12.2%
Petroleum Refining 10.8%
Savings Institutions 6.7%
Household Appliances 5.4%
Telephone Communication 3.9%
Electric Services 3.8%
Fire, Marine & Casualty Insurance 3.6%
Drugs 3.2%
Aircraft & Parts 2.7%
Consumer Products 2.3%
1 Year 3 Years 5 Years 10 Years2 10 Years2,3
or Since or Since Portfolio SubaccountInception Inception
Portfolio Inception (05/01/2002)1
Subaccount Inception (05/01/2002)3
Including Sales Charges
Excluding Sales Charges
9.72 — — 2.16 2.16
15.72 — — 4.14 4.14
Mar
ket
Cap
italiz
atio
n
Large
Medium
Small
Value Blend Growth
Equity Style
Returns and principal values fluctuate with changes in interest rates and othermarket conditions so that the value at any time may be more or less than theprincipal amount invested.
Except where noted, investment results include all charges and expenses for thebase contract, including a contingent deferred surrender charge (which declinesfrom a maximum of 6%), but excluding additional charges for riders.
Before investing in the Principal Variable Annuity, investors should carefullyconsider the investment objectives, risks, charges and expenses of the contract.This and other information is contained in the free prospectus, which can beobtained from your local representative. Please read the prospectus carefullybefore investing.
RF 658-13 2/11/05 4:34 PM Page 12

10
LargeCap Stock Index SubaccountPortfolio Information as of September 30, 2004
O B J E C T I V EThe LargeCap stock Index Subaccountseeks to achieve long-term growth ofcapital.
P O R T F O L I O M A N A G E RDirk Laschanzky, CFA, is responsible for asset allocation and provides adviceto clients concerning their portfoliosacross all asset classes. Prior to joiningThe Principal in 1997, he was a portfoliomanager and analyst for over seven yearsat AMR Investment Services where hemanaged short-term money marketfunds and was responsible for AmericanAirlines’ pension plan investmentmanagement. He also served as afinancial analyst for American Airlines. He received an MBA and BA, both infinance, from the University of Iowa. Hehas earned the right to use the CharteredFinancial Analyst designation.
The LargeCap Stock Index Subaccountgenerally invests at least 80 percent of itsassets in common stocks of companies thatcompose the S&P 500 Index in an attemptto mirror the investment performance ofthe index over a long term. It is unlikely aperfect correlation will be achieved.
S&P 500® is a trademark of The McGraw-
T O P H O L D I N G S
General Electric 3.34%
Exxon Mobil 2.96%
Microsoft 2.83%
Pfizer 2.18%
Citigroup 2.15%
Wal-Mart Stores 2.12%
Household Finance 1.80%
American International Group 1.67%
Bank of America 1.66%
Johnson & Johnson 1.57%
Total 22.28%
T O P I N D U S T R I E S
P E R F O R M A N C E S U M M A R Y
Drugs 8.3%
Commercial Banks 7.9%
Computer & Data Processing 5.7%
Computer & Office Equipment 5.4%
Petroleum Refining 5.0%
Household Appliances 3.3%
Telephone Communication 3.3%
Fire, Marine & Casualty Insurance 3.0%
Department Stores 3.0%
Personal Credit Institutions 2.7%
1 Year 3 Years 5 Years 10 Years2 10 Years2,3
or Since or Since Portfolio SubaccountInception Inception
Portfolio Inception (05/03/1999)1
Subaccount Inception (05/03/1999)3
Including Sales Charges
Excluding Sales Charges
5.86 0.68 -3.72 -4.27 -4.274
11.86 2.29 -3.03 -3.83 -3.83
Mar
ket
Cap
italiz
atio
n
Large
Medium
Small
Value Blend Growth
Equity Style
Hill Companies, Inc. and has been licensed for use by Principal Life Insurance Company and Principal Management Corporation.The product is not sponsored, endorsed, sold or promoted by Standard & Poor’s and Standard & Poor’s makes no representationregarding the advisability of investing in the product.
Investment results shown represent historical returns based upon the assumption that the Principal Variable Annuity was availablefor the period shown.
Past performance is no guarantee of future results. Current performance may be lower or higher than the performance datashown. For more performance information, including most recent month-end performance, visit our Web site atwww.principal.com and click on “Rates and Values.”
Returns and principal values fluctuate with changes in interest rates and other market conditions so that the value at any timemay be more or less than the principal amount invested.
Except where noted, investment results include all charges and expenses for the base contract, including a contingent deferredsurrender charge (which declines from a maximum of 6%), but excluding additional charges for riders.
Before investing in the Principal Variable Annuity, investors should carefully consider the investment objectives, risks, chargesand expenses of the contract. This and other information is contained in the free prospectus, which can be obtained fromyour local representative. Please read the prospectus carefully before investing.
RF 658-13 2/11/05 4:34 PM Page 13
11
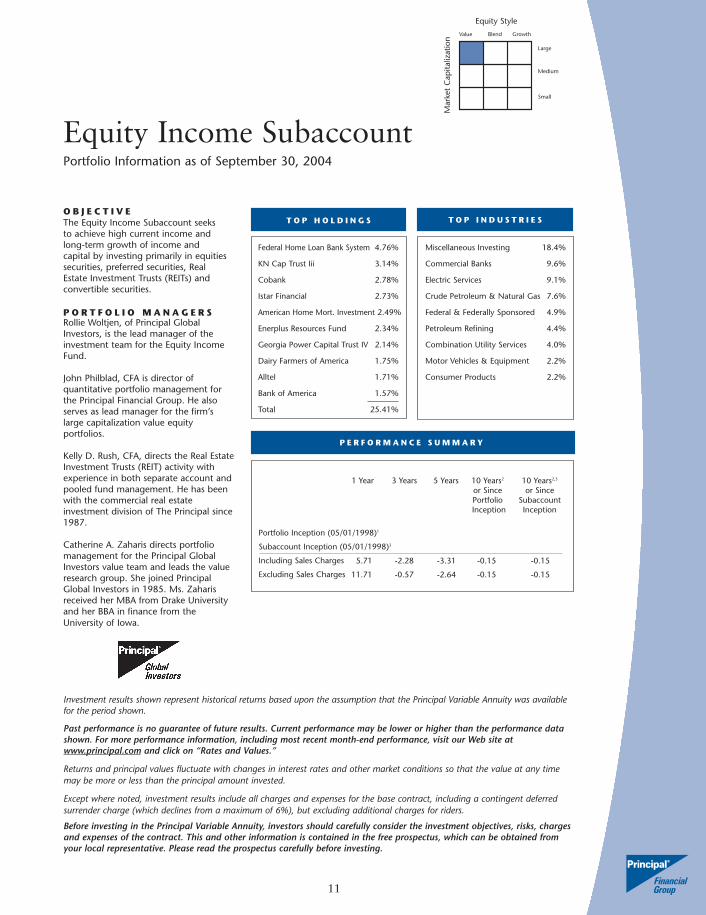
Equity Income SubaccountPortfolio Information as of September 30, 2004
O B J E C T I V EThe Equity Income Subaccount seeks to achieve high current income andlong-term growth of income and capital by investing primarily in equitiessecurities, preferred securities, Real Estate Investment Trusts (REITs) andconvertible securities.
P O R T F O L I O M A N A G E R SRollie Woltjen, of Principal GlobalInvestors, is the lead manager of theinvestment team for the Equity IncomeFund.
John Philblad, CFA is director ofquantitative portfolio management forthe Principal Financial Group. He alsoserves as lead manager for the firm’slarge capitalization value equityportfolios.
Kelly D. Rush, CFA, directs the Real EstateInvestment Trusts (REIT) activity withexperience in both separate account andpooled fund management. He has beenwith the commercial real estateinvestment division of The Principal since1987.
Catherine A. Zaharis directs portfoliomanagement for the Principal GlobalInvestors value team and leads the valueresearch group. She joined PrincipalGlobal Investors in 1985. Ms. Zaharisreceived her MBA from Drake Universityand her BBA in finance from theUniversity of Iowa.
T O P H O L D I N G S T O P I N D U S T R I E S
P E R F O R M A N C E S U M M A R Y
Federal Home Loan Bank System 4.76%
KN Cap Trust Iii 3.14%
Cobank 2.78%
Istar Financial 2.73%
American Home Mort. Investment 2.49%
Enerplus Resources Fund 2.34%
Georgia Power Capital Trust IV 2.14%
Dairy Farmers of America 1.75%
Alltel 1.71%
Bank of America 1.57%
Total 25.41%
Miscellaneous Investing 18.4%
Commercial Banks 9.6%
Electric Services 9.1%
Crude Petroleum & Natural Gas 7.6%
Federal & Federally Sponsored 4.9%
Petroleum Refining 4.4%
Combination Utility Services 4.0%
Motor Vehicles & Equipment 2.2%
Consumer Products 2.2%
1 Year 3 Years 5 Years 10 Years2 10 Years2,3
or Since or Since Portfolio SubaccountInception Inception
Portfolio Inception (05/01/1998)1
Subaccount Inception (05/01/1998)3
Including Sales Charges
Excluding Sales Charges
5.71 -2.28 -3.31 -0.15 -0.15
11.71 -0.57 -2.64 -0.15 -0.15
Mar
ket
Cap
italiz
atio
n
Large
Medium
Small
Value Blend Growth
Equity Style
Investment results shown represent historical returns based upon the assumption that the Principal Variable Annuity was availablefor the period shown.
Past performance is no guarantee of future results. Current performance may be lower or higher than the performance datashown. For more performance information, including most recent month-end performance, visit our Web site atwww.principal.com and click on “Rates and Values.”
Returns and principal values fluctuate with changes in interest rates and other market conditions so that the value at any timemay be more or less than the principal amount invested.
Except where noted, investment results include all charges and expenses for the base contract, including a contingent deferredsurrender charge (which declines from a maximum of 6%), but excluding additional charges for riders.
Before investing in the Principal Variable Annuity, investors should carefully consider the investment objectives, risks, chargesand expenses of the contract. This and other information is contained in the free prospectus, which can be obtained fromyour local representative. Please read the prospectus carefully before investing.
RF 658-13 2/11/05 4:34 PM Page 14

12
LargeCap Blend SubaccountPortfolio Information as of September 30, 2004
O B J E C T I V EThe LargeCap Blend Subaccount seeks long-term growth of capital byinvesting primarily in equity securities of companies that offer above averagegrowth potential or companies whosestock is undervalued.
P O R T F O L I O M A N A G E RWilliam J. Stromberg, CFA, is a vicepresident of T. Rowe Price Group, Inc.,and T. Rowe Price Associates, Inc.,Director of Global Equity Research, and a member of the Equity SteeringCommittee. He is also president andchairman of the Investment AdvisoryCommittee of the Capital OpportunityFund. In addition, Bill is a vice presidentand Investment Advisory Committeemember of the Dividend Growth Fund,Equity Income Fund, Financial ServicesFund, Real Estate Fund, and Tax-EfficientGrowth Fund. He is also a vice presidentof the Tax-Efficient Balanced Fund andTax-Efficient Multi-Cap Growth Fund. Bill earned a BA from Johns HopkinsUniversity and an MBA from Tuck Schoolof Business at Dartmouth College.
T O P H O L D I N G S T O P I N D U S T R I E S
P E R F O R M A N C E S U M M A R Y
Drugs 8.3%
Commercial Banks 7.6%
Computer & Data Processing 6.0%
Petroleum Refining 5.6%
Computer & Office Equipment 5.5%
Household Appliances 4.3%
Fire, Marine & Casualty Insurance 3.9%
Telephone Communication 3.1%
Department Stores 3.1%
Electronic Components & Accessories 2.9%
General Electric 4.15%
Exxon Mobil 3.19%
Microsoft 2.73%
Pfizer 2.16%
Citigroup 2.09%
Wal-Mart Stores 1.91%
JP Morgan Chase 1.79%
American International Group 1.77%
Procter & Gamble 1.65%
Johnson & Johnson 1.61%
Total 23.05%
1 Year 3 Years 5 Years 10 Years2 10 Years2,3
or Since or Since Portfolio SubaccountInception Inception
Portfolio Inception (05/01/2002)1
Subaccount Inception (05/01/2002)3
Including Sales Charges
Excluding Sales Charges
5.56 — — -1.09 -1.09
11.56 — — 0.98 0.98
Mar
ket
Cap
italiz
atio
n
Large
Medium
Small
Value Blend Growth
Equity Style
Investment results shown represent historical returns based upon the assumption that the Principal Variable Annuity was availablefor the period shown.
Past performance is no guarantee of future results. Current performance may be lower or higher than the performance datashown. For more performance information, including most recent month-end performance, visit our Web site atwww.principal.com and click on “Rates and Values.”
Returns and principal values fluctuate with changes in interest rates and other market conditions so that the value at any timemay be more or less than the principal amount invested.
Except where noted, investment results include all charges and expenses for the base contract, including a contingent deferredsurrender charge (which declines from a maximum of 6%), but excluding additional charges for riders.
Before investing in the Principal Variable Annuity, investors should carefully consider the investment objectives, risks, chargesand expenses of the contract. This and other information is contained in the free prospectus, which can be obtained fromyour local representative. Please read the prospectus carefully before investing.
RF 658-13 2/11/05 4:34 PM Page 15

1 Year 3 Years 5 Years 10 Years2 10 Years2,3
or Since or Since Portfolio SubaccountInception Inception
Portfolio Inception (05/02/1994)1
Subaccount Inception (08/02/1999)3
Including Sales Charges
Excluding Sales Charges
O B J E C T I V EThe AIM V.I. Core Equity Subaccountseeks growth of capital with a secondaryobjective of current income.
P O R T F O L I O M A N A G E R SRonald S. Sloan, senior vice president, islead portfolio manager of AIM CharterFund, AIM Mid Cap Core Equity Fund,AIM V.I. Mid Cap Core Equity Fund, andAIM V.I. Core Equity Fund. Mr. Sloanjoined AIM in 1998 from VerissimoResearch and Management, where heserved as president since 1993. Prior toVerissimo Research and Management, hewas partner and executive vice presidentat Wood Island Associates, Inc./SiebelCapital Management, Inc. from 1981 to1993. Mr. Sloan has been in theinvestment industry since 1971. Mr.Sloan holds a BS in businessadministration as well as an MBA fromthe University of Missouri. He is aChartered Financial Analyst. He holds aChartered Financial Analyst designation.
David Pointer, vice president, is portfoliomanager for AIM Capital Management,Inc. Prior to joining AIM, Mr. Pointer waswith Brueggeman & Johnson, PLC,conducting corporate valuations, offeringmerger advice, and dispute resolutionconsulting services. He also worked as a private equity analyst with theGovernment of Singapore InvestmentCorporation. Mr. Pointer received a BS in finance and economics from CentralWashington University and earned hisMBA from The Wharton School of theUniversity of Pennsylvania. He holds aChartered Financial Analyst designation.
Investment results shown representhistorical returns based upon theassumption that the Principal VariableAnnuity was available for the period shown.
Past performance is no guarantee offuture results. Current performance maybe lower or higher than the performancedata shown. For more performanceinformation, including most recentmonth-end performance, visit our Website at www.principal.com and click on“Rates and Values.”
T O P H O L D I N G S T O P I N D U S T R I E S
P E R F O R M A N C E S U M M A R Y
4.81 3.87 — — -4.73
10.81 5.39 -4.13 7.52 -4.26
13
AIM V.I. Core Equity Subaccount6
Portfolio Information as of September 30, 2004
Mar
ket
Cap
italiz
atio
n
Large
Medium
Small
Value Blend Growth
Equity Style
Returns and principal values fluctuate with changes in interest rates and othermarket conditions so that the value at any time may be more or less than theprincipal amount invested.
Except where noted, investment results include all charges and expenses for thebase contract, including a contingent deferred surrender charge (which declinesfrom a maximum of 6%), but excluding additional charges for riders.
Before investing in the Principal Variable Annuity, investors should carefullyconsider the investment objectives, risks, charges and expenses of the contract.This and other information is contained in the free prospectus, which can beobtained from your local representative. Please read the prospectus carefullybefore investing.
Microsoft Corp. 3.09%
General Mills Inc. 2.87%
Pfizer, Inc. 2.49%
Tyco International Ltd. 2.46%
Glaxosmithkline Plc. Adr. 2.13%
Washington Mutual Inc. 2.08%
BP Plc Adr 1.97%
Wyeth 1.96%
Campbell Soup Co. 1.88%
Computer Associates Intl. 1.88%
Total 22.81%
Pharmaceuticals
Packaged Foods
Integrated Oil & Gas
Systems Software
Semiconductors
Industrial Conglomerates
Publishing & Printing
Food Retail
Industrial Machinery
Railroads
RF 658-13 2/11/05 4:34 PM Page 16

Past performance is no guarantee of future results. Current performance maybe lower or higher than the performance data shown. For more performanceinformation, including most recent month-end performance, visit our Web siteat www.principal.com and click on “Rates and Values.”
Returns and principal values fluctuate with changes in interest rates and othermarket conditions so that the value at any time may be more or less than theprincipal amount invested.
Except where noted, investment results include all charges and expenses for thebase contract, including a contingent deferred surrender charge (which declinesfrom a maximum of 6%), but excluding additional charges for riders.
Before investing in the Principal Variable Annuity, investors should carefullyconsider the investment objectives, risks, charges and expenses of the contract.This and other information is contained in the free prospectus, which can beobtained from your local representative. Please read the prospectus carefullybefore investing.
O B J E C T I V EThe AIM V. I. Premier Equity Subaccountseeks long-term growth of capital byinvesting primarily in equity securitiesjudged by the fund’s investment advisorto be undervalued relative to theinvestment advisor’s appraisal of thecurrent or projected earnings of thecompanies issuing the securities, orrelative to current market values of assetsowned by the companies issuing thesecurities, or relative to the equity marketgenerally. Income is a secondary objective.
P O R T F O L I O M A N A G E R SRon Sloan is a senior vice president andsenior portfolio manager of AIM CapitalManagement, Inc. Mr. Sloan joined AIMin 1998 from Verissimo Research andManagement, where he had served as president since 1993. Prior to VerissimoResearch and Management, he waspartner and executive vice president atWood Island Associates, Inc./Siebel CapitalManagement, Inc. from 1981 to 1993.
Lanny Sachnowitz is a lead portfoliomanager. Mr. Sachnowitz joined AIMManagement Group in 1987 as a moneymarket trader and research analyst. In1990, Mr. Sachnowitz’s tradingresponsibilities were expanded to includehead of equity trading.
Bret Stanley is a lead portfolio manager.He is co-manager of AIM Summit Fund.Prior to joining AIM in 1998, Mr. Stanleywas a vice president and portfoliomanager with Van Kampen AmericanCapital, Inc. where he managed growthand income, equity income, and valueportfolios. He began his investment careerin 1988.
Investment results shown representhistorical returns based upon theassumption that the Principal VariableAnnuity was available for the period shown.
T O P H O L D I N G S T O P I N D U S T R I E S
P E R F O R M A N C E S U M M A R Y
14
AIM V.I. PremierEquity Subaccount6
Portfolio Information as of September 30, 2004
1 Year 3 Years 5 Years 10 Years2 10 Years2,3
or Since or Since Portfolio SubaccountInception Inception
Portfolio Inception (05/05/1993)1
Subaccount Inception (08/02/1999)3
Including Sales Charges
Excluding Sales Charges
0.19 -5.28 — — -7.50
6.19 -3.46 -6.92 7.09 -6.97
Mar
ket
Cap
italiz
atio
n
Large
Medium
Small
Value Blend Growth
Equity Style
Pharmaceuticals
Industrial Conglomerates
Systems Software
Packaged Foods
Integrated Oil & Gas
Other Diversified Financial Services
Communications Equipment
Semiconductors
Oil & Gas Equipment Svcs
Food Retail
Tyco International Ltd. 3.05%
Pfizer Inc. 2.17%
Computer Associates Intl. 1.79%
First Data Corp. 1.63%
Waste Management Inc. 1.63%
Cendant Corp. 1.50%
Microsoft Corp. 1.48%
Wyeth 1.44%
Masco Corp. 1.41%
General Mills Inc. 1.40%
Total 17.50%
RF 658-13 2/11/05 4:34 PM Page 17
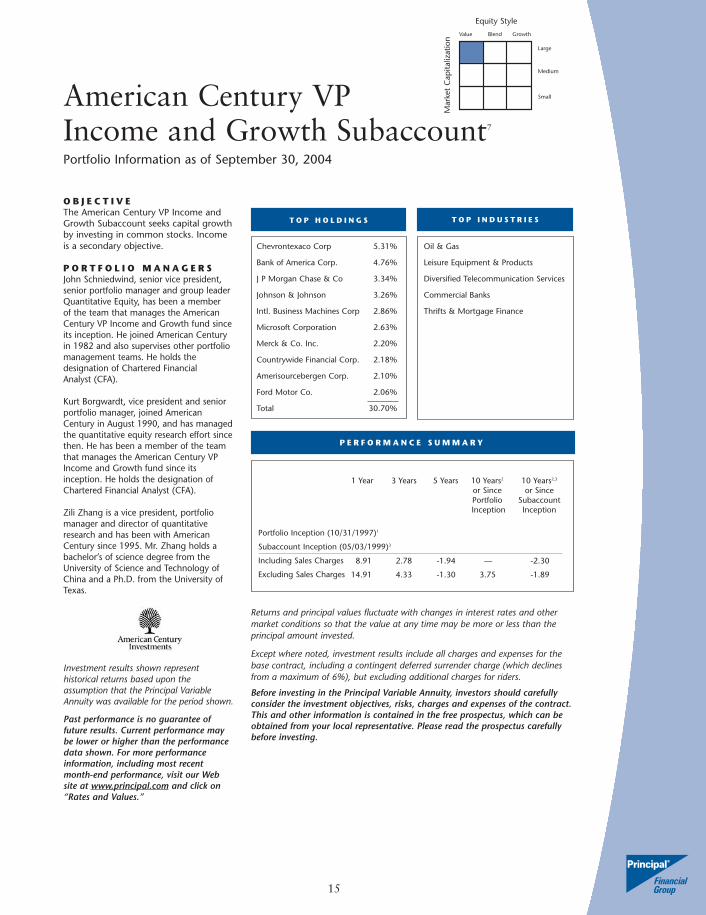
O B J E C T I V EThe American Century VP Income andGrowth Subaccount seeks capital growthby investing in common stocks. Incomeis a secondary objective.
P O R T F O L I O M A N A G E R SJohn Schniedwind, senior vice president,senior portfolio manager and group leaderQuantitative Equity, has been a member of the team that manages the AmericanCentury VP Income and Growth fund sinceits inception. He joined American Centuryin 1982 and also supervises other portfoliomanagement teams. He holds thedesignation of Chartered Financial Analyst (CFA).
Kurt Borgwardt, vice president and seniorportfolio manager, joined AmericanCentury in August 1990, and has managedthe quantitative equity research effort sincethen. He has been a member of the teamthat manages the American Century VPIncome and Growth fund since itsinception. He holds the designation ofChartered Financial Analyst (CFA).
Zili Zhang is a vice president, portfoliomanager and director of quantitativeresearch and has been with AmericanCentury since 1995. Mr. Zhang holds abachelor’s of science degree from theUniversity of Science and Technology ofChina and a Ph.D. from the University ofTexas.
Investment results shown representhistorical returns based upon theassumption that the Principal VariableAnnuity was available for the period shown.
Past performance is no guarantee offuture results. Current performance maybe lower or higher than the performancedata shown. For more performanceinformation, including most recentmonth-end performance, visit our Website at www.principal.com and click on“Rates and Values.”
American Century VP Income and Growth Subaccount7
Portfolio Information as of September 30, 2004
T O P H O L D I N G S T O P I N D U S T R I E S
P E R F O R M A N C E S U M M A R Y
1 Year 3 Years 5 Years 10 Years2 10 Years2,3
or Since or Since Portfolio SubaccountInception Inception
Portfolio Inception (10/31/1997)1
Subaccount Inception (05/03/1999)3
Including Sales Charges
Excluding Sales Charges
8.91 2.78 -1.94 — -2.30
14.91 4.33 -1.30 3.75 -1.89
15
Returns and principal values fluctuate with changes in interest rates and othermarket conditions so that the value at any time may be more or less than theprincipal amount invested.
Except where noted, investment results include all charges and expenses for thebase contract, including a contingent deferred surrender charge (which declinesfrom a maximum of 6%), but excluding additional charges for riders.
Before investing in the Principal Variable Annuity, investors should carefullyconsider the investment objectives, risks, charges and expenses of the contract.This and other information is contained in the free prospectus, which can beobtained from your local representative. Please read the prospectus carefullybefore investing.
Mar
ket
Cap
italiz
atio
n
Large
Medium
Small
Value Blend Growth
Equity Style
Chevrontexaco Corp 5.31%
Bank of America Corp. 4.76%
J P Morgan Chase & Co 3.34%
Johnson & Johnson 3.26%
Intl. Business Machines Corp 2.86%
Microsoft Corporation 2.63%
Merck & Co. Inc. 2.20%
Countrywide Financial Corp. 2.18%
Amerisourcebergen Corp. 2.10%
Ford Motor Co. 2.06%
Total 30.70%
Oil & Gas
Leisure Equipment & Products
Diversified Telecommunication Services
Commercial Banks
Thrifts & Mortgage Finance
RF 658-13 2/11/05 4:34 PM Page 18

O B J E C T I V EThe American Century VP ValueSubaccount seeks long-term capitalgrowth. Income is a secondary objective.
P O R T F O L I O M A N A G E R SPhillip N. Davidson, CFA, is a senior vicepresident and senior portfolio managerfor American Century investments. Mr. Davidson joined the company in1993. He is a member of the team ofinvestment professionals managingAmerican Century’s Value and EquityIncome funds. Prior to joining AmericanCentury, Mr. Davidson was vice presidentand equity portfolio manager forBoatmen’s Trust Company in St. Louis.He has worked in the financial industrysince 1980. Mr. Davidson holds abachelor’s degree in businessadministration and a master’s degree in finance from Illinois State University.He is a holder of the right to use theChartered Financial Analyst designation.
Scott Moore, CFA, CMA, is a vicepresident and portfolio manager for American Century Investments. Mr. Moore, who joined AmericanCentury in 1993 and has worked in thefinancial industry since then, is a memberof the management team that overseesthe American Century Value and EquityIncome funds. He left the company in1995 to work for Boatmen’s TrustCompany in St. Louis as an investmentanalyst. He returned to American Centuryin 1996 as an investment analyst. Mr. Moore holds a bachelor’s degree infinance from Southern Illinois Universityand a master’s degree from theUniversity of Missouri. He is a member ofthe Institute of ManagementAccountants and the Association forInvestment Management and Research(AIMR). He is a holder of the right to usethe Chartered Financial Analystdesignation.
T O P H O L D I N G S T O P I N D U S T R I E S
P E R F O R M A N C E S U M M A R Y
16
American Century VP Value Subaccount7
Portfolio Information as of September 30, 2004
1 Year 3 Years 5 Years 10 Years2 10 Years2,3
or Since or Since Portfolio SubaccountInception Inception
Portfolio Inception (05/01/1996)1
Subaccount Inception (05/20/2002)3
Including Sales Charges
Excluding Sales Charges
11.89 — — — 3.10
17.89 8.79 7.75 9.08 5.10
Investment results shown represent historical returns based upon the assumptionthat the Principal Variable Annuity was available for the period shown.
Past performance is no guarantee of future results. Current performance maybe lower or higher than the performance data shown. For more performanceinformation, including most recent month-end performance, visit our Web siteat www.principal.com and click on “Rates and Values.”
Returns and principal values fluctuate with changes in interest rates and othermarket conditions so that the value at any time may be more or less than theprincipal amount invested.
Except where noted, investment results include all charges and expenses for thebase contract, including a contingent deferred surrender charge (which declinesfrom a maximum of 6%), but excluding additional charges for riders.
Before investing in the Principal Variable Annuity, investors should carefullyconsider the investment objectives, risks, charges and expenses of the contract.This and other information is contained in the free prospectus, which can beobtained from your local representative. Please read the prospectus carefullybefore investing.
Mar
ket
Cap
italiz
atio
n
Large
Medium
Small
Value Blend Growth
Equity Style
Commercial Banks
Oil & Gas
Diversified Telecommunication Services
Electric Utilities
Insurance
Union Pacific Corp 3.55%
Suntrust Banks Inc. 3.20%
Kraft Foods Inc 2.85%
Martin Marietta Materials 2.77%
March & Mc Lennan Cos 2.56%
New York Times Co - Cl A 2.53%
Republic Services Inc. 2.41%
Edwards (A G) Inc. 2.24%
Unilever N V (Group) 2.17%
Royal Dutch Petrol (Group 2.16%
Total 26.44%
RF 658-13 2/11/05 4:34 PM Page 19

O B J E C T I V EThe MidCap Value Subaccount seekslong-term capital growth by investingprimarily in equity securities of mediumcapitalization companies.
P O R T F O L I O M A N A G E RAndrew Wellington is the portfoliomanager of the MidCap Valuesubaccount and the Neuberger BermanRegency Fund. He has over 14 yearsinvestment experience and previouslyworked at Pzena InvestmentManagement as a Portfolio Manager.Andrew received a B.S. in Economicsfrom the University of Pennsylvania,Wharton School of Business.
Investment results shown representhistorical returns based upon theassumption that the Principal VariableAnnuity was available for the period shown.
Past performance is no guarantee offuture results. Current performance maybe lower or higher than the performancedata shown. For more performanceinformation, including most recentmonth-end performance, visit our Website at www.principal.com and click on“Rates and Values.”
17
MidCap ValueSubaccountPortfolio Information as of September 30, 2004
T O P H O L D I N G S T O P I N D U S T R I E S
P E R F O R M A N C E S U M M A R Y
1 Year 3 Years 5 Years 10 Years2 10 Years2,3
or Since or Since Portfolio SubaccountInception Inception
Portfolio Inception (05/03/1999)1
Subaccount Inception (05/03/1999)3
Including Sales Charges
Excluding Sales Charges
17.53 11.06 14.31 10.76 10.76
23.53 12.39 14.66 11.00 11.00
Surety Insurance 7.4%
Fire, Marine & Casualty Insurance 6.4%
Crude Petroleum & Natural Gas 6.3%
Motor Vehicles & Equipment 5.0%
Medical Services & Health 4.4%
Hospitals 4.1%
Commercial Banks 3.9%
Health & Allied Services 3.8%
Auto & Home Supply Stores 3.4%
Department Stores 3.2%
Bear Stearns 2.66%
Triad Hospitals 2.60%
SPX 2.56%
AMBAC Financial Group 2.49%
Western Digital 2.49%
Coventry Health Care 2.48%
Whirlpool 2.47%
XTO Energy 2.45%
IndyMac Bancorp 2.44%
Radian Group 2.38%
Total 25.02%
Mar
ket
Cap
italiz
atio
n
Large
Medium
Small
Value Blend Growth
Equity Style
Returns and principal values fluctuate with changes in interest rates and other market conditions so that the value at any timemay be more or less than the principal amount invested.
Except where noted, investment results include all charges and expenses for the base contract, including a contingent deferredsurrender charge (which declines from a maximum of 6%), but excluding additional charges for riders.
Before investing in the Principal Variable Annuity, investors should carefully consider the investment objectives, risks, chargesand expenses of the contract. This and other information is contained in the free prospectus, which can be obtained fromyour local representative. Please read the prospectus carefully before investing.
RF 658-13 2/11/05 4:34 PM Page 20
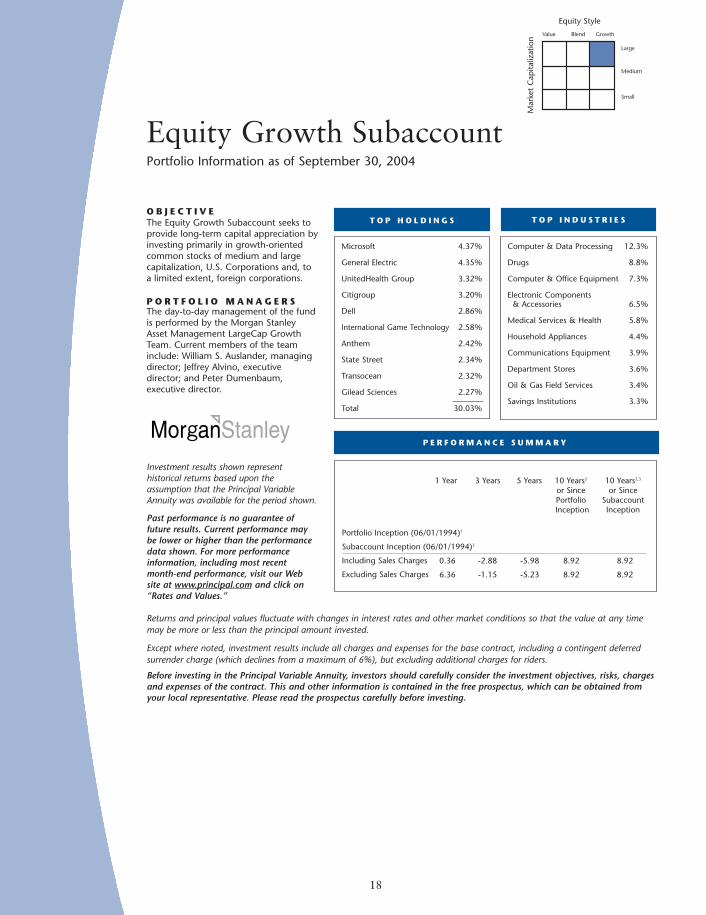
Equity Growth SubaccountPortfolio Information as of September 30, 2004
O B J E C T I V EThe Equity Growth Subaccount seeks toprovide long-term capital appreciation byinvesting primarily in growth-orientedcommon stocks of medium and largecapitalization, U.S. Corporations and, toa limited extent, foreign corporations.
P O R T F O L I O M A N A G E R SThe day-to-day management of the fundis performed by the Morgan StanleyAsset Management LargeCap GrowthTeam. Current members of the teaminclude: William S. Auslander, managingdirector; Jeffrey Alvino, executivedirector; and Peter Dumenbaum,executive director.
Investment results shown representhistorical returns based upon theassumption that the Principal VariableAnnuity was available for the period shown.
Past performance is no guarantee offuture results. Current performance maybe lower or higher than the performancedata shown. For more performanceinformation, including most recentmonth-end performance, visit our Website at www.principal.com and click on“Rates and Values.”
T O P H O L D I N G S T O P I N D U S T R I E S
P E R F O R M A N C E S U M M A R Y
Microsoft 4.37%
General Electric 4.35%
UnitedHealth Group 3.32%
Citigroup 3.20%
Dell 2.86%
International Game Technology 2.58%
Anthem 2.42%
State Street 2.34%
Transocean 2.32%
Gilead Sciences 2.27%
Total 30.03%
Computer & Data Processing 12.3%
Drugs 8.8%
Computer & Office Equipment 7.3%
Electronic Components & Accessories 6.5%
Medical Services & Health 5.8%
Household Appliances 4.4%
Communications Equipment 3.9%
Department Stores 3.6%
Oil & Gas Field Services 3.4%
Savings Institutions 3.3%
1 Year 3 Years 5 Years 10 Years2 10 Years2,3
or Since or Since Portfolio SubaccountInception Inception
Portfolio Inception (06/01/1994)1
Subaccount Inception (06/01/1994)3
Including Sales Charges
Excluding Sales Charges
0.36 -2.88 -5.98 8.92 8.92
6.36 -1.15 -5.23 8.92 8.92
18
Mar
ket
Cap
italiz
atio
n
Large
Medium
Small
Value Blend Growth
Equity Style
Returns and principal values fluctuate with changes in interest rates and other market conditions so that the value at any timemay be more or less than the principal amount invested.
Except where noted, investment results include all charges and expenses for the base contract, including a contingent deferredsurrender charge (which declines from a maximum of 6%), but excluding additional charges for riders.
Before investing in the Principal Variable Annuity, investors should carefully consider the investment objectives, risks, chargesand expenses of the contract. This and other information is contained in the free prospectus, which can be obtained fromyour local representative. Please read the prospectus carefully before investing.
RF 658-13 2/11/05 4:34 PM Page 21

19
Growth SubaccountPortfolio Information as of September 30, 2004
O B J E C T I V EThe Growth Subaccount seeks growth ofcapital primarily through the purchase ofcommon stocks, but may invest in othersecurities.
P O R T F O L I O M A N A G E RMary Sunderland, CFA, manages the large cap growth portfolios for The Principal. She joined the company in 1999 following a 10-year career withSkandia Asset Management. At Skandia,Mary directed their $3.0 billion U.S.equity large cap growth portfolios andU.S. technology portfolios. She has morethan a decade of prior experience withValueLine. Mary received an MBA infinance from the Columbia UniversityGraduate School of Business and a BA ineconomics from Northwestern University.
Investment results shown representhistorical returns based upon theassumption that the Principal VariableAnnuity was available for the period shown.
Past performance is no guarantee offuture results. Current performance maybe lower or higher than the performancedata shown. For more performanceinformation, including most recentmonth-end performance, visit our Website at www.principal.com and click on“Rates and Values.”
T O P H O L D I N G S T O P I N D U S T R I E S
P E R F O R M A N C E S U M M A R Y
Microsoft 5.22%
Pfizer 4.90%
Johnson & Johnson 4.30%
Cisco Systems 3.60%
Procter & Gamble 3.34%
UnitedHealth Group 2.71%
Dell 2.62%
Medtronic 2.48%
3M 2.36%
Intel 2.32%
Total 33.85%
Drugs 13.6%
Computer & Office Equipment 12.6%
Computer & Data Processing 9.5%
Medical Instruments & Supplies 6.5%
Soap, Cleaners & Toilet Goods 6.5%
Electronic Components & Accessories 5.9%
Miscellaneous Shopping Goods 3.6%
Beverages 2.8%
Security Brokers & Dealers 2.8%
Cutlery & Hand Tools 2.7%
1 Year 3 Years 5 Years 10 Years2 10 Years2,3
or Since or Since Portfolio SubaccountInception Inception
Portfolio Inception (05/02/1994)1
Subaccount Inception (05/02/1994)3
Including Sales Charges
Excluding Sales Charges
1.70 -2.65 -9.33 3.17 3.17
7.70 -0.92 -8.46 3.17 3.17
Mar
ket
Cap
italiz
atio
n
Large
Medium
Small
Value Blend Growth
Equity Style
Returns and principal values fluctuate with changes in interest rates and other market conditions so that the value at any timemay be more or less than the principal amount invested.
Except where noted, investment results include all charges and expenses for the base contract, including a contingent deferredsurrender charge (which declines from a maximum of 6%), but excluding additional charges for riders.
Before investing in the Principal Variable Annuity, investors should carefully consider the investment objectives, risks, chargesand expenses of the contract. This and other information is contained in the free prospectus, which can be obtained fromyour local representative. Please read the prospectus carefully before investing.
RF 658-13 2/11/05 4:34 PM Page 22

O B J E C T I V EThe Fidelity VIP Growth Subaccount seeksto maximize total return by allocating itsassets among stocks, bonds, short-terminstruments, and other investments.
P O R T F O L I O M A N A G E RJennifer Uhrig is vice president andportfolio manager for FidelityInvestments. Jennifer manages FidelityAdvisor Equity Growth Fund and FidelityVIP Growth Fund. Jennifer joined Fidelityin 1987 as a research analyst coveringthe telecommunications industry. Prior tojoining Fidelity, Jennifer was a researchassociate for Fred Alger Management, apension fund manager, in New York,from 1983 to 1985. She earned abachelor of arts degree in governmentfrom Harvard College in 1983 and anMBA from the Amos Tuck School atDartmouth College in 1987.
Investment results shown representhistorical returns based upon theassumption that the Principal VariableAnnuity was available for the period shown.
Past performance is no guarantee offuture results. Current performance maybe lower or higher than the performancedata shown. For more performanceinformation, including most recentmonth-end performance, visit our Web site at www.principal.com and clickon “Rates and Values.”
20
Fidelity VIPGrowth Subaccount4,6
Portfolio Information as of September 30, 2004
T O P H O L D I N G S T O P I N D U S T R I E S
P E R F O R M A N C E S U M M A R Y
1 Year 3 Years 5 Years 10 Years2 10 Years2,3
or Since or Since Portfolio SubaccountInception Inception
Portfolio Inception (10/31/1986)1
Subaccount Inception (08/02/1999)3
Including Sales Charges
Excluding Sales Charges
-1.50 -2.02 — — -6.27
4.50 -0.31 -5.70 9.39 -5.77
Mar
ket
Cap
italiz
atio
n
Large
Medium
Small
Value Blend Growth
Equity Style
Returns and principal values fluctuate with changes in interest rates and other market conditions so that the value at any timemay be more or less than the principal amount invested.
Except where noted, investment results include all charges and expenses for the base contract, including a contingent deferredsurrender charge (which declines from a maximum of 6%), but excluding additional charges for riders.
Before investing in the Principal Variable Annuity, investors should carefully consider the investment objectives, risks, chargesand expenses of the contract. This and other information is contained in the free prospectus, which can be obtained fromyour local representative. Please read the prospectus carefully before investing.
Pfizer Inc.
CISCO Systems, Inc.
Microsoft Corp.
Wal Mart Stores Inc.
Dell Inc.
Johnson & Johnson
Home Depot Inc.
General Electric Co.
Amer Intl Group Inc.
Qualcomm Inc.
Total 23.60%
Information Technology
Health Care
Consumer Discretionary
Financials
Industrials
Consumer Staples
Energy
Materials
Telecommunication Services
Utilities
RF 658-13 2/11/05 4:34 PM Page 23

OBJECTIVEThe AIM V.I. Growth Subaccount seeksgrowth of capital primarily by investing inseasoned and better capitalized companiesconsidered to have strong earningsmomentum.
PORTFOLIO MANAGERSLanny H. Sachnowitz, senior vice president,is lead portfolio manager of AIM DentDemographics Fund, AIM WeingartenFund, AIM V.I. Dent Demographics Fund,AIM V.I. Growth Fund, and AIM CapitalWeingarten Fund. Mr. Sachnowitz joinedAIM Management Group in 1987 as amoney market trader and research analyst.In 1989, he was promoted to assistantportfolio manager for AIM Strategic IncomeFund, a closed-end convertible arbitragefund. He also was named co-portfoliomanager for AIM Convertible Securities. In 1990, Mr. Sachnowitz’s tradingresponsibilities were expanded to includehead of equity trading. He was named tohis current position in 1991.
Monika H. Degan, senior vice president, isthe lead manager of AIM Blue Chip Fund,AIM V.I. Blue Chip Fund, and INVESCOGrowth & Income Fund. Ms. Degan joinedAIM in 1995 as an investment officer andportfolio analyst for equity securities andwas promoted to her current position in1997. She has been in the investmentbusiness since 1991. Prior to joining AIMshe was senior financial analyst for Shell OilCo. Pension Trust. She has earned thedesignation Chartered Financial Analyst.
Gabe Birdsall, vice president, is portfoliomanager for AIM Capital Management Inc.Prior to assuming his current responsibilities,Mr. Birdsall worked on AIM’s derivativetrading desk from 1997 to 1999 and in AIM’s shareholder services area from1995 to 1997.
21
AIM V.I. Growth Subaccount6
Portfolio Information as of September 30, 2004
T O P H O L D I N G S T O P I N D U S T R I E S
P E R F O R M A N C E S U M M A R Y
1 Year 3 Years 5 Years 10 Years2 10 Years2,3
or Since or Since Portfolio SubaccountInception Inception
Portfolio Inception (05/05/1993)1
Subaccount Inception (08/02/1999)3
Including Sales Charges
Excluding Sales Charges
1.27 -4.37 — — -12.03
7.27 -2.55 -11.82 4.15 -11.38
Investment results shown represent historical returns based upon the assumptionthat the Principal Variable Annuity was available for the period shown.
Past performance is no guarantee of future results. Current performance maybe lower or higher than the performance data shown. For more performanceinformation, including most recent month-end performance, visit our Web siteat www.principal.com and click on “Rates and Values.”
Returns and principal values fluctuate with changes in interest rates and othermarket conditions so that the value at any time may be more or less than theprincipal amount invested.
Except where noted, investment results include all charges and expenses for thebase contract, including a contingent deferred surrender charge (which declinesfrom a maximum of 6%), but excluding additional charges for riders.
Before investing in the Principal Variable Annuity, investors should carefullyconsider the investment objectives, risks, charges and expenses of the contract.This and other information is contained in the free prospectus, which can beobtained from your local representative. Please read the prospectus carefullybefore investing.
Mar
ket
Cap
italiz
atio
n
Large
Medium
Small
Value Blend Growth
Equity Style
Tyco International Ltd. 4.49%
Aetna Inc. 2.65%
Yahoo! Inc. 2.51%
Cendant Corp. 2.26%
Dell Inc. 2.19%
Kohls Corp. 2.02%
Microsoft Corp. 2.01%
Cisco Systems Inc. 1.97%
Johnson & Johnson 1.89%
Pfizer Inc. 1.88%
Total 23.87%
Pharmaceuticals
Communications Equipment
Industrial Conglomerates
Systems Software
Managed Health Care
Computer Hardware
Personal Products
Investment Banking & Brokerage
Department Stores
Diversified Commercial Svcs.
RF 658-13 2/11/05 4:34 PM Page 24
22
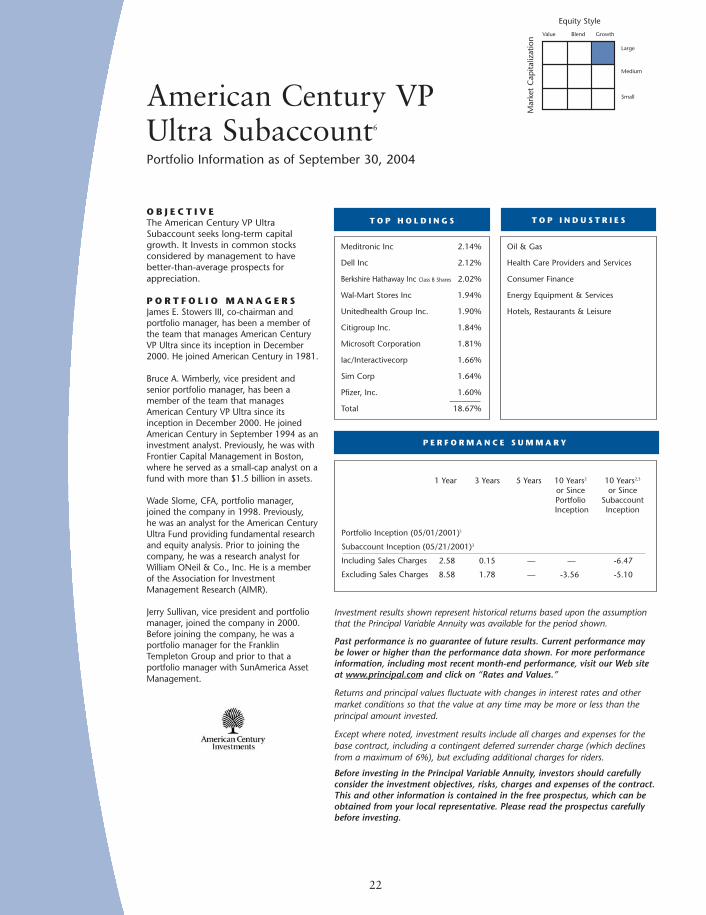
American Century VP Ultra Subaccount6
Portfolio Information as of September 30, 2004
O B J E C T I V EThe American Century VP UltraSubaccount seeks long-term capitalgrowth. It Invests in common stocksconsidered by management to havebetter-than-average prospects forappreciation.
P O R T F O L I O M A N A G E R SJames E. Stowers III, co-chairman andportfolio manager, has been a member ofthe team that manages American CenturyVP Ultra since its inception in December2000. He joined American Century in 1981.
Bruce A. Wimberly, vice president andsenior portfolio manager, has been amember of the team that managesAmerican Century VP Ultra since itsinception in December 2000. He joinedAmerican Century in September 1994 as aninvestment analyst. Previously, he was withFrontier Capital Management in Boston,where he served as a small-cap analyst on afund with more than $1.5 billion in assets.
Wade Slome, CFA, portfolio manager,joined the company in 1998. Previously, he was an analyst for the American CenturyUltra Fund providing fundamental researchand equity analysis. Prior to joining thecompany, he was a research analyst forWilliam ONeil & Co., Inc. He is a memberof the Association for InvestmentManagement Research (AIMR).
Jerry Sullivan, vice president and portfoliomanager, joined the company in 2000.Before joining the company, he was aportfolio manager for the FranklinTempleton Group and prior to that aportfolio manager with SunAmerica AssetManagement.
T O P H O L D I N G S T O P I N D U S T R I E S
P E R F O R M A N C E S U M M A R Y
1 Year 3 Years 5 Years 10 Years2 10 Years2,3
or Since or Since Portfolio SubaccountInception Inception
Portfolio Inception (05/01/2001)1
Subaccount Inception (05/21/2001)3
Including Sales Charges
Excluding Sales Charges
2.58 0.15 — — -6.47
8.58 1.78 — -3.56 -5.10
Investment results shown represent historical returns based upon the assumptionthat the Principal Variable Annuity was available for the period shown.
Past performance is no guarantee of future results. Current performance maybe lower or higher than the performance data shown. For more performanceinformation, including most recent month-end performance, visit our Web siteat www.principal.com and click on “Rates and Values.”
Returns and principal values fluctuate with changes in interest rates and othermarket conditions so that the value at any time may be more or less than theprincipal amount invested.
Except where noted, investment results include all charges and expenses for thebase contract, including a contingent deferred surrender charge (which declinesfrom a maximum of 6%), but excluding additional charges for riders.
Before investing in the Principal Variable Annuity, investors should carefullyconsider the investment objectives, risks, charges and expenses of the contract.This and other information is contained in the free prospectus, which can beobtained from your local representative. Please read the prospectus carefullybefore investing.
Mar
ket
Cap
italiz
atio
n
Large
Medium
Small
Value Blend Growth
Equity Style
Meditronic Inc 2.14%
Dell Inc 2.12%
Berkshire Hathaway Inc Class B Shares 2.02%
Wal-Mart Stores Inc 1.94%
Unitedhealth Group Inc. 1.90%
Citigroup Inc. 1.84%
Microsoft Corporation 1.81%
Iac/Interactivecorp 1.66%
Sim Corp 1.64%
Pfizer, Inc. 1.60%
Total 18.67%
Oil & Gas
Health Care Providers and Services
Consumer Finance
Energy Equipment & Services
Hotels, Restaurants & Leisure
RF 658-13 2/11/05 4:34 PM Page 25

O B J E C T I V EThe Fidelity VIP II Contrafund® Subaccountseeks long-term capital appreciation byinvesting primarily in common stocks.
P O R T F O L I O M A N A G E RWilliam Danoff joined Fidelity in 1986 asa securities analyst. Will has managed theFidelity VIP II Contrafund since itsinception in January 1995. He earned abachelor’s degree from Harvard in 1982and a master’s degree from theUniversity of Pennsylvania, The WhartonSchool, in 1986.
Investment results shown representhistorical returns based upon theassumption that the Principal VariableAnnuity was available for the period shown.
Past performance is no guarantee offuture results. Current performance maybe lower or higher than the performancedata shown. For more performanceinformation, including most recentmonth-end performance, visit our Website at www.principal.com and click on“Rates and Values.”
Returns and principal values fluctuate withchanges in interest rates and other market
23
Fidelity VIP II Contrafund® Subaccount4,6
Portfolio Information as of September 30, 2004
T O P H O L D I N G S T O P I N D U S T R I E S
P E R F O R M A N C E S U M M A R Y
1 Year 3 Years 5 Years 10 Years2 10 Years2,3
or Since or Since Portfolio SubaccountInception Inception
Portfolio Inception (01/31/1995)1
Subaccount Inception (08/02/1999)3
Including Sales Charges
Excluding Sales Charges
10.26 6.61 — — 0.89
16.26 8.05 1.99 12.25 1.26
Mar
ket
Cap
italiz
atio
n
Large
Medium
Small
Value Blend Growth
Equity Style
conditions so that the value at any time may be more or less than the principal amount invested.
Except where noted, investment results include all charges and expenses for the base contract, including a contingent deferredsurrender charge (which declines from a maximum of 6%), but excluding additional charges for riders.
Before investing in the Principal Variable Annuity, investors should carefully consider the investment objectives, risks, chargesand expenses of the contract. This and other information is contained in the free prospectus, which can be obtained fromyour local representative. Please read the prospectus carefully before investing.
Avon Products Inc.
Berkshire Hathaway Inc.
3M Co
Encana Corp.
Yahoo! Inc.
Genentech, Inc.
Samsung Electronics Co Ltd.
Amer Intl. Group Inc.
Patterson Companies, Inc.
Danaher Corp.
Total 18.80%
Information Technology
Health Care
Financials
Consumer Discretionary
Industrials
Energy
Consumer Staples
Materials
Telecommunication Services
Utilities
RF 658-13 2/11/05 4:34 PM Page 26

24
LargeCap Growth Equity SubaccountPortfolio Information as of September 30, 2004
T O P H O L D I N G S T O P I N D U S T R I E S
P E R F O R M A N C E S U M M A R Y
Home Depot 5.01%
Qualcom 4.50%
Dell 3.87%
Johnson & Johnson 3.48%
Procter & Gamble 3.38%
Merck 3.31%
Exxon Mobil 3.19%
American International Group 2.93%
Pfizer 2.92%
Federal National Mort. Association 2.34%
Total 34.93%
Drugs 12.0%
Computer & Data Processing 6.4%
Computer & Office Equipment 6.2%
Communications Equipment 6.0%
Lumber & Other Building Materials 5.8%
Soap, Cleaners & Toilet Goods 4.2%
Fire, Marine & Casualty Insurance 4.1%
Medical Instruments & Supplies 3.8%
Petroleum Refining 3.5%
Medical Services & Health 3.4%
1 Year 3 Years 5 Years 10 Years2 10 Years2,3
or Since or Since Portfolio SubaccountInception Inception
Portfolio Inception (10/24/2000)1
Subaccount Inception (10/24/2000)3
Including Sales Charges
Excluding Sales Charges
-4.45 -7.41 — -22.71 -22.71
1.55 -5.51 — -20.63 -20.63
O B J E C T I V EThe LargeCap Growth Equity Subaccountseeks long-term growth of capital byinvesting primarily in common stocks oflarger capitalization domestic companies.
P O R T F O L I O M A N A G E RChuck Joyce is involved in equity analysisand portfolio management for th U.S.quantitive equity portfolios. Mr. Joyceearned a B.S. from Cornell University andan MBA in finance from the MIT SloanSchool of Management.
Donna Murphy is on GMO’s U.S. equityquantitive investment team with a specialfocus on product management. Prior tojoining GMO, she was a partner and co-head of product management forINVESCO within its structured productsgroup. She earned a BA in chemistry andbiology from Elon College and an MBAfrom the University of North Carolina.
Robert Soucy is the director of U.S.equity management and is responsiblefor all U.S. quantitive equities portfoliomanagement at GMO. Mr. Soucy earned his BS from the University ofMassachusetts at Amherst.
Investment results shown represent
Mar
ket
Cap
italiz
atio
n
Large
Medium
Small
Value Blend Growth
Equity Style
historical returns based upon the assumption that the Principal Variable Annuity was available for the period shown.
Past performance is no guarantee of future results. Current performance may be lower or higher than the performance datashown. For more performance information, including most recent month-end performance, visit our Web site atwww.principal.com and click on “Rates and Values.”
Returns and principal values fluctuate with changes in interest rates and other market conditions so that the value at any timemay be more or less than the principal amount invested.
Except where noted, investment results include all charges and expenses for the base contract, including a contingent deferredsurrender charge (which declines from a maximum of 6%), but excluding additional charges for riders.
Before investing in the Principal Variable Annuity, investors should carefully consider the investment objectives, risks, chargesand expenses of the contract. This and other information is contained in the free prospectus, which can be obtained fromyour local representative. Please read the prospectus carefully before investing.
RF 658-13 2/11/05 4:34 PM Page 27

25
MidCap SubaccountPortfolio Information as of September 30, 2004
O B J E C T I V EThe MidCap Subaccount seeks capitalappreciation by investing primarily insecurities of emerging and other growth-oriented companies.
P O R T F O L I O M A N A G E RK. William Nolin, CFA, manages thedomestic Mid Cap portfolio for Principal Global Investors. He alsoactively participates in equity research with an emphasis on thetelecommunications, media andentertainment, lodging and consumernon-durables sectors. Bill joined The Principal in 1993, as an investment credit analyst. Bill earned his MBA fromthe Yale School of Management and hisBBA in finance from the University ofIowa. He is a member of the IowaSociety of Financial Analysts and theAssociation for Investment Managementand Research (AIMR).
Investment results shown representhistorical returns based upon theassumption that the Principal VariableAnnuity was available for the period shown.
Past performance is no guarantee offuture results. Current performance may
T O P H O L D I N G S T O P I N D U S T R I E S
P E R F O R M A N C E S U M M A R Y
TCF Financial 2.55%
Republic Services 1.91%
IMS Health 1.74%
Citizens Communication 1.69%
Gentex 1.62%
Storage Technology 1.62%
Everest Re Group 1.53%
UST 1.48%
Household Finance 1.45%
Fidelity National Financial, 1.41%
Total 17.00%
Computer & Data Processing 8.5%
Computer & Office Equipment 7.3%
Fire, Marine & Casualty Insurance4.5%
Medical Instruments & Supplies 4.5%
Crude Petroleum & Natural Gas 4.1%
Medical Services & Health 3.3%
Commercial Banks 3.1%
Miscellaneous Investing 2.8%
Sanitary Services 2.6%
Savings Institutions 2.6%
1 Year 3 Years 5 Years 10 Years2 10 Years2,3
or Since or Since Portfolio SubaccountInception Inception
Portfolio Inception (12/18/1987)1
Subaccount Inception (12/18/1987)3
Including Sales Charges
Excluding Sales Charges
13.94 9.50 10.12 12.52 12.52
19.94 10.88 10.53 12.52 12.52
Mar
ket
Cap
italiz
atio
n
Large
Medium
Small
Value Blend Growth
Equity Style
be lower or higher than the performance data shown. For more performance information, including most recent month-endperformance, visit our Web site at www.principal.com and click on “Rates and Values.”
Returns and principal values fluctuate with changes in interest rates and other market conditions so that the value at any timemay be more or less than the principal amount invested.
Except where noted, investment results include all charges and expenses for the base contract, including a contingent deferredsurrender charge (which declines from a maximum of 6%), but excluding additional charges for riders.
Before investing in the Principal Variable Annuity, investors should carefully consider the investment objectives, risks, chargesand expenses of the contract. This and other information is contained in the free prospectus, which can be obtained fromyour local representative. Please read the prospectus carefully before investing.
RF 658-13 2/11/05 4:34 PM Page 28

26
MidCap Growth SubaccountPortfolio Information as of September 30, 2004
O B J E C T I V EThe MidCap Growth Subaccount seeks to achieve long-term growth of capitalby investing primarily in mediumcapitalization U.S. companies with strongearnings growth potential.
P O R T F O L I O M A N A G E RJohn O' Toole, CFA, is a portfoliomanager for The Dreyfus Corporationand senior vice president of MellonEquity Associates, LLP (an affiliate of TheDreyfus Corporation) since 1990. He hasmanaged the MidCap Growth Accountfor The Dreyfus Corporation since itsinception in April 1998. John has amaster’s degree in finance from theUniversity of Chicago and a bachelor’sdegree in economics from the Universityof Pennsylvania.
Investment results shown representhistorical returns based upon theassumption that the Principal VariableAnnuity was available for the period shown.
Past performance is no guarantee offuture results. Current performance maybe lower or higher than the performancedata shown. For more performance
T O P H O L D I N G S T O P I N D U S T R I E S
P E R F O R M A N C E S U M M A R Y
Moody’s 1.43%
Lexmark International 1.41%
Adobe Systems 1.33%
Coach 1.31%
Bed Bath & Beyond 1.30%
Yum! Brands 1.23%
Fortune Brands 1.22%
Biomet 1.20%
Altera 1.10%
Black & Decker 1.10%
Total 12.63%
Computer & Data Processing 11.3%
Drugs 5.0%
Electronic Components & Accessories 4.7%
Measuring & Controlling Devices 4.2%
Computer & Office Equipment 3.4%
Research & Testing Services 3.1%
Eating & Drinking Places 3.0%
Medical Instruments & Supplies 2.7%
Communications Equipment 2.4%
Crude Petroleum & Natural Gas 2.1%
1 Year 3 Years 5 Years 10 Years2 10 Years2,3
or Since or Since Portfolio SubaccountInception Inception
Portfolio Inception (05/01/1998)1
Subaccount Inception (05/01/1998)3
Including Sales Charges
Excluding Sales Charges
2.94 5.53 -0.83 -1.53 -1.53
8.94 7.01 -0.22 -1.53 -1.53
Mar
ket
Cap
italiz
atio
n
Large
Medium
Small
Value Blend Growth
Equity Style
information, including most recent month-end performance, visit our Web site at www.principal.com and click on “Rates and Values.”
Returns and principal values fluctuate with changes in interest rates and other market conditions so that the value at any timemay be more or less than the principal amount invested.
Except where noted, investment results include all charges and expenses for the base contract, including a contingent deferredsurrender charge (which declines from a maximum of 6%), but excluding additional charges for riders.
Before investing in the Principal Variable Annuity, investors should carefully consider the investment objectives, risks, chargesand expenses of the contract. This and other information is contained in the free prospectus, which can be obtained fromyour local representative. Please read the prospectus carefully before investing.
RF 658-13 2/11/05 4:34 PM Page 29
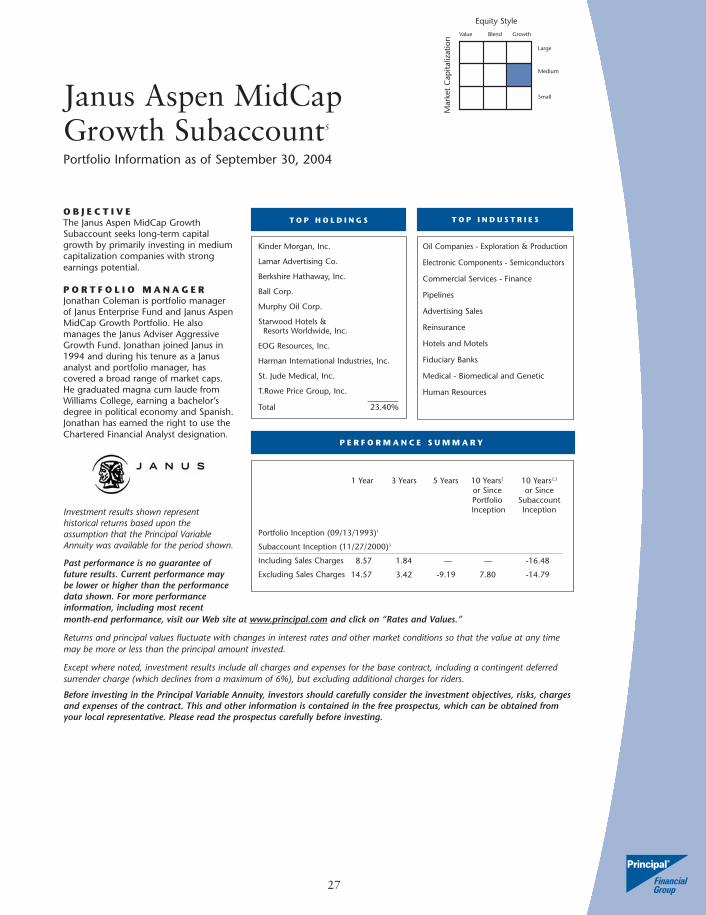
O B J E C T I V EThe Janus Aspen MidCap GrowthSubaccount seeks long-term capitalgrowth by primarily investing in mediumcapitalization companies with strongearnings potential.
P O R T F O L I O M A N A G E RJonathan Coleman is portfolio managerof Janus Enterprise Fund and Janus AspenMidCap Growth Portfolio. He alsomanages the Janus Adviser AggressiveGrowth Fund. Jonathan joined Janus in1994 and during his tenure as a Janusanalyst and portfolio manager, hascovered a broad range of market caps.He graduated magna cum laude fromWilliams College, earning a bachelor’sdegree in political economy and Spanish.Jonathan has earned the right to use theChartered Financial Analyst designation.
Investment results shown representhistorical returns based upon theassumption that the Principal VariableAnnuity was available for the period shown.
Past performance is no guarantee offuture results. Current performance maybe lower or higher than the performancedata shown. For more performanceinformation, including most recent
27
Janus Aspen MidCapGrowth Subaccount5
Portfolio Information as of September 30, 2004
T O P H O L D I N G S T O P I N D U S T R I E S
P E R F O R M A N C E S U M M A R Y
1 Year 3 Years 5 Years 10 Years2 10 Years2,3
or Since or Since Portfolio SubaccountInception Inception
Portfolio Inception (09/13/1993)1
Subaccount Inception (11/27/2000)3
Including Sales Charges
Excluding Sales Charges
8.57 1.84 — — -16.48
14.57 3.42 -9.19 7.80 -14.79
Mar
ket
Cap
italiz
atio
n
Large
Medium
Small
Value Blend Growth
Equity Style
month-end performance, visit our Web site at www.principal.com and click on “Rates and Values.”
Returns and principal values fluctuate with changes in interest rates and other market conditions so that the value at any timemay be more or less than the principal amount invested.
Except where noted, investment results include all charges and expenses for the base contract, including a contingent deferredsurrender charge (which declines from a maximum of 6%), but excluding additional charges for riders.
Before investing in the Principal Variable Annuity, investors should carefully consider the investment objectives, risks, chargesand expenses of the contract. This and other information is contained in the free prospectus, which can be obtained fromyour local representative. Please read the prospectus carefully before investing.
Kinder Morgan, Inc.
Lamar Advertising Co.
Berkshire Hathaway, Inc.
Ball Corp.
Murphy Oil Corp.
Starwood Hotels & Resorts Worldwide, Inc.
EOG Resources, Inc.
Harman International Industries, Inc.
St. Jude Medical, Inc.
T.Rowe Price Group, Inc.
Total 23.40%
Oil Companies - Exploration & Production
Electronic Components - Semiconductors
Commercial Services - Finance
Pipelines
Advertising Sales
Reinsurance
Hotels and Motels
Fiduciary Banks
Medical - Biomedical and Genetic
Human Resources
RF 658-13 2/11/05 4:34 PM Page 30

Investment results shown represent historical returns based upon the assumption that the Principal Variable Annuity was availablefor the period shown.
Past performance is no guarantee of future results. Current performance may be lower or higher than the performance datashown. For more performance information, including most recent month-end performance, visit our Web site atwww.principal.com and click on “Rates and Values.”
Returns and principal values fluctuate with changes in interest rates and other market conditions so that the value at any timemay be more or less than the principal amount invested.
Except where noted, investment results include all charges and expenses for the base contract, including a contingent deferredsurrender charge (which declines from a maximum of 6%), but excluding additional charges for riders.
Before investing in the Principal Variable Annuity, investors should carefully consider the investment objectives, risks, chargesand expenses of the contract. This and other information is contained in the free prospectus, which can be obtained fromyour local representative. Please read the prospectus carefully before investing.
O B J E C T I V EThe INVESCO VIF–Dynamics Subaccountseeks long-term capital growth byinvesting primarily in the common stocksof rapidly growing mid-sized companies.
P O R T F O L I O M A N A G E R SPaul J. Rasplicka, CFA, is senior vicepresident and senior portfolio manager at AIM Capital Management, Inc. Mr.Rasplicka joined AIM in 1998. Prior tojoining AIM, he was with INVESCO TrustCompany and was responsible formanagement of small-capitalizationgrowth separate account portfolios.
Michael Chapman is vice president andportfolio manager with AIM CapitalManagement Inc. Mr. Chapman beganhis investment career in 1995 as ananalyst and then portfolio manager withU.S. Global Investors, Inc. He joined AIMin 2001.
Brent Lium, CFA, is an equity analyst withAIM Capital Management, Inc. Mr. Liumjoined AMVESCAP in 1999 in itscorporate associate rotation program,working with fund managers throughoutAMVESCAP before joining AIM in 2003.
Warren Tennant, CFA, is a senior analystwith AIM Capital Management, Inc. Priorto joining AIM in 2000, Mr. Tennantworked for Exxon as a domestic internalauditor from 1993 to 1995 and as thelead auditor for Latin American from1995 to 1998.
28
INVESCO VIF-DynamicsSubaccount6
Portfolio Information as of September 30, 2004
T O P H O L D I N G S T O P I N D U S T R I E S
P E R F O R M A N C E S U M M A R Y
®�
1 Year 3 Years 5 Years 10 Years2 10 Years2,3
or Since or Since Portfolio SubaccountInception Inception
Portfolio Inception (08/25/1997)1
Subaccount Inception (05/21/2001)3
Including Sales Charges
Excluding Sales Charges
5.92 3.73 — — -12.01
11.92 5.26 -4.93 1.23 -10.44
Mar
ket
Cap
italiz
atio
n
Large
Medium
Small
Value Blend Growth
Equity Style
Republic Services Inc. 1.68%
Polo Ralph Lauren Corp. 1.66%
Smith International 1.64%
Manpower Inc. 1.62%
Shire Pharmaceuticals ADR 1.58%
DST Systems Inc. 1.52%
Eaton Corp. 1.51%
Versign Inc. 1.51%
Hilton Hotels Corp. 1.45%
Talisman Energy Inc. 1.40%
Total 15.57%
Asset Management & Custody Banks
Data Processing & Outsourced Svcs
Hotels
Communication Equipment
Pharmaceuticals
Application Software
Broadcasting & Cable TV
Oil & Gas Equipment & Svcs
Construction & Farm Machinery
Apparel & Accessories
RF 658-13 2/11/05 4:35 PM Page 31

29
Real Estate Securities SubaccountPortfolio Information as of September 30, 2004
O B J E C T I V EThe Real Estate Securities Subaccountseeks to generate total return byinvesting primarily in equity securities ofcompanies principally engaged in thereal estate industry.
P O R T F O L I O M A N A G E RKelly D. Rush, CFA, directs the Real EstateInvestment Trusts (REITs) activity withexperience in both separate account andpooled fund management. He has beenwith the commercial real estateinvestment division of The Principal since1987. Kelly received an MBA and a BA in finance from the University of Iowa. He is a member of the Iowa Society ofFinancial Analysts and the Association forInvestment Management and Research(AIMR). He is an associate member ofthe National Association of Real EstateInvestment Trusts (NAREIT).
This Subaccount is subject to risks inherentin real estate and Real Estate InvestmentTrusts that are associated with general andlocal economic conditions.
Investment results shown representhistorical returns based upon theassumption that the Principal Variable
T O P H O L D I N G S T O P I N D U S T R I E S
P E R F O R M A N C E S U M M A R Y
Boston Properties 6.36%
Simon Property Group 5.17%
Kimco Realty 4.56%
Household Finance 4.46%
Starwood Hotels & Resorts Worldwide 4.14%
Brookfield Properties 4.06%
Developers Diversified Realty 3.97%
Prologis 3.72%
Centerpoint Properties 3.44%
Vornado Realty Trust 3.28%
Total 43.16%
Office & Industrial 24.6%
Retail-Malls 16.2%
Residential-Apartments 14.6%
Retail-Centers 13.3%
Diversified 10.0%
Lodging-Hotels 6.3%
Retail-Outlets 3.7%
Healthcare 3.2%
Storage 3.2%
1 Year 3 Years 5 Years 10 Years2 10 Years2,3
or Since or Since Portfolio SubaccountInception Inception
Portfolio Inception (05/01/1998)1
Subaccount Inception (05/01/1998)3
Including Sales Charges
Excluding Sales Charges
18.50 18.22 17.66 11.39 11.39
24.50 19.40 17.97 11.39 11.39
Mar
ket
Cap
italiz
atio
n
Large
Medium
Small
Value Blend Growth
Equity Style
Annuity was available for the period shown.
Past performance is no guarantee of future results. Current performance may be lower or higher than the performance datashown. For more performance information, including most recent month-end performance, visit our Web site atwww.principal.com and click on “Rates and Values.”
Returns and principal values fluctuate with changes in interest rates and other market conditions so that the value at any timemay be more or less than the principal amount invested.
Except where noted, investment results include all charges and expenses for the base contract, including a contingent deferredsurrender charge (which declines from a maximum of 6%), but excluding additional charges for riders.
Before investing in the Principal Variable Annuity, investors should carefully consider the investment objectives, risks, chargesand expenses of the contract. This and other information is contained in the free prospectus, which can be obtained fromyour local representative. Please read the prospectus carefully before investing.
RF 658-13 2/11/05 4:35 PM Page 32
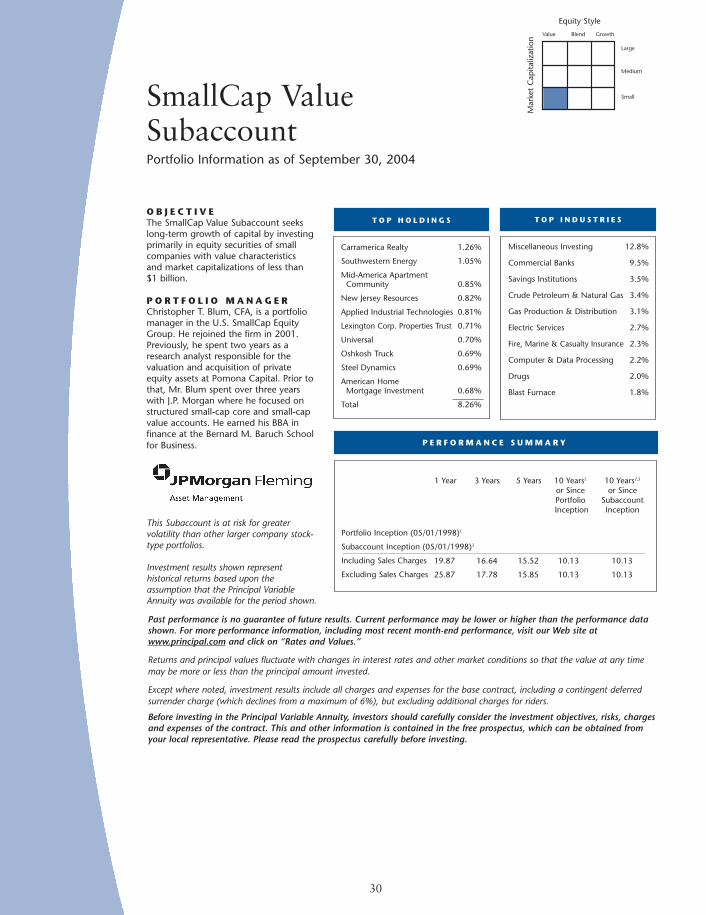
O B J E C T I V EThe SmallCap Value Subaccount seekslong-term growth of capital by investingprimarily in equity securities of smallcompanies with value characteristics and market capitalizations of less than $1 billion.
P O R T F O L I O M A N A G E RChristopher T. Blum, CFA, is a portfoliomanager in the U.S. SmallCap EquityGroup. He rejoined the firm in 2001.Previously, he spent two years as aresearch analyst responsible for thevaluation and acquisition of privateequity assets at Pomona Capital. Prior tothat, Mr. Blum spent over three yearswith J.P. Morgan where he focused onstructured small-cap core and small-capvalue accounts. He earned his BBA infinance at the Bernard M. Baruch Schoolfor Business.
This Subaccount is at risk for greatervolatility than other larger company stock-type portfolios.
Investment results shown representhistorical returns based upon theassumption that the Principal VariableAnnuity was available for the period shown.
T O P H O L D I N G S T O P I N D U S T R I E S
P E R F O R M A N C E S U M M A R Y
30
SmallCap ValueSubaccountPortfolio Information as of September 30, 2004
1 Year 3 Years 5 Years 10 Years2 10 Years2,3
or Since or Since Portfolio SubaccountInception Inception
Portfolio Inception (05/01/1998)1
Subaccount Inception (05/01/1998)3
Including Sales Charges
Excluding Sales Charges
19.87 16.64 15.52 10.13 10.13
25.87 17.78 15.85 10.13 10.13
Miscellaneous Investing 12.8%
Commercial Banks 9.5%
Savings Institutions 3.5%
Crude Petroleum & Natural Gas 3.4%
Gas Production & Distribution 3.1%
Electric Services 2.7%
Fire, Marine & Casualty Insurance 2.3%
Computer & Data Processing 2.2%
Drugs 2.0%
Blast Furnace 1.8%
Carramerica Realty 1.26%
Southwestern Energy 1.05%
Mid-America Apartment Community 0.85%
New Jersey Resources 0.82%
Applied Industrial Technologies 0.81%
Lexington Corp. Properties Trust 0.71%
Universal 0.70%
Oshkosh Truck 0.69%
Steel Dynamics 0.69%
American Home Mortgage Investment 0.68%
Total 8.26%
Mar
ket
Cap
italiz
atio
n
Large
Medium
Small
Value Blend Growth
Equity Style
Past performance is no guarantee of future results. Current performance may be lower or higher than the performance datashown. For more performance information, including most recent month-end performance, visit our Web site atwww.principal.com and click on “Rates and Values.”
Returns and principal values fluctuate with changes in interest rates and other market conditions so that the value at any timemay be more or less than the principal amount invested.
Except where noted, investment results include all charges and expenses for the base contract, including a contingent deferredsurrender charge (which declines from a maximum of 6%), but excluding additional charges for riders.
Before investing in the Principal Variable Annuity, investors should carefully consider the investment objectives, risks, chargesand expenses of the contract. This and other information is contained in the free prospectus, which can be obtained fromyour local representative. Please read the prospectus carefully before investing.
RF 658-13 2/11/05 4:35 PM Page 33

1 Year 3 Years 5 Years 10 Years2 10 Years2,3
or Since or Since Portfolio SubaccountInception Inception
Portfolio Inception (05/01/1998)1
Subaccount Inception (05/01/1998)3
Including Sales Charges
Excluding Sales Charges
31
SmallCap SubaccountPortfolio Information as of September 30, 2004
O B J E C T I V EThe SmallCap Subaccount seeks toprovide long-term growth of capital byinvesting primarily in equity securities ofboth growth and value orientedcompanies with comparatively smallermarket capitalizations.
P O R T F O L I O M A N A G E RTodd Sanders, CFA, is an equity analystfor Principal Global Investors focused on quantitative research. He joined thefirm in 1998. Previously, Todd was aninvestment analyst for NISA InvestmentAdvisors and in credit analysis/riskmanagement with the U.S. CentralCredit Union. He received an MBA infinance from Washington University anda bachelor’s degree in finance/economicsfrom the University of Missouri-Columbia.He is a member of the InternationalAssociation of Financial Engineers (IAFE),the Global Association of RiskProfessionals (GARP) and the Association of Investment Managementand Research (AIMR).
This Subaccount is at risk for greatervolatility than other larger company stock-type portfolios
T O P H O L D I N G S T O P I N D U S T R I E S
P E R F O R M A N C E S U M M A R Y
iShares Russell 2000 Index 2.95%
Terex 1.91%
Comtech Telecommunications 1.60%
Watsco 1.49%
Columbia Banking System 1.47%
Benchmark Electronics 1.47%
Unit 1.46%
Eagle Materials 1.41%
Entertainment Properties Trust 1.40%
PS Business Parks 1.40%
Total 16.56%
Miscellaneous Investing 7.9%
Computer & Data Processing 7.4%
Commercial Banks 5.8%
Electronic Components & Accessories 5.5%
Crude Petroleum & Natural Gas 5.1%
Non-classifiable Establishments 4.3%
Medical Instruments & Supplies 2.8%
Research & Testing Services 2.8%
Drugs 2.4%
Personnel Supply Services 2.2%
10.69 6.42 0.98 -0.21 -0.21
16.69 7.87 1.55 -0.21 -0.21
Mar
ket
Cap
italiz
atio
n
Large
Medium
Small
Value Blend Growth
Equity Style
Investment results shown represent historical returns based upon the assumption that the Principal Variable Annuity was available for the period shown.
Past performance is no guarantee of future results. Current performance may be lower or higher than the performance datashown. For more performance information, including most recent month-end performance, visit our Web site atwww.principal.com and click on “Rates and Values.”
Returns and principal values fluctuate with changes in interest rates and other market conditions so that the value at any timemay be more or less than the principal amount invested.
Except where noted, investment results include all charges and expenses for the base contract, including a contingent deferredsurrender charge (which declines from a maximum of 6%), but excluding additional charges for riders.
Before investing in the Principal Variable Annuity, investors should carefully consider the investment objectives, risks, chargesand expenses of the contract. This and other information is contained in the free prospectus, which can be obtained fromyour local representative. Please read the prospectus carefully before investing.
RF 658-13 2/11/05 4:35 PM Page 34
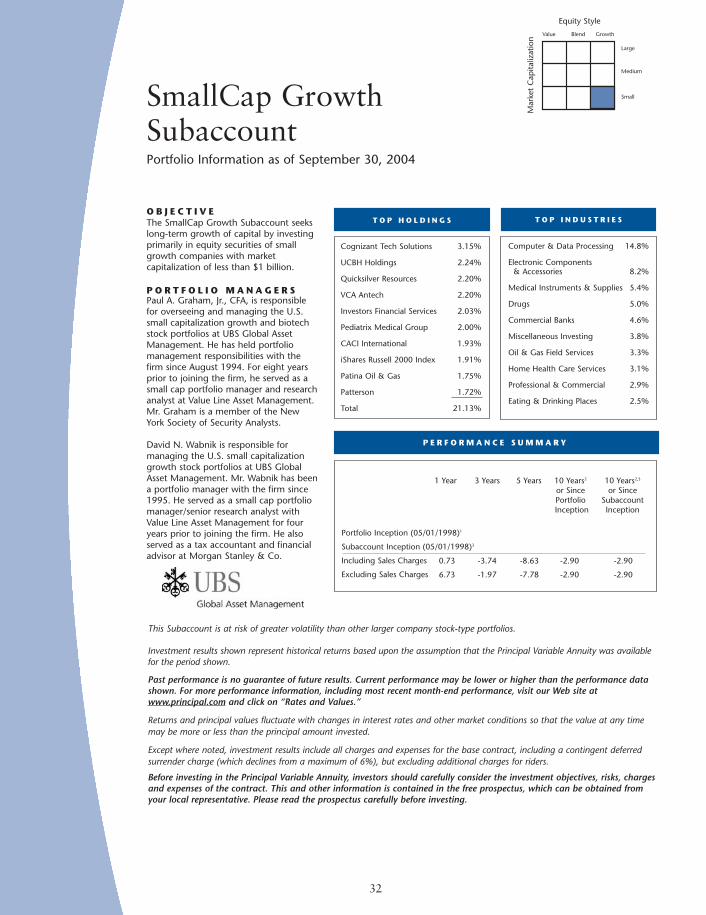
32
SmallCap GrowthSubaccountPortfolio Information as of September 30, 2004
T O P H O L D I N G S T O P I N D U S T R I E S
P E R F O R M A N C E S U M M A R Y
Cognizant Tech Solutions 3.15%
UCBH Holdings 2.24%
Quicksilver Resources 2.20%
VCA Antech 2.20%
Investors Financial Services 2.03%
Pediatrix Medical Group 2.00%
CACI International 1.93%
iShares Russell 2000 Index 1.91%
Patina Oil & Gas 1.75%
Patterson 1.72%
Total 21.13%
Computer & Data Processing 14.8%
Electronic Components & Accessories 8.2%
Medical Instruments & Supplies 5.4%
Drugs 5.0%
Commercial Banks 4.6%
Miscellaneous Investing 3.8%
Oil & Gas Field Services 3.3%
Home Health Care Services 3.1%
Professional & Commercial 2.9%
Eating & Drinking Places 2.5%
1 Year 3 Years 5 Years 10 Years2 10 Years2,3
or Since or Since Portfolio SubaccountInception Inception
Portfolio Inception (05/01/1998)1
Subaccount Inception (05/01/1998)3
Including Sales Charges
Excluding Sales Charges
0.73 -3.74 -8.63 -2.90 -2.90
6.73 -1.97 -7.78 -2.90 -2.90
O B J E C T I V EThe SmallCap Growth Subaccount seekslong-term growth of capital by investingprimarily in equity securities of smallgrowth companies with marketcapitalization of less than $1 billion.
P O R T F O L I O M A N A G E R SPaul A. Graham, Jr., CFA, is responsiblefor overseeing and managing the U.S.small capitalization growth and biotechstock portfolios at UBS Global AssetManagement. He has held portfoliomanagement responsibilities with thefirm since August 1994. For eight yearsprior to joining the firm, he served as asmall cap portfolio manager and researchanalyst at Value Line Asset Management.Mr. Graham is a member of the NewYork Society of Security Analysts.
David N. Wabnik is responsible formanaging the U.S. small capitalizationgrowth stock portfolios at UBS GlobalAsset Management. Mr. Wabnik has beena portfolio manager with the firm since1995. He served as a small cap portfoliomanager/senior research analyst withValue Line Asset Management for fouryears prior to joining the firm. He alsoserved as a tax accountant and financialadvisor at Morgan Stanley & Co.
Mar
ket
Cap
italiz
atio
n
Large
Medium
Small
Value Blend Growth
Equity Style
This Subaccount is at risk of greater volatility than other larger company stock-type portfolios.
Investment results shown represent historical returns based upon the assumption that the Principal Variable Annuity was availablefor the period shown.
Past performance is no guarantee of future results. Current performance may be lower or higher than the performance datashown. For more performance information, including most recent month-end performance, visit our Web site atwww.principal.com and click on “Rates and Values.”
Returns and principal values fluctuate with changes in interest rates and other market conditions so that the value at any timemay be more or less than the principal amount invested.
Except where noted, investment results include all charges and expenses for the base contract, including a contingent deferredsurrender charge (which declines from a maximum of 6%), but excluding additional charges for riders.
Before investing in the Principal Variable Annuity, investors should carefully consider the investment objectives, risks, chargesand expenses of the contract. This and other information is contained in the free prospectus, which can be obtained fromyour local representative. Please read the prospectus carefully before investing.
RF 658-13 2/11/05 4:35 PM Page 35
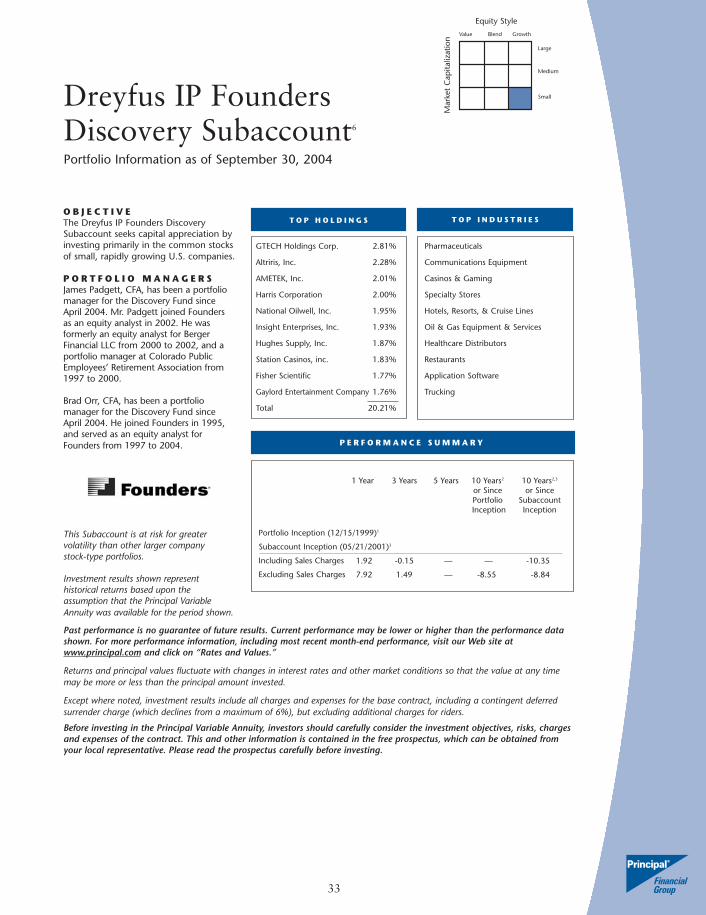
O B J E C T I V EThe Dreyfus IP Founders DiscoverySubaccount seeks capital appreciation byinvesting primarily in the common stocksof small, rapidly growing U.S. companies.
P O R T F O L I O M A N A G E R SJames Padgett, CFA, has been a portfoliomanager for the Discovery Fund sinceApril 2004. Mr. Padgett joined Foundersas an equity analyst in 2002. He wasformerly an equity analyst for BergerFinancial LLC from 2000 to 2002, and aportfolio manager at Colorado PublicEmployees’ Retirement Association from1997 to 2000.
Brad Orr, CFA, has been a portfoliomanager for the Discovery Fund sinceApril 2004. He joined Founders in 1995,and served as an equity analyst forFounders from 1997 to 2004.
This Subaccount is at risk for greatervolatility than other larger company stock-type portfolios.
Investment results shown representhistorical returns based upon theassumption that the Principal Variable
T O P H O L D I N G S T O P I N D U S T R I E S
P E R F O R M A N C E S U M M A R Y
Dreyfus IP Founders Discovery Subaccount6
Portfolio Information as of September 30, 2004
1 Year 3 Years 5 Years 10 Years2 10 Years2,3
or Since or Since Portfolio SubaccountInception Inception
Portfolio Inception (12/15/1999)1
Subaccount Inception (05/21/2001)3
Including Sales Charges
Excluding Sales Charges
1.92 -0.15 — — -10.35
7.92 1.49 — -8.55 -8.84
33
Mar
ket
Cap
italiz
atio
n
Large
Medium
Small
Value Blend Growth
Equity Style
Annuity was available for the period shown.
Past performance is no guarantee of future results. Current performance may be lower or higher than the performance datashown. For more performance information, including most recent month-end performance, visit our Web site atwww.principal.com and click on “Rates and Values.”
Returns and principal values fluctuate with changes in interest rates and other market conditions so that the value at any timemay be more or less than the principal amount invested.
Except where noted, investment results include all charges and expenses for the base contract, including a contingent deferredsurrender charge (which declines from a maximum of 6%), but excluding additional charges for riders.
Before investing in the Principal Variable Annuity, investors should carefully consider the investment objectives, risks, chargesand expenses of the contract. This and other information is contained in the free prospectus, which can be obtained fromyour local representative. Please read the prospectus carefully before investing.
GTECH Holdings Corp. 2.81%
Altriris, Inc. 2.28%
AMETEK, Inc. 2.01%
Harris Corporation 2.00%
National Oilwell, Inc. 1.95%
Insight Enterprises, Inc. 1.93%
Hughes Supply, Inc. 1.87%
Station Casinos, inc. 1.83%
Fisher Scientific 1.77%
Gaylord Entertainment Company 1.76%
Total 20.21%
Pharmaceuticals
Communications Equipment
Casinos & Gaming
Specialty Stores
Hotels, Resorts, & Cruise Lines
Oil & Gas Equipment & Services
Healthcare Distributors
Restaurants
Application Software
Trucking
RF 658-13 2/11/05 4:35 PM Page 36
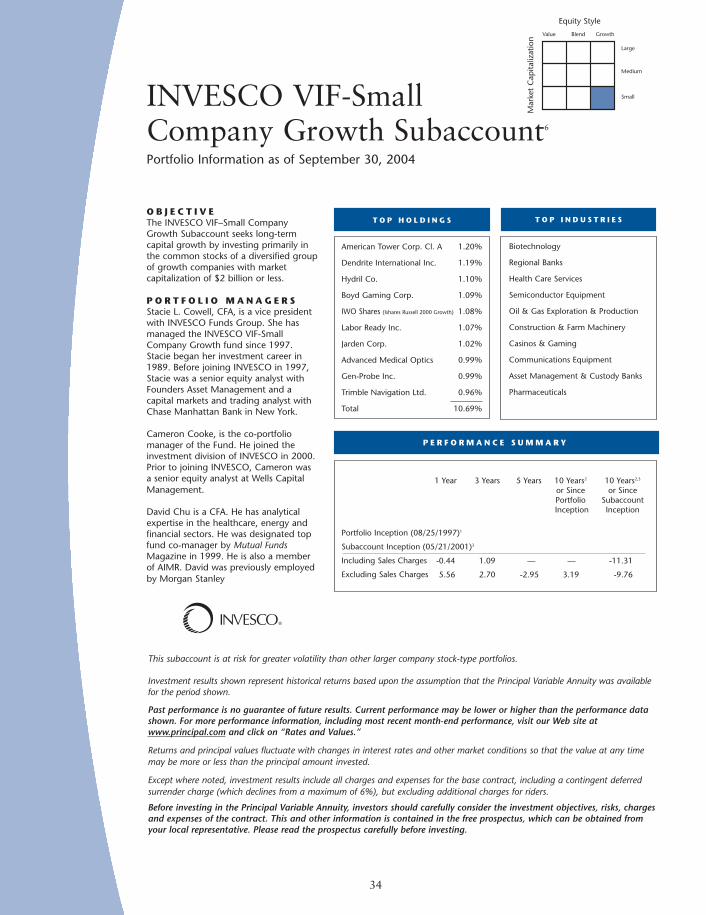
O B J E C T I V EThe INVESCO VIF–Small CompanyGrowth Subaccount seeks long-termcapital growth by investing primarily inthe common stocks of a diversified groupof growth companies with marketcapitalization of $2 billion or less.
P O R T F O L I O M A N A G E R SStacie L. Cowell, CFA, is a vice presidentwith INVESCO Funds Group. She hasmanaged the INVESCO VIF-SmallCompany Growth fund since 1997.Stacie began her investment career in1989. Before joining INVESCO in 1997,Stacie was a senior equity analyst withFounders Asset Management and acapital markets and trading analyst withChase Manhattan Bank in New York.
Cameron Cooke, is the co-portfoliomanager of the Fund. He joined theinvestment division of INVESCO in 2000.Prior to joining INVESCO, Cameron wasa senior equity analyst at Wells CapitalManagement.
David Chu is a CFA. He has analyticalexpertise in the healthcare, energy andfinancial sectors. He was designated topfund co-manager by Mutual FundsMagazine in 1999. He is also a memberof AIMR. David was previously employedby Morgan Stanley
34
INVESCO VIF-Small Company Growth Subaccount6
Portfolio Information as of September 30, 2004
T O P H O L D I N G S T O P I N D U S T R I E S
P E R F O R M A N C E S U M M A R Y
®�
1 Year 3 Years 5 Years 10 Years2 10 Years2,3
or Since or Since Portfolio SubaccountInception Inception
Portfolio Inception (08/25/1997)1
Subaccount Inception (05/21/2001)3
Including Sales Charges
Excluding Sales Charges
-0.44 1.09 — — -11.31
5.56 2.70 -2.95 3.19 -9.76
Mar
ket
Cap
italiz
atio
n
Large
Medium
Small
Value Blend Growth
Equity Style
This subaccount is at risk for greater volatility than other larger company stock-type portfolios.
Investment results shown represent historical returns based upon the assumption that the Principal Variable Annuity was availablefor the period shown.
Past performance is no guarantee of future results. Current performance may be lower or higher than the performance datashown. For more performance information, including most recent month-end performance, visit our Web site atwww.principal.com and click on “Rates and Values.”
Returns and principal values fluctuate with changes in interest rates and other market conditions so that the value at any timemay be more or less than the principal amount invested.
Except where noted, investment results include all charges and expenses for the base contract, including a contingent deferredsurrender charge (which declines from a maximum of 6%), but excluding additional charges for riders.
Before investing in the Principal Variable Annuity, investors should carefully consider the investment objectives, risks, chargesand expenses of the contract. This and other information is contained in the free prospectus, which can be obtained fromyour local representative. Please read the prospectus carefully before investing.
American Tower Corp. Cl. A 1.20%
Dendrite International Inc. 1.19%
Hydril Co. 1.10%
Boyd Gaming Corp. 1.09%
IWO Shares (Ishares Russell 2000 Growth) 1.08%
Labor Ready Inc. 1.07%
Jarden Corp. 1.02%
Advanced Medical Optics 0.99%
Gen-Probe Inc. 0.99%
Trimble Navigation Ltd. 0.96%
Total 10.69%
Biotechnology
Regional Banks
Health Care Services
Semiconductor Equipment
Oil & Gas Exploration & Production
Construction & Farm Machinery
Casinos & Gaming
Communications Equipment
Asset Management & Custody Banks
Pharmaceuticals
RF 658-13 2/11/05 4:35 PM Page 37

O B J E C T I V EThe INVESCO VIF–Health SciencesSubaccount seeks long-term capitalgrowth by primarily investing in stocks ofstrongly managed, innovative health carecompanies, blending well-establishedfirms with faster-growing, more dynamichealth care businesses.
P O R T F O L I O M A N A G E RThomas R. Wald, CFA, is a vice presidentwith INVESCO Funds Group. He hasmanaged the INVESCO VIF-HealthSciences fund since November 2000.Tom began his investment career in1988. Before joining INVESCO in 1997,Tom was an analyst with Munder CapitalManagement, Duff & Phelps andPrudential Investment Corp. Tom earneda bachelor’s degree at Tulane Universityand an MBA at the University ofPennsylvania.
An investment in this Subaccount is subjectto value fluctuations directly related to thecondition or performance of the companiesthat make up the market segmentrepresented and offer less diversificationthan subaccounts that include investmentin companies from across several marketsegments.
T O P H O L D I N G S T O P I N D U S T R I E S
P E R F O R M A N C E S U M M A R Y
®�
35
INVESCO VIF-HealthSciences Subaccount7
Portfolio Information as of September 30, 2004
1 Year 3 Years 5 Years 10 Years2 10 Years2,3
or Since or Since Portfolio SubaccountInception Inception
Portfolio Inception (05/22/1997)1
Subaccount Inception (05/21/2001)3
Including Sales Charges
Excluding Sales Charges
3.15 -2.54 — — -4.60
9.15 -0.81 3.26 6.99 -3.30
Mar
ket
Cap
italiz
atio
n
Large
Medium
Small
Value Blend Growth
Equity Style
Investment results shown represent historical returns based upon the assumption that the Principal Variable Annuity was availablefor the period shown.
Past performance is no guarantee of future results. Current performance may be lower or higher than the performance datashown. For more performance information, including most recent month-end performance, visit our Web site atwww.principal.com and click on “Rates and Values.”
Returns and principal values fluctuate with changes in interest rates and other market conditions so that the value at any timemay be more or less than the principal amount invested.
Except where noted, investment results include all charges and expenses for the base contract, including a contingent deferredsurrender charge (which declines from a maximum of 6%), but excluding additional charges for riders.
Before investing in the Principal Variable Annuity, investors should carefully consider the investment objectives, risks, chargesand expenses of the contract. This and other information is contained in the free prospectus, which can be obtained fromyour local representative. Please read the prospectus carefully before investing.
Johnson & Johnson 4.97%
Novartis AG-ADR 4.59%
Procter & Gamble Co. 4.42%
Pfizer Inc. 4.29%
Abbott Laboratories 4.26%
Schering-Plough Corp. 3.57%
Guidant Corp. 3.55%
St Jude Medical Inc. 3.42%
Glaxosmithkline Plc. Adr. 3.37%
Boston Scientific Corp. 3.32%
Total 39.76%
Pharmaceuticals
Health Care Equipment
Managed Health Care
Biotechnology
Household Products
Drug Retail
Health Care Services
Health Care Supplies
RF 658-13 2/11/05 4:35 PM Page 38

O B J E C T I V EThe INVESCO VIF–TechnologySubaccount seeks long-term capitalgrowth by investing primarily in thecommon stocks of hardware, softwareand technology-related companies.
P O R T F O L I O M A N A G E RWilliam R. Keithler, CFA, is a senior vicepresident and director of SectorManagement, INVESCO Funds Group.Bill has managed the INVESCO VIF-Technology fund since January 1999.He began his investment career in 1982.Before rejoining INVESCO in 1998, Billwas a portfolio manager with BergerAssociates, Inc. Bill holds a bachelor’sdegree from Webster College and an MSfrom the University of Wisconsin-Madison.
An investment in this Subaccount is subjectto value fluctuations directly related to thecondition or performance of the companiesthat make up the market segmentrepresented, and offer less diversificationthan subaccounts that include investmentin companies from across several marketsegments.
Investment results shown represent
T O P H O L D I N G S T O P I N D U S T R I E S
P E R F O R M A N C E S U M M A R Y
®�
36
INVESCO VIF-TechnologySubaccount6
Portfolio Information as of September 30, 2004
1 Year 3 Years 5 Years 10 Years2 10 Years2,3
or Since or Since Portfolio SubaccountInception Inception
Portfolio Inception (05/21/1997)1
Subaccount Inception (05/21/2001)3
Including Sales Charges
Excluding Sales Charges
-5.91 -4.35 — — -23.68
0.09 -2.56 -14.76 -0.24 -21.51
Mar
ket
Cap
italiz
atio
n
Large
Medium
Small
Value Blend Growth
Equity Style
historical returns based upon the assumption that the Principal Variable Annuity was available for the period shown.
Past performance is no guarantee of future results. Current performance may be lower or higher than the performance datashown. For more performance information, including most recent month-end performance, visit our Web site atwww.principal.com and click on “Rates and Values.”
Returns and principal values fluctuate with changes in interest rates and other market conditions so that the value at any timemay be more or less than the principal amount invested.
Except where noted, investment results include all charges and expenses for the base contract, including a contingent deferredsurrender charge (which declines from a maximum of 6%), but excluding additional charges for riders.
Before investing in the Principal Variable Annuity, investors should carefully consider the investment objectives, risks, chargesand expenses of the contract. This and other information is contained in the free prospectus, which can be obtained fromyour local representative. Please read the prospectus carefully before investing.
Yahoo! Inc. 4.74%
Microsoft Corp. 3.45%
Cisco Systems Inc. 2.84%
Symantec Corp. 2.70%
Apple Computer Inc. 2.42%
Dell Inc. 2.23%
EBay Inc. 2.04%
Texas Instruments Inc. 1.92%
Motorola Inc. 1.86%
Time Warner Inc. 1.85%
Total 26.05%
Semiconductors
Communications Equipment
Systems Software
Internet Software & Svcs.
Computer Hardware
Application Software
Computer Storage & Peripherals
Integrated Telecom Svcs.
Data Processing & Outsourced Services
Wireless Telecom Svcs.
RF 658-13 2/11/05 4:35 PM Page 39

37
International SubaccountPortfolio Information as of September 30, 2004
O B J E C T I V EThe International SmallCap Subaccountseeks to achieve long-term growth ofcapital by investing in a portfolio ofequity securities of companies domiciledin any of the nations of the world.
P O R T F O L I O M A N A G E R SPaul H. Blankenhagen, CFA, is a portfoliomanager at Principal Global Investors. He is responsible for developing portfoliostrategy and leading the ongoingmanagement of core international equityportfolios, including developed marketsportfolios and broad market portfolios.Paul is also active in research with anemphasis on the banking and mediaindustries. He joined the firm in 1992and has been a member of theinternational equity team since 1995.Paul was named a portfolio manager in 2000.
Juliet Cohn is a portfoliio manager atPrincipal Global Investors. Ms. Cohn hasbeen with Principal Global Investors since2003, serving as a portfolio manager forthe Dublin domiciled European equityfund. Prior to joining Principal GlobalInvestors, she served as a director andsenior portfolio manager at AllianzDresdner Asset Management. She earneda degree in mathematics from TrinityCollege in England
T O P H O L D I N G S T O P I N D U S T R I E S
P E R F O R M A N C E S U M M A R Y
Total 1.95%
Stanley Works 1.87%
Toyota Motor 1.52%
BNP Paribas 1.42%
BP 1.19%
Continental 1.18%
Ericsson LM 1.18%
Canon 1.14%
ENI 1.08%
BBVA 1.07%
Total 13.60%
Commercial Banks 10.7%
Crude Petroleum & Natural Gas 6.3%
Telephone Communication 4.3%
Drugs 4.1%
Foreign Banks & Branches 3.8%
Motor Vehicles & Equipment 3.6%
Oil & Gas Field Services 3.1%
Life Insurance 3.0%
Communications Equipment 2.9%
Department Stores 2.2%
1 Year 3 Years 5 Years 10 Years2 10 Years2,3
or Since or Since Portfolio SubaccountInception Inception
Portfolio Inception (05/02/1994)1
Subaccount Inception (05/02/1994)3
Including Sales Charges
Excluding Sales Charges
15.01 5.39 -3.25 4.05 4.05
21.01 6.87 -2.57 4.05 4.05
Mar
ket
Cap
italiz
atio
n
Large
Medium
Small
Value Blend Growth
Equity Style
Investments in the International Subaccount are subject to special risks due to currency exchange rates and foreign taxation,economic and political environments, and differences in auditing and financial standards.
Investment results shown represent historical returns based upon the assumption that the Principal Variable Annuity was availablefor the period shown.
Past performance is no guarantee of future results. Current performance may be lower or higher than the performance datashown. For more performance information, including most recent month-end performance, visit our Web site atwww.principal.com and click on “Rates and Values.”
Returns and principal values fluctuate with changes in interest rates and other market conditions so that the value at any timemay be more or less than the principal amount invested.
Except where noted, investment results include all charges and expenses for the base contract, including a contingent deferredsurrender charge (which declines from a maximum of 6%), but excluding additional charges for riders.
Before investing in the Principal Variable Annuity, investors should carefully consider the investment objectives, risks, chargesand expenses of the contract. This and other information is contained in the free prospectus, which can be obtained fromyour local representative. Please read the prospectus carefully before investing.
RF 658-13 2/11/05 4:35 PM Page 40
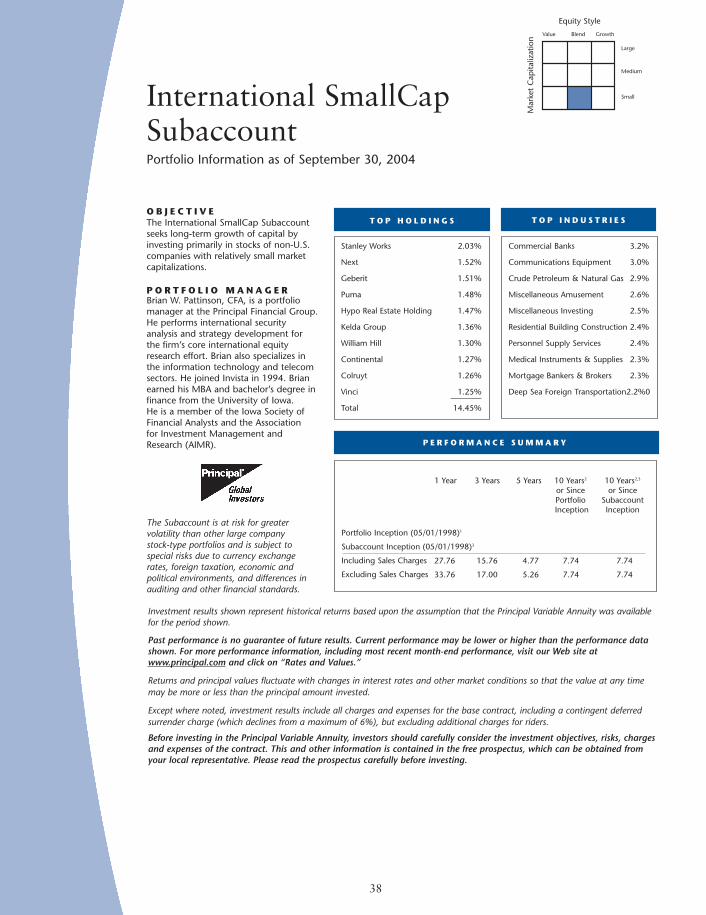
38
International SmallCap SubaccountPortfolio Information as of September 30, 2004
O B J E C T I V EThe International SmallCap Subaccountseeks long-term growth of capital byinvesting primarily in stocks of non-U.S.companies with relatively small marketcapitalizations.
P O R T F O L I O M A N A G E RBrian W. Pattinson, CFA, is a portfoliomanager at the Principal Financial Group.He performs international securityanalysis and strategy development forthe firm’s core international equityresearch effort. Brian also specializes inthe information technology and telecomsectors. He joined Invista in 1994. Brianearned his MBA and bachelor’s degree in finance from the University of Iowa. He is a member of the Iowa Society ofFinancial Analysts and the Association for Investment Management andResearch (AIMR).
The Subaccount is at risk for greatervolatility than other large company stock-type portfolios and is subject tospecial risks due to currency exchangerates, foreign taxation, economic andpolitical environments, and differences inauditing and other financial standards.
T O P H O L D I N G S T O P I N D U S T R I E S
P E R F O R M A N C E S U M M A R Y
Stanley Works 2.03%
Next 1.52%
Geberit 1.51%
Puma 1.48%
Hypo Real Estate Holding 1.47%
Kelda Group 1.36%
William Hill 1.30%
Continental 1.27%
Colruyt 1.26%
Vinci 1.25%
Total 14.45%
Commercial Banks 3.2%
Communications Equipment 3.0%
Crude Petroleum & Natural Gas 2.9%
Miscellaneous Amusement 2.6%
Miscellaneous Investing 2.5%
Residential Building Construction 2.4%
Personnel Supply Services 2.4%
Medical Instruments & Supplies 2.3%
Mortgage Bankers & Brokers 2.3%
Deep Sea Foreign Transportation2.2%0
1 Year 3 Years 5 Years 10 Years2 10 Years2,3
or Since or Since Portfolio SubaccountInception Inception
Portfolio Inception (05/01/1998)1
Subaccount Inception (05/01/1998)3
Including Sales Charges
Excluding Sales Charges
27.76 15.76 4.77 7.74 7.74
33.76 17.00 5.26 7.74 7.74
Mar
ket
Cap
italiz
atio
n
Large
Medium
Small
Value Blend Growth
Equity Style
Investment results shown represent historical returns based upon the assumption that the Principal Variable Annuity was availablefor the period shown.
Past performance is no guarantee of future results. Current performance may be lower or higher than the performance datashown. For more performance information, including most recent month-end performance, visit our Web site atwww.principal.com and click on “Rates and Values.”
Returns and principal values fluctuate with changes in interest rates and other market conditions so that the value at any timemay be more or less than the principal amount invested.
Except where noted, investment results include all charges and expenses for the base contract, including a contingent deferredsurrender charge (which declines from a maximum of 6%), but excluding additional charges for riders.
Before investing in the Principal Variable Annuity, investors should carefully consider the investment objectives, risks, chargesand expenses of the contract. This and other information is contained in the free prospectus, which can be obtained fromyour local representative. Please read the prospectus carefully before investing.
RF 658-13 2/11/05 4:35 PM Page 41

39
International Emerging Markets SubaccountPortfolio Information as of September 30, 2004
O B J E C T I V EThe International Emerging MarketsSubaccount seeks to achieve long-termgrowth of capital by investing primarilyin equity securities of issuers in emergingmarkets countries.
P O R T F O L I O M A N A G E R SMichael A. Marusiak specializes inemerging markets equity portfolios. Prior to joining the Principal FinancialGroup in early 2000, he was an analystat Trust Company of the West’s globalfund management team. He holds anMBA in international finance fromColumbia University and a BBA inbusiness administration and economicsfrom Simon Fraser University of Burnaby.
Michael Reynal specializes in theinternational emerging markets sector. Prior to joining The Principal in early 2001, he was responsible forequity investments in Latin America, the Mediterranean and the Balkans atWafra Investment Advisory Group, Inc.He received an MBA from the Amos TuckSchool at Dartmouth College, a BA/MAin history from Christ’s College atCambridge University, and a BA in historyfrom Middlebury College.
T O P H O L D I N G S T O P I N D U S T R I E S
P E R F O R M A N C E S U M M A R Y
Samsung Electronics 5.44%
Anglo American 2.82%
America Telecom SA De CV 2.56%
Petroleo Brasileiro 2.30%
LUKOIL Holding 2.12%
Caemi Mineracao e Metal 1.83%
SK Telecom 1.74%
ABSA Group 1.67%
China Petroleum and Chemical 1.63%
Philippine Long Distance Telephone 1.55%
Total 23.66%
Telephone Communication 12.3%
Commercial Banks 11.9%
Electronic Components & Accessories 9.7%
Crude Petroleum & Natural Gas 9.1%
Blast Furnace 6.2%
Foreign Banks & Branches 3.3%
Metal Mining Services 2.9%
Petroleum Refining 2.7%
Gasoline Service Stations 2.3%
Iron Ores 1.9%
1 Year 3 Years 5 Years 10 Years2 10 Years2,3
or Since or Since Portfolio SubaccountInception Inception
Portfolio Inception (10/24/2000)1
Subaccount Inception (10/24/2000)3
Including Sales Charges
Excluding Sales Charges
16.18 21.54 — 5.90 5.90
22.18 22.66 — 6.74 6.74
Mar
ket
Cap
italiz
atio
n
Large
Medium
Small
Value Blend Growth
Equity Style
The Subaccount is at risk for greater volatility than other stock-type portfolios and is subject to special risks due to currencyexchange rates, foreign taxation, economic and political environments, and differences in auditing and other financial standards.
Investment results shown represent historical returns based upon the assumption that the Principal Variable Annuity was available for the period shown.
Past performance is no guarantee of future results. Current performance may be lower or higher than the performance datashown. For more performance information, including most recent month-end performance, visit our Web site atwww.principal.com and click on “Rates and Values.”
Returns and principal values fluctuate with changes in interest rates and other market conditions so that the value at any timemay be more or less than the principal amount invested.
Except where noted, investment results include all charges and expenses for the base contract, including a contingent deferredsurrender charge (which declines from a maximum of 6%), but excluding additional charges for riders.
Before investing in the Principal Variable Annuity, investors should carefully consider the investment objectives, risks, chargesand expenses of the contract. This and other information is contained in the free prospectus, which can be obtained fromyour local representative. Please read the prospectus carefully before investing.
RF 658-13 2/11/05 4:35 PM Page 42

RF 658-13 2/11/05 4:35 PM Page 43

RF 658-13 2/11/05 4:35 PM Page 44

1 Portfolio Inception Date is the date the underlying fund wasestablished.
2 If Inception Date is less than one year from the date of thesereturns, the performance is a cumulative return, not an annualreturn. Not all the investment advisors or variable subaccountslisted are available in every state.
3 Performance since each subaccount’s date of inclusion in theseparate account.
4 Because Service Class shares for the Fidelity VIP II Contrafund®
and Fidelity VIP Growth Subaccounts were not offered untilNovember 3, 1997, performance shown for periods prior tothat date represent the historical results of Initial Class sharesand do not include the effects of the Service Class' higherannual fees and expenses resulting from the .10% 12b-1 fee.Had Service Class shares' .10% 12b-1 fee been reflected,returns prior to November 3, 1997, would have been lower.
The initial offering of Service Class 2 shares for the Fidelity VIPEquity-Income Subaccount took place on January 12, 2000.Returns from November 3, 1997, to January 12, 2000, arethose of the Service Class which reflect a different 12b-1 fee.Service Class 2 returns prior to November 3, 1997, are those ofthe Initial Class, and do not include the effects of a 12b-1 fee.Had Service Class 2 shares' .25% 12b-1 fee been reflected,returns prior to January 12, 2000, would have been lower.
5 Service Shares of the Janus Aspen Series were first offered onDecember 31, 1999. Performance shown for periods prior toDecember 31, 1999, reflect performance of a different class ofshares (the Institutional Shares) restated based on the Service
Shares’ estimated fees and expenses including the Service Shares’.25% 12b-1 fee and ignoring any fee and expense limitations.
6 V.I., VIP, VIP II, VP, VIF and DIP refer to Variable Insurance,Variable Insurance Products, Variable Insurance Products II,Variable Portfolios, Variable Insurance Fund and DreyfusInvestment Portfolios.
7 The initial offering of Class II shares for the AmericanCentury VP Value Subaccount took place on August 14,2001. Returns prior to August 14, 2001, are those of theOriginal Class, and do not include the effects of Class IIshares' servicing and distribution expenses. Had Class IIshares' .40% servicing and distribution expenses beenreflected, returns prior to August 14, 2001, would have been.40% lower.
The initial offering of The Principal Variable Annuity was June 16, 1994. The separate account that funds the contract wasestablished on January 12, 1970. The investment results shownrepresent historical returns based upon the assumption that thePrincipal Variable Annuity was available for the periods shown.Past performance is no guarantee of future results. The returnand principal value of an investment in any of the subaccountswill fluctuate so that the value, when redeemed, may be worthmore or less than its original cost. Except where noted,investment results include all charges and expenses for the basecontract, including a contingent deferred surrender charge(which declines from a maximum of 6%), but excluding anyadditional charges for riders.
Fidelity and Fidelity Investments are registered trademarks of FMR Corp.
The Principal Variable Annuity is not FDIC insured, has no bank guarantee, and may lose value. The Principal Variable Annuity is issued by
Principal Life Insurance Company and distributed by Princor Financial Services Corporation, 800/247-4123, member SIPC.
Principal Life and Princor are members of the Principal Financial Group® (The Principal®), Des Moines, IA 50392.
Principal Life Insurance Company
Des Moines, Iowa 50392-0001
www.principal.com
W E U N D E R S T A N D W H A T Y O U ’ R E W O R K I N G F O R.®
RF 658-13 Contract # SF324/SF325 10/04118222007
RF 658-13 2/11/05 4:35 PM Page 1