prince george air quality management background report1997).pdf · prince george air quality...
TRANSCRIPT

Prince George Air Quality Management
Background Report
Prepared By: Prince George Airshed Technical Management Committee
Date: October 1, 1996
i
Committee Member Affiliation Gary Champagne City of Prince George, Public Works Department Bob Radloff City of Prince George, Environmental Services Peter Bloodoff City of Prince George, Development Services Derek Bates Regional District - Fraser-Fort George Terry McEachen Regional District - Fraser-Fort George Dave Sutherland Ministry of Environment, Lands and Parks Dennis Fudge Ministry of Environment, Lands and Parks Lorna Medd Ministry of Health, Northern Interior Health Unit Bruce Gaunt Ministry of Health, Northern Interior Health Unit Leslie King University of Northern B.C., Environmental Studies Peter Jackson University of Northern B.C., Environmental Studies Cliff Raphael College of New Caledonia, Geography Program In Memoriam Committee members deeply regret the passing of their colleague, Peter Bloodoff , on October 22, 1996. Peter represented the City of Prince George Development Services, and his contributions to the initiation of the airshed management process, and unflagging enthusiasm, will be sorely missed by his Committee colleagues. Comments and Information The Airshed Technical Management Committee welcomes written comments on this report. Submissions should be sent to:
Prince George Airshed Technical Management Committee c/o Dave Sutherland, Environmental Section Head Ministry of Environment, Lands and Parks 3rd Floor 1011 - 4th Ave. Prince George, B.C. V2L 3H9
Further information on air quality management and additional copies of this report can be obtained by calling Dave Sutherland at (250) 565-6465 or Dennis Fudge at (250) 565-4210.

ii
Table of Contents
Contents Page Executive Summary v 1.0 Introduction 1 2.0 The Air Quality Management Process 3 3.0 Status of Respiratory Health of Prince George Residents 3
3.1General Mortality Rates 3 3.2Respiratory Mortality Rates 4 3.3Mortality from Specific Respiratory Diseases 4 3.4Results of Earlier Health Studies 5 3.5Application of the Risk Management Approach 5 in Airshed Management
4.0 Air Quality and Contaminant Source Status 6 4.1Status of Individual Contaminants 6
4.1.1 Total Reduced Sulphur 6 4.1.2 Sulphur Dioxide 7 4.1.3 Fine Particulate Matter (PM10 and PM2.5) 7 4.1.4 Nitrogen Dioxide 8 4.1.5 Ozone 8 4.1.6 Formaldehyde and Other Volatile Organic Compounds 9
4.2Frequency and Causes of Episodes of Air Quality Objective 9 Exceedances
5.0 A Framework for Selecting Management Priorities 10
5.1Priority Contaminants 10 5.2Priority Sources 12
5.2.1 TRS Sources 13 5.2.2 PM10 Sources 13 5.2.3 SO2 14 5.2.4 NOx, O3 and VOC 15 5.2.5 Hazardous Air Pollutants and Other Contaminants 16
5.3Obtaining Public and Other Stakeholder Input 16 5.4Identifying Management Options 17
5.4.1 Source Management 17 5.4.2 Land Use Planning 18 5.4.3 Episode Management 19 5.4.4 Identifying Future Priorities (Monitoring and Research) 20
6.0 Interim Management Measures 20 6.1Implementation of the Beehive Burner Elimination Plans 20 6.2Reduction of Street Sanding Dust 21 6.3Monitoring and Research 21
Contents Page 6.4Funding 21

iii
7.0 The Next Steps 22 8.0 References 22 9.0 Appendices 24 Appendix A: Definitions 24
Appendix B: Report Tables Table 1: Location and Type of Ambient Air Quality and 27 Meteorological Monitors in Prince George Table 2: B.C. Ambient Air Quality Objectives 28 Table 3: Summary of SO2 Annual Average and Objective 29 Exceedance Trends at the Jail Stations (1981-1995) Table 4: Total Estimated Emissions in the Prince George 30 Airshed for 1995 and 2001 Table 5: Estimated Emissions from Industrial Permitted 31 Sources in Prince George for 1995 and 2001 Table 6: Estimated Emissions from Commercial, Residential 32 and Mobile Sources in Prince George for 1995 Table 7: Estimated Emissions from Sawmills in Prince 34 George for 1995 Appendix C: Report Figures Figure 1: Prince George Airshed (Not Including Surrounding 35 Communities) Figure 2: Comparison of Standardized Mortality Ratio for 36 Leading Causes of Death - B.C. and Northern Health Regions Figure 3: Overall Rank of Three Socioeconomic Variables 37 and Age Standardized Mortality - B.C. Health Regions Figure 4: Overall Ranking in Death from Respiratory Disease, 38 by Health Region Figure 5: Comparison of Main Causes of Respiratory Mortality 39 to Standard Mortality Ratio Figure 6: Exposure Factors for Air Pollutant Health Effects 40 Figure 7: Triangle of Adverse Health Effects 41 Figure 8: Frequency of Exceedance of the Level A 42 Hourly TRS Objective in Prince George Figure 9: Frequency of Exceedance of the Level B 43 Hourly TRS Objective in Prince George Figure 10: Frequency of Exceedance of the Level B 44 24-Hour PM10 Objective in Prince George Contents Page Appendix D: Emission Inventory Assumptions and Factors PERMITTED SOURCES 47
iv
COMMERCIAL SOURCES 48 Prescribed Burning 48 Pacific Western Brewery 49 Restaurants 50 Welding Shops 50 Refuse Site 51 Autobody Shops 51 Gas Stations 51 Dry Cleaners 52 Printing Inks 52 Gravel Pits 53 Construction/Demolition of Buildings 53 Construction 54 Asphalt Paving 55 Paints 55 Glues, Adhesives and Sealants 55 Metal Degreasing 56
RESIDENTIAL SOURCES 56 Space Heaters 56 Wood Stoves 57 Fuel Oil 57 Natural Gas 58 Backyard Burning 58 Commercial/Consumer Solvents 59 Cigarettes 60 Lawnmowers and Garden Equipment 60
Barbecues 61 MOBILE EMISSIONS 61
Automobiles 61 Exhaust Emissions 62 Emissions From Unpaved Roads 63 Emissions From Paved Roads 64 Emissions From Winter Sanding 65 Train Emissions 65 Airplane Emissions 64
EMISSION ESTIMATES FOR 2001 67 REFERENCES 68

v
Executive Summary
Purpose of Air Quality Management In the last decade air quality concerns in Prince George have shifted from high TRS levels, which have been reduced since the late 1980’s through control of the pulpmill sources, to concerns about fine particulates (PM10 and finer particles), which can be emitted from many small, groundlevel sources, such as road dust, woodstoves and open burning, as well as the large industrial sources. The shift in management emphasis to more effective control of multiple, smaller sources, as well as regulation of the larger industrial sources, requires a coordinated planning process by all three levels of government, and more public involvement. Following various joint air quality management initiatives over the past several years, the City of Prince George and the Ministry of Environment, Lands and Parks (MELP) agreed in the summer of 1995 to formalize an air quality management process. The Prince George Airshed Technical Management Committee was formed in December 1995, consisting of representatives of the City, MELP, the Regional District of Fraser-Fort George and the Northern Interior Health Unit (Ministry of Health - MOH). Expert advisors from the University of Northern British Columbia and the College of New Caledonia also joined the Committee. The following reasons for cooperative airshed planning and management were recognized by all the management agencies:
• priority air contaminants originate from many sources, including the large industrial sources and smaller diffuse sources;
• air contaminants cross jurisdictional boundaries; • management requires land use planning (Official Community Plans), educational
and voluntary measures, as well as local and provincial regulatory measures; and • a cooperative effort can address a much wider range of potential sources,
increasing the options for reducing the emissions most responsible for poor air quality.
A management plan is required to systematically identify management priorities and goals, and to coordinate the implementation of management measures between the three levels of government. This plan will deal only with outdoor air. This Background Report was prepared to provide a framework for airshed management. This report is not a management plan. Rather, this report will provide an outline of many of the considerations that will go into a plan. This report provides:
• an outline of the air quality management process; • a brief review of the status of air quality and human respiratory health in Prince
George; • a framework for selecting the planning priorities, including selection of the
priority contaminants and sources, and management options; • suggestions for interim measures to begin reductions of priority sources while the
management plan is being prepared; and • suggestions for obtaining funding for air quality management.

vi
With knowledge of current air quality and of the major contributors of selected contaminants, it is possible to identify which priority contaminants and sources will likely require further management actions. Final selection of those actions to be recommended to government decision makers should be done following incorporation of public input into the management plan. Recommendations for management priorities made at this stage are preliminary, based solely on the technical analysis presented in this report. Management priorities recommended here are intended to establish a framework for public input to the development of the plan.
Selecting Priority Contaminants and Sources
Selection of priority contaminants for management should be based on one or more of the following factors:
• contaminants currently exceeding ambient air quality objectives; • the relative seriousness of human health or other effects expected to result from
exceedance of ambient air quality objectives; • contaminants with potential to cause human health or other effects in combination
with other contaminants at measured ambient levels; • contaminants predicted to be significantly increased in the airshed without future
intervention; • contaminants with objectives being considered for revision to lower levels; and • concerns expressed by the public.
The summary of current ambient air quality presented in this Report identifies PM10 and TRS as the contaminants with significant air quality objective exceedance frequencies. When the seriousness of effects are considered, PM10 emerges as the top airshed management concern because many epidemiological studies point to a relationship between fine particulates and health effects ranging from premature death to subtle changes to lung function.
Selection of the sources of contaminants that should receive the highest priority for management should be based on the following factors:
• sources contributing the greatest mass loadings of priority contaminants (source size);
• sources contributing most significantly to exceedances of ambient air quality objectives (combination of location, size and source elevation, etc.); and
• sources offering the best opportunity for reduction (available technology, cost effectiveness, availability of alternate locations)
The source inventory information in this Report provides a preliminary basis on which to classify sources for reduction of priority contaminants. The relative contributions from permitted and non-permitted sources provides an indication of the mechanisms that will be required to achieve any emission reductions. Source-specific waste management permits can be used to reduce, or occasionally to eliminate, permitted sources through stipulation of improved source treatment, or improved source management. Management of non-permitted sources may require one or more of a range of measures, from national or provincial regulations (automobile exhaust emissions controls and woodstove design) to local bylaws and education programs.
vii
Since the ultimate objective of air quality management is to control exposure to contaminants, local meteorology is also an important consideration in determining what sources should be controlled in order to achieve acceptable air quality. Contaminants released at high elevations can be expected to disperse more effectively than those from ground-level sources, as can contaminants released above the inversion layers, but can impact higher elevation areas.
The largest sources of PM10 in the airshed are road dust and the major permitted industries. The most important industrial emitters are the pulpmills, which account for about 45%, and the sawmill beehive burners, which contribute about 35%.
Managing health effects from fine particulates in this airshed should follow a phased approach, starting with emission reduction measures to achieve the 50 µg/m3, Level B objective, throughout the airshed, and continuing with any other measures that will reduce the exposure of residents. Such a risk management strategy should take advantage of the full range of reduction measures, from regulatory control of the major airshed sources to volunteer actions to limit neighbourhood sources.
Public Input During the initial phases of preparation of the Air Quality Plan, public input is recommended to ensure that all the relevant issues and the priorities have been identified and discussed. Four consultation approaches are suggested.
1. Consultation with the general public through media advertising and requests for comment on the background report, and in open houses is recommended to get broad public input.
2. Consultation with the principal stakeholders, including representatives from
professional health associations, environmental organizations, and industry and business associations is recommended , as a second step, to obtain broader technical input.
3. A third approach is to conduct a public survey, using a professionally-designed
questionnaire to determine public concerns and priorities, and public willingness to see implementation of management measures.
4. During preparation of the plan, City Council, the Regional District Board and senior
management from the participating Ministries may wish to appoint members of the public to the Technical Management Committee or other groups which would provide input to the technical committee in preparing the plan.
Selecting Management Options The process of identifying management options and priorities involves making judgments about the cost effectiveness and technical feasibility of alternative measures. Feasibility studies may be required to weigh the benefits and costs of various options. Selection of final options should be based on further public consultation before being referred to the

viii
decision makers for action. Management options can be divided into the following general categories:
• source reduction or elimination; • planning and location of emission sources, human residences and sensitive
natural environments and resources; and • management of air quality episodes.
The direction of development and growth in the City of Prince George is governed by the City’s Official Community Plan. Similarly, the Regional District of Fraser-Fort George has several community plans which are in force in the areas that surround Prince George. Airshed planning is a vital component of the planning process in that the allocation of land for specific uses can significantly affect air quality. For instance, locating major industrial sources upwind of residential areas may affect the livability of those areas. It is important that these Official Community Plans reflect the principles and strategies embodied in the airshed planning process. It is expected that, after the airshed plan is prepared, the affected community plans will be reviewed and possibly amended to reflect the determined directions.
Immediate Steps Some of the immediate monitoring and research needs that have been identified in the course of preparing the background report are:
• a PM10 source apportionment study; • improved monitoring of the priority sources to obtain more accurate emission
inventories; • monitoring of additional contaminants in potentially significant sources (e.g.
PM10, NOx, VOC, HAP and O3 ,); • modeling of the local ozone-forming process to identify NOx and VOC
management needs; • initiation of monitoring in the Hart Highlands residential area; • research on modeling methods to assess the effects of calm winds and inversions
on air quality; • research to determine the need for additional monitoring locations; and • a study of health impacts on the population.
Preparation and implementation of the Management Plan, including some of the immediate and longer-term monitoring and research, will require more resources than are available in the budgets of the management agencies. It is recommended that these agencies begin now to identify how adequate resources will be obtained to carry out air quality planning and management, including such options as:
• cost-sharing with the priority source owners (splitting of costs based on relative contributions of priority contaminants);
• provincial funds; • fees and taxes; and • special funds.
This Background Report will be sent to City Council, the Regional District Board and the Regional Directors of MELP and MOH. The Committee is seeking general agreement
ix
with the planning and management approaches outlined here, and approval to proceed with the next step, which is consultation with the public and other stakeholders. At the same time, the public will be invited to provide initial comment on the report.
Once approval to proceed is given, the public consultation process can be started simultaneously with those immediate monitoring and research projects that have been funded, and preparation of a funding strategy for other planning and management activities. The next significant steps in the process should be:
• Release of the background plan for comment and management approval; • Preparation of a strategy for completing the air quality plan; • Carrying out of a public opinion survey; • Formal public consultation, including open houses and stakeholder meetings; • Preparation of a draft air quality management plan, incorporating results of public
and stakeholder consultation; • Release of draft plan for public and stakeholder comment; • Submission of revised plan for management approval; and • Implementation of the air quality plan.
1
1.0Introduction
In the last decade air quality concerns in Prince George have shifted from high TRS levels, which have been reduced since the late 1980’s through control of the pulpmill sources, to concerns about fine particulates (PM10 and finer particles), which can be emitted from many small, groundlevel sources, such as road dust, woodstoves and open burning, as well as the large industrial sources. Recent health effects information has pointed to fine particulates as a more serious concern than was previously thought. The shift in management emphasis to more effective control of multiple, smaller sources, as well as regulation of the larger industrial sources, requires a coordinated planning process by all three levels of government, and more public involvement. For many years, concerns with the air quality in the City, particularly in the “bowl” area at the confluence of the Nechako and Fraser Rivers, have been expressed in complaints registered by the Ministry of Environment, Lands and Parks (MELP) and the Ministry of Health, and in articles and letters in the local newspapers. The MELP and the major local industries have been conducting air quality monitoring since the early 1980’s, and the annual airshed reports indicate levels of total reduced sulphur (TRS) and fine and coarse particulate that frequently exceed the Level A provincial ambient air quality objectives. Advisories of poor air quality have been issued a minimum of twice per year since fine particulate monitoring was started in 1990, reflecting the unacceptable ambient levels of this contaminant. The shape of the “bowl”, at the confluence of the Fraser and Nechako Rivers, contributes to periodic build-up of contaminants, particularly from lower-level emissions that are insufficiently buoyant to escape the valleys during periods of calm winds and temperature inversions. The local meteorology thus increases the frequency and duration of episodes of exceedances of the air quality objectives (or “unacceptable air quality”). Definitions of various terms used in this report are included in Appendix A. These terms include: air quality management, air quality management plan, Prince George airshed, air contaminant, PM10, PM2.5, TRS, SO2, NOx, VOC, CO and O3 and Level A, B and C objectives. The current ambient air quality monitoring program in Prince George consists of measuring PM10, PM2.5, TRS, sulphur dioxide (SO2), nitrogen oxides (NOx), ozone (O3) and formaldehyde at those locations listed in Table 1, and shown in Figure 1. This monitoring is carried out jointly by Northwood, Canfor, Husky and MELP, with the Ministry checking data quality, managing the data and preparing annual airshed reports. The acceptability of air quality is determined by comparing ambient levels with the provincial air quality objectives. These objectives act as general indicators of protection from defined human health or other environmental effects, for each specific contaminant. The various levels of protection and averaging periods (one-hour, 24-hour, etc.) are included in Table 2. The objectives are guidelines, rather than legal standards, reflecting their role as indicators of cumulative effects from all sources of each particular contaminant. Following various joint air quality management initiatives over the past several years, the City of Prince George and the Ministry of Environment, Lands and Parks (MELP) agreed in the summer of 1995 to formalize an air quality management process. A jointly-prepared

2
resolution was adopted by City Council in December, 1995, and the first meeting of the Prince George Airshed Technical Management Committee was held in December 1995. The Regional District of Fraser-Fort George and the Northern Interior Health Unit (Ministry of Health - MOH) joined the committee in January 1996. This management committee of representatives of the provincial, regional and municipal levels of government was formed to guide the preparation and implementation of an air quality management plan for Prince George and the immediate surrounding area. Expert advisors from the University of Northern British Columbia and the College of New Caledonia also joined the Committee at the invitation of the management agencies. The need for cooperative airshed planning and management was recognized by all the management agencies, based on the following considerations:
• priority air contaminants originate from many sources, including the large industrial sources and smaller diffuse sources;
• air contaminants cross jurisdictional boundaries; • management requires land use planning (Official Community Plans), educational
and voluntary measures, as well as local and provincial regulatory measures; and • a cooperative effort can address a much wider range of potential sources, increasing
the options for reducing the emissions most responsible for poor air quality. A management plan is required to systematically identify management priorities and goals, and to coordinate the implementation of management measures among the three levels of government. This plan will deal only with outdoor air. This Background Report was prepared to provide a framework for airshed management, a synopsis of current air quality and respiratory health, a breakdown of emission sources, a preliminary analysis of management priorities and as an information base for a public consultation process. The report was prepared for the City Council, the Regional District Board and MELP and MOH management to provide these decision-making bodies with an overview of air quality management needs. This report is not a management plan. Rather, this report will provide an outline of many of the considerations that will go into a plan. This report provides:
• an outline of the air quality management process; • a brief review of the status of air quality and human respiratory health in Prince
George; • a framework for selecting the planning priorities, including selection of the priority
contaminants and sources, and management options; • suggestions for interim measures to begin reductions of priority sources while the
management plan is being prepared; and • suggestions for obtaining funding for air quality management.
2.0The Air Quality Management Process
The steps in preparing and implementing an airshed management plan are outlined in point form. The steps are listed in a logical order; however, once management actions for the top priority contaminant sources have been initiated, new contaminants and sources may require

3
evaluation based on information collected in the process. Ongoing re-evaluation of priorities and management requirements is expected. The recommended steps are: • set airshed management principles, such as;
1. reduction of emissions of those contaminants that significantly exceed air quality objectives;
2. prevention of significant increases in contaminants that currently meet the air quality objectives (non-degradation);
3. minimization of exposure of residents and the environment to air contaminants (e.g. through land use planning and zoning); and
4. reduction of risks to agreed-upon levels, since risk cannot be eliminated. • determine ambient air quality; • identify priority contaminants for management; • determine source breakdown of priority contaminants; • identify priority contaminant sources; • identify uncertainties in the information base, including contaminant dispersion,
contaminant interactions and current emissions; • carry out consultation with public and other stakeholders on priority source management; • select priority contaminant sources for management actions, including episode
management; • select management mechanisms; • prepare draft management plan, including responsibilities of participants; • obtain public input; • finalize plan; • implement plan and monitor effectiveness; • continue monitoring and research of other contaminants and sources, and dispersion and
transport processes to determine future management needs; and • revise plan when new priorities are identified.
3.0 Status of Respiratory Health of Prince George Residents
The driving force behind the control of air pollution has always been the protection of public health. Health indicators for residents of the City of Prince George and the surrounding Central Interior Region reflect generally higher levels of illness and mortality when compared to the B.C. average.
3.1 General Mortality Rates Death rates during the five year period 1990 - 1994 for the Northern Interior Health Region for both men and women for the current leading causes of death are elevated beyond the B.C. rate (cancer, endocrine, circulatory, respiratory, digestive and external causes). All the elevations apart from male cancer and male circulatory death rates achieve statistical significance, indicating that the differences in mortality are not due to chance. (Figure 2) Note: Data drawn from the larger surrounding region, either the Northern Interior Health Unit or Local Health Area 57 are used to approximate the experience in Prince

4
George because the majority of the region’s population lives in the city, and because data specific to the City of Prince George is not extensive. It is a characteristic of northern and rural populations that rates of death and disease are usually elevated beyond those of their southern urban counterparts. The causes of this elevation are multiple and include access to services, high-risk work environment, higher rates of tobacco use, and economic factors, such as lower levels of education, income, and employment. Where those three socioeconomic factors together are correlated with death rates, a relationship exists where regions having the highest levels of income, education and employment have the lowest death rates, and conversely the higher the level of poverty and unemployment, the higher the death rate (Millar, 1996). In Figure 3 the Northern Interior Health Region (“NI”) ranks nineteenth of twenty regions both for death rates and for socioeconomic characteristics. Because there is considerable affluence in Prince George, which should positively influence the socioeconomic variables, and consequently the mortality rates, it is possible that there are two populations here, one relatively well-off and the other experiencing profound poverty, unemployment, lack of education, and poor health. 3.2 Respiratory Mortality Rates In the same way that the rates locally are elevated for the other leading causes of death, hospitalization and death rates from respiratory disease are significantly elevated for both men and women. When comparing the respiratory mortality experience here to that of the other health regions in B.C., (1990 to 1994) the Northern Interior Health Region ranks nineteenth out of twenty health regions; surpassed only by the Peace River region (Figure 4). A similar analysis for northern federal census divisions shows a similar gap between Prince George mortality rates and some areas of northern Alberta. 3.3 Mortality from Specific Respiratory Diseases The leading causes of respiratory mortality are infectious (pneumonia and influenza) chronic respiratory disease and lung cancer. Death rates from 1990 - 1994 for both men and women in the Northern Interior Health Region are all elevated compared to the B.C. rate. Some are only slightly higher than would be expected (asthma and lung cancer). However for total respiratory diseases, chronic respiratory disease and infectious causes, the rates are 30 - 50% higher than expected, (Figure 5) and perhaps higher than achievable. Methods to reduce excess deaths include eliminating tobacco use, ensuring that people at risk get their influenza and pneumococcal immunization, avoiding allergens that trigger asthmatic attacks, and improving air quality, both indoor and outdoor. 3.4 Results of Earlier Health Studies In 1986 and 1991, the results of a two part study of ambient air pollution and human health in Prince George were released (Knight et.al., 1986 and McNeney and Petkau, 1991).
5
These studies examined the links between hospital admissions and emergency room visits for specific categories of respiratory disease, (asthma, bronchitis, ear infections and other) and two indicators of air pollution, total reduced sulphur (TRS) and total suspended particulate (TSP). While the 1986 study showed a small but clear association between emergency room visits and TRS, the results of the second, confirmatory study did not show the association and in fact showed paradoxical results, with fewer Emergency Room visits around days of higher air pollution. It was concluded that using the number of visits to the emergency room at Prince George Regional Hospital was not a sensitive enough indicator because of the comparatively small size of the population. Despite a thoughtful study design, and sophisticated biostatistical calculations, this study did not clarify the situation. The key problem was likely insufficient air quality data (total suspended particulates were measured every 6th day). The local monitoring capacity has improved since those studies were done. However, the failure of the study underscores the importance of adequate design and resources, if a new health study is undertaken. A new health study would merit identifying a research team with experience in community air pollution, epidemiology and biostatistics. To overcome the issue of small population size retrospective (historical) or prospective data collection of a large number of events such as school absenteeism or physician office visits might be gathered and correlated with ambient air quality. 3.5 Application of the Risk Management Approach in Airshed Management It is difficult to correlate ambient air pollution to specific human health impacts. The air we breathe is a highly variable mixture containing different concentrations of pollutants at different sites and different times. The levels of pollutant measured at the source may have little or no bearing on the mixture that an individual person is exposed to at a given time or place. Figure 6 identifies some of the complexities of measuring the effects of air pollution in a community population by showing the major points at which air pollution can be described, measured and controlled. For example, emissions (from a point source like a smokestack) depend on how much of which pollutant is burned in what way. The concentration of air pollutants depends on the emissions but also on the atmospheric conditions. Exposure depends on how many people breath what concentration for how long. Dose measures how much pollutant is actually deposited in the body and depends not only on exposure but also on such factors as the rate of breathing and the size of the particles. Health effects depend not only on dose but also on such factors as age, sex, whether the person smokes, and the existence of other diseases (Smith, 1987). Figure 7 shows the range of possible health effects from air pollution (Vedal, 1995). This “triangle of adverse health effects” show the majority of the population (at the base of the triangle), experience no adverse health effects. As exposure increases or as the sensitivity of the individual increases the adverse effects begin to appear, ranging from mild impairment of lung function through limitation of activity, to encounters with the health care system. to the severest consequences of cancer and death.

6
Laboratory and clinical studies have identified specific effects of single pollutants on human or animal airways. However, the measurable responses of a community population to a major episode of air pollution are increased emergency room and hospital visits and increased deaths rather than specific diseases.
Efforts to control air pollution as exemplified by the U.S. Environmental Protection Agency have until recently sought to identify individual pollutants, and to fix a specific level in the air of each pollutant, below which there should be no health effects in the community. In fact, in a community population the range of individual sensitivities will vary greatly, and even at very low levels of pollutants a few individuals will be affected. It is also becoming apparent that, at least for some of the key pollutants such as particulates and carbon monoxide, there is no threshold below which the population experiences zero health effects. Zero effect for some pollutants possibly means zero activity. The alternative is to find ways of reaching agreement as a community, or province, on what constitutes acceptable air quality.
Finally, emerging research on characterizing the impact on communities of specific
pollutants now points to fine particles (PM10 and PM2.5) and possibly ground level ozone and acid aerosols as being more responsible for adverse health effects at current levels of exposure than other (criteria) pollutants. Efforts directed toward reducing fine particulates in particular will likely offer the most significant results given the present state of knowledge.
4.0Air Quality and Contaminant Source Status 4.1 Status of Individual Contaminants Ambient levels of the various contaminants covered here are compared with the respective objectives to determine the acceptability of these levels for human use or other environmental values. The B.C. air quality objectives are listed in Table 2.
4.1.1 Total Reduced Sulphur
The trends in percent exceedance of the TRS objectives indicate that reductions in the pulpmill sources have produced a significant reduction in the frequency of exceedances of both the Level A and Level B one-hour objectives (Figures 8 and 9). Levels still exceed the odour prevention objective (Level A) about 10% of the time at the downtown Plaza station, and about 3% of the time at the Lakewood School station. The exceedance frequency of the Level B one-hour objective, established to protect against eye irritation, is about 1% in these locations.
A study in the 1980’s identified the largest contributors of TRS as the aerated biological effluent treatment ponds at the Canfor and Northwood pulpmills (Bennett et al., 1988). Significant reductions of the effluent pond emissions in the late 1980’s resulted in a substantial decline in complaints of physiological symptoms, although odour complaints are still received, particularly during prolonged TRS episodes.
In 1995 the TRS monitors at Foreman Flats and Van Bien School were converted to SO2 monitors and moved to new locations. The remaining monitors were found to be adequate to monitor levels in the affected areas.

7
4.1.2 Sulphur Dioxide Although the frequency of exceedances of the Level A one-hour SO2 objective has not increased at the jail station, average annual values have been substantially increased since 1991 (Table 3). This is due to increased emissions from all the main sources, but particularly the Husky refinery.
Three new SO2 monitoring locations were established in 1995 to determine the effect of emissions on the plateau and downtown areas of the airshed. Modeling of SO2 dispersion from the main sources was done to select the new monitoring locations.
The pulpmills and refinery accounted for 94% of the SO2 emissions in the airshed in 1995 (Table 4). Husky Oil has recently announced a plan to reduce sulphur dioxide releases to 730 tonnes per year by 1997, which will be a 75% reduction from 1995 emissions. Emissions are expected to remain at 1995 levels or increase slightly in the meantime.
A study of the effects of SO2 on sensitive plant species in the area is underway to evaluate the effectiveness of this emission reduction, and to determine the need for additional reductions. 4.1.3 Fine Particulate Matter (PM10 and PM2.5)
Year-to-year trends in the frequency of exceedances of the ambient PM10 Level A objective, shown in Figure 10, indicate no significant increasing or decreasing trends over the past 4-5 years at the seven currently active monitoring locations. Exceedance rates of the 50 µg/m3 24-hour objective range from about 10% at Plaza to from 0% to 3% at the Gladstone station in College Heights (1994 and 1995, respectively).
PM2.5 levels measured only at the Plaza station have averaged about 14 µg/m3 over the past two years since monitoring was started, compared to a PM10 average of about 25 µg/m3 over this period. No ambient objective has been established for PM2.5; however, levels of this contaminant may provide a more direct indicator of the health effects attributed to particulate matter (Vedal, 1995). Road dust, particularly from winter street sanding, and industrial emissions are the principal sources of fine particulate in the airshed (Table 4). Woodstove emissions can have strong local effects, even though their contribution to overall airshed emissions is relatively small (Table 6.2). In 1994 a provincial regulation came into effect requiring new woodstoves and fireplace inserts sold in B.C. to meet Canadian or U.S. standards for fuel burning efficiency. The regulation may be expected to reduce fine particulate emissions from domestic wood burning over time. The most significant planned alteration to current PM10 emissions is the phased elimination of all beehive burner emissions, scheduled for December 31, 1997, as mandated by provincial regulation. The effect of burner elimination on PM10 levels in the airshed was assessed using ambient measurements taken during burner operating and shut-down periods from 1992 to 1995 (Sutherland et al., 1996). This analysis predicts

8
reductions in annual average ambient PM10 levels ranging from 25% to 30% in the residential and commercial areas of the City. The effect of operating the proposed Canfor full-scale medium density fibreboard plant (MDF) was also assessed for the College Heights and Sintich trailer park areas, which are predicted to receive the greatest fine particulate contributions from this plant. With the current plan of replacing the burners only with the MDF plant, the ambient Level A PM10 objective of 50 µg/m3 is predicted to be met with infrequent exceedances in Sintich Trailer Park and in College Heights. However, the PM10 emission reductions achieved by these developments alone are not predicted to be sufficient to achieve compliance with the objective in the bowl area of Prince George.
4.1.4 Nitrogen Dioxide The annual average NO2 values from 1992 to 1995 indicate no increasing or decreasing trend, consistent with knowledge of the sources. No exceedances of the Level B one-hour and 24-hour ambient objectives, of 400 µg/m3 and 200 µg/m3, respectively, were recorded over the past 3.5 years, with a maximum hourly value of 149 µg/m3. Mobile sources are estimated to account for about 70%, and industrial about 25% of the NOx emissions in the airshed (Table 4). Rail locomotives contribute about 75% of the mobile emissions (Table 6.3). Light duty gasoline and heavy duty diesel road vehicles account for most of the vehicular contributions. Airshed NOx emissions are predicted to be increased by about 11% by 2001, with most of this increase coming from the proposed full-scale Canfor MDF plant and cogeneration facility following shut-down of the beehive burners (Tables 4 and 5). 4.1.5 Ozone Monitoring of O3 levels at the Plaza station was started in May 1995. A low level of exceedances (0.5%) of the hourly Level A ambient objective were recorded, with 20 of 28 exceedances recorded in May. Comparison of these hourly levels with measurements taken across Canada from 1980 to 1992 shows that these levels are lower than typical background concentrations obtained at six remote locations (Dann, 1994). However, further monitoring is required to assess annual trends. About 42% of the 24-hour values exceeded the Level A objective. Studies throughout North America indicate that 24-hour levels of this magnitude are considered to be background and are, therefore, not likely to have been generated solely from local NO2 sources (USEPA, 1996a). Higher exceedance frequencies of the 24-hour values were found in Williams Lake, even though annual NOx values are significantly lower there. It is not possible to draw any conclusions about O3 trends because of the short monitoring record, and because ambient levels of volatile organic compounds (VOC), which form O3 by reacting with NO2 in the presence of sunlight, have not been measured. Although NOx levels are predicted to rise in the next five years, VOC emissions will be substantially decreased due to the beehive burner shutdowns. 4.1.6 Formaldehyde and Other Volatile Organic Compounds

9
Ambient formaldehyde levels were measured from December, 1994 to April, 1995 at three bowl locations, and are being measured on an ongoing basis at College Heights, the Sintich Trailer Park, and at the BCR and Plaza stations since December 1995. The maximum value of 36 µg/m3 (converted from a measured 24-hour level of 9 µg/m3) is well within the hourly 60 µg/m3 Level A objective. Elimination of the beehive burner emissions is predicted to significantly offset the formaldehyde emissions from the full-scale Canfor MDF plant (Sutherland et. al., 1996). Total VOC, including formaldehyde, are predicted to be reduced by an estimated 2500 tonnes per year (25% reduction) as a result of terminating the beehive burner emissions, and constructing the Canfor Cogeneration and MDF facilities. With additional ambient formaldehyde monitoring results it will be possible to directly determine the beehive burner contributions to ambient levels. When formaldehyde emission factors are obtained for all the significant sources, formaldehyde emissions will be added to the inventory.
4.2 Frequency and Causes of Episodes of Air Quality Objective Exceedances Episodes of exceedance of air quality objectives are important management considerations because, for many contaminants, the risk of health or other effects increases with the length of exposure to unacceptable ambient levels , and also increases with the magnitude of short-term levels. An air quality episode is defined here as exceedance of a 24-hour ambient objective on at least two consecutive days, or exceedance of an hourly objective for at least two consecutive hours. The occurrence of episodes of PM10 and TRS were chosen for analysis because significant exceedances of the objectives for these contaminants continue to occur. Other contaminant ambient objectives were either never exceeded , or too infrequently exceeded to produce an episode. Episode frequencies have been determined for the Plaza station, because daily PM10 values were only available from there in 1995, and because residential TRS values are highest there. A review of the available continuous PM10 data indicates that the longest continuous period of unacceptable levels over the past three years was six days, in late March of 1995, although six of seven days had values over the 24-hour objective in late March of 1994. PM10 episodes occurred three times in 1993, six times in 1994 and nine times in 1995. The frequency of episode days was a maximum of 6.6% in 1995 (24 out of 362 days of measurement) which was about 73% of the days in which PM10 exceedances occurred at the Plaza station that year. Most of the PM10 episodes at the Plaza station occurred in March 1994 (3 periods of 3 days each), August 1994, February/March 1995 and September of 1995. Late February and March PM10 episodes appear to be caused mainly by mobilization of the fine silt associated with street sand. Frequently, high hourly PM10 values at that time of year occur during traffic rush periods, although overnight inversions can help sustain these levels. Late summer and fall episodes appear to have been caused mainly by a combination of increasing frequency of inversions and the presence of smoke from beehive burner operation in the BCR Industrial Park, and by prescribed burning outside the City. TRS Level A episodes occurred about 4.5% of the time in 1995 (373 out of 8205 measurement hours). Episodes of Level B exceedance occurred in only 5 consecutive hours, all in early March. Up to twenty-four consecutive hours of Level A exceedance were recorded twice in January, which had 103 of the episode hours. October was the next worst

10
month with 57 episodic hours. Exceedance episodes accounted for about 49% of the total Level A TRS exceedances in 1995 (4.5% versus a total of 9.2% exceedances), indicating that extended periods of “smelly” air accounted for a significant portion of the exceedances at the Plaza station. TRS episodes occurred on 65 days in 1995, or 18% of the time. The conclusion from this analysis is that a significant portion of the objective exceedance days for these two contaminants occurred during episodes. Therefore, management of these contaminants is expected to require efforts to reduce the frequency and duration of episodes, as well as efforts to reduce the overall level of exceedances. Reduction of the annual average level of those contaminants selected for priority management is also expected to be necessary to preventing exceedances and episodes.
5.0A Framework for Selecting Management Priorities With knowledge of current air quality and of the major contributors of selected contaminants, it is possible to identify which priority contaminants and sources will likely require further management actions. Final selection of those actions to be recommended to government decision makers should be done following incorporation of public input into the management plan. Thus, recommendations for management priorities made at this stage are preliminary, and are based solely on the technical analysis presented in this report. Management priorities recommended here are intended to establish a framework for public input to the development of the plan.
5.1 Priority Contaminants
Selection of priority contaminants for management should be based on one or more of the following factors: • contaminants currently exceeding ambient air quality objectives; • the relative seriousness of human health or other effects expected to result from
exceedance of ambient air quality objectives; • contaminants with potential to cause human health or other effects in combination with
other contaminants at measured ambient levels; • contaminants predicted to be significantly increased in the airshed without future
intervention; • contaminants with objectives being considered for revision to lower levels; and • concerns expressed by the public.
The summary of current ambient air quality in Prince George points to PM10 and TRS as the contaminants with significant air quality objective exceedance frequencies. Reduction of emissions of these contaminants is required if the air quality objectives are to be achieved. Ozone and SO2 are the next highest priorities for management action. Given the infrequency of unacceptable levels, the recommended strategy is to manage current and new sources so that ambient levels are not increased. When the seriousness of effects are considered, PM10 emerges as the top airshed management concern because many epidemiological studies point to a relationship between fine particulates and health effects ranging from premature death to subtle changes in lung function (Vedal, 1995). To adequately reduce the risk of these effects, continuing reductions are recommended, as a general strategy, at least until more definitive effects thresholds are established. Adoption of a more stringent ambient PM10 objective, and the setting of a PM2.5

11
objective, are under consideration in Canada and the U.S. However, the first priority in this airshed is to reduce emissions so that the current PM10 objective is met. A major step towards meeting the PM10 objective will be taken with the elimination of the beehive burner emissions, which currently account for about 30% of the total particulate released into the airshed (about 4000 out of 13,000 tonnes of the non-dust sources per year - Tables 4 and 7). The PM10 contributions from the burner emissions have been estimated at from 25% to 30% of the PM10 levels throughout the bowl (Sutherland et al., 1996). Although the Level A one-hour TRS objective is exceeded at Plaza about as frequently as the PM10 objective at that location, the consequences are less serious. Exceedance of the Level A TRS objective results in increased incidence of odour complaints, but health effects, such as eye and throat irritation or breathing restriction, typically don’t occur until levels are much higher. TRS exceedances are not as widely distributed throughout Prince George as are PM10 exceedances. Since the predominant sources of TRS are the pulpmill effluent ponds, exceedances mostly occur in those residential areas closest to the Fraser River (Plaza and Van Bien stations). PM10 exceedances occur at similar frequencies at all the bowl monitoring locations, and College Heights is also somewhat affected. PM10 sources are highly variable, from low elevation neighbourhood sources of woodstove and backyard smoke and road dust, to medium elevation sawmill burner sources, to the high elevation pulpmill stacks. Contaminants such as NO2, particulates and SO2 have the potential to produce greater effects, when combined, than would be expected from each individual contaminant (State Pollution Control Authority, 1992). Such effects are termed synergistic effects. Our current knowledge of the effects of combinations of these contaminants indicates that higher levels than have been measured here are required to produce synergistic effects. However, the management plan should consider the necessity to prevent significant increases in emissions of these potentially synergistic contaminants until local health studies or other evidence is available to determine the effects potential. If synergistic effects are demonstrated, or are considered likely, then the current ambient objectives for the contaminants-in-question should be modified. Similarly, if the levels at which any contaminant produces negative effects (thresholds) are found to be lower than the current ambient objectives, new lower objectives may be established, potentially requiring additional emission reductions. Recent evidence on the health effects of PM10 and PM2.5 points to a potential revision of the ambient objectives for these contaminants.
5.2 Priority Sources
Selection of the sources of contaminants that should receive the highest priority for management should be based on the following factors: • sources contributing most significantly to exceedances of ambient air quality objectives
(combination of location, size and source elevation, etc.); • sources contributing the greatest mass loadings of priority contaminants (source size);
and • sources offering the best opportunity for reduction (available technology, cost
effectiveness, availability of alternate locations)

12
The source inventory information provides a preliminary basis on which to classify sources for reduction of priority contaminants (Table 4). The relative contributions from permitted and non-permitted sources provides an indication of the mechanisms that will be required to achieve any emission reductions. Source-specific waste management permits can be used to reduce, or occasionally to eliminate, permitted sources through stipulation of improved source treatment, or improved source management. Management of non-permitted sources may require one or more of a range of measures, from national or provincial regulations (automobile exhaust emissions controls and woodstove design) to local bylaws and education programs. The emission inventory was prepared using the best available information, which frequently consisted of emission factors rather than actual monitoring data. The emission factors have been established for source classes (e.g. power boilers, vehicle age and weight classes) that may include a variety of operating conditions. The accuracy of emission values based on emission factors may be variable, and error factors may be quite large (within 50-100%). Therefore, the data have been used as a rough indicator of the relative significance of sources (i.e. large versus medium versus small). Since the ultimate objective of air quality management is to control exposure to contaminants, local meteorology is also an important consideration in determining what sources should be controlled in order to achieve acceptable air quality. Contaminants released at high elevations can be expected to disperse more effectively than those from ground-level sources, as can contaminants released above the inversion layers, but can impact higher elevation areas.
5.2.1 TRS Sources A study done during the 1980’s found that the pulpmill effluent ponds were the preponderant airshed TRS sources, with lesser contributions from other pulpmill sources and the Husky refinery (Bennett et al., 1988). Provincial permit amendments will be required to implement any additional management measures. A review of the potential for further reduction in TRS from pulpmill and refinery sources is required to determine the feasibility of meeting the Level A objective. 5.2.2 PM10 Sources The largest sources of coarse particulate matter and PM10 in the airshed are road dust and the major permitted industries (Table 4). The most important industrial emitters are the sawmill burners, which account for about 35% of the permitted emissions (Tables 4 and 7), and the pulpmills, accounting for roughly 45% of permitted emissions (Tables 4 and 5). Unpaved roads are potentially a significant source of particulate matter, including PM10, although these sources are the most difficult to quantify (Table 6.3). It is also difficult to assess the degree of exposure of Prince George residents to these sources, given the predominance of paved roads in the main residential and commercial areas of the airshed. Dust suppression is used with varying degrees of success to reduce emissions from unpaved roads. Paved roads may also be a significant source, although the ultra
13
fine, PM2.5 portion is much less significant in dust than in other particulate sources (USEPA, 1985).
The contribution of winter road sanding to ambient PM10 levels was estimated; however, the degree of uncertainty in the estimate is high. It is recognized that mobilization of fine particles from road sand is a likely cause of high ambient PM10 episodes in late winter. The ground level origin of this source and the relatively poor dispersion potential of road dust increase the potential for significant human exposure to the fine fraction. Evidence of the effects of road sanding on air quality indicates the need to identify management measures. (See the episode analysis - Section 4.2.) The effect on PM10 emissions of eliminating the sawmill burners and of operating the full-scale MDF plant is illustrated in Table 4 (Year 2001 scenario). It can be concluded that measures to further reduce PM10 in the airshed should target road dust and industrial emissions. Although investigation of options for reducing emissions from these sources should begin once the Air Quality Plan is finalized, identification of specific management measures should be based on a more precise PM10 source breakdown. The significance of road dust to PM10 levels in specific areas of the airshed should be particularly investigated, given the potential for effects from this source to be more localized than those from the wood combustion sources. The relative significance of road dust and wood burning PM10 contributions, particularly, can be determined for specific locations and times of the year. This apportionment of sources is done by analyzing samples of PM10 obtained with the ambient monitors. This is the most direct method of determining how specific sources are affecting a particular area. Although woodstove emissions are a relatively small PM10 contribution to the overall airshed (Tables 4 and 6.2), these sources can have a significant effect on local air quality. During calm air and inversion periods, woodstove emissions do not disperse effectively, because of the low elevation of the emissions and lack of vertical rise of the chimney plumes. Short-term PM10 measurements carried out by MELP at the North Nechako Elementary School demonstrated the effect of wood burning at two adjacent trailer parks. A source apportionment study may be able to separate woodstove smoke from other wood combustion contributions. Sources of similar potential importance to local neighbourhood PM10 levels are backyard burning of yard waste, lawn burning and other backyard open fires. The City Fire Department gave about 2000 verbal approvals for such burning in 1995 (M. Dornbierer, pers. comm.). The elimination of these fine particulate sources is tied to management of solid wastes, including composting and alternate uses of the material. Although it is not possible to quantify the effect of backyard burning on PM10 levels with the existing monitoring network, investigation of complaints by MELP indicates that such practices can have significant local effects. The effectiveness of alternative disposal practices will depend on the effectiveness of diversion and use of the residual materials. Effective education and promotion on the alternatives is also required. Recent studies on PM10 health effects indicate that effects may occur at levels below the B.C. Level B objective of 50 µg/m3 (Vedal, 1995). The management implications of these findings are not only that the PM10 objective must be met, with rare exception during unusual meteorological conditions, but that overall PM10 levels must be reduced.
14
Reductions in the annual average PM10 level are required to reduce the risk of health effects caused not only by short-term levels above 50 µg/m3, but also by longer term periods with levels below the current objective, and frequent occurrences of levels above 20 µg/m3 (Vedal, 1995). Managing health effects from fine particulates in this airshed should follow a phased approach, starting with emission reduction measures to achieve the 50 µg/m3 throughout the airshed, and continuing with any other measures that will reduce the exposure of residents. Such a risk management strategy should take advantage of the full range of reduction measures, from regulatory control of the major airshed sources to volunteer actions to limit neighbourhood sources. 5.2.3 SO2 Since four permitted sources account for 94% of the SO2 emissions in the airshed, further reductions will be achieved by permit amendments. The SO2 inventory for 2001 shows an approximate 50% reduction resulting from the planned sulphur removal measures at the Husky refinery (Table 4). Ongoing monitoring of ambient airborne, vegetation and soil levels, and assessment of effects of current and predicted emissions on the surrounding forest will indicate the need for further reductions. 5.2.4 NOx, O3 and VOC Since management of ozone requires control of the chemical precursors, NOx and VOC, coordinated management of these contaminants is required. Both industrial and mobile sources are significant contributors of NOx (Table 4). Based on the current ambient levels of NOx, immediate reductions appear unnecessary, but it would be desirable to curtail additional emissions until it is determined whether or not ozone reduction measures are required. The inventory indicates that railway locomotive traffic is the most significant NOx producer in this airshed, contributing over 50% of the total emissions (Tables 4 and 6.3). The other 50% is split about evenly between permitted and vehicular mobile sources. The mobile sources generate NOx primarily by conversion of atmospheric nitrogen gas (N2) during high-temperature combustion processes. Reduction of these sources is mainly achieved through better vehicle emission control equipment and appropriate maintenance of this equipment. The main permitted source of NOx comes from combustion processes generating energy or steam to operate the pulpmills, refinery and other large industries. NOx formation in these processes also results primarily from combustion of atmospheric N2 during the burning of wood, natural gas and other fuels. Lesser NOx contributions come from combustion of the nitrogen contained in wood and other fuels, such as diesel fuel An important consideration in managing NOx from the pulpmills, where wood is the primary fuel, is that the improvements to combustion efficiency can produce increased NOx (e.g. cogeneration). Technology is available, however, to reduce NOx formation or re-convert it after formation. Where improved combustion efficiency is not required,

15
significant PM10 reductions can be achieved without accompanying NOx increases (e.g. with installation of fine particulate removal technology). Very limited ambient VOC measurements have been made, so that it is not known whether VOC or NOx is limiting to the formation of ozone in this airshed. However, since vegetation is a significant source of VOC, which is an ozone precursor, it is frequently NOx and not VOC which determines the rate of ozone formation. The large industries are estimated to contribute about half the airshed VOC emissions, with the other half being divided about equally among the commercial, residential and mobile sources (Tables 4 and 6.1-6.3). The largest industrial contributors are the sawmill beehive burners, and elimination of these sources by 1998 will remove about 60% of the man-made sources in the airshed. Nothing is known about natural local contributions. Ongoing monitoring may indicate whether or not these reductions will reduce ozone levels. Investigation of the ozone formation process in this airshed, through modelling or an expanded monitoring network, is required to determine the need for NOx reductions. 5.2.5 Hazardous Air Pollutants and Other Contaminants Knowledge of emission and ambient levels of hazardous air pollutants (HAP), such as volatile hydrocarbons like benzene, is required in order to determine the need for management of these contaminants. A review of emission inventories for HAP should be done to determine those with the greatest likelihood of being released in significant amounts from local sources. Since the number of potentially significant HAP is large, a review of the literature on the most significant sources should be done before selecting priority substances for monitoring. Contaminants that should be monitored in the main sources and in ambient air are carbon monoxide (CO) and acid aerosols. Carbon monoxide is released from all sources of combustion (e.g. vehicles, pulpmills), but normally does not occur in unacceptable levels in outdoor air, although it can be a significant health hazard in workplaces and other confined areas (WHO, 1987). Monitoring of ambient levels during the most severe meteorological conditions should indicate whether further monitoring or emission controls are required. Acid aerosols are products of SO2 and NO2 emissions. Initial measurements are required to determine whether or not adequate neutralization of these acidic contaminants is taking place in the airshed.
5.3 Obtaining Public and Other Stakeholder Input
Preparation and implementation of the Air Quality Management Plan, following discussion of this background report, requires input from those public and private parties that will receive the benefits, or bear the costs, of management actions. Involvement of these stakeholders should be done throughout plan preparation in order to assess the management options identified in the plan. Support from the principal stakeholders and the general public is critical if the plan is to be supported and implemented effectively by the management agencies.

16
During the initial phases of Plan preparation, public input is necessary to ensure that all the relevant issues and the priorities have been identified and discussed. Three consultation approaches are suggested. Consultation with the general public through media advertising and requests for comment on the background report, and in open houses is suggested to get broad public input. Consultation with the principal stakeholders, including representatives from professional health associations, environmental organizations, and industry and business associations is suggested to obtain broader technical input. A third approach is to conduct a public survey, using a professionally-designed questionnaire to determine public concerns and priorities, and public willingness to see implementation of management measures. The survey will also serve to obtain input from more members of the general public than the open houses. The survey should be conducted prior to other consultation approaches to provide guidance on the organization of subsequent steps. To obtain the most meaningful stakeholder input to the plan, a sequence of consultation steps is recommended. The first step should be educational, using well advertised open houses to present the information and planning framework contained in this report, and to best facilitate understanding of management issues through small group discussions.
The second step should be consultation with more specialized stakeholder groups that can provide technical input on health studies, monitoring, emission reduction options and costs. Small groups, working independently, could be most effective in these consultations, to enable input to be focused on specific technical questions. Industry and business sector groups (e.g. wood products, chemical, railways), professional associations and advocacy groups are examples. During preparation of the plan, City Council, the Regional District Board and senior management from the participating Ministries may wish to appoint members of the public to the Technical Management Committee or other groups which would provide input to the technical committee in preparing the plan. After obtaining the public input required to finalize the Plan, general public forums could be held to inform residents about the plan.
5.4 Identifying Management Options The process of identifying management options and priorities involves making judgments about the cost effectiveness and technical feasibility of alternative measures. Feasibility studies may be required to weigh the benefits and costs of various options. Selection of final options should be based on further public consultation before being referred to the decision makers for action. Management options can be divided into the following general categories:
• source reduction or elimination; • planning and location of emission sources, human residences and sensitive natural
environments and resources; and • management of air quality episodes.
5.4.1 Source Management The Air Quality Management Plan should contain recommendations on how the goals will be met. To select these management actions, it will be necessary to consider the

17
feasibility and effectiveness of the various management options that can be applied to the priority emission sources. Management actions taken to reduce individual sources could include reduction of MELP permit emission limits on individual sources, or establishment of emission caps (overall airshed limits) for selected contaminants, enabling emissions to be traded between producers. The use of ambient air quality objectives to evaluate the acceptability of new emission sources acts effectively as an emission cap, since increased emissions from an individual source should not be allowed once the objectives have been reached, or are predicted to be reached, unless reductions take place at other sources. The air quality management plan provides the best mechanism for implementing such a cap, since regulation of individual sources alone may not be capable of achieving the ambient objectives. Regulation of individual sources is done through amendment of permit emission limits after regulators decide which sources should be reduced in order to achieve compliance with the air quality objectives. If a limit on the total mass loading (e.g. kilograms per day) of a particular contaminant is specified for a source, then the source producers can decide where the required reductions should be made. Establishment of emission caps requires a high degree of confidence in emission inventories and the prediction of the effects of new sources on ambient levels of the managed contaminants. The effectiveness of this management approach will depend on the quality of information on air quality and meteorology and on emission characteristics, as well as the effectiveness of the emission dispersion models used to evaluate new sources. The benefit of capping total emissions, rather than simply prohibiting new sources, is that the responsibility is put on the emission producers to decide on the most cost effective methods to achieve compliance with the emission limits. Other PM10 source reduction measures may be implemented when more stringent, province-wide emission criteria are established. Under Waste Management Act permits these criteria are established as legal limits on the concentrations of selected contaminants (e.g. mg/m3 of SO2), and are based on the best achievable emission control technology for a particular source (e.g. power boilers). More stringent limits can be applied where required to protect local air quality. Multiple sources can be reduced using generic regulations which provide restrictions on frequency and timing of emissions (e.g. backyard burning during poor mixing conditions), bans on certain activities, special conditions (e.g. car pool lanes), and by providing incentives to use alternative materials or services (e.g. recycling, composting and public transportation). 5.4.2 Land Use Planning The direction of development and growth in the City of Prince George is governed by the City’s Official Community Plan. Similarly, the Regional District of Fraser-Fort George has several community plans which are in force in the areas that surround Prince George. These plans delineate future land uses and contain specific policies upon which

18
development applications are reviewed and infrastructure investments are determined. Airshed planning is a vital component of the planning process in that the allocation of land for specific uses can significantly affect air quality. For instance, locating major industrial sources upwind of residential areas may affect the livability of those areas. Moreover, the plan’s policies respecting issues such as transit and public transportation can directly and indirectly affect the quality of air in an airshed. It is therefore imperative that these Official Community Plans contain and reflect the principles and strategies embodied in the airshed planning process. It is expected that, after the airshed plan is prepared, the affected community plans will be reviewed and amended to reflect the determined directions. While an official community plan sets the direction of growth in a community, the actual governance of land uses and allowable development is regulated by zoning and other regulatory bylaws. Therefore, it is essential, as with the community plan, that these bylaws also be reviewed once the airshed planning process is complete, and a plan is developed. It is likely that the airshed planning process will identify specific actions that all levels of government will need to take as part of an implementation strategy. The City Council of Prince George and the Regional District Board will need to take the lead in ensuring that their actions, as well as the actions of businesses and residents in their jurisdictions, reflect the goal of achieving acceptable air quality in the region. 5.4.3 Episode Management To reduce ambient contaminant levels during poor mixing conditions (calm periods and temperature inversions) the management plan must identify immediate, short-term measures for significantly reducing emissions. To be effective, episode management depends on the capability to accurately predict meteorological conditions and to measure air quality trends. Because required management measures must often be implemented with short notice, an essential requirement for effective episode management is the preparation of action and communication plans by all the significant emission sectors. To prepare an episode management plan it is first necessary to determine what sources have contributed most significantly to past episodes. For example, since most TRS originates from the pulpmill effluent treatment ponds, episode prevention will depend on the capability to reduce these sources. More effective control of sources other than the ponds may be necessary to prevent episodes, because the large pond volumes prevent quick reductions in contaminant releases. Management of spills with high TRS levels, such as black liquor spills, is also necessary to reduce the frequency of episodes. Reduction of overall PM10 emissions in the airshed should reduce the frequency of extended periods of the highest ambient levels. However, it may be expected that episodes will still occur during the most severe meteorological conditions. Although the emission inventory provides an indication of the most important PM10 sources, a source apportionment study is required to identify the main contributors to past particulate episodes. Since this study is also required to identify long-term source reduction targets, it should be considered as a high priority in the management plan, along with the interim management measures.
19
Episode management of the permitted sources might include: • preparation of contingency plans to identify emission reduction measures (e.g.
switching from wood to cleaner fuels, production cutbacks); and • planning to prevent contaminant releases that can be postponed.
Controlling episodes with significant non-permitted sources (i.e. commercial, residential and mobile) may include:
• voluntary curtailment of non-essential activities (open burning, unnecessary woodstove use) and encouragement of alternatives (e.g. use of public transport); and
• regulated measures to reduce mobile emissions (use of alternate transport in designated areas) and area emissions (use of alternate heating fuels, where possible; bans on open burning for landclearing, etc.).
Reducing short-term, non-permitted sources should also include public education and communication measures so that residents and small businesses are aware of the role they should play in preventing occurrences of unacceptable air quality. 5.4.4 Identifying Future Priorities (Monitoring and Research Needs)
It is expected that the air quality management plan will have to be reviewed regularly and up-dated to address new management priorities, including additional priority contaminants and sources. The plan may include monitoring and research requirements aimed at obtaining a better understanding of current and future air quality and contaminant effects. In order to identify future management priorities, the plan may require:
• additional monitoring locations, contaminants and frequencies; • improved understanding of contaminant effects, environmental behaviour and
contaminant interactions; • improved modeling of contaminant dispersion and chemical fate (photo and
chemical degradation; precursor reactions); • human health studies; and • vegetation and other environmental effects studies.
6.0Significant Interim Management Steps
Although preparation of an airshed management plan, with stakeholder input, is required to map future activities to achieve air quality objectives over the longer term, some measures should be implemented now to address priority management requirements. The recommendations are as follows. 6.1 Implementation of the Beehive Burner Elimination Plans
Phase-out of sawmill beehive burners in the airshed is mandated by provincial regulation to occur over the next 1-2 years. Predictions of emission inventories in 2001 was based on current plans to significantly reduce PM10 and VOC emissions in the airshed by replacing these emissions with those from the Canfor MDF plant alone.
The elimination of the Northwood beehive burners is based on a plan that has not yet been incorporated into a permit or regulation. The analysis in this background report shows that reductions of PM10 emissions are necessary to meet the ambient objectives. Since the beehive
20
burners have been shown to be significant PM10 sources, the most effective options in the plan must be implemented as a critical initial step in achieving adequate source reductions. 6.2 Reduction of Street Sanding Dust
The ambient monitoring data at the Plaza station indicates that road dust from winter sanding was likely a critical factor in producing some late winter PM10 episodes. The combination of the high fine silt content of the sand, and the higher frequency of overnight inversions during several weeks preceding street cleaning, has produced some of the highest levels and the longest episodes of PM10.
Street sanding dust is likely also an important factor in other areas of the airshed, but the absence of continuous monitors at all stations except Plaza and Gladstone prevents detection of PM10 episodes elsewhere.
Given the significance of this PM10 source to the downtown area, the City will be initiating the pilot use of coarser aggregate in the downtown area in the winter of 1996/97. This measure is expected to reduce PM10 levels during the following spring. 6.3 Monitoring and Research A number of monitoring and research requirements have been identified in the course of preparing the background report. These are needed to fill gaps in the emission inventories and current ambient monitoring program, and to provide better understanding of the priorities that are expected to be included in the Air Quality Management Plan. Efforts to obtain this information should begin as soon as possible so that the results will be available to address those priorities expected to be required by the Plan. Some of the immediate monitoring and research needs are:
• a PM10 source apportionment study; • improved monitoring of the priority sources to obtain more accurate emission
inventories; • monitoring of additional contaminants in potentially significant sources (e.g. PM10,
NOx, VOC, HAP, CO,); • modeling of the local ozone-forming process to identify NOx and VOC management
needs; • initiation of monitoring in the Hart Highlands residential area; • research on modeling methods to assess the effects of calm winds and inversions on
air quality; • research to determine the need for additional monitoring locations; and • a study of the health of the population.
6.4 Funding Preparation and implementation of the Management Plan, including some of the immediate and longer-term monitoring and research, will require more resources than are available in the budgets of the management agencies. It is necessary that these agencies begin now to identify how adequate resources will be obtained to carry out air quality planning and management. Some of the options are:
• cost-sharing with the priority source owners (splitting of costs based on relative contributions of priority contaminants);
• provincial funds;

21
• fees and taxes; and • special funds.
Although discussion of the pros and cons of each of these options is beyond the scope of this report, the management agencies and their advisors should begin to address funding requirements as soon as agreement to proceed with the planning process is obtained. Funding models such as that used by the Greater Vancouver Regional District should be examined. Acquisition of the airshed planning authority from the provincial government should also be investigated.
7.0The Next Steps
This Background Report will be presented to City Council, the Regional District Board and the Regional Directors of MELP and MOH. The Committee seeks general agreement with the planning and management approaches outlined here, and approval to proceed with the next step, which is consultation with the public and other stakeholders. The Committee also seeks direction from these decision makers on the public consultation process. The report will be released to the public at the same time, and a request for written comments will be publicized. If management approval to proceed is given, the formal public consultation process can be started simultaneously with those immediate monitoring and research projects that are funded. A funding strategy for other planning and management activities should also be developed. The next significant steps in the process should be:
• Release of the background plan for comment and management approval; • Preparation of a strategy for completing the air quality plan; • Carrying out of a public opinion survey; • Formal public consultation, including open houses and stakeholder meetings; • Preparation of a draft air quality management plan, incorporating results of
public and stakeholder consultation; • Release of draft plan for public and stakeholder comment; • Submission of revised plan for management approval; and • Implementation of the air quality plan.
8.0References
Bennett, R.C., R.D. Marsh and R.L. Davis. February 1988. Evaluation of Industrial Total Reduced Sulphur Source Emissions on Prince George Air Quality. Waste Management, Ministry of Environment and Parks. Victoria, B.C. (unpublished). Dann, T. March 1994. Report to the Health Objective Working Group - Ozone Data Analysis for Six and Eight Hour Averages (1980 to 1992). Environment Canada, Environmental Protection Service, Environmental Technology Centre, Ottawa, Ontario. Report No. PMD 94-2.
22
Fisk, Robert, and Vander Kuyl, Wendy. Respiratory Disease Patterns in Northern BC: Focus on Northern Interior Health Unit published by Non-Communicable Disease Epidemiology, British Columbia Centre for Disease Control, Ministry of Health and Ministry Responsible for Seniors, 1996. Knight, K., Leroux, B., Millar, J., and Petkau, A.J., Air Pollution and Human Health: A Study Based on Data from Prince George, B.C. published by the Ministry of Health 1986 and 1988. McNeney, B., and Petkau, A.J., Air Pollution & Human Health: A Follow Up Study Based on Emergency Room Visits. Data from Prince George, B.C. published by the Ministry of Health, Victoria, B.C. 1991. Millar, John S., M.D., Provincial Health Officer, A Report on the Health of British Columbians: Provincial Health Officer’s Annual Report 1995 published by the Ministry of Health and Ministry Responsible for Seniors 1996. Smith, Kirk R., Biofuels, Air Pollution and Health, A Global Review, New York, Plenum Press, 1987. State Pollution Control Authority (Norway). June 1992. Effects of ambient air pollution on health and the environment - air quality guidelines. Oslo, Norway. Sutherland, Dave, Dennis Fudge and Steve Lamble. June 5, 1996. Prediction of the Effects of Beehive Burner Elimination on Air Contaminant Levels in the Prince George Airshed. Ministry of Environment, Lands and Parks, Environmental Protection, Prince George. (unpublished). United States Environmental Protection Agency. 1996a. Background Ozone in the Planetary Boundary Layer Over the United States. Air & Waste Manage. Assoc. 46: 134-141. United States Environmental Protection Agency. September 1985 and updates. Compilation of Air Pollutant Emission Factors. Volume I: Stationary Point and Area Sources. Office of Air Quality Planning and Standards. Research Triangle Park, NC. pg. 13.2.2-3. Vedal, S. June 1995. Health Effects of Inhalable Particles: Implications for British Columbia. Prepared for Air Resources Branch, Ministry of Environment, Lands and Parks, Victoria, B.C. World Health Organization. 1987. Air Quality Guidelines for Europe. WHO Regional Publications, European Series No. 23. Copenhagen, Denmark.
23
9.0APPENDICES APPENDIX A: DEFINITIONS Air Quality is:
“The physical and chemical characteristics of ambient (outside) air that determine its acceptability for human use and environmental protection. Air Quality is generally defined by numerical criteria for individual contaminants, based on human health or other environmental studies. Air quality includes smell and taste as well as the chemical composition of air.”
Air quality management is:
“Administrative activities carried out to implement an air quality management plan, including amendment of permits for industrial and other point contaminant sources, establishment of by-laws and other local and regional regulatory controls on mobile and area contaminant sources, and public education on ways to reduce and eliminate use of air contaminants in everyday activities”
An Air quality management plan is:
“A blueprint for managing community development and for controlling air contaminant sources so as to improve or maintain air quality for the protection of human health and the environment in an airshed”
An Air contaminant is:
“An air borne substance that, when present in the air in sufficient concentrations, is capable of causing human health and other harmful environmental effects”
An Ambient air quality objective is:
“A numerical, non-legal guideline defining an acceptable level of an air contaminant in ambient air. Various levels (A, B and C) are used to define various endpoints (or protection criteria) and degrees of protection. Different averaging periods (1-hour, 24-hour, annual) are also used to indicate the exposure period that is most critical to preventing each defined effect. For example, if protection of vegetation from reduced growth rates is the endpoint, then the Level A, 1-hour SO2 objective must be attained. (See definitions for Levels A, B and C Criteria.)”
An Emission Factor is:
“A numerical factor derived from actual emission measurements from similar sources and normally expressed in a form that allows it to be applied to all similar sources (e.g. kilograms per tonne of finished product). The level of uncertainty in applying emission factors depends on how similar the characteristics of a particular source are to those sources on which the factor is based.”
Levels A, B and C Ambient Air Quality Criteria are:

24
“Level A Criteria are established to provide the basis for an anti-degradation policy for undeveloped areas with an adequate safety margin. For some contaminants, the provincial Level A criteria are equal to the national Maximum Desirable Level, which is the long-term goal for air quality and provides a basis for an anti-degradation policy for unpolluted parts of the country, and for the continuing development of control technology.” “Level B Criteria are established to provide adequate protection against adverse effects on personal health and comfort, animals, vegetation, soil, water, materials and visibility. Comparable to the national Maximum Acceptable Level.” “Level C Criteria are established to provide protection against health effects that are specific to each contaminant. No common definition is used.”
O3 is:
“Groundlevel ozone, which is a compound formed in the lower atmosphere through the reaction of NO2 and other airborne substances, in the presence of ultraviolet light. Reactions between VOC and other highly reactive compounds (free radicals) form NO2 from NO to increase the formation of ozone. Ozone formed at ground level can cause effects on human health and vegetation, whereas O3 formed in the upper atmosphere protects the earth from excessive ultraviolet light levels.”
Permitted Emission Sources are:
“Releases of contaminants under MELP Waste Management Act emission permits, including mostly industrial sources (Table 5).”
PM10 is:
“Fine particulate matter with a maximum particle diameter of 10 microns (µm = one millionth of a meter). Includes particles that are inhalable into the lungs.”
PM2.5 is:
“Ultra-fine particulate matter with a maximum particle diameter of 2.5 µm. The main particulate component of woodsmoke and vehicle emissions.”
The Prince George airshed is:
“ The mass of air contained within the municipal boundaries of Prince George and the immediate surrounding communities of the Regional District, and particularly that air mass contained and affected by the natural topographical features at the confluence of the Nechako and Fraser Rivers”
NOx is:

25
“Nitrogen oxides, which include nitric oxide (NO) and nitrogen dioxide (NOx), and are formed during combustion of fuels from reaction between oxygen and atmospheric nitrogen gas (N2)”
SO2 is:
“Sulphur dioxide, formed from the incineration of TRS during combustion of fuels, and pulping chemicals, and the flaring of hydrogen sulphide during oil and gas processing and refining”
TRS is:
“total reduced sulphur, which includes hydrogen sulphide, dimethyl sulphide and disulphide, and methyl mercaptan, is formed in the absence of oxygen during pulping processes and released primarily from effluent disposal, and is entrained in oil and gas deposits and released during transport, gas processing and oil refining.”
TSP is:
“total suspended particulate, or the portion of total particulate matter that contains particles with maximum diameters of 100 µm.”
VOC is:
“Volatile organic compounds, or carbon containing compounds, are hydrocarbons that form gases when released from combustion, industrial processes, and evaporation of liquid fuel. Natural biological sources release most of the VOC, although man-made sources may predominate in urban airsheds. Some VOC have direct health and environmental effects, other compounds react with other atmospheric gases to promote ozone formation.”

26
APPENDIX B REPORT TABLES
TABLE 1: LOCATION AND TYPE OF AMBIENT AIR QUALITY AND METEOROLOGICAL MONITORS IN PRINCE GEORGE
LOCATION TRS SO2 NO2 O3 PM10 PM2.5 TSP HCHO MET Jail C C Plaza 400 C C C C C D D D C Van Bien D Lakewood C D Gladstone C C D CNR D D BCR D PG Pulp C Northwood Pulp
C
Airport C CBC C Sintich D D C - Continuous monitor reported as hourly readings D - Discontinuous monitor reported as 24-hour readings (three or six day cycle) TRS - Total Reduced Sulphur SO2 - Sulphur Dioxide NO2 - Nitrogen Dioxide O3 - Ozone PM10 - Particulate matter less than 10 micrometers PM2.5 - Particulate matter less than 2.5 micrometers TSP - Total suspended particulates HCHO - Formaldehyde MET - Meteorological measurements, including wind speed and direction and air temperature.
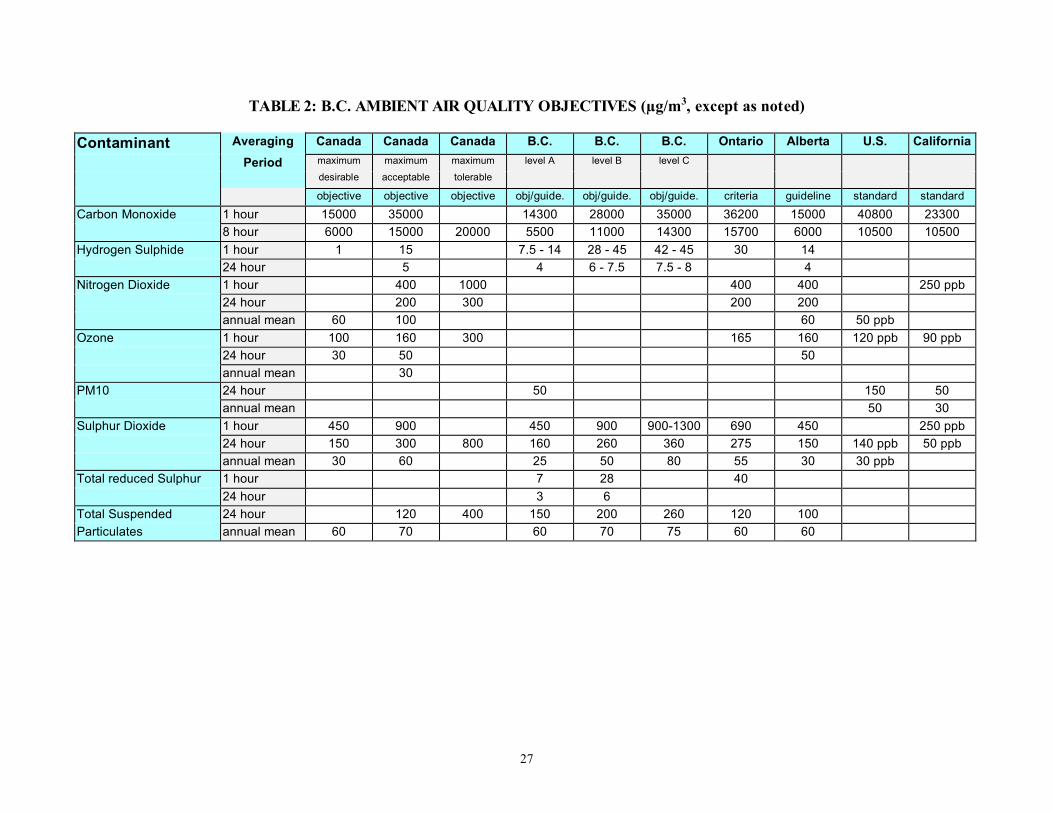
27
TABLE 2: B.C. AMBIENT AIR QUALITY OBJECTIVES (µg/m3, except as noted)
Contaminant Averaging Canada Canada Canada B.C. B.C. B.C. Ontario Alberta U.S. California
Period maximum maximum maximum level A level B level C
desirable acceptable tolerable
objective objective objective obj/guide. obj/guide. obj/guide. criteria guideline standard standard
Carbon Monoxide 1 hour 15000 35000 14300 28000 35000 36200 15000 40800 23300
8 hour 6000 15000 20000 5500 11000 14300 15700 6000 10500 10500
Hydrogen Sulphide 1 hour 1 15 7.5 - 14 28 - 45 42 - 45 30 14
24 hour 5 4 6 - 7.5 7.5 - 8 4
Nitrogen Dioxide 1 hour 400 1000 400 400 250 ppb
24 hour 200 300 200 200
annual mean 60 100 60 50 ppb
Ozone 1 hour 100 160 300 165 160 120 ppb 90 ppb
24 hour 30 50 50
annual mean 30
PM10 24 hour 50 150 50
annual mean 50 30
Sulphur Dioxide 1 hour 450 900 450 900 900-1300 690 450 250 ppb
24 hour 150 300 800 160 260 360 275 150 140 ppb 50 ppb
annual mean 30 60 25 50 80 55 30 30 ppb
Total reduced Sulphur 1 hour 7 28 40
24 hour 3 6
Total Suspended 24 hour 120 400 150 200 260 120 100
Particulates annual mean 60 70 60 70 75 60 60
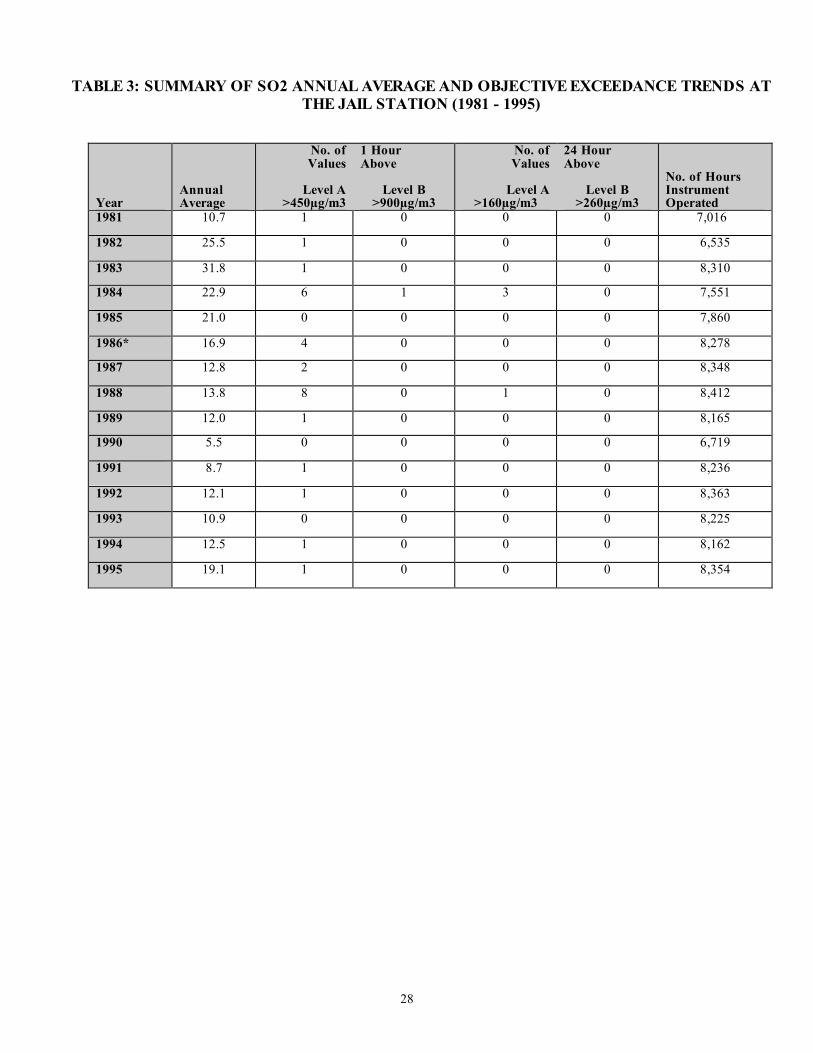
28
TABLE 3: SUMMARY OF SO2 ANNUAL AVERAGE AND OBJECTIVE EXCEEDANCE TRENDS AT THE JAIL STATION (1981 - 1995)
Year
Annual Average
No. of Values
Level A
>450µg/m3
1 Hour Above
Level B >900µg/m3
No. of Values
Level A
>160µg/m3
24 Hour Above
Level B >260µg/m3
No. of Hours Instrument Operated
1981 10.7 1 0 0 0 7,016
1982 25.5 1 0 0 0 6,535
1983 31.8 1 0 0 0 8,310
1984 22.9 6 1 3 0 7,551
1985 21.0 0 0 0 0 7,860
1986* 16.9 4 0 0 0 8,278
1987 12.8 2 0 0 0 8,348
1988 13.8 8 0 1 0 8,412
1989 12.0 1 0 0 0 8,165
1990 5.5 0 0 0 0 6,719
1991 8.7 1 0 0 0 8,236
1992 12.1 1 0 0 0 8,363
1993 10.9 0 0 0 0 8,225
1994 12.5 1 0 0 0 8,162
1995 19.1 1 0 0 0 8,354
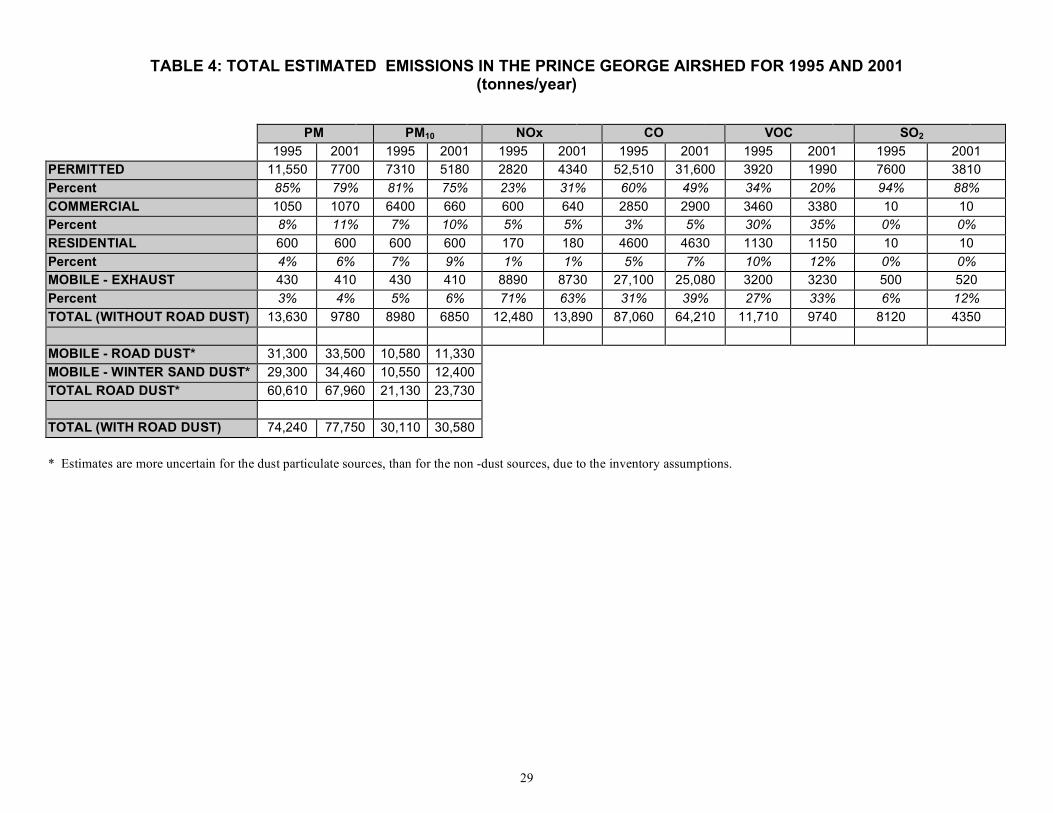
29
TABLE 4: TOTAL ESTIMATED EMISSIONS IN THE PRINCE GEORGE AIRSHED FOR 1995 AND 2001 (tonnes/year)
PM PM10 NOx CO VOC SO2
1995 2001 1995 2001 1995 2001 1995 2001 1995 2001 1995 2001 PERMITTED 11,550 7700 7310 5180 2820 4340 52,510 31,600 3920 1990 7600 3810
Percent 85% 79% 81% 75% 23% 31% 60% 49% 34% 20% 94% 88%
COMMERCIAL 1050 1070 6400 660 600 640 2850 2900 3460 3380 10 10 Percent 8% 11% 7% 10% 5% 5% 3% 5% 30% 35% 0% 0%
RESIDENTIAL 600 600 600 600 170 180 4600 4630 1130 1150 10 10
Percent 4% 6% 7% 9% 1% 1% 5% 7% 10% 12% 0% 0% MOBILE - EXHAUST 430 410 430 410 8890 8730 27,100 25,080 3200 3230 500 520
Percent 3% 4% 5% 6% 71% 63% 31% 39% 27% 33% 6% 12%
TOTAL (WITHOUT ROAD DUST) 13,630 9780 8980 6850 12,480 13,890 87,060 64,210 11,710 9740 8120 4350
MOBILE - ROAD DUST* 31,300 33,500 10,580 11,330
MOBILE - WINTER SAND DUST* 29,300 34,460 10,550 12,400
TOTAL ROAD DUST* 60,610 67,960 21,130 23,730
TOTAL (WITH ROAD DUST) 74,240 77,750 30,110 30,580
* Estimates are more uncertain for the dust particulate sources, than for the non -dust sources, due to the inventory assumptions.

30
TABLE 5: ESTIMATED EMISSIONS FROM INDUSTRIAL PERMITTED SOURCES IN PRINCE GEORGE FOR 1995 AND 2001 (tonnes per year) (Top Five Highlighted)
PM CO NOX VOC SO2 OTHER TOTAL
PA# Name CLASS 1995 2001 1995 2001 1995 2001 1995 2001 1995 2001 1995 2001 1995 2001 tonnes/yr. tonnes/yr. tonnes/yr. tonnes/yr. tonnes/yr. tonnes/yr. tonnes/yr. tonnes/yr. tonnes/yr. tonnes/yr. tonnes/yr. tonnes/yr. tonnes/yr. tonnes/yr.
2559 Northwood Pulp PULP 2926 2926 9699 9699 723 723 477 477 632 632 138 138 14595 14595
1787 Rustad Bros. SAWM 2021 397 11,239 683 101 19 981 88 12 4 14354 1191
1778 Canfor (NOM) SAWM 1570 439 8473 1120 92 35 722 100 13 7 10869 1702
2065 Husky Oil OIL 90 90 5003 5003 92 92 147 147 4505 730 9837 6062
2762 Canfor (Intercon) PULP 922 467 4088 4979 1188 1935 180 57 1211 1214 54 54 7642 8705
2761 Canfor ( PG Pulp) PULP 1195 1195 3902 3902 341 341 168 168 973 973 90 90 6669 6669
5375 Rustad (PG Wood) SAWM 670 66 3928 2 39 9 349 16 3 0 4989 93
4680 Carrier Lumber SAWM 641 120 3513 3 40 13 327 30 3 0 4524 166
1869 Lakeland Mills SAWM 314 314 1271 1271 36 36 118 118 8 8 1747 1747
1796 The Pas Lumber SAWM 403 380 1091 874 26 25 130 111 6 6 1656 1395
1699 Northwood (PG ) SAWM 353 353 2 2 10 10 36 36 0 0 401 401
2119 Westcoast Energy CHEM 6 6 1 1 3 3 0 0 232 232 242 242
9034 FMC of Canada CHEM 3 3 16 16 63 63 151 151 0 0 12 12 245 245
1832 Westhill Lumber SAWM 34 16 117 1 8 7 15 5 0 0 173 29
4530 Northwood (plywd.) OTWD 127 127 6 6 30 30 28 28 0 0 191 191 13600 Canfor's MDF OTWD 517 3859 965 357 0 5698 TOTAL 11,274 7415 52,347 31,419 2792 4306 3828 1890 7598 3806 295 295 78,135 49,131 % OF PERMITTED TOTAL 97.6% 96.3% 99.7% 99.4% 99.0% 99.3% 97.6% 95.1% 99.9% 99.9% 99.4% 99.4% 99.3% 98.8%
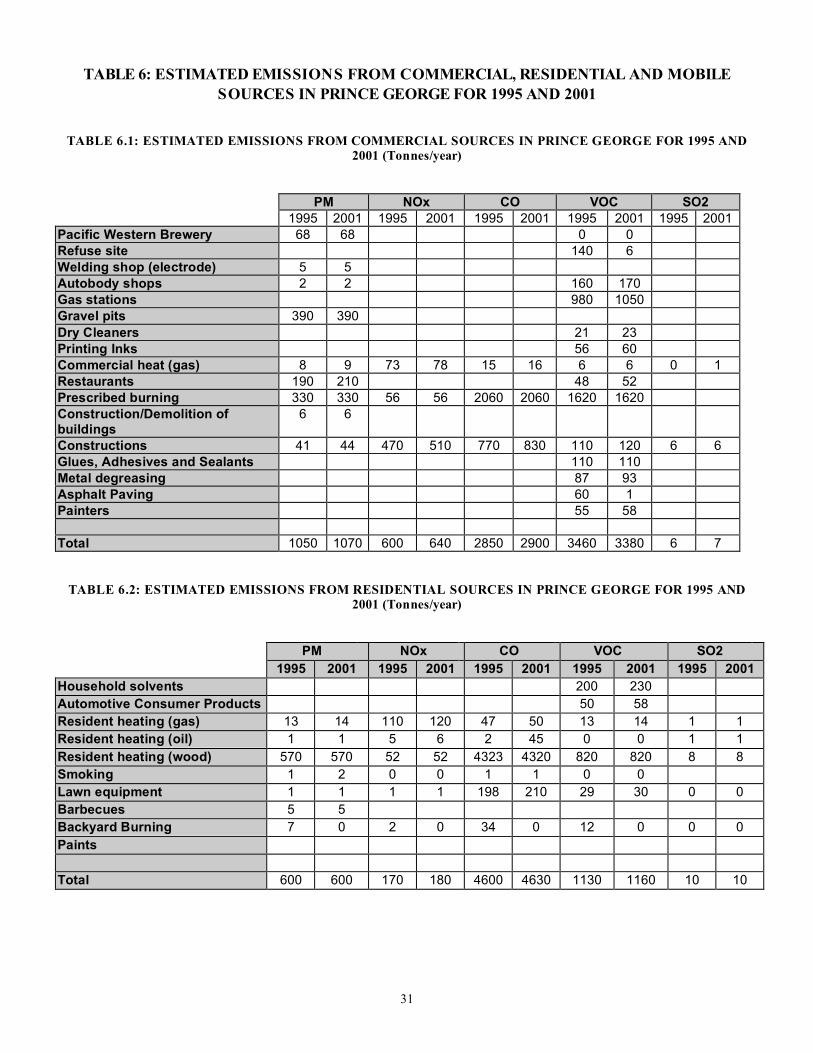
31
TABLE 6: ESTIMATED EMISSIONS FROM COMMERCIAL, RESIDENTIAL AND MOBILE SOURCES IN PRINCE GEORGE FOR 1995 AND 2001
TABLE 6.1: ESTIMATED EMISSIONS FROM COMMERCIAL SOURCES IN PRINCE GEORGE FOR 1995 AND 2001 (Tonnes/year)
PM NOx CO VOC SO2 1995 2001 1995 2001 1995 2001 1995 2001 1995 2001
Pacific Western Brewery 68 68 0 0 Refuse site 140 6 Welding shop (electrode) 5 5 Autobody shops 2 2 160 170 Gas stations 980 1050 Gravel pits 390 390 Dry Cleaners 21 23 Printing Inks 56 60 Commercial heat (gas) 8 9 73 78 15 16 6 6 0 1 Restaurants 190 210 48 52 Prescribed burning 330 330 56 56 2060 2060 1620 1620 Construction/Demolition of buildings
6 6
Constructions 41 44 470 510 770 830 110 120 6 6 Glues, Adhesives and Sealants 110 110 Metal degreasing 87 93 Asphalt Paving 60 1 Painters 55 58
Total 1050 1070 600 640 2850 2900 3460 3380 6 7
TABLE 6.2: ESTIMATED EMISSIONS FROM RESIDENTIAL SOURCES IN PRINCE GEORGE FOR 1995 AND 2001 (Tonnes/year)
PM NOx CO VOC SO2 1995 2001 1995 2001 1995 2001 1995 2001 1995 2001
Household solvents 200 230 Automotive Consumer Products 50 58 Resident heating (gas) 13 14 110 120 47 50 13 14 1 1 Resident heating (oil) 1 1 5 6 2 45 0 0 1 1 Resident heating (wood) 570 570 52 52 4323 4320 820 820 8 8 Smoking 1 2 0 0 1 1 0 0 Lawn equipment 1 1 1 1 198 210 29 30 0 0 Barbecues 5 5 Backyard Burning 7 0 2 0 34 0 12 0 0 0 Paints
Total 600 600 170 180 4600 4630 1130 1160 10 10

32
TABLE 6.3: ESTIMATED EMISSIONS FROM MOBILE SOURCES IN PRINCE GEORGE FOR 1995 AND 2001 (Tonnes/year)
PM PM10 PM2.5 NOx CO VOC SO2 HCHO 1995 2001 1995 2001 1995 2001 1995 2001 1995 2001 1995 2001 1995 2001 1995 2001
Rail 280 280 280 280 250 256 6540 6610 870 880 410 410 390 400 35 35 Aircraft 7 7 7 7 7 7 62 66 190 210 62 67 19 20 9 10 Light duty gas vehicles 15 14 15 14 14 13 560 540 11490 10860 1050 970 21 23 21 19 Light duty gas trucks 13 11 12 11 12 10 400 432 10600 9190 950 850 17 16 19 17 Light duty diesel vehicles 2 1 2 1 2 1 8 7 12 9 5 4 1 1 0 0 Light duty Diesel trucks 6 4 6 4 6 4 29 23 63 48 23 16 2 21 2 1 Heavy duty gas 3 3 3 3 3 3 69 66 1670 1310 100 85 3 3 2 2 Heavy duty diesel 89 66 89 60 82 61 1210 945 1980 2050 550 560 39 42 47 48 motorcycles 0 0 0 0 0 0 2 2 190 200 21 21 1 0 0 0 Propane 0 3 3 20 3 5 47 30 310 24 250 3 Tires 6 7 6 7 3 3 Brakes 15 16 15 16 6 6 SUBTOTAL 430 410 430 410 410 370 8890 8730 27100 25080 3200 3230 500 520 140 140
ROAD DUST Unpaved road dust 27250 29160 9810 10500 2590 2770 Paved road dust (mean silt content)
4060 4340 780 830 360 380
Paved road dust (90%ile of silt content)
23620 25270 4530 4840 2070 2200
Winter Sand on paved roads 29290 34460 10550 12400 2780 3270 SUBTOTAL 60610 67960 21140 23730 5730 6420
Total 61040 68370 21570 24140 6130 6790 8890 8730 27100 25080 3200 3230 500 520 140 140
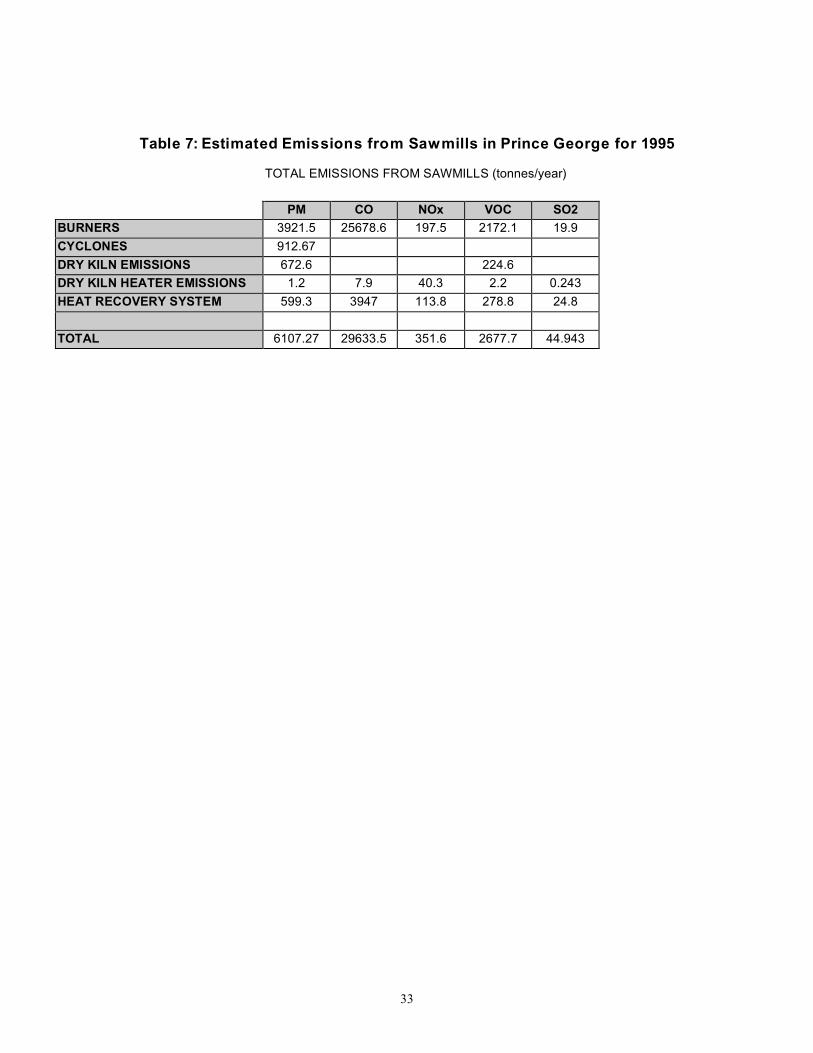
33
Table 7: Estimated Emissions from Sawmills in Prince George for 1995
TOTAL EMISSIONS FROM SAWMILLS (tonnes/year)
PM CO NOx VOC SO2
BURNERS 3921.5 25678.6 197.5 2172.1 19.9
CYCLONES 912.67
DRY KILN EMISSIONS 672.6 224.6
DRY KILN HEATER EMISSIONS 1.2 7.9 40.3 2.2 0.243
HEAT RECOVERY SYSTEM 599.3 3947 113.8 278.8 24.8
TOTAL 6107.27 29633.5 351.6 2677.7 44.943

34
APPENDIX C REPORT FIGURES
FIGURE 1: PRINCE GEORGE AIRSHED

35
FIGURE 2: COMPARISON OF CAUSES OF DEATH TO
STANDARDIZED MORTALITY RATIO
From Provincial Health Officer’s Annual Report

36
FIGURE 3: COMPARISON OF DEATH RATES AND SOCIOECONOMIC INDICATORS IN B.C. HEALTH REGIONS
From Provincial Health Officer’s Report

37
FIGURE 4: COMPARISON OF VARIOUS RESPIRATORY DISEASES AMONG B.C. HEALTH REGIONS
From Provincial Health Officer’s Report

38
FIGURE 5: COMPARISON OF RESPIRATORY HEALTH INDICATORS AMONG WESTERN CANADIAN PROVINCES

39
FIGURE 6: LOCATIONS OF HEALTH REGIONS IN WESTERN CANADA

40
FIGURE 7: COMPARISON OF MAIN CAUSES OF RESPIRATORY MORTALITY TO STANDARD MORTALITY RATIO
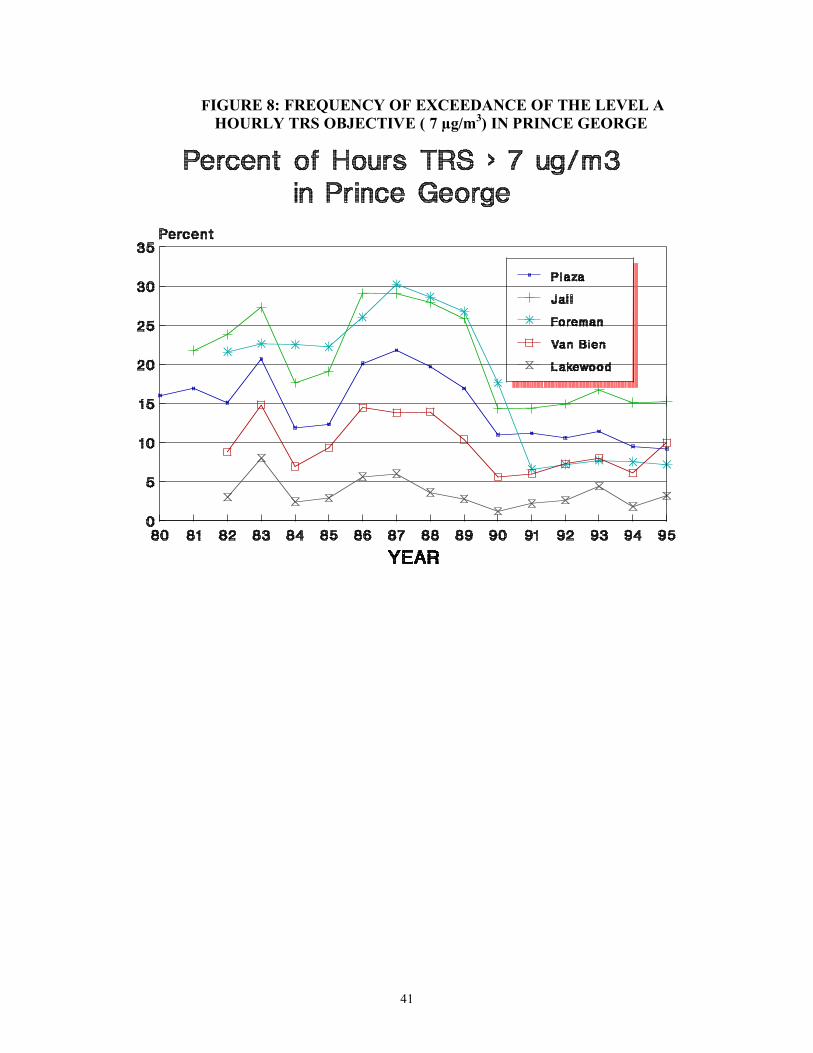
41
FIGURE 8: FREQUENCY OF EXCEEDANCE OF THE LEVEL A HOURLY TRS OBJECTIVE ( 7 µg/m3) IN PRINCE GEORGE
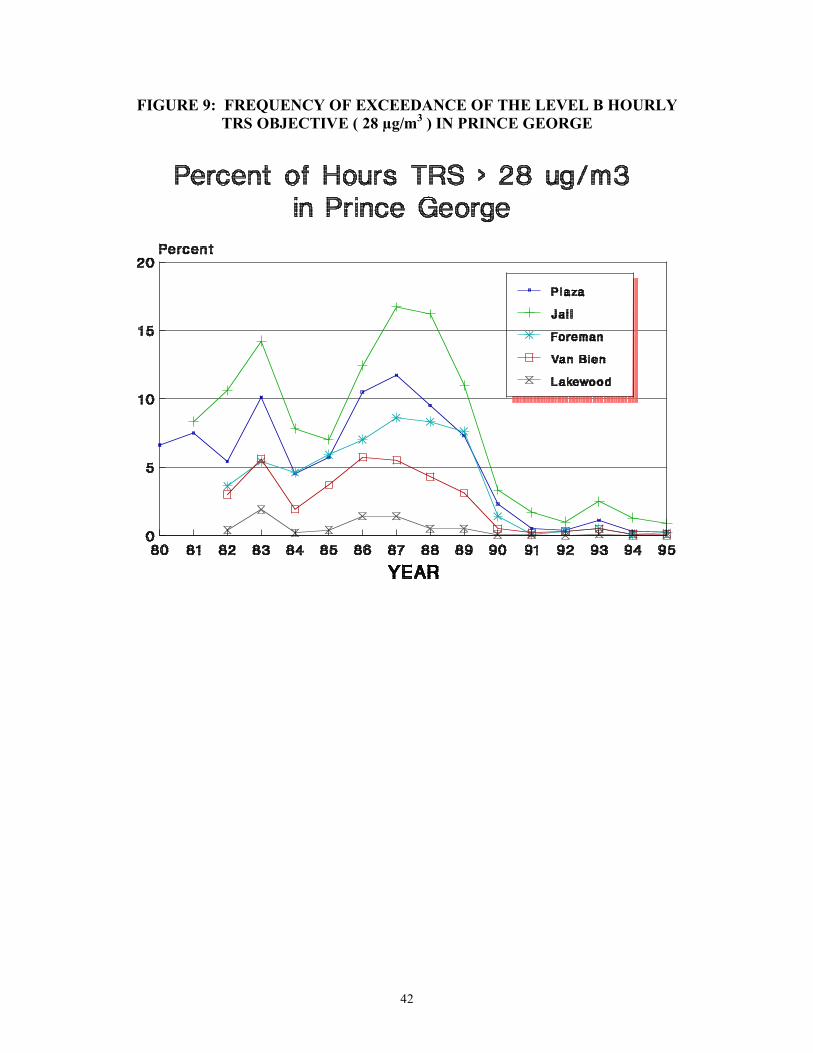
42
FIGURE 9: FREQUENCY OF EXCEEDANCE OF THE LEVEL B HOURLY TRS OBJECTIVE ( 28 µg/m3 ) IN PRINCE GEORGE
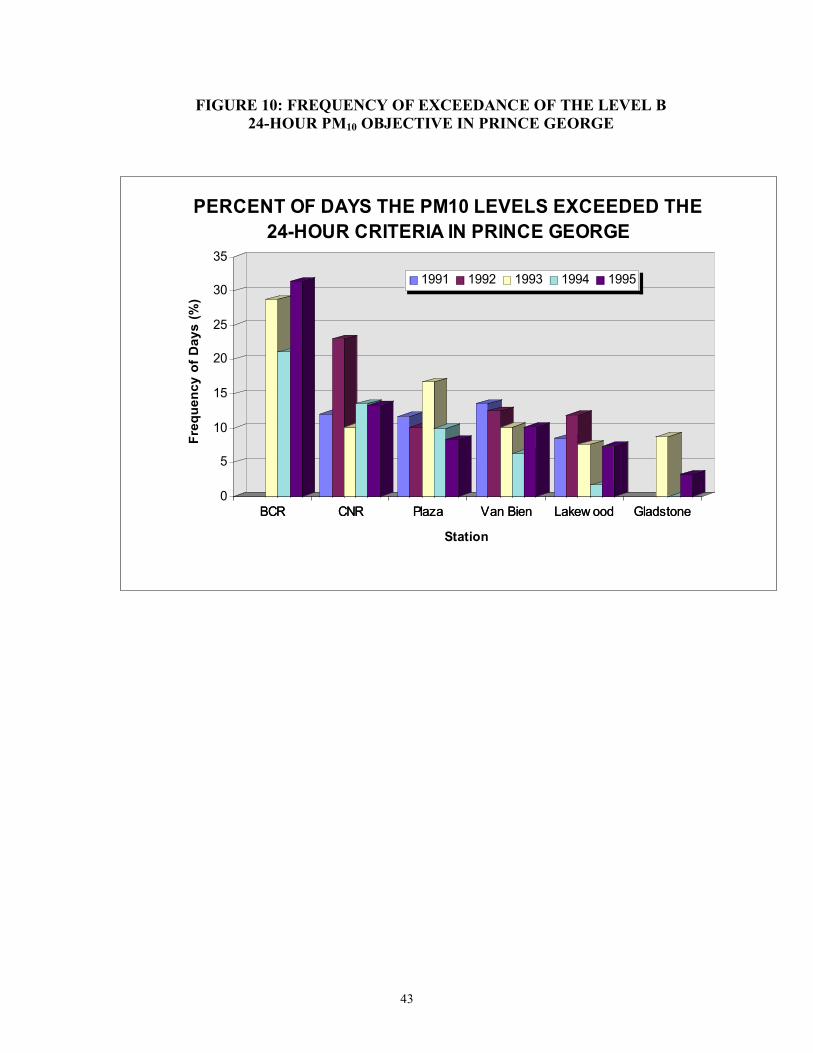
43
FIGURE 10: FREQUENCY OF EXCEEDANCE OF THE LEVEL B 24-HOUR PM10 OBJECTIVE IN PRINCE GEORGE
BCR CNR Plaza Van Bien Lakew ood Gladstone
0
5
10
15
20
25
30
35
Fre
qu
en
cy
of
Da
ys
(%
)
BCR CNR Plaza Van Bien Lakew ood Gladstone
Station
PERCENT OF DAYS THE PM10 LEVELS EXCEEDED THE
24-HOUR CRITERIA IN PRINCE GEORGE
1991 1992 1993 1994 1995