prime retail exposure in key asia pacific cities (valued
TRANSCRIPT
1,303
1,327
1,498
2,209
2,1031,982
2,654
2,710
2,713
2,854
3,116
3,1373,136
3,118
3,0652,941
2,965
5559
6975
82
9196
111 114 117110
103 10177
88
58
6977
96107
130
144 148158 157
170 167162 159
132
135
81
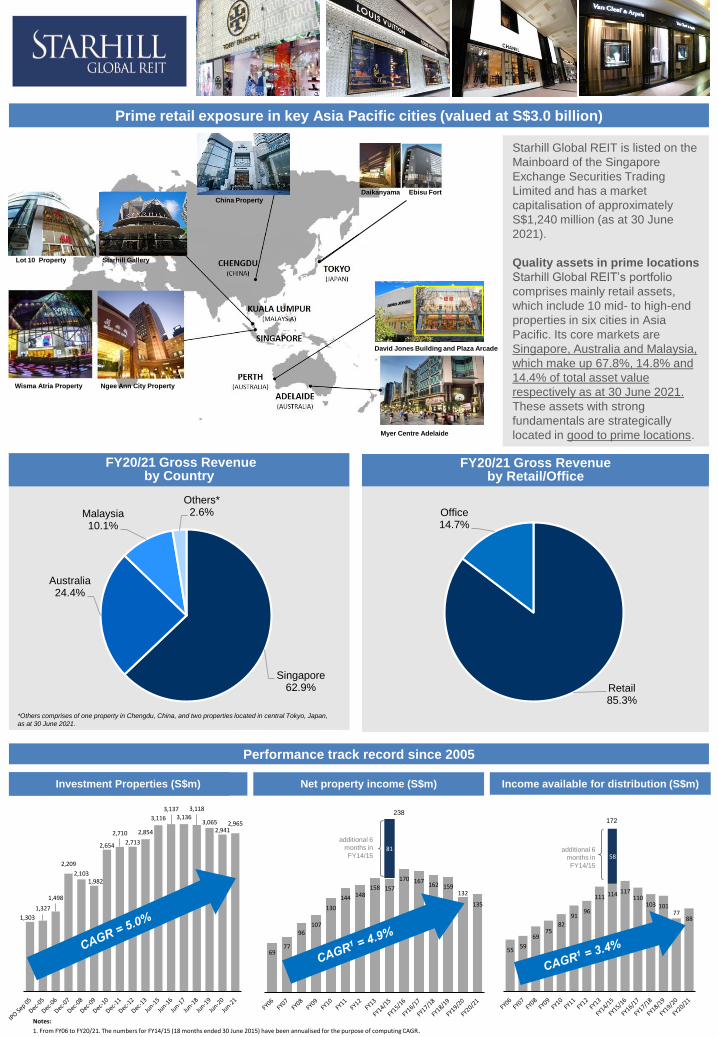
Prime retail exposure in key Asia Pacific cities (valued at S$3.0 billion)
Starhill Global REIT is listed on the
Mainboard of the Singapore
Exchange Securities Trading
Limited and has a market
capitalisation of approximately
S$1,240 million (as at 30 June
2021).
Quality assets in prime locations
Starhill Global REIT’s portfolio
comprises mainly retail assets,
which include 10 mid- to high-end
properties in six cities in Asia
Pacific. Its core markets are
Singapore, Australia and Malaysia,
which make up 67.8%, 14.8% and
14.4% of total asset value
respectively as at 30 June 2021.
These assets with strong
fundamentals are strategically
located in good to prime locations.
Performance track record since 2005
FY20/21 Gross Revenue by Retail/Office
Asset Value (S$m) Net property income (S$m) Income available for distribution (S$m)Investment Properties (S$m)
238
172
Notes:
1. From FY06 to FY20/21. The numbers for FY14/15 (18 months ended 30 June 2015) have been annualised for the purpose of computing CAGR.
additional 6
months in
FY14/15 additional 6
months in
FY14/15
Lot 10 Property Starhill Gallery
Wisma Atria Property Ngee Ann City Property
China Property
Daikanyama Ebisu Fort
David Jones Building and Plaza Arcade
Myer Centre Adelaide
FY20/21 Gross Revenueby Country
Singapore62.9%
Australia24.4%
Malaysia10.1%
Others*2.6%
Retail 85.3%
Office14.7%
*Others comprises of one property in Chengdu, China, and two properties located in central Tokyo, Japan,
as at 30 June 2021.

DPU Performance
YTL CORPORATIONDual-listed (Malaysia and Tokyo)
Combined market cap with its listed entities in
Malaysia as at 30 June 2021: US$4.1bn
Resilient retail portfolio occupancyBalance of master / anchor leases
and actively-managed leases
Contact us:
Investor Relations and Corporate Communications
Email: [email protected]
Key financial ratios
Strong sponsor
2H FY20/21
Gearing 36.1%
Average interest rate p.a. 3.28%(1)
Unencumbered assets ratio 81%
Fixed/hedged debt ratio 91%(2)
Weighted average debt maturity 3.3 years
Corporate rating (Fitch)BBB with stable
outlook
YTL Group Holdings ~37.7%
Free Float ~55%
NAV per unit S$0.81
International tenants
Notes:
1. Includes interest rate derivatives and benchmark rates but excludes upfront costs.
2. Includes interest rate swaps.
Note:
1. Consists mainly of Toshin Development Singapore, YTL Group, Myer and David Jones. Excludes tenants’
option to renew or pre-terminate.
Principal business activities include:
• Property development / real estate
• Infrastructure / utilities
• Industrial manufacturing
2 listed REITs
Listed on the mainboard of Singapore Stock Exchange.
Focused on prime retail and office properties. YTL Group
holds approximately 37.7% unitholdings.
Listed on the Main Market of Bursa Malaysia Securities
Berhad. Focused on prime hotel and hospitality-related
properties. Portfolio includes the JW Marriott Hotel & The
Ritz-Carlton, in Kuala Lumpur, as well as hotels in other
parts of Malaysia, Australia and Japan. YTL Corporation
holds about 55% of unitholdings.
Retail occupancy at 97.5%(2)
Notes:
1. DPU from 1Q 2006 to 2Q 2009 have been restated to include the 963,724,106 rights
units issued in August 2009.
2. Following the change of SGREIT’s financial year end from 31 December to 30 June,
FY14/15 refers to the 18-month period from 1 January 2014 to 30 June 2015.
3. The reported number excludes the deferral of $7.7 million distributable income or
0.35 cents per unit, as allowed under COVID-19 relief measures.
4. Includes release of 0.14 cents per unit of FY19/20 deferred distributable income for
1H FY20/21.
5. Includes release of 0.21 cents per unit of FY19/20 deferred distributable income for
2H FY20/21.
97.3%
99.2%99.6%
96.6%95.4%
98.2%98.7% 99.4%
99.4%98.2%
95.1%95.5%
94.2%
96.3%96.2%
96.3%
Dec-05 Dec-06 Dec-07 Dec-08 Dec-09 Dec-10 Dec-11 Dec-12 Dec-13 Jun-15 Jun-16 Jun-17 Jun-18 Jun-19 Jun-20 Jun-21
Notes:
1. Based on commenced leases as at reporting date. For prior years, the reported occupancy rates were based on
committed leases, which include leases that have been contracted but have not commenced as at the reporting date.
2. Based on committed leases as at reporting date.
(as at 30 June 2021)
1
Portfolio occupancy
2.90 3.10 3.58 3.80 3.90 4.12 4.39
5.11 5.18 4.92 4.55 4.48
2.26 1.88
2.49
0.702.07
-
1.00
2.00
3.00
4.00
5.00
6.00
7.00
8.00
FY2006 FY2007 FY2008 FY2009 FY2010 FY2011 FY2012 FY2013 FY14/15 FY15/16 FY16/17 FY17/18 FY18/19 FY19/20 FY20/21
Cents (1)
5.00
FY14/15 (18 months) (2)
7.60
(5)
FY19/202.96 (3)
2H
1H
FY20/21
3.95 (4)(5)
11
1
Master leases / anchor leases, with
periodic rent reviews51.5% (1)
Actively-managed
leases48.5%
(4)
Important Notice
The value of units in Starhill Global REIT (“Units”) and the income derived from them may fall or rise. The Units are not
obligations of, deposits in, or guaranteed by, the Manager or any of its affiliates. An investment in Units is subject to
investment risks, including possible delays in repayment, loss of income or principal invested. The Manager and its
affiliates do not guarantee the performance of Starhill Global REIT or the repayment of capital from Starhill Global REIT
or any particular rate of return. Investors have no right to request the Manager to redeem their Units while the Units are
listed.
It is intended that Unitholders may only deal in their Units through trading on the SGX-ST. Listing of the Units on the
SGX-ST does not guarantee a liquid market for the Units. This document is for information only and does not constitute
an invitation or offer to acquire, purchase or subscribe for the Units. The past performance of Starhill Global REIT is not
necessarily indicative of the future performance of Starhill Global REIT.
This document may contain forward-looking statements that involve risks and uncertainties. Actual future performance,
outcomes and results may differ materially from those expressed in forward-looking statements as a result of a number
of risks, uncertainties and assumptions. Representative examples of these factors include (without limitation) general
industry and economic conditions, outbreak of contagious diseases or pandemic, interest rate and foreign exchange
trends, cost of capital and capital availability, competition from similar developments, shifts in expected levels of
property rental income, changes in operating expenses (including employee wages, benefits and training costs),
property expenses and governmental and public policy changes. Investors are cautioned not to place undue reliance
on these forward-looking statements, which are based on the Manager’s view of future events.