primary health care system level indicators - pcnpmo.ca · confidential – content not for...
TRANSCRIPT
Primary Health Care
System Level Indicators
1
Presentation
March 2015
Confidential – Content not for distribution.
Presentation Outline
• Background
– Alberta's Primary Health Care Strategy
– Evaluation Framework and Logic Model
– Measurement and Evaluation Working Group
• Progress to Date
• PHC System Level Indicators
• Challenges
• Timing
• Supports
2

Confidential – Content not for distribution.
Faculty/Presenter Disclosure
• Faculty
−Allison Larsen
• Relationships with commercial interests
−No relationships with commercial interests
3
Confidential – Content not for distribution.
Disclosure of Commercial Support
− This program has received no financial support or in-
kind funding from commercial organizations
Potential for conflict(s) of interest:
– None
Mitigating Potential Bias:
− As the program received no commercial support or in-
kind funding, there are no sources of bias to mitigate
− Sessions were planned based on input from a planning
committee that included physicians
4
Confidential – Content not for distribution.
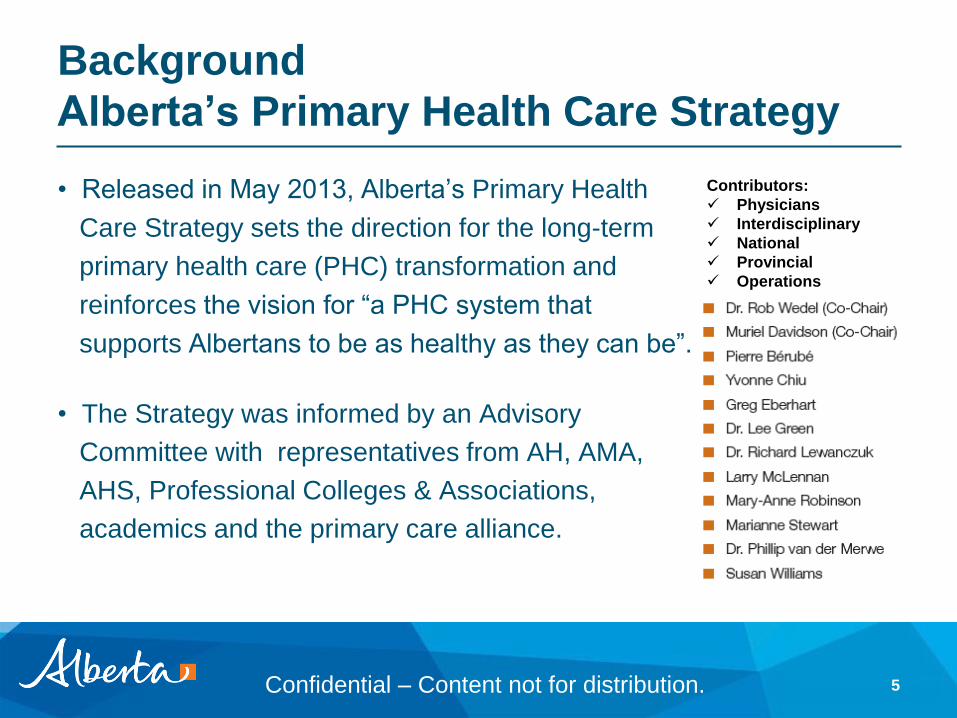
Background
Alberta’s Primary Health Care Strategy
5
• Released in May 2013, Alberta’s Primary Health
Care Strategy sets the direction for the long-term
primary health care (PHC) transformation and
reinforces the vision for “a PHC system that
supports Albertans to be as healthy as they can be”.
• The Strategy was informed by an Advisory
Committee with representatives from AH, AMA,
AHS, Professional Colleges & Associations,
academics and the primary care alliance.
Contributors:
Physicians
Interdisciplinary
National
Provincial
Operations

Confidential – Content not for distribution.
Background
Alberta’s Primary Health Care Strategy
• The Strategy involves 14 goals based on three strategic directions:
enhancing the delivery of care, bringing about cultural change and
establishing building blocks for change.
• Three strategic directions will result in six key outcomes:
– Attachment – all Albertans have a health home and are attached to a physician;
– Access – Albertans have timely access to a primary health care team;
– Quality – clinical and social supports come together to promote wellness
– Self Management – Albertans are involved in their care
– Improvements in Health Status and Care Experience – Albertans have better
health overall and report positive experiences
– Provider Engagement and Satisfaction – providers are satisfied and happy with
their work lives and able to provide quality care.
6
Confidential – Content not for distribution.
Background
PHC Evaluation Framework
• The PHC Evaluation Framework will guide evaluation activities and
performance reporting of Alberta’s PHC system and address
concerns put forth by Alberta’s Office of the Auditor General in their
2012 Report.
• The Framework includes goals from the PHC Strategy that highlight
the Department’s approach to performance measurement.
• The Measurement and Evaluation Working Group (MEWG) was
established to support the implementation of the Primary Health Care
Evaluation Framework by providing recommendations and advice
relating to performance measurement and evaluation activities that
focus on improving quality and outcomes.
7
Confidential – Content not for distribution.
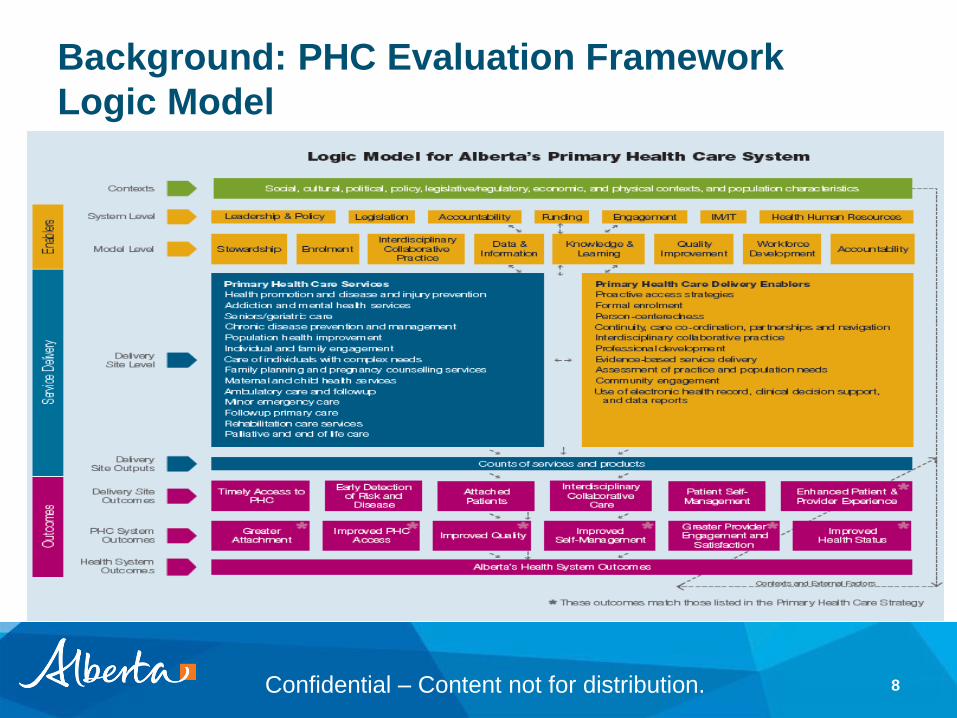
Background: PHC Evaluation Framework
Logic Model
8
Confidential – Content not for distribution.
Background : System Level Indicators
• There is a need for standardized indicators to measure the impact of
ongoing innovation on patient and population health outcomes..
• These System level indicators will inform Albertans of the progress
being made in primary health care.
• The indicators flow from the Primary Health Care Evaluation
Frameworkalign and align with the outcomes listed in the Primary
Health Care Strategy.
• Selected indicators are useful in quality improvement initiatives at the
PCN and provider level.
• PHC System Level Indicators were confirmed by the MEWG in
September 2014.
9

Confidential – Content not for distribution.
Progress to Date
• Eight indicators included in the requirements of PCN funding
agreements in October 2014.
• Guideline prepared to explain the indicators and provide a summary
of expectations.
• Focus groups held for further input on acceptability, clarity of
instructions and implementation challenges.
• Measurement and Evaluation Working Group to work toward an
implementation package for each indicator.
10

Confidential – Content not for distribution.
PHC System Level Indicators
• The indicators furthest along in readiness for implementation:
1. Time to third next available appointment with a provider for the fiscal
year
2. Percent of recommended screens that the clinic has offered to paneled
patients
3. Percentage of patients answering satisfied or very satisfied to the
question – Overall, how satisfied are you with the care you get from the
clinic?
11
Confidential – Content not for distribution.
PHC System Level Indicators
Continued . . .
4. Percent of patients who are returning to the same provider at the clinic
for a subsequent visit
5. The percentage of identified team members responding to a team
effectiveness survey
6. Percent of paneled patients with a chronic disease who were offered
self-management supports during the fiscal year
7. Percent of paneled patients with a chronic disease who report
maintaining or improving quality of life as measured by the EQ-5D tool
during the fiscal year
12

Confidential – Content not for distribution.
1. Time to third next available appointment
with a provider for the fiscal year
13
Rationale
A measure of access to primary health care services.
The most common measure of access in Alberta.
Can be used, along with related information, to identify system
constraints such as:
availability of providers;
information on where patients ultimately go for services when
there is limited access; and
need for workflow improvements in a PCN.

Confidential – Content not for distribution.
1. Time to third next available continued…
14
Calculation
The number of providers:
Reporting an average of 0 to .99 (same day access) ____________
Reporting an average of 1.00 to 4.99 ____________
Reporting an average of 5.00 to 8 .99 ____________
Reporting an average of 9.00 to 21.99 ____________
Reporting an average of 22+ ____________
Total number of providers reporting ____________
Confidential – Content not for distribution.
2. Percent of recommended screens that
the clinic has offered to paneled patients
15
Rationale
Appropriate screening identifies health risks earlier so that action
can be taken to improve health outcomes.
Measurement encourages standardized screening across the
province.
ASaP has determined which screens are appropriate based on
evidence.
Tracking screening compliance provides information that can be
analysed along with related information to identify:
the long-term impact on health outcomes
need for workflow improvements in a PCN
Confidential – Content not for distribution.
2. Percent of recommended screens
continued…
16
Calculation (for each maneuver)
Numerator – total number of paneled patients meeting the screening
criteria that were offered a screen (inferred screen may be counted where
offers are not documented)
Denominator – total number of paneled patients meeting the screening
criteria
Other considerations
The guideline proposes that providers can select the maneuvers to be
measured (minimum of four).

Confidential – Content not for distribution.
3. Percentage of patients answering satisfied or very
satisfied to the question – Overall, how satisfied
are you with the care you get from the clinic?
17
Rationale
A measure of the Patient Experience
Satisfied patients tend to take a more active role in their own
treatment.
Regular measurement of patients’ experience, including
satisfaction, will help PHC organizations make appropriate,
evidence based changes to processes to improve patient
experience and, ultimately, health outcomes.

Confidential – Content not for distribution.
3. Percentage of patients answering satisfied or very
satisfied continued…
18
Calculation
Numerator – total number of patients answering satisfied or very satisfied
to the survey question.
Denominator – total number of patients answering the survey question.
Other considerations
The single patient satisfaction results will be the information flowing to AH.
The expectation is that this will be part of a broader patient experience
survey.
The specific survey has not been identified.
Consultation with PCNs will be a very important part of the survey
selection process.

Confidential – Content not for distribution.
4. Percent of patients returning to the same
provider at the clinic for a subsequent visit
19
Rationale
Evidence shows that individuals who have a continuous relationship
with a primary care provider or team:
Receive higher rates of preventive care;
Make fewer visits to the emergency department;
Have lower hospitalization rates;
Experience better management of acute and chronic illness; and
Tend to report increased satisfaction with their care.
This indicator will provide information on the extent of patient
continuity.
Can be analyzed along with the underlying data sets to support
improved panel management leading to better health outcomes.
Confidential – Content not for distribution.
4. Percent of patients returning to the same
provider at the clinic continued…
20
Calculation
Numerator –total number of visits by the providers panel to the provider
Denominator – total number of visits by the providers panel to any provider
Other considerations
The best approach to extracting, compiling and reporting continuity is to be
determined.

Confidential – Content not for distribution.
5. The percentage of identified team members
responding to a team effectiveness survey
21
Rationale
A measure of progress toward enhancing the delivery of care
through the creation of health homes with teams of providers.
Surveying team effectiveness and acting on the results will help
PCNs make improvements over time.
Survey results at the local level can facilitate improved team
function leading to a more satisfying work experience for providers
and better health services for patients.

Confidential – Content not for distribution.
5. Team effectiveness survey continued...
22
Calculation
Numerator – number of people responding to a team effectiveness survey
Denominator – number of people identified as working in a interdisciplinary
collaborative care team
Confidential – Content not for distribution.
6. Percent of paneled patients with a chronic
disease who were offered self-management
supports during the fiscal year
23
Rationale
Self-management is:
one of the six outcomes identified in the Primary Health Care
Strategy.
consistent with the principle of person-centered care where
individuals partner with their health team to meet their health goals.
Self-management support is provided to help a patient physically,
socially and emotionally manage their chronic condition.
Can include programs, tools and policies
Can be undertaken by the patient, and/or provided by non-profit or non-
government groups, and their communities.
This indicator will help PHC organizations measure their progress
towards involving patients as partners in their care.
Confidential – Content not for distribution.
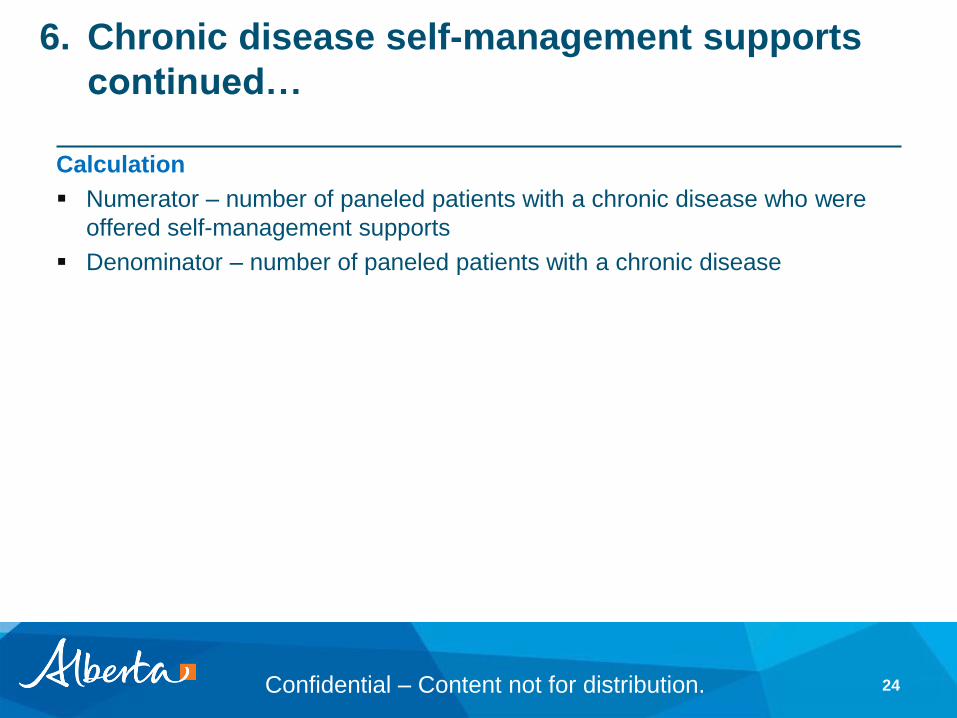
6. Chronic disease self-management supports
continued…
24
Calculation
Numerator – number of paneled patients with a chronic disease who were
offered self-management supports
Denominator – number of paneled patients with a chronic disease

Confidential – Content not for distribution.
7. Percent of paneled patients with a chronic disease
who report maintaining or improving quality of life as
measured by the EQ-5D tool during the fiscal year
25
Rationale
Measuring outcomes from a patient’s perspective is an important
aspect of determining the success of the health system.
Self-reported health status is a broad multidimensional concept
that includes subjective evaluations of both positive and negative
aspects of life.
Measurement of self-reported health status over time, particularly
before, during, and after participation in a program, can inform
whether health status has been maintained and/or improved in a
patient-centred way.
Information relating to changes over time can support program
evaluation and quality improvement.
Confidential – Content not for distribution.
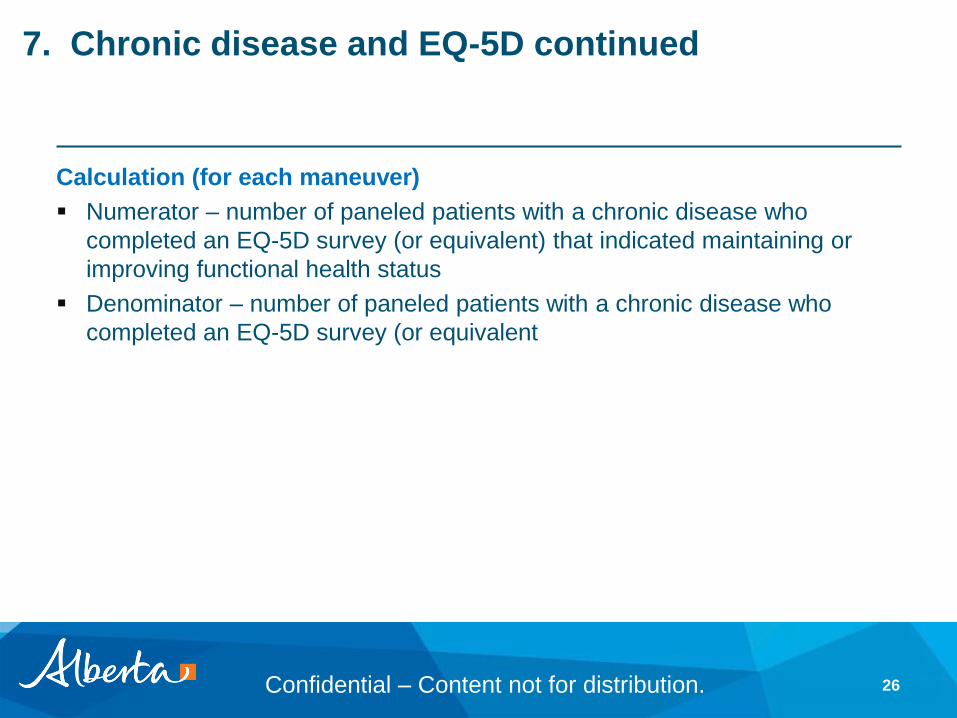
7. Chronic disease and EQ-5D continued
26
Calculation (for each maneuver)
Numerator – number of paneled patients with a chronic disease who
completed an EQ-5D survey (or equivalent) that indicated maintaining or
improving functional health status
Denominator – number of paneled patients with a chronic disease who
completed an EQ-5D survey (or equivalent

Confidential – Content not for distribution.
Summary of Opportunities and
Challenges
Efficient indicator reporting requires standardized definitions, consistent
measurement methodology and common reporting protocols.
– Goal is high quality information on a timely basis to support clinical
practices;
– Will be supported by:
• utilization of EMRs;
• automated data extracts and data sharing; and
• collaboration on how to best use existing EMRs.
Challenges
– Variability across PCNs in EMR implementation;
– Several different EMRs are in place; and
– Variability in measurement and reporting process across PCNs
27

Confidential – Content not for distribution.
Summary of Opportunities and
Challenges - Continued . . .
Changes and improvements in service delivery will facilitate
achievement of positive outcomes including:
– Better health outcomes
– Value for money
– Improved patient and provider experience
Challenges
– Setting appropriate targets and expectations
– Support for change at the provider level including new work
processes and other enablers
28

Confidential – Content not for distribution.
Supports
• Measurement and Evaluation Working Group will:
– Be a conduit for feedback from all parts of the system
– Suggest practical solutions to implementation challenges
– Direct the changes in indicators as they evolve
• Toolkit
– Toolkits providing more information to support implementation will
be developed for each indicator
• Support for indicator reporting by PCNs will be provided by the PCN
Program Management Office
29
Confidential – Content not for distribution.
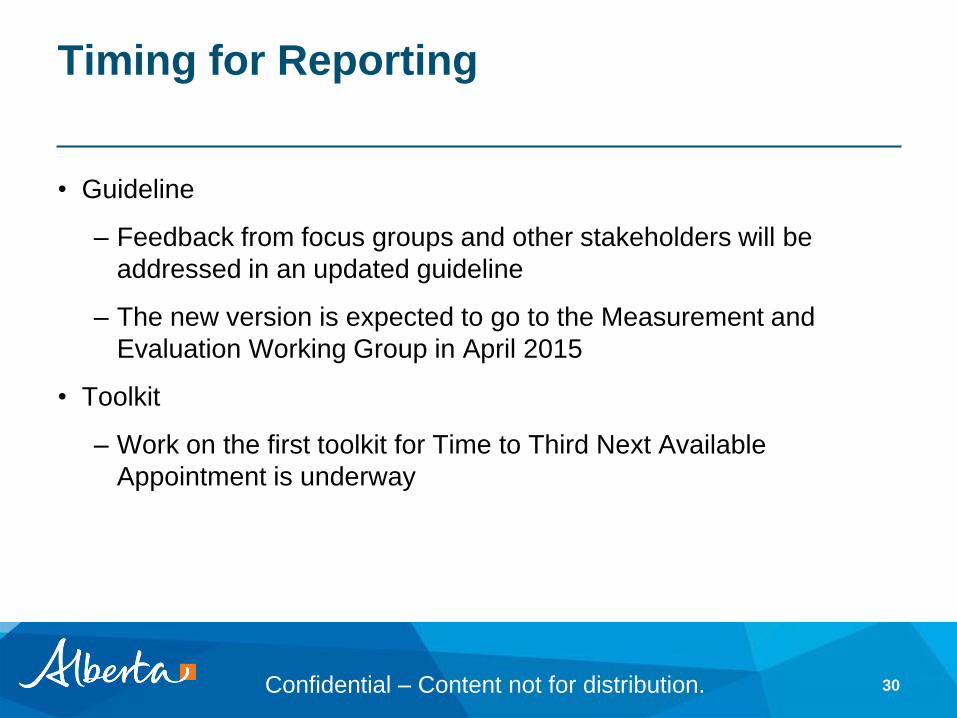
Timing for Reporting
• Guideline
– Feedback from focus groups and other stakeholders will be
addressed in an updated guideline
– The new version is expected to go to the Measurement and
Evaluation Working Group in April 2015
• Toolkit
– Work on the first toolkit for Time to Third Next Available
Appointment is underway
30
Confidential – Content not for distribution.
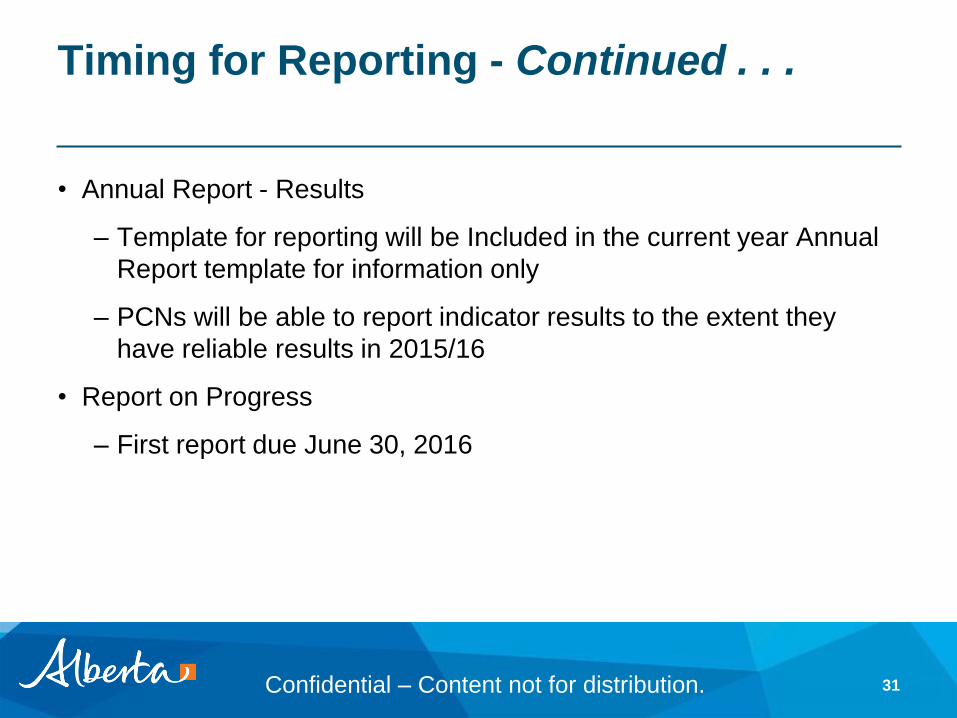
Timing for Reporting - Continued . . .
• Annual Report - Results
– Template for reporting will be Included in the current year Annual
Report template for information only
– PCNs will be able to report indicator results to the extent they
have reliable results in 2015/16
• Report on Progress
– First report due June 30, 2016
31

Confidential – Content not for distribution.
Questions?
32