pricing strategies for reducing obesity - bridging the gap ... · pricing strategies for reducing...
TRANSCRIPT
Pricing Strategies for Reducing Obesity
2011 Leadership for Health Communities Childhood Obesity Prevention Summit
Making the Connection: Effective Approaches to Preventing Childhood Obesity
Washington DC, September 8, 2011
Frank J. Chaloupka, PhD
Distinguished Professor of Economics and Public Health
University of Illinois at Chicago
2 www.bridgingthegapresearch.org
Overview
• Why Pricing Strategies?
• What Pricing Strategies?
• Food Prices, Consumption and Obesity
• Beverage Taxes, Consumption and Obesity
• Pricing Policies to Promote Activity
Thanks to Lisa Powell, Jamie Chriqui, and other Bridging
the Gap colleagues
3 www.bridgingthegapresearch.org
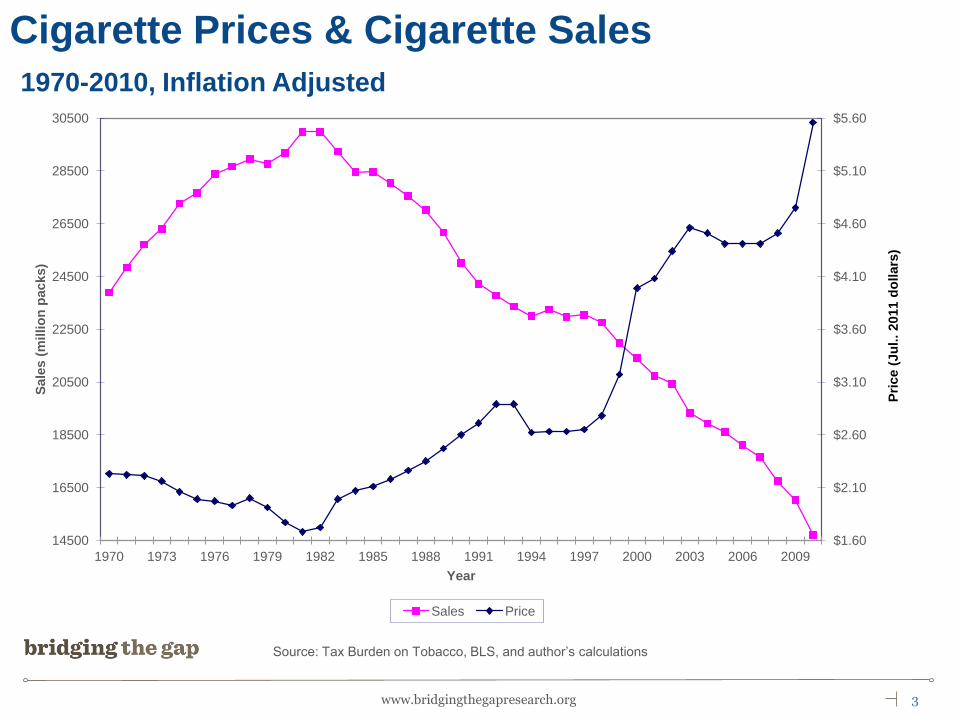
Cigarette Prices & Cigarette Sales
1970-2010, Inflation Adjusted
Source: Tax Burden on Tobacco, BLS, and author’s calculations
$1.60
$2.10
$2.60
$3.10
$3.60
$4.10
$4.60
$5.10
$5.60
14500
16500
18500
20500
22500
24500
26500
28500
30500
1970 1973 1976 1979 1982 1985 1988 1991 1994 1997 2000 2003 2006 2009
Pri
ce (
Ju
l..
2011 d
oll
ars
)
Sale
s (
millio
n p
acks)
Year
Sales Price
4 www.bridgingthegapresearch.org
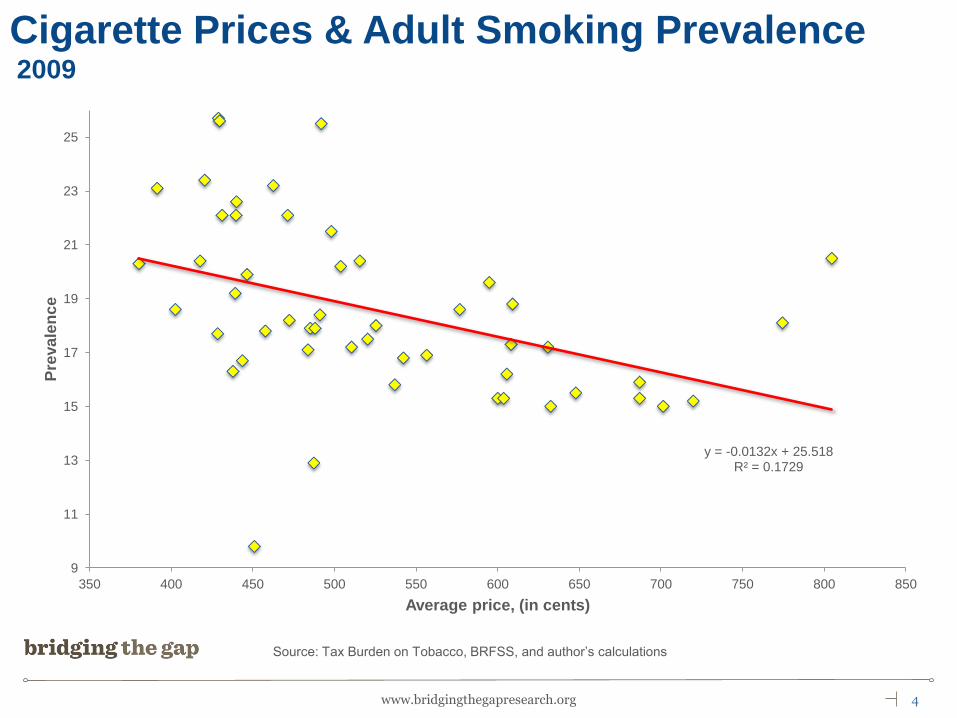
Cigarette Prices & Adult Smoking Prevalence 2009
Source: Tax Burden on Tobacco, BRFSS, and author’s calculations
y = -0.0132x + 25.518 R² = 0.1729
9
11
13
15
17
19
21
23
25
350 400 450 500 550 600 650 700 750 800 850
Pre
va
len
ce
Average price, (in cents)
5 www.bridgingthegapresearch.org
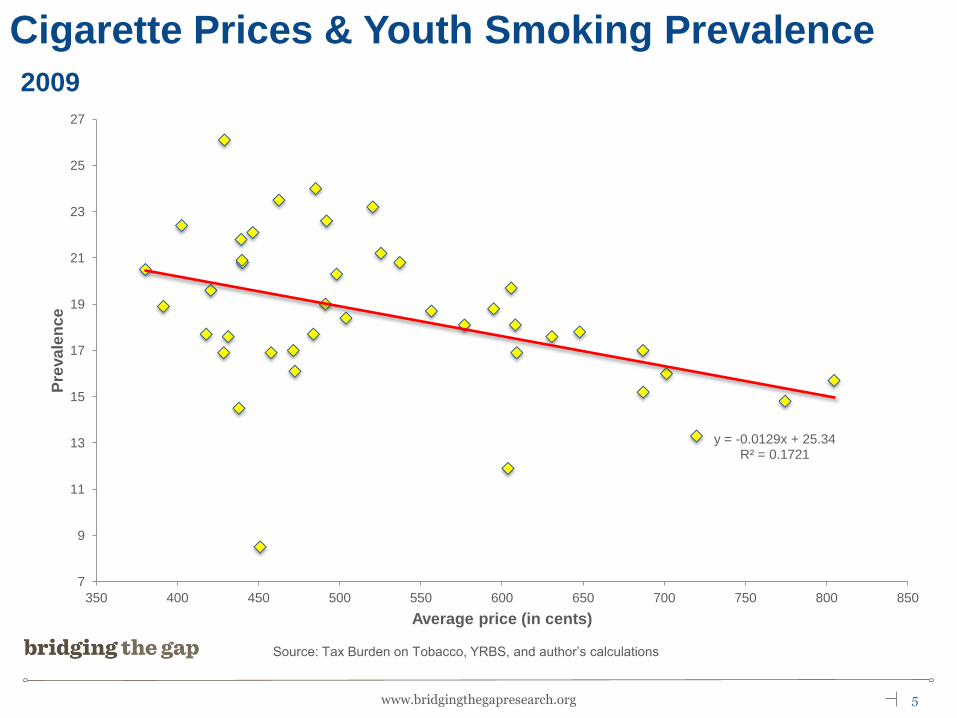
Cigarette Prices & Youth Smoking Prevalence
2009
Source: Tax Burden on Tobacco, YRBS, and author’s calculations
y = -0.0129x + 25.34 R² = 0.1721
7
9
11
13
15
17
19
21
23
25
27
350 400 450 500 550 600 650 700 750 800 850
Pre
va
len
ce
Average price (in cents)
6 www.bridgingthegapresearch.org
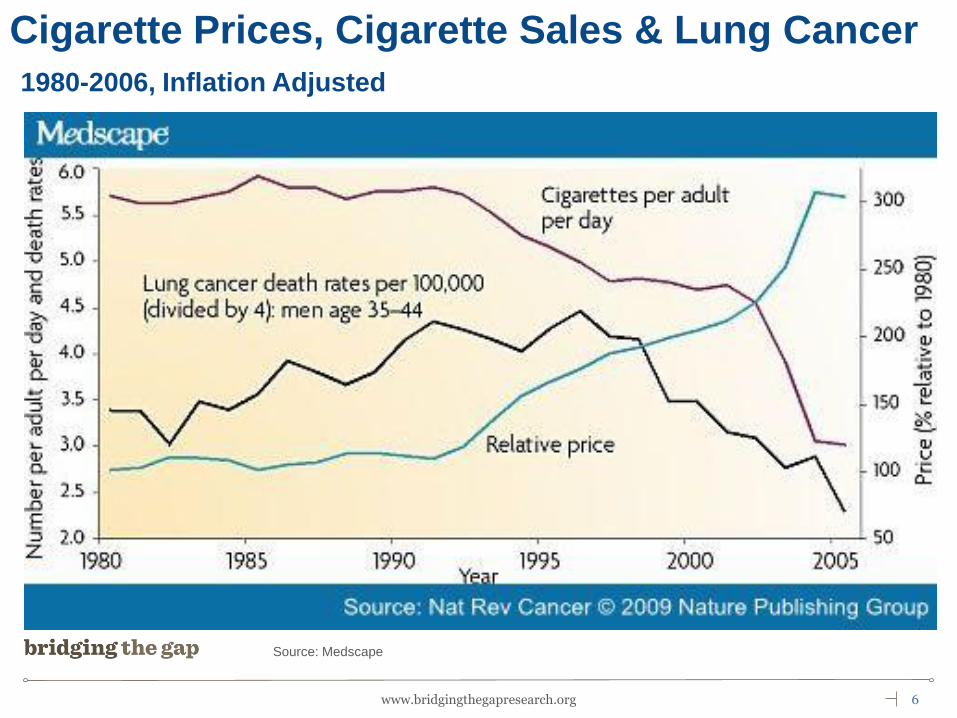
Cigarette Prices, Cigarette Sales & Lung Cancer
1980-2006, Inflation Adjusted
Source: Medscape
7 www.bridgingthegapresearch.org
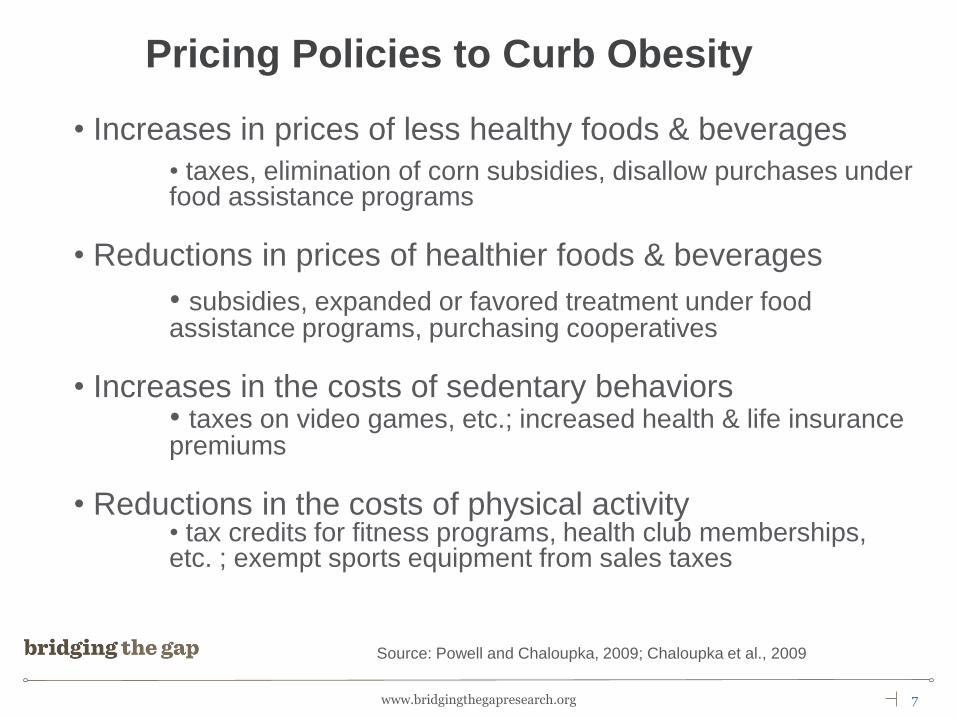
• Increases in prices of less healthy foods & beverages
• taxes, elimination of corn subsidies, disallow purchases under food assistance programs
• Reductions in prices of healthier foods & beverages
• subsidies, expanded or favored treatment under food assistance programs, purchasing cooperatives
• Increases in the costs of sedentary behaviors • taxes on video games, etc.; increased health & life insurance premiums
• Reductions in the costs of physical activity • tax credits for fitness programs, health club memberships, etc. ; exempt sports equipment from sales taxes
Pricing Policies to Curb Obesity
Source: Powell and Chaloupka, 2009; Chaloupka et al., 2009
Food Prices and Obesity Trends
9 www.bridgingthegapresearch.org
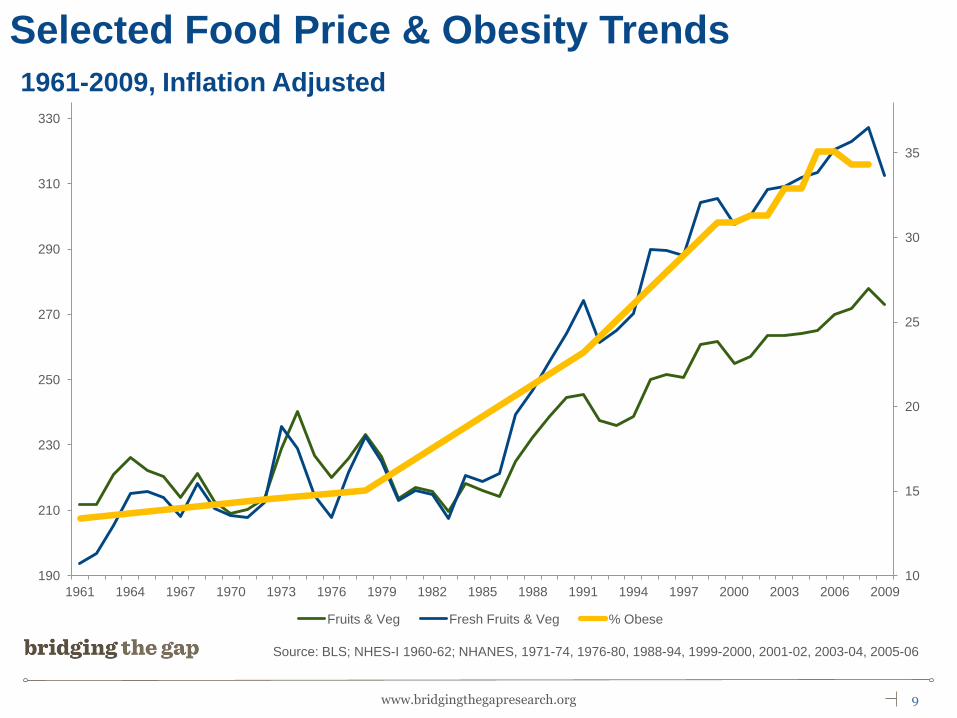
Selected Food Price & Obesity Trends
1961-2009, Inflation Adjusted
Source: BLS; NHES-I 1960-62; NHANES, 1971-74, 1976-80, 1988-94, 1999-2000, 2001-02, 2003-04, 2005-06
10
15
20
25
30
35
190
210
230
250
270
290
310
330
1961 1964 1967 1970 1973 1976 1979 1982 1985 1988 1991 1994 1997 2000 2003 2006 2009
Fruits & Veg Fresh Fruits & Veg % Obese
10 www.bridgingthegapresearch.org
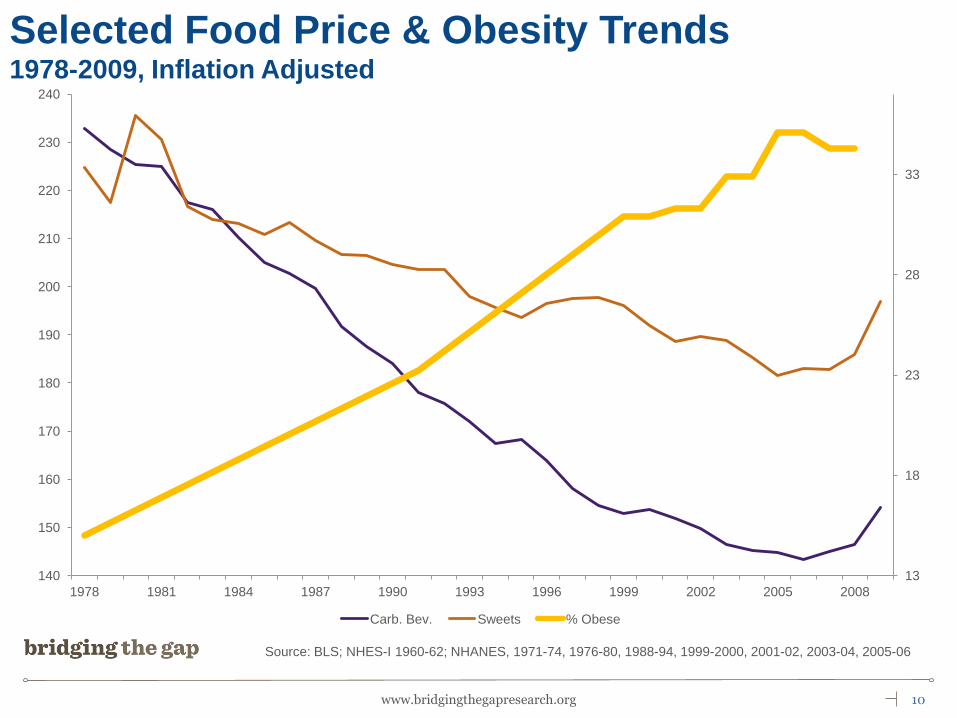
Selected Food Price & Obesity Trends 1978-2009, Inflation Adjusted
Source: BLS; NHES-I 1960-62; NHANES, 1971-74, 1976-80, 1988-94, 1999-2000, 2001-02, 2003-04, 2005-06
13
18
23
28
33
140
150
160
170
180
190
200
210
220
230
240
1978 1981 1984 1987 1990 1993 1996 1999 2002 2005 2008
Carb. Bev. Sweets % Obese
11 www.bridgingthegapresearch.org
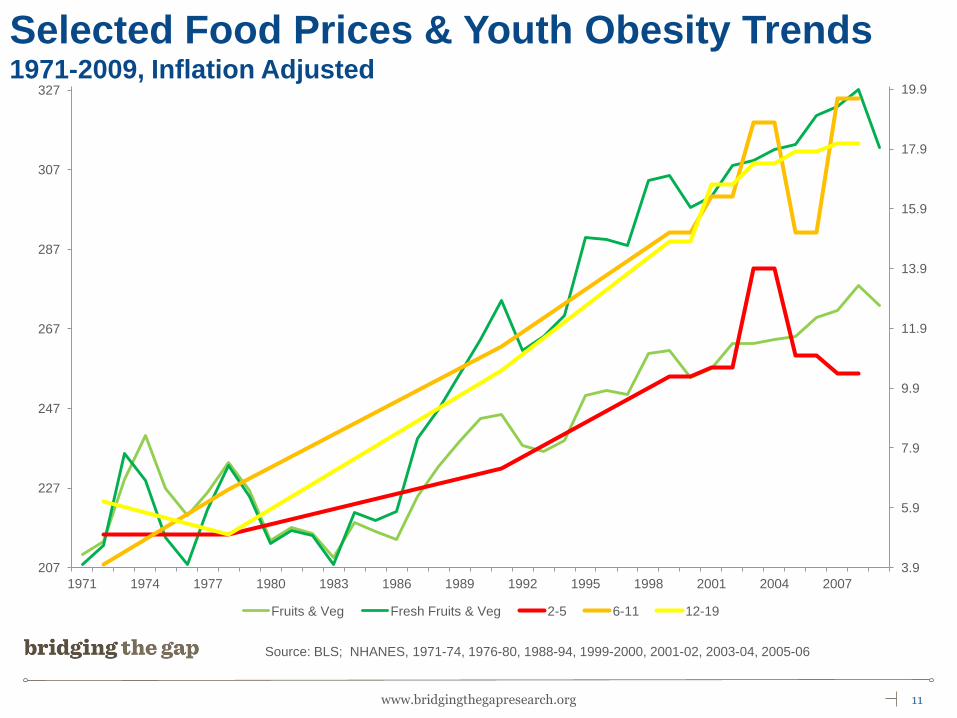
Selected Food Prices & Youth Obesity Trends 1971-2009, Inflation Adjusted
Source: BLS; NHANES, 1971-74, 1976-80, 1988-94, 1999-2000, 2001-02, 2003-04, 2005-06
3.9
5.9
7.9
9.9
11.9
13.9
15.9
17.9
19.9
207
227
247
267
287
307
327
1971 1974 1977 1980 1983 1986 1989 1992 1995 1998 2001 2004 2007
Fruits & Veg Fresh Fruits & Veg 2-5 6-11 12-19
12 www.bridgingthegapresearch.org
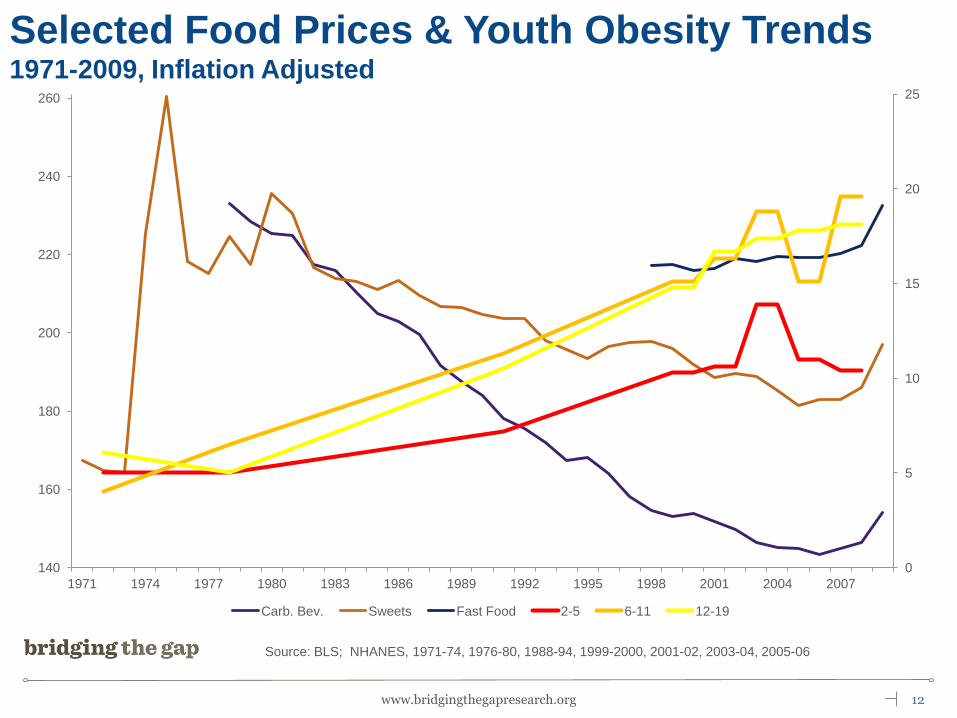
Selected Food Prices & Youth Obesity Trends 1971-2009, Inflation Adjusted
Source: BLS; NHANES, 1971-74, 1976-80, 1988-94, 1999-2000, 2001-02, 2003-04, 2005-06
0
5
10
15
20
25
140
160
180
200
220
240
260
1971 1974 1977 1980 1983 1986 1989 1992 1995 1998 2001 2004 2007
Carb. Bev. Sweets Fast Food 2-5 6-11 12-19
Food Prices, Consumption and Obesity
14 www.bridgingthegapresearch.org
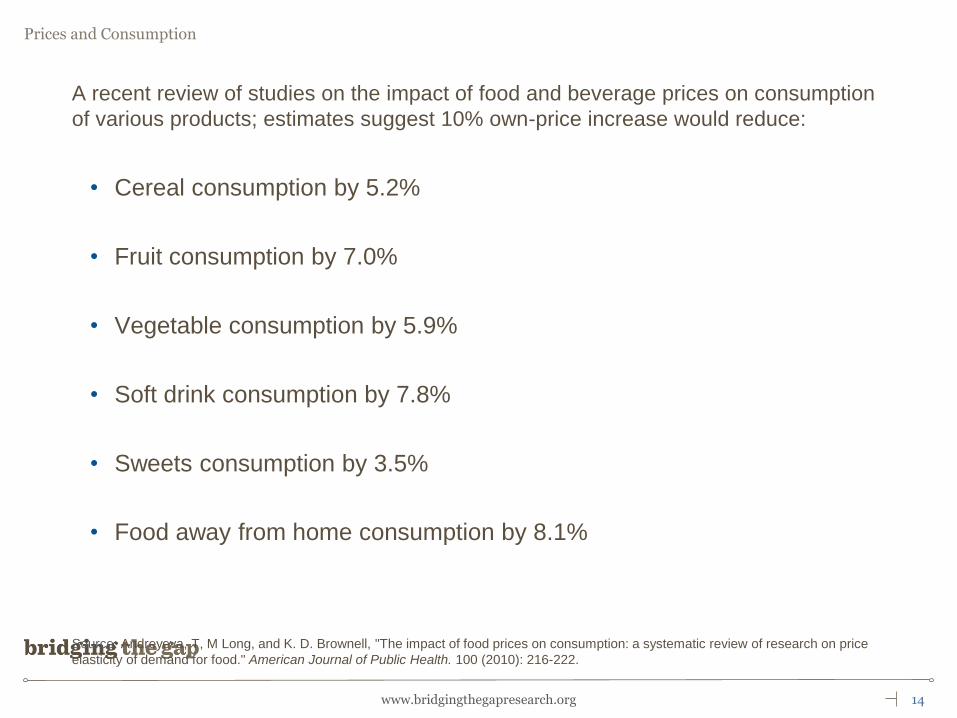
A recent review of studies on the impact of food and beverage prices on consumption
of various products; estimates suggest 10% own-price increase would reduce:
• Cereal consumption by 5.2%
• Fruit consumption by 7.0%
• Vegetable consumption by 5.9%
• Soft drink consumption by 7.8%
• Sweets consumption by 3.5%
• Food away from home consumption by 8.1%
Source: Andreyeva, T, M Long, and K. D. Brownell, "The impact of food prices on consumption: a systematic review of research on price
elasticity of demand for food." American Journal of Public Health. 100 (2010): 216-222.
15 www.bridgingthegapresearch.org
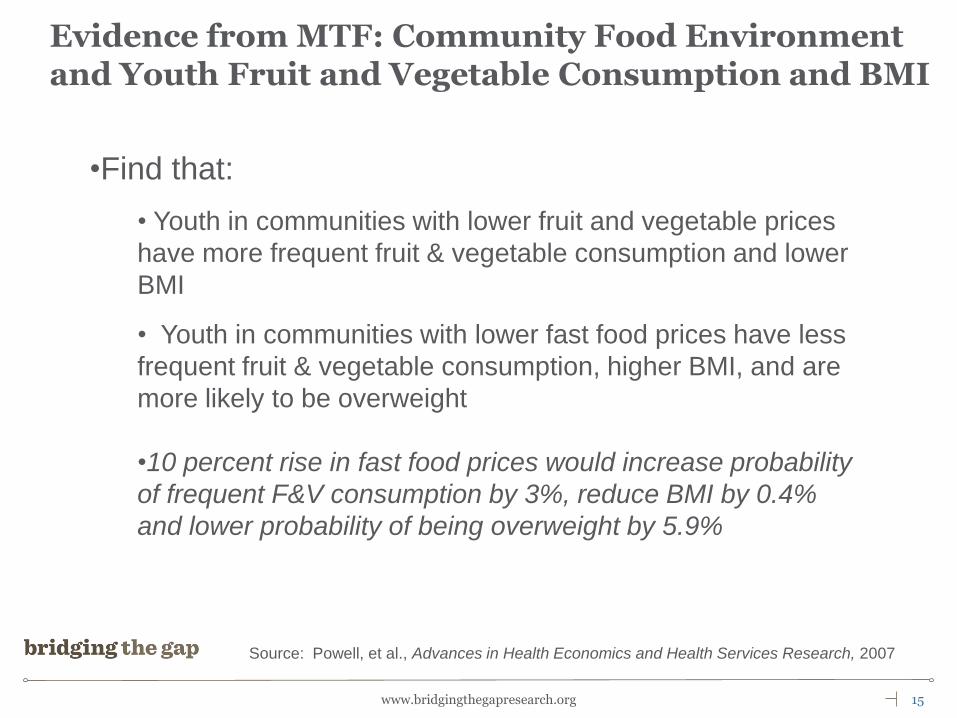
Evidence from MTF: Community Food Environment and Youth Fruit and Vegetable Consumption and BMI
•Find that:
• Youth in communities with lower fruit and vegetable prices
have more frequent fruit & vegetable consumption and lower
BMI
• Youth in communities with lower fast food prices have less
frequent fruit & vegetable consumption, higher BMI, and are
more likely to be overweight
•10 percent rise in fast food prices would increase probability
of frequent F&V consumption by 3%, reduce BMI by 0.4%
and lower probability of being overweight by 5.9%
Source: Powell, et al., Advances in Health Economics and Health Services Research, 2007
16 www.bridgingthegapresearch.org
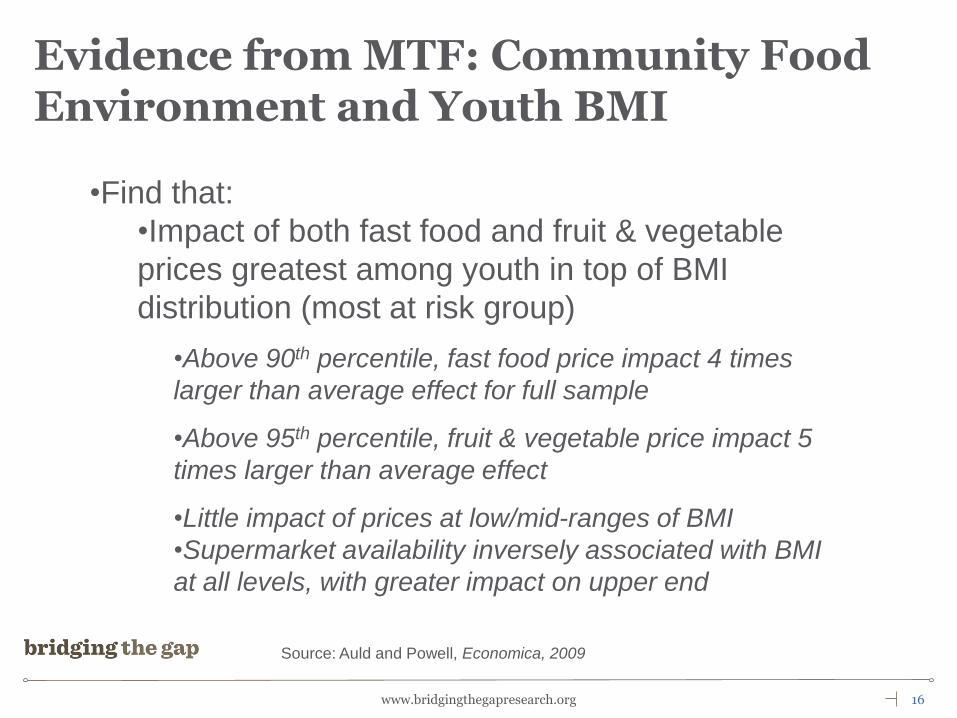
Evidence from MTF: Community Food Environment and Youth BMI
•Find that:
•Impact of both fast food and fruit & vegetable
prices greatest among youth in top of BMI
distribution (most at risk group)
•Above 90th percentile, fast food price impact 4 times
larger than average effect for full sample
•Above 95th percentile, fruit & vegetable price impact 5
times larger than average effect
•Little impact of prices at low/mid-ranges of BMI
•Supermarket availability inversely associated with BMI
at all levels, with greater impact on upper end
Source: Auld and Powell, Economica, 2009
17 www.bridgingthegapresearch.org
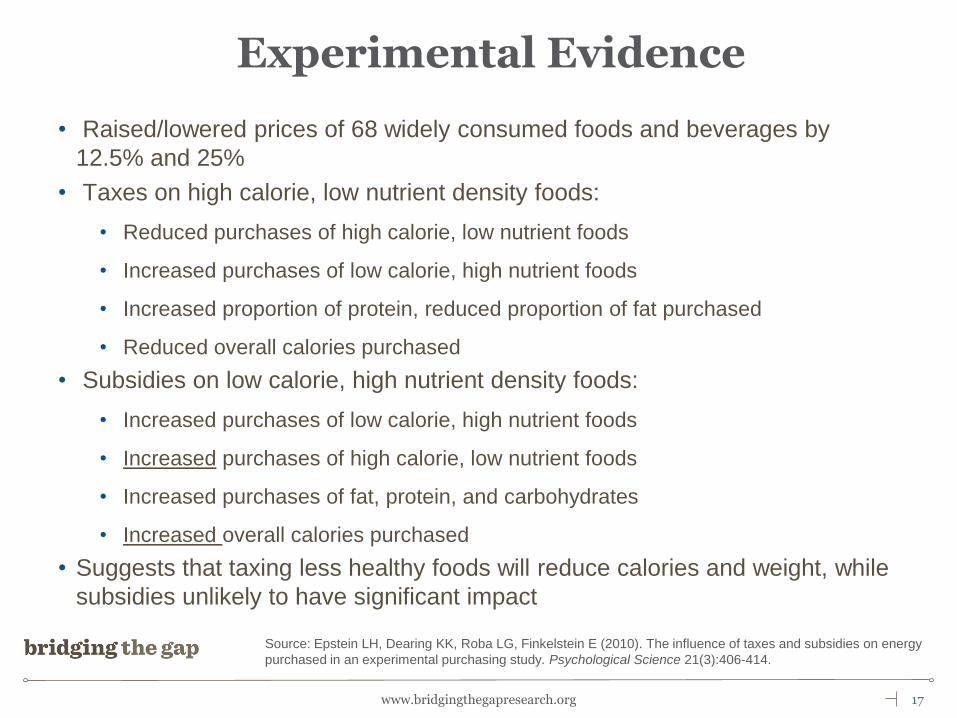
• Raised/lowered prices of 68 widely consumed foods and beverages by
12.5% and 25%
• Taxes on high calorie, low nutrient density foods:
• Reduced purchases of high calorie, low nutrient foods
• Increased purchases of low calorie, high nutrient foods
• Increased proportion of protein, reduced proportion of fat purchased
• Reduced overall calories purchased
• Subsidies on low calorie, high nutrient density foods:
• Increased purchases of low calorie, high nutrient foods
• Increased purchases of high calorie, low nutrient foods
• Increased purchases of fat, protein, and carbohydrates
• Increased overall calories purchased
• Suggests that taxing less healthy foods will reduce calories and weight, while
subsidies unlikely to have significant impact
Experimental Evidence
Source: Epstein LH, Dearing KK, Roba LG, Finkelstein E (2010). The influence of taxes and subsidies on energy
purchased in an experimental purchasing study. Psychological Science 21(3):406-414.
Sugar Sweetened Beverage Taxes and Obesity
19 www.bridgingthegapresearch.org
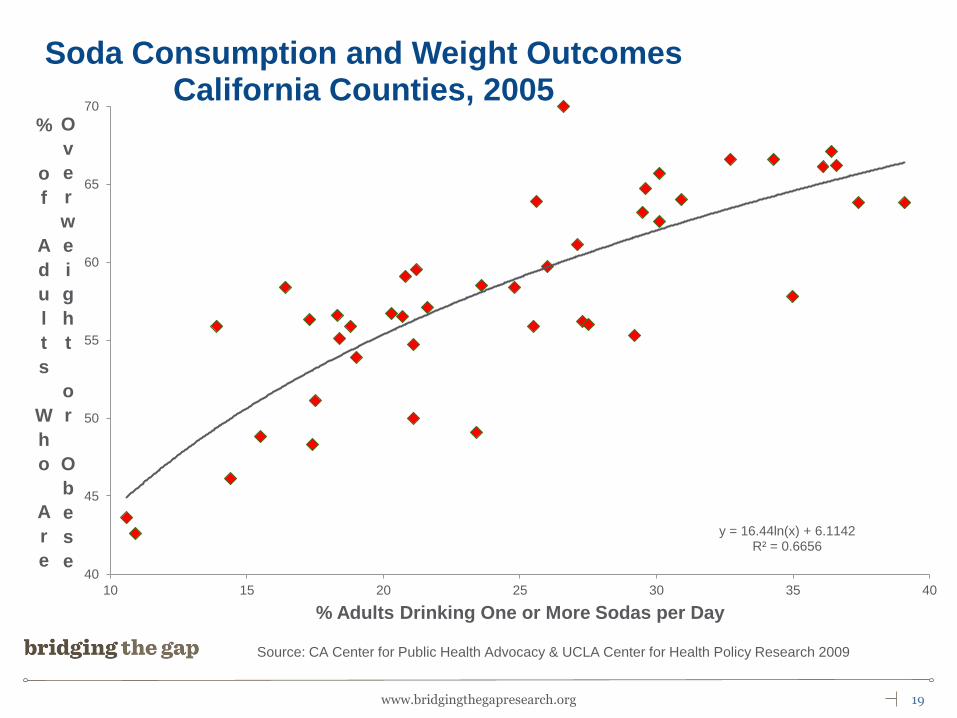
y = 16.44ln(x) + 6.1142 R² = 0.6656
40
45
50
55
60
65
70
10 15 20 25 30 35 40
%
o
f
A
d
u
l
t
s
W
h
o
A
r
e
O
v
e
r
w
e
i
g
h
t
o
r
O
b
e
s
e
% Adults Drinking One or More Sodas per Day
Soda Consumption and Weight Outcomes California Counties, 2005
Source: CA Center for Public Health Advocacy & UCLA Center for Health Policy Research 2009
20 www.bridgingthegapresearch.org
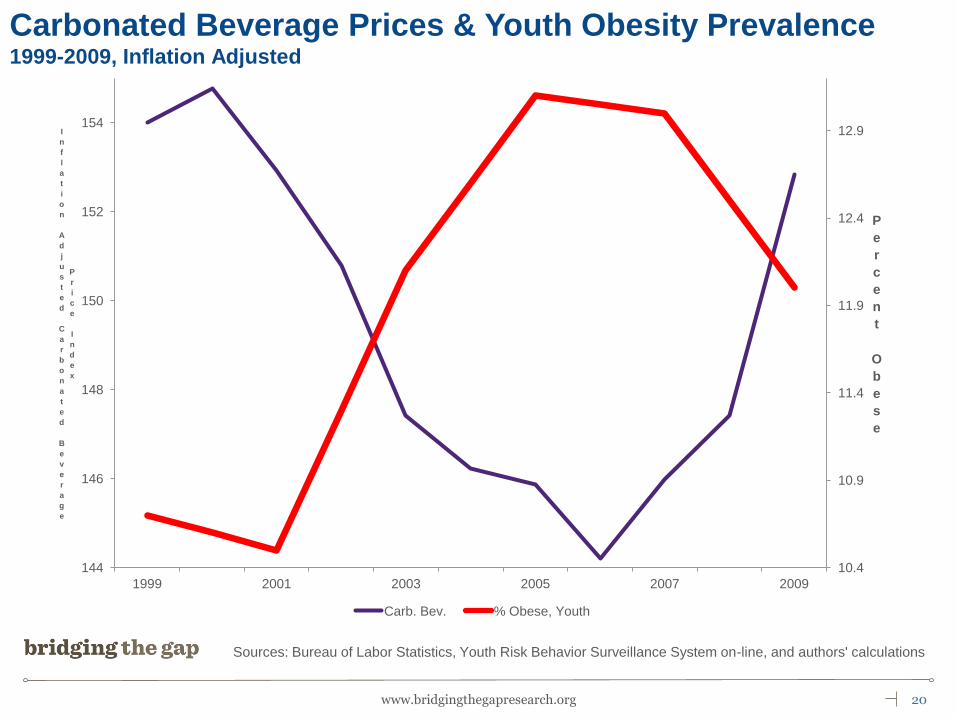
Sources: Bureau of Labor Statistics, Youth Risk Behavior Surveillance System on-line, and authors' calculations
10.4
10.9
11.4
11.9
12.4
12.9
144
146
148
150
152
154
1999 2001 2003 2005 2007 2009
P
e
r
c
e
n
t
O
b
e
s
e
I
n
f
l
a
t
i
o
n
A
d
j
u
s
t
e
d
C
a
r
b
o
n
a
t
e
d
B
e
v
e
r
a
g
e
P
r
i
c
e
I
n
d
e
x
Carb. Bev. % Obese, Youth
Carbonated Beverage Prices & Youth Obesity Prevalence 1999-2009, Inflation Adjusted
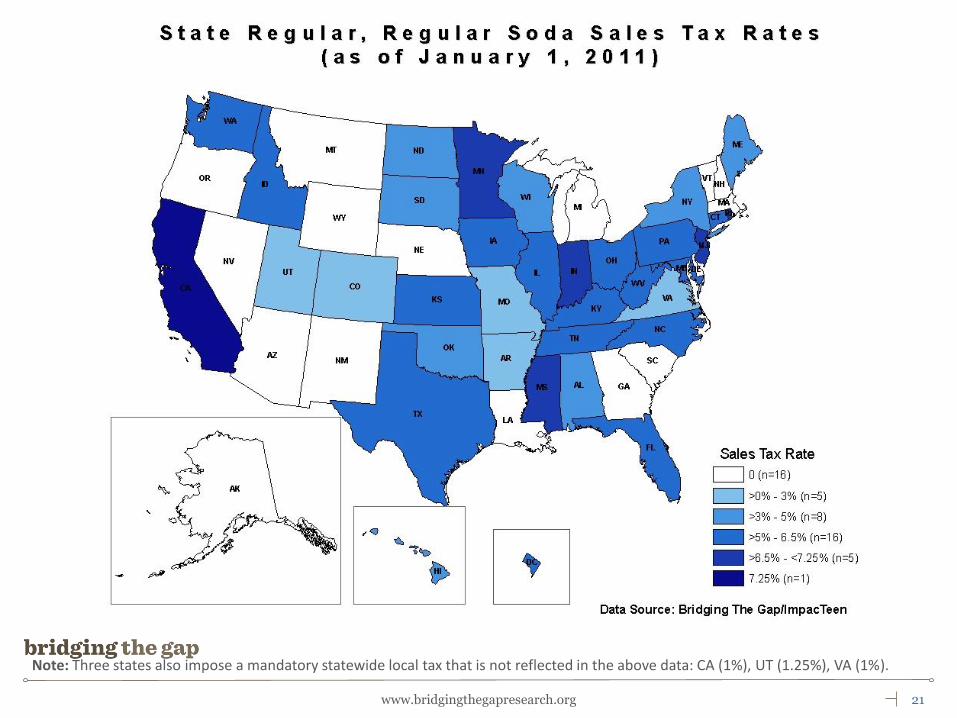
21 www.bridgingthegapresearch.org
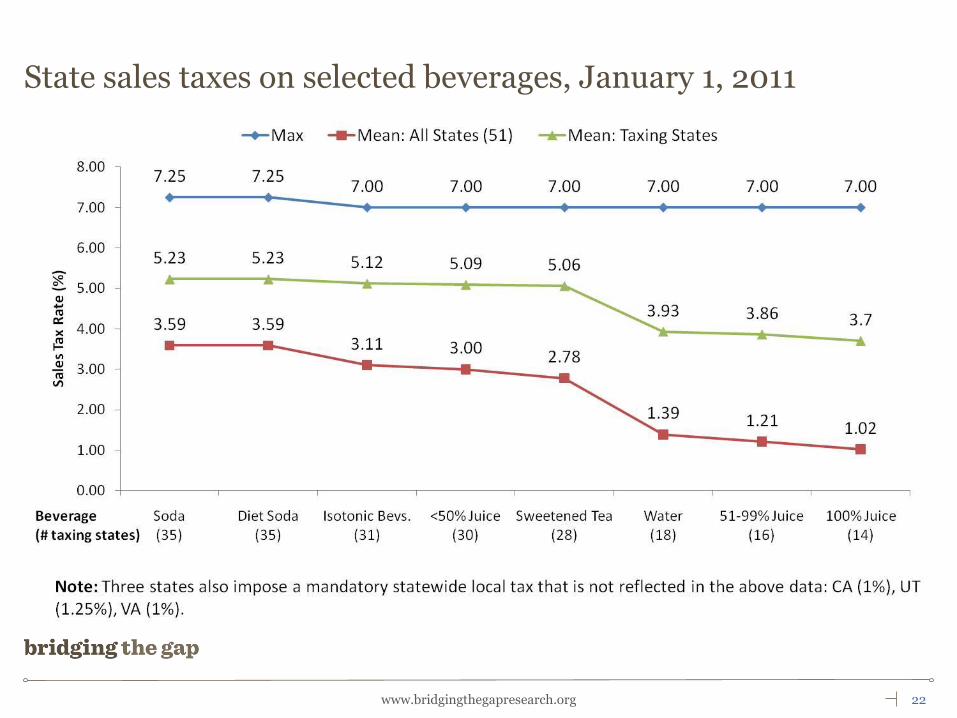
Note: Three states also impose a mandatory statewide local tax that is not reflected in the above data: CA (1%), UT (1.25%), VA (1%).
22 www.bridgingthegapresearch.org
State sales taxes on selected beverages, January 1, 2011
23 www.bridgingthegapresearch.org
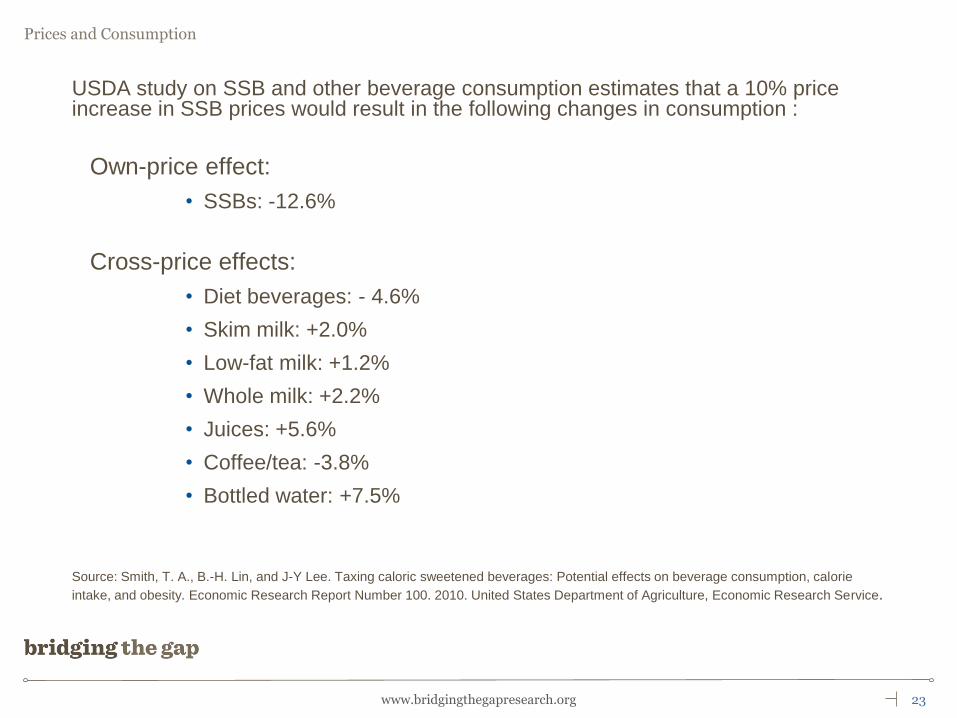
USDA study on SSB and other beverage consumption estimates that a 10% price increase in SSB prices would result in the following changes in consumption :
Own-price effect:
• SSBs: -12.6%
Cross-price effects:
• Diet beverages: - 4.6%
• Skim milk: +2.0%
• Low-fat milk: +1.2%
• Whole milk: +2.2%
• Juices: +5.6%
• Coffee/tea: -3.8%
• Bottled water: +7.5%
Source: Smith, T. A., B.-H. Lin, and J-Y Lee. Taxing caloric sweetened beverages: Potential effects on beverage consumption, calorie
intake, and obesity. Economic Research Report Number 100. 2010. United States Department of Agriculture, Economic Research Service.
24 www.bridgingthegapresearch.org
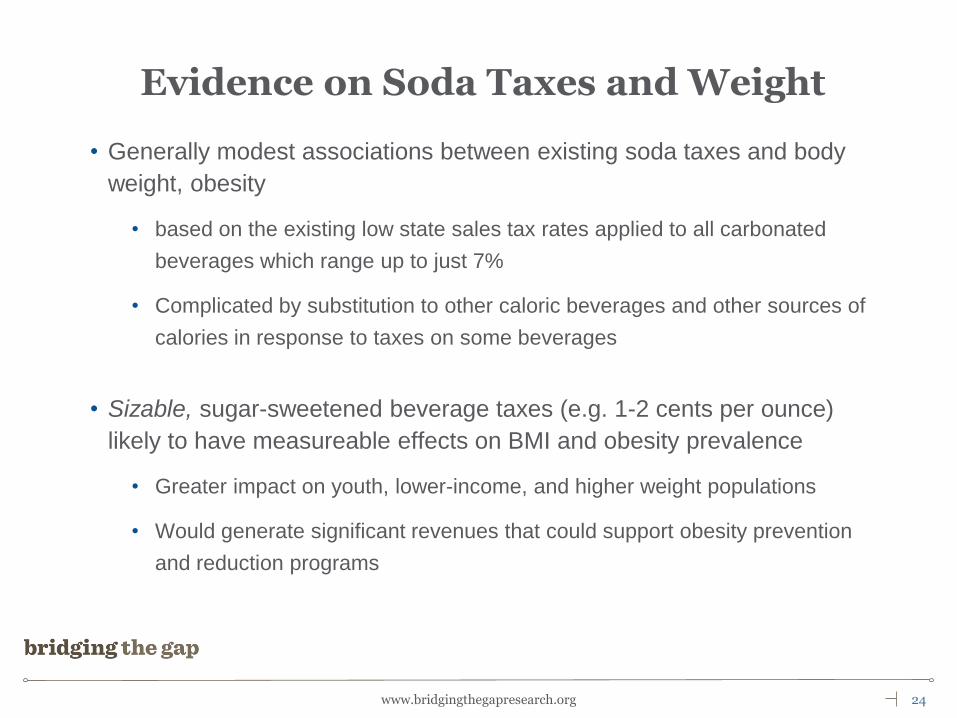
Evidence on Soda Taxes and Weight
• Generally modest associations between existing soda taxes and body
weight, obesity
• based on the existing low state sales tax rates applied to all carbonated
beverages which range up to just 7%
• Complicated by substitution to other caloric beverages and other sources of
calories in response to taxes on some beverages
• Sizable, sugar-sweetened beverage taxes (e.g. 1-2 cents per ounce)
likely to have measureable effects on BMI and obesity prevalence
• Greater impact on youth, lower-income, and higher weight populations
• Would generate significant revenues that could support obesity prevention
and reduction programs
Pricing Policies to Promote Activity
26 www.bridgingthegapresearch.org
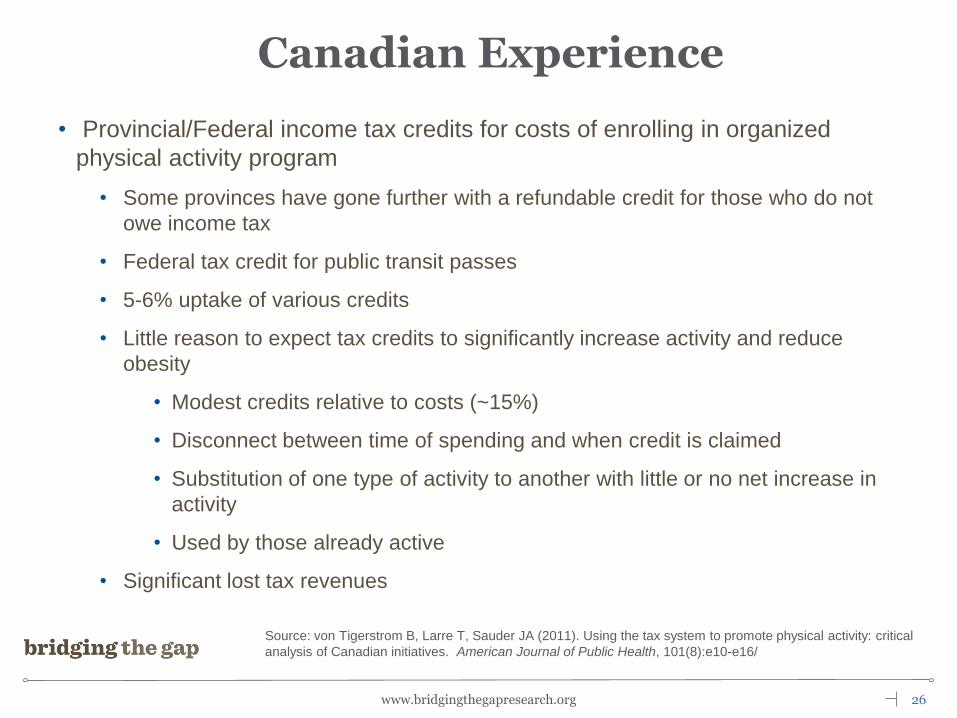
• Provincial/Federal income tax credits for costs of enrolling in organized
physical activity program
• Some provinces have gone further with a refundable credit for those who do not
owe income tax
• Federal tax credit for public transit passes
• 5-6% uptake of various credits
• Little reason to expect tax credits to significantly increase activity and reduce
obesity
• Modest credits relative to costs (~15%)
• Disconnect between time of spending and when credit is claimed
• Substitution of one type of activity to another with little or no net increase in
activity
• Used by those already active
• Significant lost tax revenues
Canadian Experience
Source: von Tigerstrom B, Larre T, Sauder JA (2011). Using the tax system to promote physical activity: critical
analysis of Canadian initiatives. American Journal of Public Health, 101(8):e10-e16/
27 www.bridgingthegapresearch.org
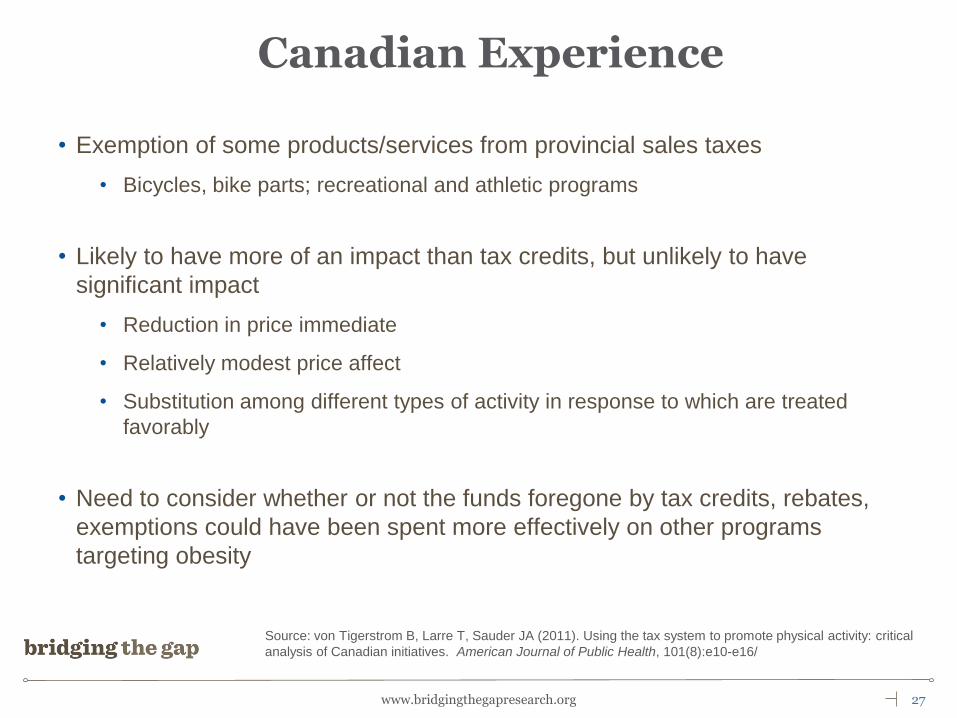
• Exemption of some products/services from provincial sales taxes
• Bicycles, bike parts; recreational and athletic programs
• Likely to have more of an impact than tax credits, but unlikely to have
significant impact
• Reduction in price immediate
• Relatively modest price affect
• Substitution among different types of activity in response to which are treated
favorably
• Need to consider whether or not the funds foregone by tax credits, rebates,
exemptions could have been spent more effectively on other programs
targeting obesity
Canadian Experience
Source: von Tigerstrom B, Larre T, Sauder JA (2011). Using the tax system to promote physical activity: critical
analysis of Canadian initiatives. American Journal of Public Health, 101(8):e10-e16/
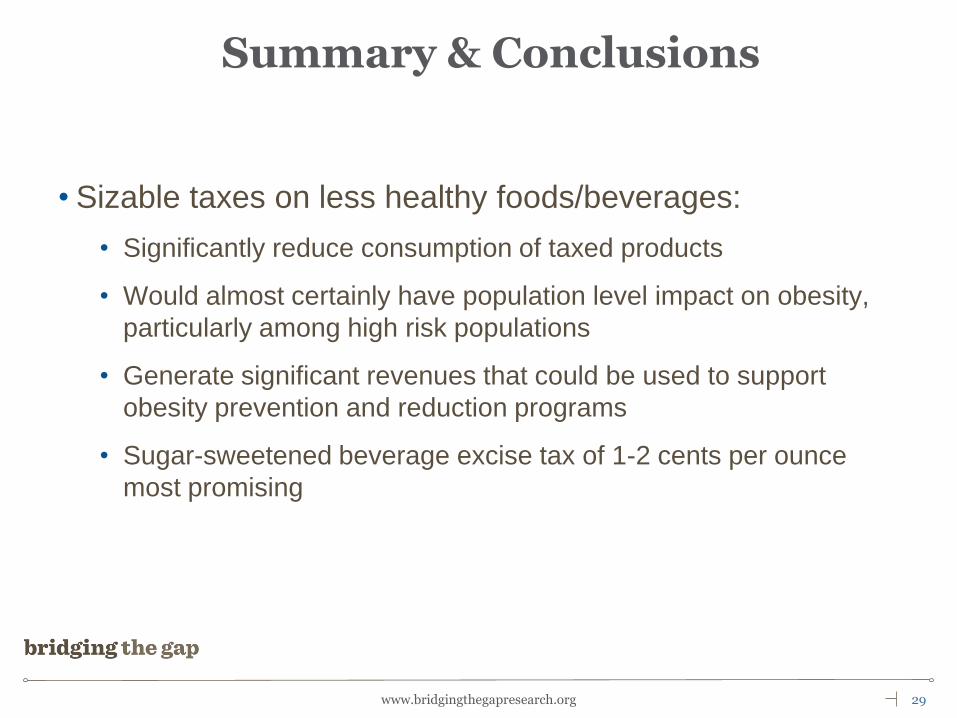
Summary & Conclusions
29 www.bridgingthegapresearch.org
• Sizable taxes on less healthy foods/beverages:
• Significantly reduce consumption of taxed products
• Would almost certainly have population level impact on obesity,
particularly among high risk populations
• Generate significant revenues that could be used to support
obesity prevention and reduction programs
• Sugar-sweetened beverage excise tax of 1-2 cents per ounce
most promising
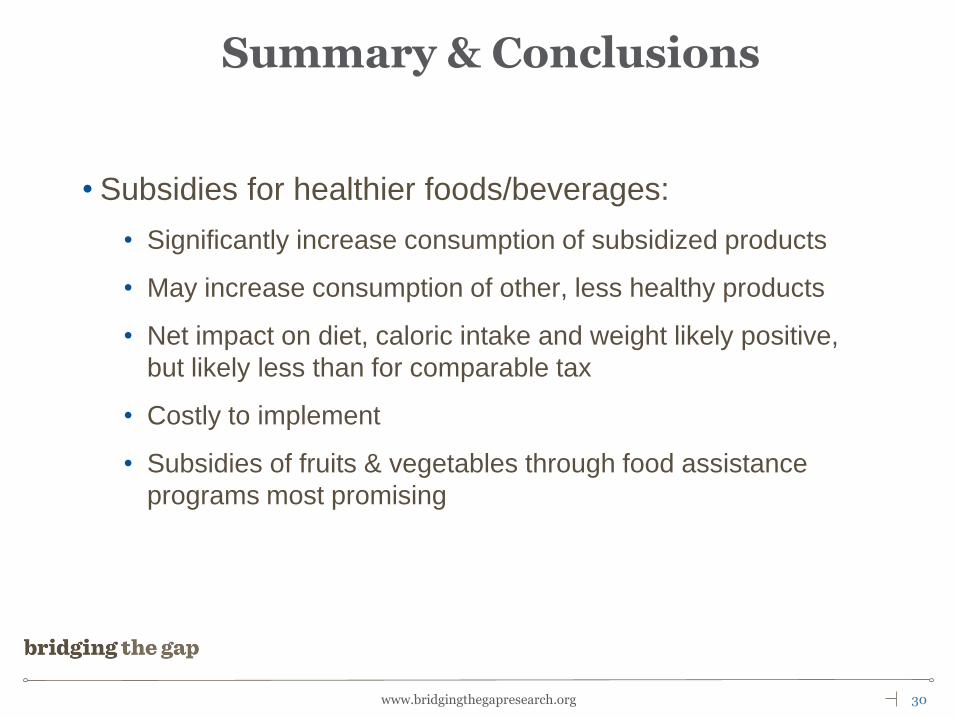
Summary & Conclusions
30 www.bridgingthegapresearch.org
• Subsidies for healthier foods/beverages:
• Significantly increase consumption of subsidized products
• May increase consumption of other, less healthy products
• Net impact on diet, caloric intake and weight likely positive,
but likely less than for comparable tax
• Costly to implement
• Subsidies of fruits & vegetables through food assistance
programs most promising
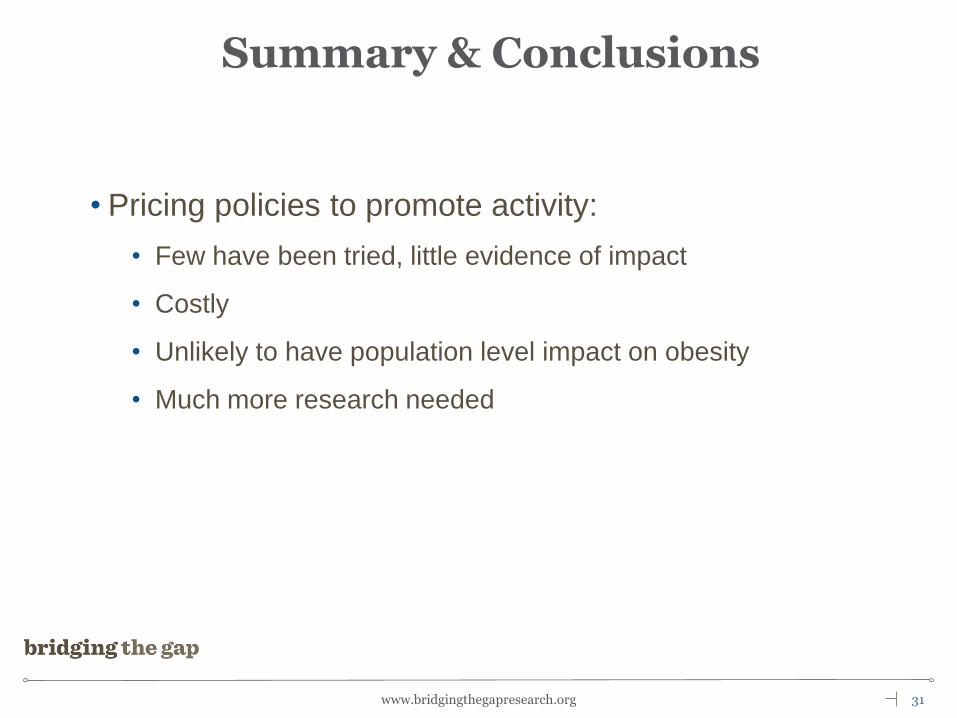
Summary & Conclusions
31 www.bridgingthegapresearch.org
• Pricing policies to promote activity:
• Few have been tried, little evidence of impact
• Costly
• Unlikely to have population level impact on obesity
• Much more research needed
Summary & Conclusions
32 www.bridgingthegapresearch.org
ImpacTeen
http://www.impacteen.org
Bridging the Gap
http://www.bridgingthegapresearch.org
Contact: [email protected]