price wars and the stability of collusion: a study of the
TRANSCRIPT
PRICE WARS AND THE STABILITY OF COLLUSION:A STUDY OF THE PRE-WORLD WAR I BROMINE
INDUSTRY*
Margaret C. Levenstein
Between 1885 and 1914 US bromine producers colluded to raise pricesand pro¢ts. This collusion was disrupted by price wars. Bromine pricewars are compared with the Green/Porter and Abreu/Pearce/Stacchetti models. Some price wars resulted from the imperfectmonitoring problems which motivate these models. Several empiricalimplications of the APS model are borne out, but the bromineindustry's price wars were generally milder than contemplated by APS.More severe price wars were part of a bargaining process, in which¢rms tried to force renegotiation to a new collusive equilibrium with adi¡erent distribution of rents.
i. introduction
Economists have long debated the causes and consequences of price wars.Stigler [1964] argued that cartel pro¢ts induce cheating or entry. A pricewar inevitably follows, and collusion disintegrates. Earlier students ofindustrial organization believed, to the contrary, that the possibility ofprice wars stabilized collusion (Burns [1936], pp. 27^30). When price warsarose, they were ascribed to exogenous forces disrupting otherwise stablecartels (Stocking and Watson [1951], p. 505). Hearkening back to the olderliterature, game theorists have argued that price wars may be necessaryfor cartel stability, and that they occur in response to exogenous shocks(Green and Porter [1984], Abreu, Pearce, and Stacchetti [1986], hereafterAPS). Firms engage in price wars to deter cheating, which, in a world ofimperfect information, they cannot distinguish from stochastic£uctuations. These ``equilibrium price wars'' do not re£ect the collapse ofcollusion, but are instead a crucial element in its stability.
These game-theoretic models have not been widely tested, partlybecause they depend on variables, like beliefs and strategies, that are
ß Blackwell Publishers Ltd. 1997, 108 Cowley Road, Oxford OX4 1JF, UK, and 350 Main Street, Malden, MA 02148, USA.
117
THE JOURNAL OF INDUSTRIAL ECONOMICS 0022-1821Volume XLV June 1997 No. 2
*The author acknowledges helpful comments from two anonymous referees, David Arsen,Severin Borenstein, Je¡ Borland, Insong Gil, Thomas Iosso, Francine Lafontaine, KevinLang, Richard Levin, Nancy Lutz, Paul Milgrom, David Pearce, Matthew Shapiro, DavidWeiman, Lawrence White, and participants in seminars at the University of Chicago,Stanford University, UCLA, and the Cliometrics Society Summer Conference. She alsoappreciates the valuable assistance she has received from E. N. Brandt, Barbara Brennan,Delores Goulet, Margaret Lyon, and Kathleen Thomas, all of the Post Street Archives, andfrom the archivists at the Baker and New England Depository Libraries. All errors, of course,remain her own.

not observable. In this paper I analyze internal documents from a turnof the century cartelöcontracts, correspondence, minutes ofnegotiations found in the archives of the Dow Chemical Companyöthat explicitly discuss what industry participants did and did notbelieve, which strategies they pursued and which they rejected. I usethese sources, as well as industry and government publications, toevaluate the role of price wars in stabilizing, and destabilizing, thebromine cartel.1
The bromine cartel in the US did use the threat of price wars to provideindividual ¢rms with an incentive to participate in the cartel, as suggestedby Friedman [1971]. An examination of the historical incidents leadingup to each of the six bromine price wars suggests that imperfectmonitoring problemsöthe inability to distinguish between random shocksand real cheatingödid contribute to the occurrence of some price wars.A comparison of the qualitative characteristics of price wars with theoptimal punishment described by APS ¢nds that in four cases the initialprice cut and the duration of the price war were similar, as predicted.However, those price wars were relatively mild, and did not approach theCournot reversion levels proposed in Green and Porter and Friedman, letalone the more severe punishments contemplated in APS. Two other pricewars began right after publicly announced violations of the collusiveagreement. These price wars were the result of disagreements amongparticipant ¢rms regarding the distribution of rents generated by collusion.These price wars lasted longer, and prices fell much further. These twoprice wars are better understood as breakdowns in collusion than asequilibrium punishments.
ii. the bromine pools
Following the US Civil War battle¢eld discovery that potassiumbromide had sedative properties, it quickly became a popular patentmedicine, used as a headache remedy and stomach settler. Whileelemental liquid bromine had been produced commercially in theUnited States since 1845, demand had been limited to use indaguerreotype photography. In response to the new pharmaceuticaldemand, sodium chloride salt producers whose underground brinecontained bromine began extracting it to make elemental liquidbromine. These ¢rms pumped and heated the brine, extracting sodiumchloride and then bromine. Virtually all of this elemental liquidbromine was then sold to one of several large pharmaceutical
1Detailed citations from these documents can be found in Levenstein [1993].
118 margaret c. levenstein
ß Blackwell Publishers Ltd. 1997.
distributors who converted the bromine into potassium bromide salts.These pharmaceutical distributors had national sales networks throughwhich they distributed potassium bromide salts to patent medicineproducers, pharmaceutical ``jobbers,'' and pharmacies around thecountry. In 1880 there were twelve liquid bromine producers, locatedalong the Ohio and Kanawha Rivers. (These ¢rms will be referred to,collectively, as the ``Ohio River bromine producers.'')
From 1885 to 1902, competition in the upstream bromine industrywas controlled by a pool. The pool was an independent, unincorp-orated ¢rm with contracts to buy the entire output of every bromineproducer. These contracts guaranteed producers a price, and prohibitedthem from selling to anyone else. The contracts were explicitlyconditioned on the participation of all producers. From 1885 to 1891the pool operated as the National Bromine Company (NBC). From1892 to 1902 it was run by W. R. Shields. The pool itself hadcontracts to sell all its bromine to two of the largest pharmaceuticaldistributors in the country, Mallinckrodt Chemical and Powers &Weightman (P&W). The pool also had an agreement with its onlypotential foreign competitionöthe Deutsche Bromkonventionöreservingthe United States as the exclusive territory of the American producers,in return for its refraining from exporting.The structure of collusion changed somewhat in 1894, when the
downstream ¢rms, Mallinckrodt and P&W, together contracted directlywith a new entrant to purchase all of its output. This ¢rm, the MidlandChemical Company (predecessor of the Dow Chemical Company),introduced a patented technology that integrated the production of liquidbromine and potassium bromide salts, and had signi¢cantly largerminimum optimal scale. Midland's contract restricted its output to100,000 pounds of potassium bromide a year, about twice the equivalentoutput in bromine of a typical Ohio River ¢rm. Thus, Midland verticallyintegrated the upstream and downstream production processes, but didnot integrate into the distribution function performed by the downstream¢rms. Shield's contracts with the Ohio River bromine producers and withMallinckrodt and P&W remained in force.
The structure of collusion changed more dramatically in 1902 whenDow, having purchased Midland in 1900, refused to renew thecontracts Midland had signed with Mallinckrodt and P&W. Itcontracted instead with two other distributors whom Dow selectedbecause they had a reputation for not cutting prices. Dow hoped thatthis selection of outside distributors would prevent a decline in pricesdespite its decision to operate independently of the pool distributors.Shield's contracts with the Ohio River ¢rms expired and were notrenewed, though he continued to act as an intermediary between theOhio River and Mallinckrodt and P&W. After a brief price war, an
price wars and collusion in bromine pre-world war i 119
ß Blackwell Publishers Ltd. 1997.

informal collusive arrangement was arrived at, in which all ¢rmspromised not to undercut the announced potassium bromide price inthe leading industry publication, the Oil, Paint and Drug Reporter. Themarket division agreement with the Germans was also renewed, butDow soon began secretly exporting bromides to Europe. In 1905 theGermans retaliated by entering the US market at ¢fty percent of thegoing price.
Cooperation was re-established at the end of 1908. Dow and theGermans agreed to set prices for all bromine products jointly and divideworld markets. Cooperation within the American market was also re-established. Dow signed distribution contracts with all the majorpotassium bromide distributors. These contracts prohibited thedistributors from buying bromine from anyone but Dow. For over a year,Dow kept the price of potassium bromide low enough that the Ohio River¢rms, with their higher production costs, could not pro¢tably sell theirbromine. In 1910 Dow contracted with all but one of the Ohio River ¢rmsto purchase their entire output on a sliding scale price, based on thepublished price. Thus Dow recreated the pool structure, but itself acted asthe pool, purchasing the entire output of its competitors. The price ofpotassium bromide rose slowly but steadily until the beginning of WorldWar I (Figure 1).
Figure 1
120 margaret c. levenstein
ß Blackwell Publishers Ltd. 1997.

iii. evaluating the success of the cartel
Before analyzing in more detail the function of price wars in the bromineindustry, I address a more basic question. Was collusion successful? Did itrestrict output, raise prices, and increase the pro¢ts of participating ¢rms?And if so, by how much? An analysis of price trends and a comparisonof actual prices with those achievable without cooperation supports thecontention of this paper, and the belief of the participants in the industry,that cooperation increased prices and pro¢ts.2
III(i). Price Trends
The price of bromine fell continuously after the commencement of com-mercial production, from six dollars a pound before the Civil War to thirtycents in 1875. It fell 7% between 1875 and 1880, and almost 30% between1880 and 1884.3 With the establishment of the bromine pool in 1885, thistrend reversed. The price of potassium bromide increased 23% over the year(Figure 1).4 The average price during the NBC pool (1885^1891) was almostten percent higher than the average price of the previous ¢ve year period.When the NBC contracts terminated in 1891, prices returned to their pre-pool pattern, falling by almost thirty percent (Figure 1). With theestablishment of the ``Shields pool'' in October 1892, prices began a steadyupward climb. The average price during the Shields pool was 60% higherthan during the period between the pools.5 At the dissolution of the Shieldspool in 1902, the price again fell quite sharply (43.2% in one month).
2 Because their account books have not survived, direct pro¢t measures for the Ohio River¢rms and P&W and Mallinckrodt are not available. Evidence of the Midland ChemicalCompany's pro¢tability is available but it is di¤cult to separate pro¢ts accruing to cartelprices from those accruing to Dow's patented inventions. Between 1894 and 1900, potassiumbromide sold to Mallinckrodt and P&W was Midland's sole product. Midland issued its ¢rstdividend after signing its contract with P&W and Mallinckrodt in 1894. Midland paidmonthly dividends of two to ¢ve percent on the par value of its stock over the next six years(Levenstein [1997]). Annual interest rates in the region averaged less than 6.5% (Davis[1965]).
3 The price of elemental liquid bromine fell from between six and eight dollars per poundin 1845 to $4.50 per pound in 1868, to 70¿ per pound in 1870 (Haynes [1954], p. 324 andOPDR [1880], p. 655].
4 After the NBC contracts went into e¡ect, virtually all elemental liquid bromine traded atcontract prices. The bromine price quotations in the OPDR were for small lots of brominepurchased from the NBC, not the Ohio River producers. For market prices, I rely onquotations of potassium bromide prices. The average price of potassium bromide betweenFebruary 18, 1880 and February 11, 1885 was 31.07¿. The comparable price during the NBC,February 18, 1885 to March 4, 1891, was 34.08¿.
5 The average price of potassium bromide during the Shields pool (October 13, 1892 toOctober 20, 1902) was 40.88¿, 60% above the average price of 24.75¿ from March 11, 1891 toOctober 3, 1892. Since the low price in between the two pools could re£ect pricing strategiesbelow competitive prices, the relevant comparison may be to the pre-pool prices of 1880-1885. The increase associated with the Shields pool would in that case be 31.6%.
price wars and collusion in bromine pre-world war i 121
ß Blackwell Publishers Ltd. 1997.
After 1902, Dow's large share of total output, produced at lower cost,makes comparisons with pre-1885 prices less meaningful. The averageprice after 1902 was lower, during both cooperative and non-cooperativeperiods, than during the preceding decades. The di¡erence between pricesduring cooperation and non-cooperation remains. Between 1902 and 1914,the average price during cooperation was almost 75% higher than duringnon-cooperative periods.6 Similarly, the price increased by almost 50%,from 13¿ to 19¿, on December 21, 1908, when the Dow-DeutscheBromkonvention agreement took e¡ect. The price trend for the previousthree years had been £at or negative (Figure 1). The price remained at 19¿until May 1910, when the extant Ohio River ¢rms agreed to sell theiroutput to Dow. Immediately thereafter prices began an upward trend thatcontinued until World War I. By 1914, nominal prices had returned,despite decreases in costs, to the levels charged prior to the breakup of thepool in 1902 (Figure 1).7
The stability of prices during cooperation was greater than during non-cooperative periods. This does not itself indicate that prices were higher,but is consistent with their being set non-competitively (Slade [1991]). Themarket power exerted by cooperating ¢rms allowed them to ignore small£uctuations in demand or cost. Cooperation may have required infrequentprice changes, which had to be coordinated among several, geographicallydispersed ¢rms. During non-cooperative periods, ¢rms independentlyannounced prices, increasing the probability that a price change wouldoccur in any given week. Prices changed every 11.5 weeks during non-cooperative periods but only every 41.1 weeks during cooperation. Theresults are similar if the pool (1885^1902) and post-pool (1902^1914) dataare separated. During the pools, prices changed every 35 weeks duringcooperation, every 6.8 during non-cooperation. After 1902 the patternremained; prices endured 64.7 weeks during cooperation, 17.5 weeksduring non-cooperation.
Average prices were higher during periods of cooperation. Pricesincreased during cooperation, and fell at its conclusion. Price £uctuationswere greater during non-cooperative periods, re£ecting the independentprice setting behavior of ¢rms. Each and every change in price trends canbe explained by a change in the cooperative behavior of the ¢rms in theindustry. There is no evidence that changes in demand or cost can explainthe observed £uctuations in price.
6 The average price of potassium bromide during non-cooperative periods was 16.8¿.During cooperation it was 29.3¿.
7 All of these results hold if one examines real instead of nominal prices. See the Journal'seditorial Web site.
122 margaret c. levenstein
ß Blackwell Publishers Ltd. 1997.

III(ii). A potassium bromide cost function
To evaluate more fully the e¡ectiveness of the collusive policies pursuedby bromine producers and distributors, I next compare the prices chargedduring the period studied to counterfactual prices which would have beencharged in a competitive regime. This requires estimates of the demandand cost functions for the industry. Unfortunately, I have cost data forneither the Ohio River producers nor the pool's distributors. But Dow'srecords do provide information on the parameters of its competitors' costfunctions. Where there is ambiguity, I use the highest cost parameters sothat, if anything, the e¡ect of the cartel is underestimated.
Consistent with discussions among participants in the industry, Iassume that upstream ¢rms manufactured liquid bromine with constantmarginal cost �MCBr� and, implicitly, that the bromine producers had acapacity constraint which was determined by plant size and the ¢rm'soutput of sodium chloride salt. Direct measures of MCBr are notavailable, but Dow records contain several estimates. These estimateswere made at three di¡erent times, in considering plans to gain controlof Ohio River bromine. In 1896 and 1897 the Midland ChemicalCompany considered ``dead renting'' the Ohio River producers, payingthem not to produce bromine. Midland attempted to determine thepro¢t they were making on their bromine, so that Midland could o¡erthem an equivalent amount not to produce. Midland knew the price thatthey received from Shields; the only dispute was the average cost of apound of bromine. Shields, representing the bromine manufacturers inthese negotiations, tried to convince Midland that MCBr was low.Herbert Dow and Henry Cooper, Midland's general manager, opposedthe policy of ``dead renting'' and argued that MCBr was much higher.They argued that MCBr could be as high as 18¿ to 21¿, saying that whenprices had fallen much below that the Ohio River ¢rms had stoppedproducing. J. H. Osborn and B. E. Helman, Midland's vice presidentand treasurer, respectively, advocated dead renting and often quotedShield's estimates of 10¿ to 12¿ to Dow and Cooper. By 1902, HerbertDow seems to have accepted that MCBr was about 12¿ per pound. Thatis the ¢gure he presents to the ¢rm's directors when discussing theimplications of Dow's decision to end its cooperation with the pool. Hegives the same estimate to outsiders. The subject is raised again in1910, when Dow contracted to buy the output of the Ohio River ¢rms.The contract had a sliding scale price for liquid bromine between 11¿and 19¿ per pound (depending on the selling price of potassiumbromide). As the Ohio River ¢rms were not required to produce or sellany amount under these contracts, it is still possible that MCBr wasabove 11¿. So as not to underestimate their costs (and overestimate thee¡ects of the cartel), the calculations presented below use what came to
price wars and collusion in bromine pre-world war i 123
ß Blackwell Publishers Ltd. 1997.
be the consensus opinion at the Dow Chemical Company, 12¿ apound.8
I assume that the downstream ¢rms converted bromine into potassiumbromide with a Leontief, ¢xed proportions technology, so the costfunction for converting bromine to potassium bromide has the form
MCKBr � bPbromine �CPpotash � t
where b and C are technical coe¤cients measuring the liquid bromineand potash contained in a pound of potassium bromide and t is the costincurred converting bromine into a pound of potassium bromide. Pbromine
and Ppotash are the prices of potash and bromine. The latter was publishedweekly in the Oil, Paint and Drug Reporter, and its average cost was fourcents per pound. While a bromine price was published in the Oil, Paint andDrug Reporter, the relevant price is that paid by Mallinckrodt and P&W,and speci¢ed in pool contracts. I do not have the NBC contract prices, butI do know those in Shields' contracts, and they are used below.9 Theparameters of the potassium bromide cost function �b;C and t) aredetermined from estimates in the Dow correspondence, as well as Dow'sown production records and an estimate made, in 1910, of what it wouldcost Dow to convert Ohio River bromine to potassium bromide.
In the 1896^97 correspondence, Osborn and Helman give, at di¡erenttimes, ¢gures implying a b of .7 and .75. In 1910, Shields told Dow thatthere were 85 pounds of bromine in a hundred pounds of potassiumbromide. Herbert Dow's 1910 estimate of the cost to Dow of convertingOhio River bromine assumed a b � :8. A few months later Dow wrote tothe ¢rm's German distributor that there were approximately two thirds ofa pound of bromine in a pound of potassium bromide. Since the highest
8 The Ohio River manufacturers all produced bromine as a by-product to the manufactureof salt, so changes in the price of salt might a¡ect the output of bromine. The price of salt wasfalling over the entire period covered by this study, and salt producers in the Ohio River regionwere facing increasing competition from new sources of supply (Levenstein [1995]). Theprimary impact of this decline in salt prices was the exit of several ¢rms over the period. Whilethe calculations below assume that there were twelve producers, by 1910 there were only eightactive domestic producers. The combination of low salt prices and low bromine prices duringthe 1905^1908 price war and Ohio River £ooding caused the exit of four producers. Becausethe production technology required that salt be extracted before bromine, I, like Dow, treat thecost of salt production as a ¢xed cost. Herbert Dow described the cost of bromine as 12¿ perpound, ``plus the loss on salt'' (memorandum, 27 January 1902). When the Midland wasthinking of ``dead renting'' the Ohio River bromine plants in 1896 it had discussions with theUnited Salt Company, an Ohio salt pool, with the hope that it would contribute to the cost ofshutting down competitor plants. Acknowledging the ease of entry in salt production, UnitedSalt decided not to pursue the dead renting strategy. The price of salt, and its pro¢t or loss tothe Ohio River ¢rms, is never again discussed in Dow documents, suggesting that it had littlee¡ect on the marginal output decisions of the Ohio River ¢rms.
9 Shields purchased the entire stock on hand in 1892 at 14¿ per pound. The Ohio Riverproducers received 16¿ per pound during the ¢rst year of the contract, and a 2¿ increase eachyear (up to 22¿).
124 margaret c. levenstein
ß Blackwell Publishers Ltd. 1997.
estimate of b (.85) comes from Shields, who generally had an incentive tounderstate the costs of making potassium bromide from Ohio Riverbromine, and since I am attempting to bias the results away from largecartel e¡ects, the cost function below uses that estimate.
The estimates of C, the amount of potash in a pound of potassiumbromide, in the Dow correspondence vary. Fortunately, Dow's ownproduction records themselves augment these. While Dow's productionprocess di¡ered from that used by its competitors, the physicalrequirements of potash were approximately the same. As was the casefor the other parameters, the lowest estimate of C, .25, comes fromOsborn. In concurrent correspondence, Helman reports numbers fromShields which imply a C of .44. These ¢gures are substantially belowthat implied by Dow's own production records. Production recordsfrom Dow's two bromides plants for both 1905 and 1906 each give aC of approximately .58. In Dow's 1910 estimate, he assumed that .57pounds of potash were necessary to make a pound of potassiumbromide from bromine. The conversion cost function rounds thesehighest estimates up to give a C of .6.
There is even less information available about the parameter t, the costincurred by Mallinckrodt and P&W in converting bromine to potassiumbromide. Even Shields probably had no direct information about thesecosts, and Dow's correspondence with Mallinckrodt and P&W nevermentions their conversion costs. Shields claimed, and most of the 1896^97Midland Chemical Company correspondence assumed, that this cost wasabout 1¿ per pound, though Cooper at one point claimed that it might beas high as 5¿ per pound. In 1910 Herbert Dow estimated that the labor,packaging, and fuel to convert bromine to potassium bromide would costDow about 3.9¿ per pound. Unfortunately, the extant production recordsdo not include any information on Dow's conversion costs once it didpurchase Ohio River bromine. Since Dow would have used the sameprocess as Mallinckrodt and P&W, but with less experience in doing so,Dow's projections were probably above the costs of the establisheddistributors. Nevertheless, I round this estimate up and assume a t of 4¿.
III(iii). A potassium bromide demand function
For simplicity, I estimate a linear demand function for potassiumbromide,
PKBr � aÿ GQKBr � ui
The demand function was estimated using annual data between 1880 and1914. Weekly data are available for price, but not output. In any case,using annual data minimizes the problems created by speculative demandin response to publicly observed breakdowns in collusion, by averaging
price wars and collusion in bromine pre-world war i 125
ß Blackwell Publishers Ltd. 1997.
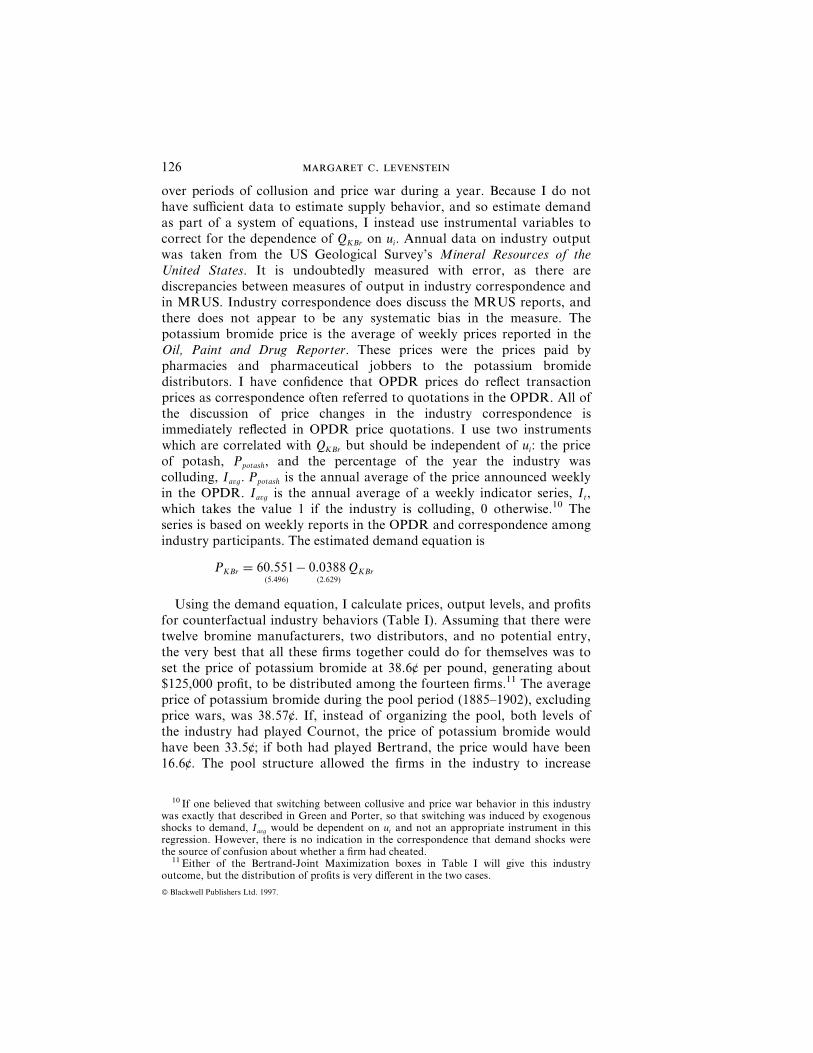
over periods of collusion and price war during a year. Because I do nothave su¤cient data to estimate supply behavior, and so estimate demandas part of a system of equations, I instead use instrumental variables tocorrect for the dependence of QKBr on ui. Annual data on industry outputwas taken from the US Geological Survey's Mineral Resources of theUnited States. It is undoubtedly measured with error, as there arediscrepancies between measures of output in industry correspondence andin MRUS. Industry correspondence does discuss the MRUS reports, andthere does not appear to be any systematic bias in the measure. Thepotassium bromide price is the average of weekly prices reported in theOil, Paint and Drug Reporter. These prices were the prices paid bypharmacies and pharmaceutical jobbers to the potassium bromidedistributors. I have con¢dence that OPDR prices do re£ect transactionprices as correspondence often referred to quotations in the OPDR. All ofthe discussion of price changes in the industry correspondence isimmediately re£ected in OPDR price quotations. I use two instrumentswhich are correlated with QKBr but should be independent of ui: the priceof potash, Ppotash, and the percentage of the year the industry wascolluding, Iavg: Ppotash is the annual average of the price announced weeklyin the OPDR. Iavg is the annual average of a weekly indicator series, It,which takes the value 1 if the industry is colluding, 0 otherwise.10 Theseries is based on weekly reports in the OPDR and correspondence amongindustry participants. The estimated demand equation is
PKBr � 60:551�5:496�
ÿ 0:0388�2:629�
QKBr
Using the demand equation, I calculate prices, output levels, and pro¢tsfor counterfactual industry behaviors (Table I). Assuming that there weretwelve bromine manufacturers, two distributors, and no potential entry,the very best that all these ¢rms together could do for themselves was toset the price of potassium bromide at 38.6¿ per pound, generating about$125,000 pro¢t, to be distributed among the fourteen ¢rms.11 The averageprice of potassium bromide during the pool period (1885^1902), excludingprice wars, was 38.57¿. If, instead of organizing the pool, both levels ofthe industry had played Cournot, the price of potassium bromide wouldhave been 33.5¿; if both had played Bertrand, the price would have been16.6¿. The pool structure allowed the ¢rms in the industry to increase
10 If one believed that switching between collusive and price war behavior in this industrywas exactly that described in Green and Porter, so that switching was induced by exogenousshocks to demand, Iavg would be dependent on ut and not an appropriate instrument in thisregression. However, there is no indication in the correspondence that demand shocks werethe source of confusion about whether a ¢rm had cheated.
11 Either of the Bertrand-Joint Maximization boxes in Table I will give this industryoutcome, but the distribution of pro¢ts is very di¡erent in the two cases.
126 margaret c. levenstein
ß Blackwell Publishers Ltd. 1997.

pro¢ts to very nearly the monopoly level.12 The pool's exclusive sellingcontracts also foreclosed competition at the distributor level which mighthave arisen in the ``Cournot^Cournot'' scenario where the distributorscaptured almost 80% of industry pro¢ts.
I can also compare the prices received by the bromine producers duringthe Shields pool with those under various counterfactual alternatives. Ifthe twelve bromine producers had been able to cooperate perfectly and
Table ITable of Counterfactual Prices and Quantities
(quantities in thousand pounds)
Demand Curve for Potassium Bromide: PKBr � 60:55ÿ 0:0388QKBr
Demand Curve for Bromine, if distributors are Bertrand competitors: PBr � 63:7ÿ 0:0537QBr
Demand Curve for Bromine, if distributors are Cournot competitors: PBr � 63:7ÿ 0:0806QBr
Demand Curve for Bromine, if distributors are monopolists: PBr � 63:7ÿ 0:1074QBr
Upstream (Bromine) Industry Structure (12 ¢rms)
Bertrand Cournot Joint Pro¢tMaximization(among upstreambromine ¢rms)
Bertrand PBr � 12.0¿ PBr � 16.0¿ PBr � 37.8¿PKBr � 16.6¿ PKBr � 20.0¿ PKBr � 38.6¿QBr � 962.9 lbs. QBr � 888.3 lbs. QBr � 481.4 lbs.QKBr � 1132.8 lbs. QKBr � 1045.1 lbs. QKBr � 566.4 lbs.IIBr � 0 IIBr � 35.5 IIBr � 124.6IIKBr � 0 IIKBr � 0 IIKBr � 0
Cournot PBr � 12.0¿ PBr � 16.0¿ PBr � 37.8¿PKBr � 31.2¿ PKBr � 33.5¿ PKBr � 45.9¿QBr � 641.9 lbs. QBr � 592.4 lbs. QBr � 320.9 lbs.QKBr � 755.2 lbs. QKBr � 696.7 lbs. QKBr � 377.9 lbs.IIBr � 0 IIBr � 23.7 IIBr � 82.8IIKBr � 110.3 IIKBr � 94.1 IIKBr � 39.3
Joint Pro¢t PBr � 12.0¿ PBr � 16.0¿ PBr � 37.8¿Maximization PKBr � 38.6¿ PKBr � 40.3¿ PKBr � 49.5¿(among downstream QBr � 481.4 lbs. QBr � 444.4 lbs. QBr � 240.7 lbs.bromide distributors) QKBr � 566.4 lbs. QKBr � 522.6 lbs. QKBr � 284 lbs.
IIBr � 0 IIBr � 17.8 IIBr � 62.1IIKBr � 124.6 IIKBr � 106.1 IIKBr � 31.3
Note: QBr is always equal to :85� QKBr because of the Leontief technology. It would be impossible for the
potassium bromide distributors to buy less, and not cost minimizing to buy more.
Downstream(PotassiumBromide)IndustryStructure(2 ¢rms)
12 The total deadweight loss induced by collusion, using the average (non-price war) poolprice of 38.6¿, was about $62,219 per year. While for the average consumer this amounted tovirtually nothing (about one twelfth of a penny per capita in 1900), it is about 28% ofpredicted average industry revenues.
price wars and collusion in bromine pre-world war i 127
ß Blackwell Publishers Ltd. 1997.

achieve the joint-pro¢t maximizing output level, they would have receiveda price of 37.8¿ for a pound of their liquid bromine. They did not receiveanything close to that under the Shields contracts; the highest pricereceived was 22¿. That was, however, substantially above the price theywould have been able to achieve if they simply played Cournot (16¿). Infact, 16¿ was exactly the price they received in the ¢rst year of the Shieldscontracts, with prices increasing each year as cooperation wasmaintained.
The Midland Chemical Company similarly pro¢ted from thearrangements it made to cooperate with the pool distributors. From 1897to 1902, Midland (after 1900, Dow) received 25¿ for each pound of itspotassium bromide, while its average cost per pound was about 8¿. Anexplicit counterfactual analysis is more di¤cult in this case, because it isunclear what industry structure would have obtained as the industryadjusted to the new entrant and to its lower cost technology. But with amarkup over cost of over 200%, the contracts with Mallinckrodt andP&W certainly rewarded Midland generously for its agreement not to tryto ¢nd out what that structure might be.
After 1902, Dow's average cost increased, as its new contracts requiredthat it produce a wider variety of bromide salts than had previously beenthe case. Between 1902 and 1905, Dow's bromide cost averaged 1014¿.Dow's contract speci¢ed that it receive 80% of the sales price (the OPDRprice given the understanding with Mallinckrodt). With an average priceof 28.7¿, the price-cost margin during cooperative periods between 1902and 1905 averaged 12.7¿, more than a 100% markup over cost.13 Collusionwas even more successful after the agreement between Dow and the OhioRiver was signed in 1910. The average price of potassium bromide was33.1¿, so that Dow's markup on its cost was over 150%. Some of this pro¢twas shared with the Ohio River producers. Dow bought Ohio Riverbromine at a price tied to the price of potassium bromide, so that theaverage price Dow paid the Ohio River producers between 1910 and 1914was about 17.8¿. Dow's successful entry had eroded their bargainingpower, so that the price of bromine was lower than during the Shieldspool, but it was still above what they would have received as Cournotcompetitors.
Finally, while the counterfactual calculations in Table I assume constantcosts over time, it is also possible to compare £uctuations in prices with£uctuations in costs. Figure 2 displays the £uctuations in the cost of apound of potassium bromide during the Shields pool. Fluctuations in costare driven by changes in the price of potash and annual increases in the
13 In reality, the price-cost margin was greater than this. This calculation compares theaverage cost of producing all bromides with the price received on potassium bromide. Theprices received on other bromides were substantially higher.
128 margaret c. levenstein
ß Blackwell Publishers Ltd. 1997.

price of liquid bromine, speci¢ed in Shields' contracts. Figure 2 comparesthe distributors' cost with the market price of potassium bromide. Theaverage price during this period was 40.9¿, while the average cost was24.l¿.14 The distributors' average markup over cost during the Shields poolwas almost seventy percent.15 Fluctuations in the cost of potassiumbromide do not explain changes in its price. The correlation betweenchanges in price and cost is not even positive (ÿ0.042).
Thus, it is clear that the pool allowed the ¢rms in the industry to
Figure 2Potassium Bromide Cost Function Using Ohio River Bromine: MCKBr � bPbromine � pPPotash � tNote: b � :85, p � :6, t � :04: PBROMINE is the price paid by Mallinckrodt and P&W, asspeci¢ed in pool contracts. PPotash is the annual average of weekly prices listed in the Oil, Paintand Drug Reporter.
14 The high average price for potassium bromide during the Shields pool may re£ect anincrease in demand, which would have increased the joint pro¢t-maximizing price. Butindustry participants much more frequently complained of stagnant demand than mentionedany increase. Thus it is likely that the increased price also re£ects the e¡ect of doublemarginalization on industry price and output levels. Using the prices Shields charged thedistributors for liquid bromine, and the potash prices that prevailed over the same period theMCKBr was 24.1¿. That increases the distributors' joint pro¢t-maximizing price to 42.3¿.
15 A similar comparison could be made between the distributors' cost using Dow bromides.Between 1897 and 1902, Mallinckrodt and P&W paid Dow 25¿ per pound, and also incurreddistribution costs. Thus their pro¢t on Dow bromides was somewhat less than on Ohio Riverbromine.
price wars and collusion in bromine pre-world war i 129
ß Blackwell Publishers Ltd. 1997.
increase prices and pro¢ts above any reasonable counterfactual non-collusive behavior. For much of the time, they were able to charge pricesvery close to the monopoly level. Despite the heroic assumptions necessaryto compute counterfactual prices we can have con¢dence in them as theycorrespond remarkably closely with relevant prices set over the course ofthe industry's collusive history. For example, when Dow, having agreed todivide up world markets with the Deutsche Bromkonvention, wanted toforce the Ohio River producers to contract directly with itself, Dow set theprice of the downstream product so that the upstream ¢rms would haveno incentive to vertically integrate downstream. Dow set PKBr at 19¿ perpound for almost two years, just below the price �PKBr � 20¿) that wouldhave obtained if the Ohio Rivers played Cournot and converted anddistributed their output themselves, as some of them attempted to do (theCournot-Bertrand combination in Table 1).
iv. comparing models of price wars
Six price wars disrupted cooperation during the period of this study(Figure 1). Each of these price wars was described as such in the Oil, Paintand Drug Reporter which regularly and explicitly discussed pool activity.Three price wars preceded Dow's entry into the industry (Pool Wars I, II,and III), and three followed (Dow Wars I, II, and III).Friedman [1971] demonstrated that o¡-the-equilibrium-path threats of
permanent Cournot reversionöa price waröcould induce collusion in asu¤ciently patient industry. But in Friedman's equilibrium no price warwas ever observed. In contrast, Green and Porter [1984] and APS argue thatthe successful use of punishment threats in an industry where cheating isunobservable will occasionally require their implementation. When ¢rmscannot directly observe deviations from prescribed strategies (``cheating''),they rely on observations of a public variable (e.g. price) whose distributiondepends jointly on the actions of each ¢rm (e.g. each ¢rm's output) and arandom disturbance. When the public variable falls into a certain range(e.g. prices fall below some p�) ¢rms revert to punishment behavior (e.g.higher output levels). Since ¢rms cannot distinguish between cheating andlow realizations caused by random £uctuations, they must punish to keepincentives intact.
Many aspects of the collusion in bromine resonate with the intuition ofthis class of games. First, the repeated interaction of ¢rms was crucial tothe success of cooperation. The clearest evidence of this is theinstantaneous breakdown of cooperation between the Americans andGermans upon the outbreak of war in 1914. The war prevented theGermans from exporting their goods. When the threat to punish cheatingin the present with low prices in the future became empty, collusionbetween the Americans and Germans was no longer sustainable.
130 margaret c. levenstein
ß Blackwell Publishers Ltd. 1997.
Second, one agreement between the Dow Chemical Company andthe Deutsche Bromkonvention explicitly included ``equilibrium punish-ments.'' The contract prohibited the parties from exporting into eachothers' exclusive territory. It provided speci¢c penalties, far short ofpermanent Cournot reversion, if such exports (or their observationalequivalent) did occur. The speci¢ed punishment was a simple tit-for-tat rule (Axelrod [1984]). It reads,
Should, contrary to agreement, American bromin or its salts arrivein Europe during the continuance of this agreement the Germans areat liberty to send the corresponding quantity of bromin, or its salts,for sale to the North American market . . . Should European bromin,or its salts, be shipped to North America the Americans will be atliberty to send to Europe the same quantity of bromin or its salts tothe same equivalent as was imported into North America.
While there were instances of bromine products exported into exclusiveterritory (usually by a third party), this punishment was neverimplemented. Instead, the parties would agree on a dollar amount to bepaid by the presumed violator to the aggrieved party. The penalty wasusually equivalent to the presumed pro¢t on the transaction, though inone case of an egregious violation that Dow acknowledged havingcommitted, an additional penalty was imposed.
Third, bromine industry participants could only imperfectly monitorone another. Three kinds of cheating were possible. Bromine producerscould sell outside the pool. The distributors could sell bromides below theagreed upon price. Or they could sell bromides in markets that weresomeone else's exclusive territory. Even if no regular participant in thebromine industry engaged in any of these activities, the storability ofbromine meant that third parties could sell goods purchased during anearlier price war. The possibility of such speculative activity increased thedi¤culty of monitoring compliance. The bromine pool relied on threemethods for detecting possible violations: 1) secret, direct observation ofplant activity (spying), 2) monitoring £uctuations in customer demand,and 3) monitoring government reports on imports and exports. None ofthese methods provided perfect information.
Finally, price wars threats were used to induce cooperation with thecartel. Correspondence among industry participants is replete with direwarnings of imminent price wars if the reader did not cooperate. InternalMidland Chemical Company documents are explicit that such threatsinduced the company's cooperation. Shortly after it began producingbromides, Shields threatened to resume the price war of the previous yearif Midland did not agree to sell its entire output to him, on the same termsas the Ohio River producers had. Midland agreed to restrict its output
price wars and collusion in bromine pre-world war i 131
ß Blackwell Publishers Ltd. 1997.
and sell only to Mallinckrodt and P&W, despite Herbert Dow's statedpreference to sell independently of the pool.
Similar concerns explain Midland's continued cooperation with thepool. Because its technology had increasing returns, Midland was anxiousto increase its output.16 Between 1894 and 1896, Midland's output quotaincreased from 100,000 to 150,000 pounds, far below its capacity of over350,000 pounds per year. When negotiations began in 1896 to renew thecontracts with Midland and the Ohio River producers, Midlandconsidered breaking from the pool. The contract Midland eventuallysigned limited its annual output to 200,000 pounds. The acceptance of acontract with which it was clearly unsatis¢ed was the result of its beliefthat P&W and Mallinckrodt had accumulated 800,000 pounds of bromine,which they had threatened to dump on the market if Midland did notagree to cooperate. Midland was afraid that the pool would bankrupt theyoung ¢rm, and so chose instead to cooperate.
Thus in many respects the intuition of Green and Porter and APS isborne out in the bromine case. There are di¡erences between these twomodels; with the data available, it is possible, in a limited way, to comparetheir applicability to the bromine case. Green and Porter assumes that¢rms will revert to one-shot Cournot behavior during price wars, andpredicts that price wars will either be permanent or last a ¢xed number ofperiods. APS, on the other hand, predicts that ¢rms will switch back andforth between two states: maximal collusion and maximal punishment(potentially more severe than Cournot reversion).17 The simplicity of theAPS optimal strategy, in which ¢rms play one of two actions, dependingonly on the prior period realization of the public variable, is appealingboth for its analytical elegance and the ease with which such a simplestrategy could actually be implemented.
These qualitative characteristics of APS price wars (described in TableII) seem at variance with those observed in the bromine industry. The APSoptimal punishment prescribes the same behavior across price wars andthe same behavior in every period of the price war. There is, however,substantial variation in the characteristics of the bromine price wars. Theinitial fall in price ranges from 1¿ to 15¿, or 3% to 50% (Table II). The
16 An obvious question is why P&W and Mallinckrodt did not purchase their entirerequirements at a lower price from Midland. First, the Ohio River ¢rms would notimmediately exit. Second, P&W and Mallinckrodt did not want to accept the risk of having asole supplier of their bromine requirements.
17 This implies that, in the APS case, the state of the industry follows a ¢rst-order Markovprocess. I conducted several tests of whether the state of collusion in the bromine industryfollowed a Markov process. While these tests could not reject the hypothesis of a ¢rst-orderMarkov, they were largely inconclusive. More importantly they could not distinguish betweena ¢rst-order Markov process and a series generated by a much more complex set of strategiesin which the probability of a price war was lower immediately following the implementationof a collusive agreement. See the Journal's editorial Web site for details of these test results.
132 margaret c. levenstein
ß Blackwell Publishers Ltd. 1997.

duration of price wars varies from 6 to 201 weeks, the total drop in pricefrom nothing to almost 60%. This variety may re£ect stochastic£uctuations as well as structural change in the industry. But some pricewars also display change in behavior within a single price war, with pricesspiraling down over the course of the war. In these cases, there was not aswitch to a single, commonly understood, worst punishment.
The bromine industry did not use punishments more severe thanCournot reversion. In four of six wars, the price decline was not largeenough to reduce the expected present discounted value of the ¢rm's futurepro¢t stream below the Cournot reversion level. Only the low prices ofPool III and Dow III wars reached the one-shot Cournot level.18
(Compare Tables I and II). Prices never fell below marginal costs.19
There are several reasons why the bromine price wars were generally less
Table IICharacteristics of Price Wars Compared
Price War 1886^1887 1888 1891^1892 1902 1903 1905^1908
Price warName
Pool I Pool II Pool III Dow I Dow II Dow III
Initial Drop(¿)
2¿ 1.5¿ 1¿ 4¿ * 15¿
Initial Drop(%)
6.0% 4.4% 3.0% 9.1% * 50%
Total Drop(¿)
2¿ 1.5¿ 13¿ 19¿ * 17¿
Total Drop(%)
6.0% 4.4% 39.4% 43.2% * 56.7%
Duration(weeks)
22 12 82 6 21 201
Weeks totrough
1 1 73 6 * 149
Low price 32¿ 32.5¿ 20¿ 25¿ * 13¿
* There was an 18¿ price spread in the quotations for potassium bromide during this Dow War II.Virtually no quantities were exchanged. This was the only time during the period studied when there wasany spread in published price quotations.Note: All price data are from the Oil, Paint and Drug Reporter. Price wars periods are determinedindependently of prices, from reports in the OPDR and in internal industry documents.
18 The low price during Dow War III is 13¿, less than the 20.5¿^23.6¿ range for the Cournotprice reported in Table I. But the cost function presented re£ects the costs of the Ohio Riverproducers. Dow's costs were much lower so the estimates in Table I no longer apply in 1905,when Dow produced more than half the US output.
19 This is true as well for Dow War III, when prices are compared to Dow's costs. Thelow price reached was 13¿, but Dow's marginal cost was less than 10¿.
price wars and collusion in bromine pre-world war i 133
ß Blackwell Publishers Ltd. 1997.
severe than those contemplated in the theoretical literature. First, poolmembers discounted threats which they believed too severe to be credible.Dow dismissed claims that other ¢rms would lower price below their owncosts. Dow demanded veri¢cation of the inventories Mallinckrodt andP&W claimed to have ready to dump on the market. Threats designed tosupport collusion were useful only when credible. When imperfectinformation led to the implementation of such threats, the ensuing pricewars were relatively mild.
Second, the possibility of storing bromine for future use, or for re-sale,increased the costs of price wars. At the end of any price war, the demandfaced by pool members remained low until speculative output had beenconsumed and the market price had reached the pool price. The increasedcosts of engaging in price wars with storable goods decreased the severityof the optimal price war punishment. This issue was not unique to thebromine industry, however, or even to manufactured goods industries. Forexample, the JEC's customers, understanding that there was a possibilityof a price war among railroad lines, would store their grain in the west inanticipation of a price cut (Ulen [1979], pp. 165^166). Thus the possibilityof arbitrage, by customers or third parties, makes it likely that the optimalpunishment will be less severe than that contemplated in APS.
Finally, there seems implicit in each price war a reputational cost, suchthat if other ¢rms believed that some participant had cheated, collusion inthe future would be harder to sustain.20 This implicit cost may have madeit possible for relatively mild punishments to sustain collusion.
Thus, the qualitative characteristics of the bromine price wars seemto di¡er in important ways from those implied by APS strategies. Inparticular, equilibrium punishments more severe than Cournot were notused in this industry, for reasons that are common to many otherindustries. Even in the most e¡ective bromine cartel, established byDow and the Deutsche Bromkonvention, the written agreement did notpretend to call forth punishments as severe as contemplated in thetheoretical literature. In practice, even those punishments were ofteneschewed as the two parties set up mechanisms to provide themselveswith more information about, and therefore, to deter, cheating. Theyalso collected information that allowed them to identify probabilisticallythe likely perpetrator of any cheating. They then introduced ¢rm-speci¢cpunishments, transferring pro¢ts from one ¢rm to another, rather thanusing punishments that lowered pro¢ts to the industry as a whole.Although ``simple'' strategies have analytical elegance, ¢rms in thebromine industry were happy to avail themselves of more complexstrategies if necessary to collude successfully.
20While their model is di¡erent from those discussed here, the intuition is similar to thatin Kreps, Milgrom, Roberts, and Wilson [1982].
134 margaret c. levenstein
ß Blackwell Publishers Ltd. 1997.
There were two price warsöPool III and Dow IIIöin which pricesdid fall below Cournot levels (Tables I and II). But this severity seems tohave arisen from a di¡erence in the underlying cause of the price wars,rather than in the severity of the optimal punishment. These two pricewars were more like Stiglerian collusive breakdowns than ``imperfectmonitoring'' price warsöwhich arise not from real cheating, but fromindistinguishable stochastic shocks. While imperfect informationproblems exacerbated and lengthened these two price wars, they bothbegan with very public announcements that participants were violatingthe existing agreement. Dow War III began with a public announcementthat the Germans were willing to sell below the pool price, in response toDow's very real exports to Europe in violation of their understandingwith the Germans. Similarly, Pool War III began with a publicrenunciation of the existing agreement by the Ohio River bromineproducers. In both cases, industry participants understood that theseannouncements were part of a strategy to renegotiate the distribution ofrents. In these cases, the limits on the severity of price wars did notobtain as prices fell nearly all the way to marginal costs. These price warswere part of the negotiation of a new collusive arrangement, not apunishment phase that would help to re-establish an existing one. At leastin the case of Dow War III, the collusive agreement broke downfollowing a change in the relative costs of ¢rms in the industry.Competition during the price war revealed information about ¢rm costsand staying power, and thus provided the ground rules for thenegotiation of a new collusive agreement.
conclusion
From 1885 to 1914, participants in the bromine industry colluded,increasing prices and pro¢ts. Some of the mechanisms used to sustain thiscollusion resemble those described in the repeated game literature. Assuggested by Friedman [1971], threats of price wars helped sustaincollusion. Imperfect monitoring problems contributed to at least some ofthe six price wars observed. While there are similarities to the punishmentstrategies proposed by Abreu, Pearce and Stacchetti [1986], the bromineprice wars were not as severe as they contemplated. Arbitrage increasedthe cost and limited the severity of imperfect monitoring price wars.Threats of severe price wars were not considered credible. The most severeprice wars seem to have resulted not from monitoring problems, but fromthe more basic disagreements which inherently plague attempts to collude.The bromine case provides evidence in support of Green and Porter's[1984] claim that the occurrence of price wars is not inconsistent withsuccessful collusion. But if game-theoretic metaphors of equilibrium price
price wars and collusion in bromine pre-world war i 135
ß Blackwell Publishers Ltd. 1997.

wars are to have meaning, they must be disguishable from price warswhich re£ect a breakdown in collusion. The bromine industry providesexamples of both.
MARGARET C. LEVENSTEIN ACCEPTED OCTOBER 1996Department of Economics,University of Michigan,Ann Arbor, MI 48109-1220,USAemail: [email protected]
references
Abreu, D., Pearce, D. and Stacchetti, E., 1986, `Optimal Cartel Equilibria withImperfect Monitoring,' Journal of Economic Theory, 39, pp. 251^269.
Axelrod, R., 1984, The Evolution of Cooperation, Basic Books, New York.Burns, A. R., 1936, The Decline of Competition: A Study of the Evolution ofAmerican Industry (McGraw-Hill, New York).
Davis, L. E., 1965, `The Investment Market, 1870^1914: The Evolution of aNational Market,' Journal of Economic History, 25, pp. 355^399.
Friedman, J. W., 1971, `A Non-cooperative Equilibrium for Supergames,' Reviewof Economic Studies, 38, pp. 1^12.
Green, E. J. and Porter, R. H., 1984, `Non-cooperative Collusion Under ImperfectPrice Information,' Econometrica, 52, pp. 87^100.
Haynes, W., 1954, American Chemical Industry: Background and Beginnings v I.(D. Van Nostrand, New York).
Kreps, D., Milgorm, P., Roberts, J. and Wilson, R., 1982, `Rational Cooperationin the Finitely Repeated Prisoners' Dilemma,' Journal of Economic Theory, 27,pp. 245^252, 486^502.
Levenstein, M. C., 1993, `Price Wars and the Stability of Collusion: A Study ofthe Pre-World War I Bromine Industry' DAE Working Paper 50, NationalBureau of Economic Research, Cambridge, Mass.
Levenstein, M. C., 1995, `Mass Production Conquers the Pool: Firm Organizationand the Nature of Competition in the Nineteenth Century' Journal of EconomicHistory, 55, pp. 575^611.
Levenstein, M. C., 1997, Accounting For Growth: Competition, InformationSystems, and the Creation of the Large Corporation, Stanford University Press,Stanford, CA.
Porter, R. H., 1983, `A Study of Cartel Stability: The Joint Executive Committee,1880^1886,' Bell Journal of Economics, 14, pp. 301^314.
Slade, M. E., 1991, `Market Structure, Marketing Method, and Price Instability,'Quarterly Journal of Economics, 106, pp. 1309^1340.
Stigler, G. R., 1964, `A Theory of Oligopoly,' Journal of Political Economy, 72,pp. 44^61.
Stocking, G. W. and Watkins, M. W., 1951, Monopoly and Free Enterprise,Twentieth Century Fund, New York.
Ulen, T. S., 1979, Cartels and Regulation: Late Nineteenth Century RailroadCollusion and the Creation of the Interstate Commerce Commission. Ph.D.dissertation: Stanford University.
136 margaret c. levenstein
ß Blackwell Publishers Ltd. 1997.
US Census, 1880, `Chemical Products and Salt,' Report on the Manufactures ofthe United States at the Tenth Census, GPO, Washington, DC.
US Department of Commerce, 1975, Historical Statistics of the United States:Colonial Times to 1970, Part 1 (GPO, Washington, DC).
US Geological Survey, 1883^1915, `Bromine,' Mineral Resources of the UnitedStates, GPO, Washington, DC.
Bibliographical NoteThe Herbert H. Dow Papers are housed in the Post Street Archives, Midland,Michigan.
The Oil, Paint and Drug Reporter was ¢rst published in 1871. It has since beensuperseded by the Chemical Marketing Reporter.
price wars and collusion in bromine pre-world war i 137
ß Blackwell Publishers Ltd. 1997.