price discovery, volatility spillovers and adequacy of speculation in cheese spot and futures...
TRANSCRIPT
1
Price Discovery, Volatility Spillovers and Adequacy of Speculation in Cheese Spot and
Futures Markets
Marin BozicUniversity of Minnesota-Twin Cities
NDSU Seminar, 10/28/2011
2
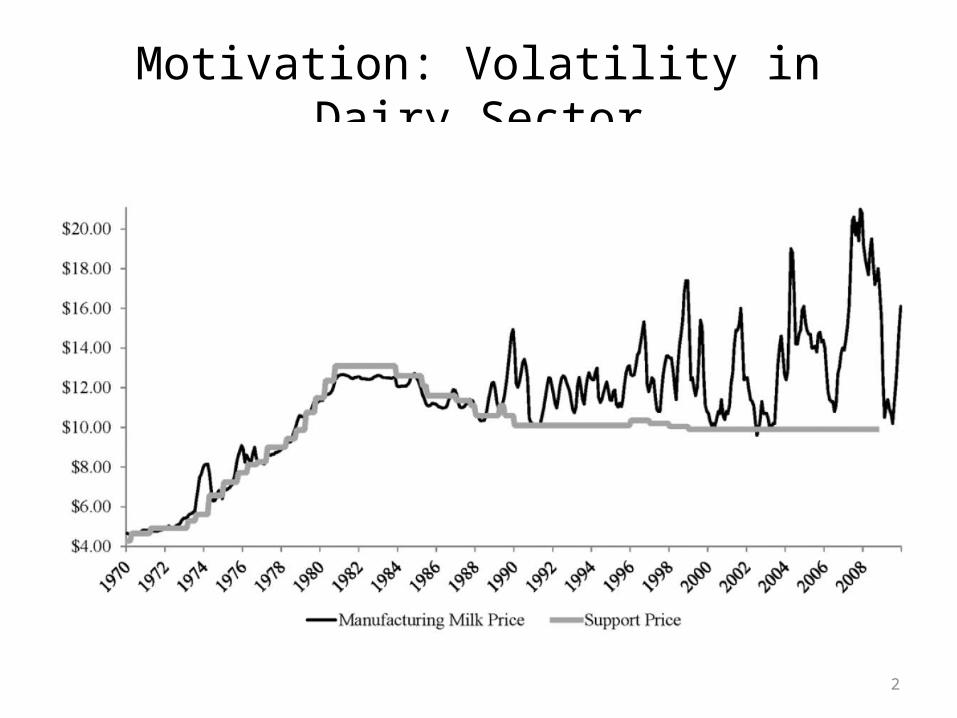
Motivation: Volatility in Dairy Sector
3
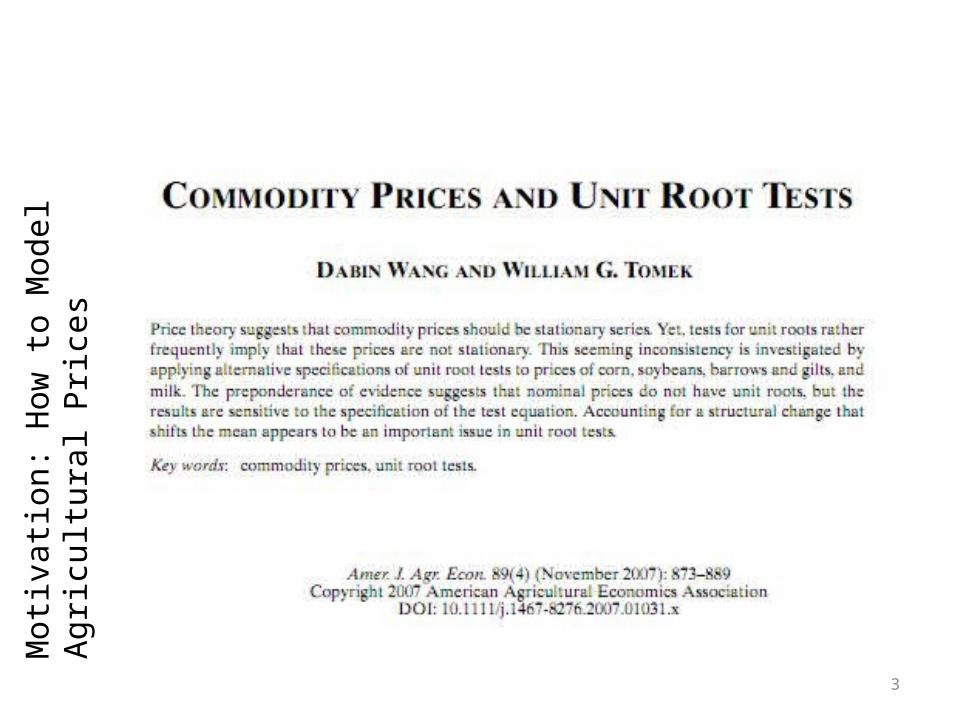
Moti
vatio
n: H
ow to
Mod
el A
gric
ultu
ral P
rices
4
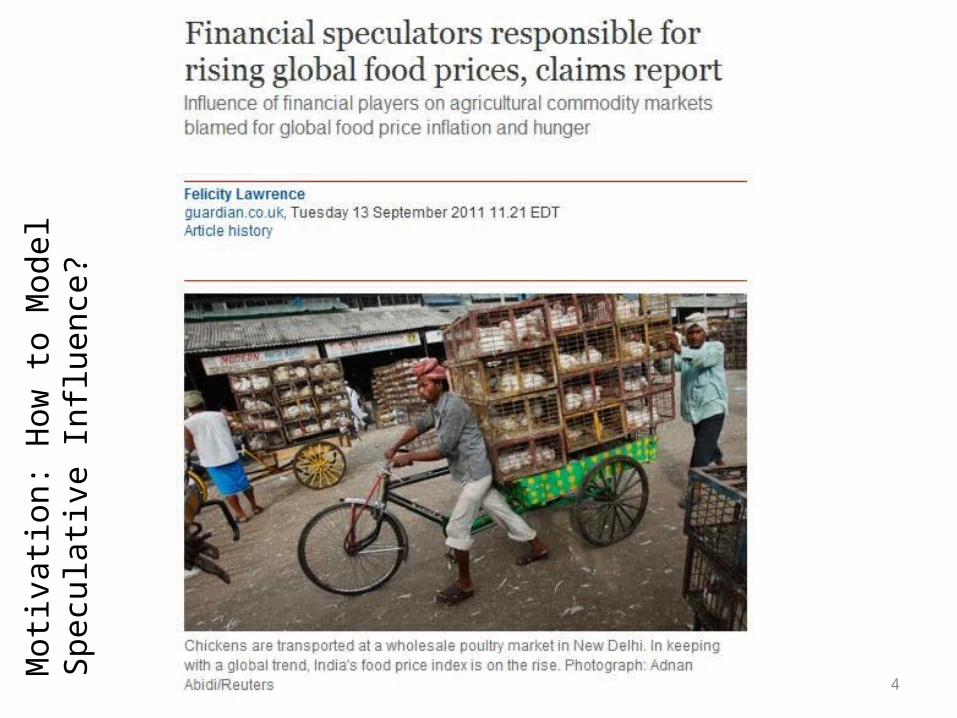
Moti
vatio
n: H
ow to
Mod
el S
pecu
lativ
e In
fluen
ce?
5
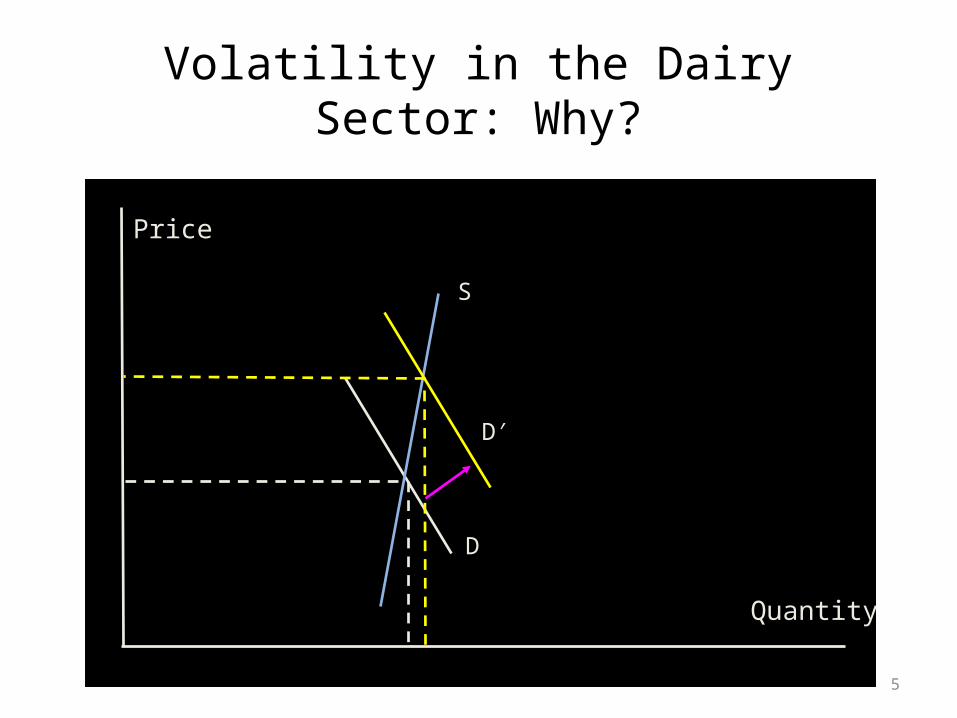
Volatility in the Dairy Sector: Why?
S
D
D′
Quantity
Price

6
Volatility in the Dairy Sector: Why?
7
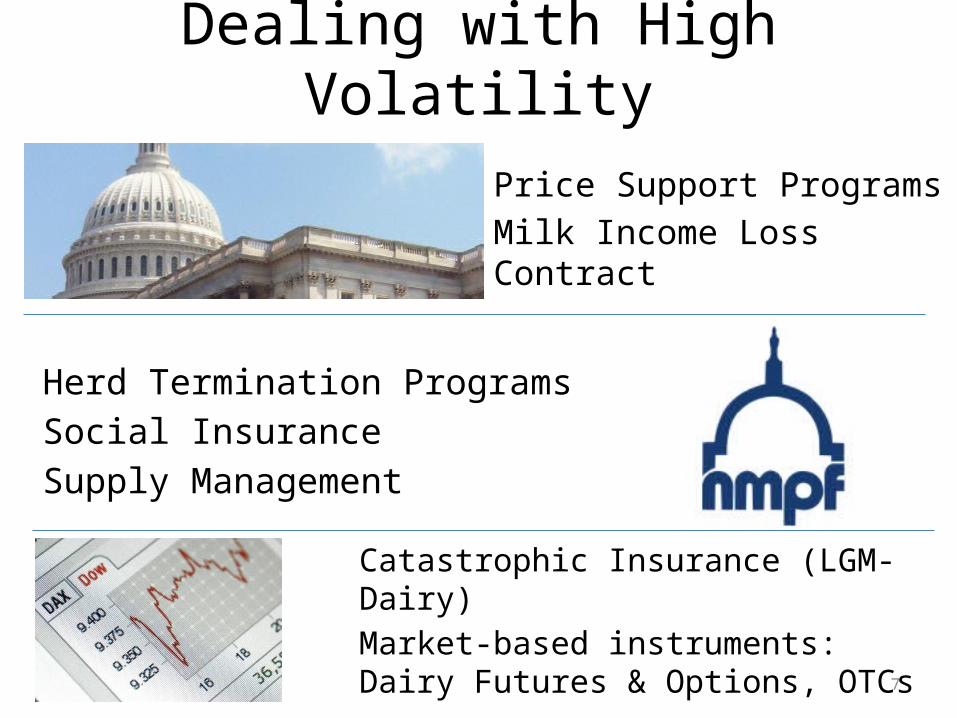
Dealing with High Volatility
Price Support ProgramsMilk Income Loss Contract
Catastrophic Insurance (LGM-Dairy)Market-based instruments: Dairy Futures & Options, OTCs
Herd Termination ProgramsSocial InsuranceSupply Management
8
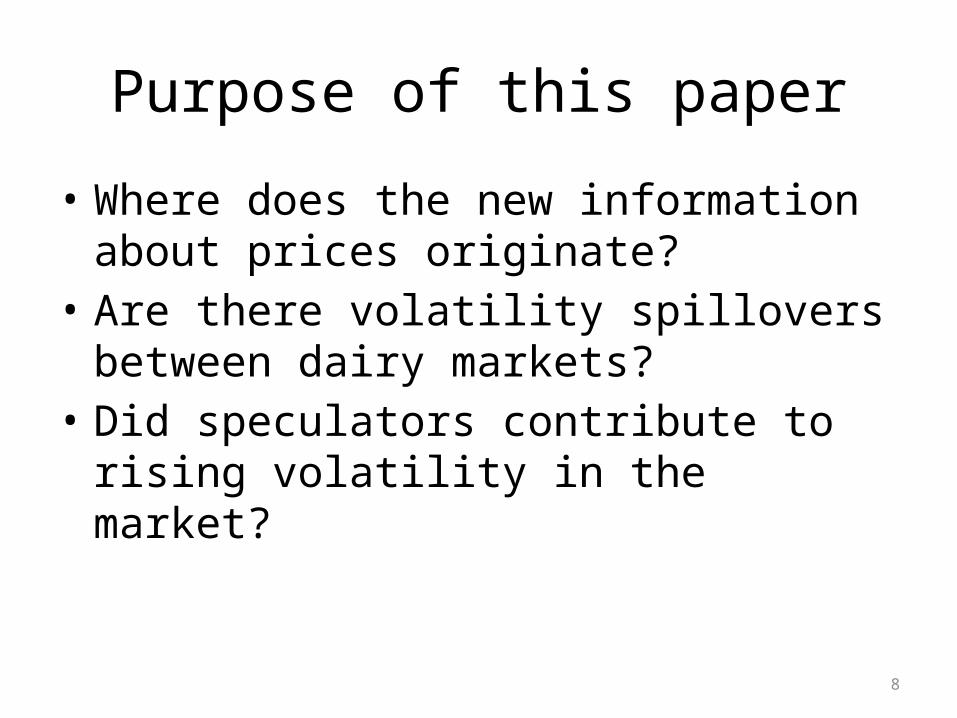
Purpose of this paper
• Where does the new information about prices originate?
• Are there volatility spillovers between dairy markets?
• Did speculators contribute to rising volatility in the market?
9
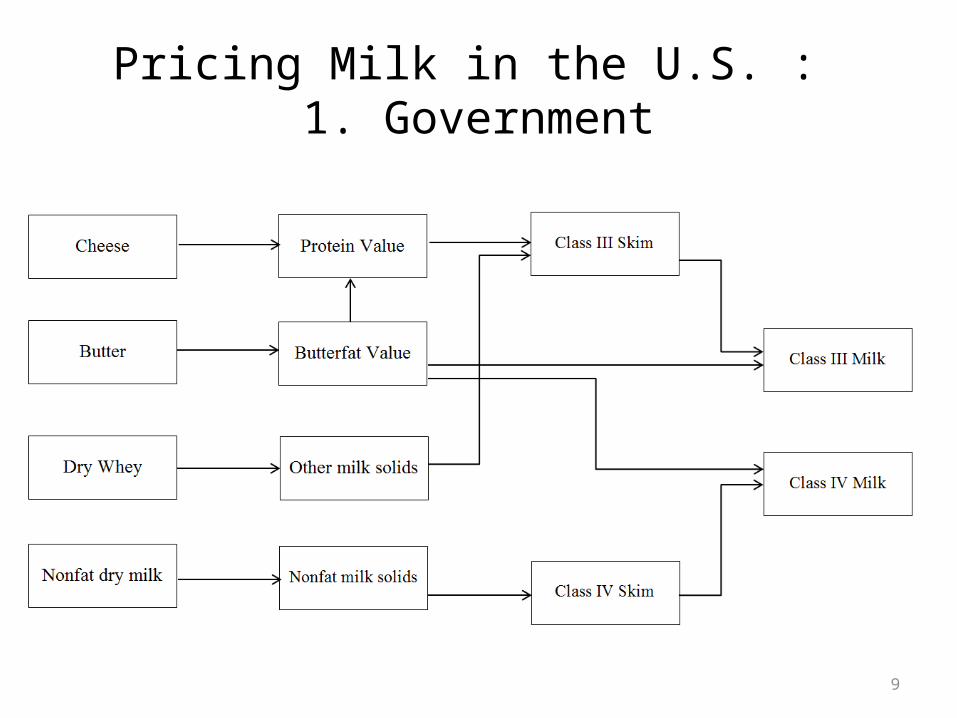
Pricing Milk in the U.S. : 1. Government
10
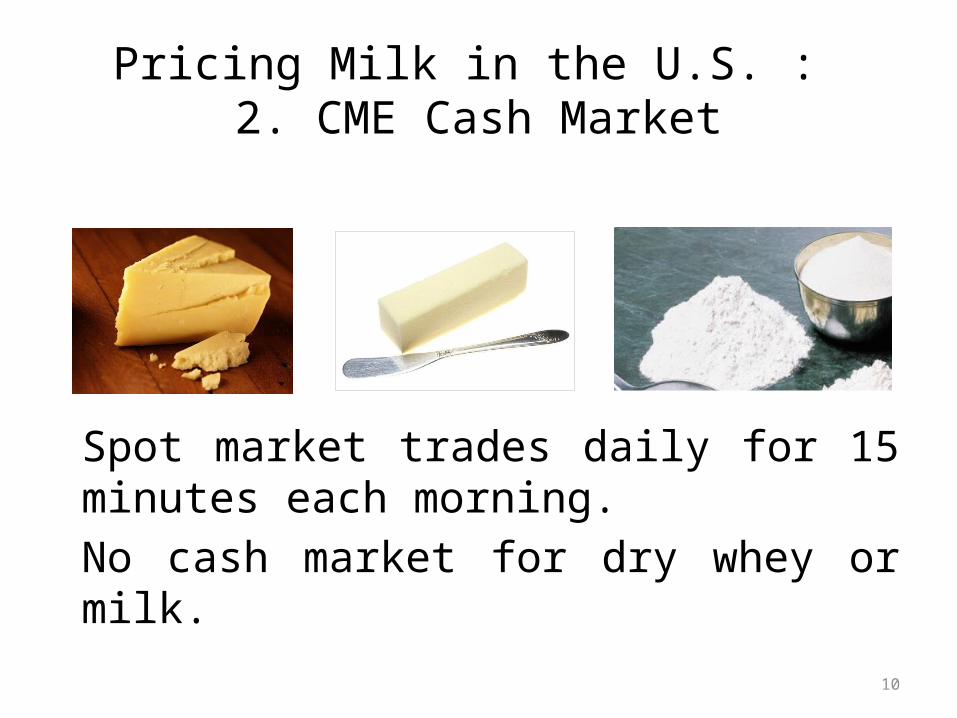
Spot market trades daily for 15 minutes each morning.No cash market for dry whey or milk.
Pricing Milk in the U.S. : 2. CME Cash Market
11
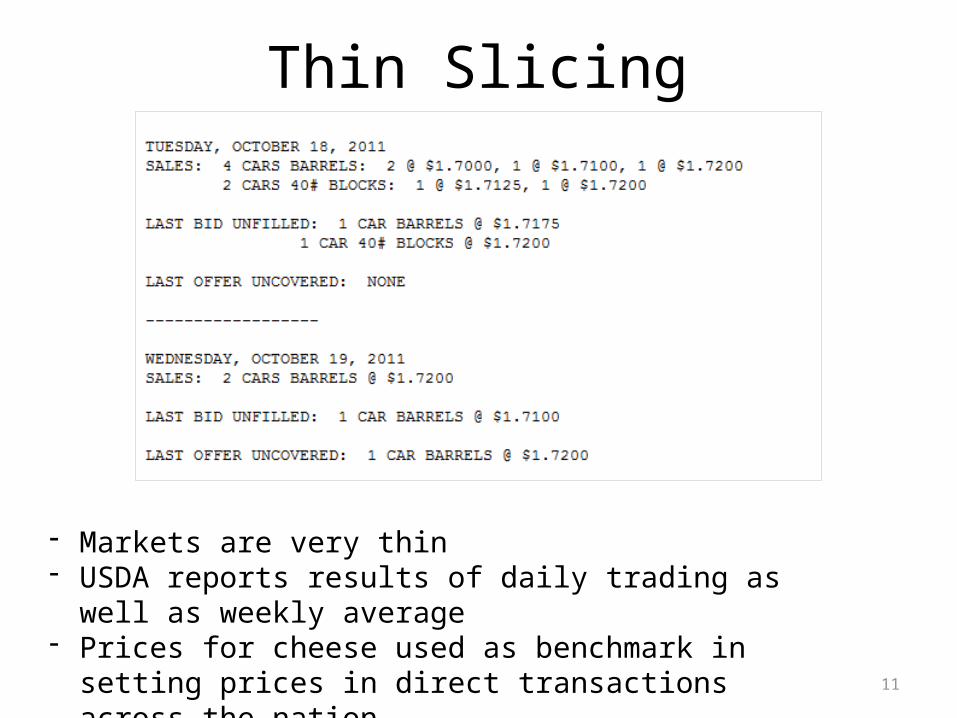
Thin Slicing
- Markets are very thin- USDA reports results of daily trading as well as weekly average- Prices for cheese used as benchmark in setting prices in direct
transactions across the nation
12
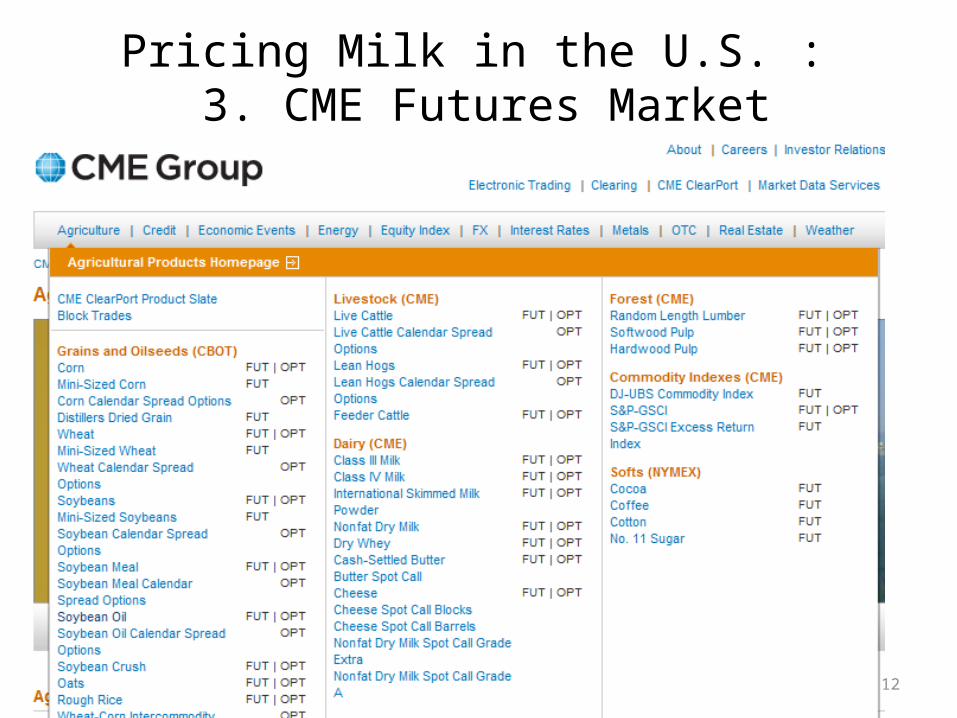
Pricing Milk in the U.S. : 3. CME Futures Market
13
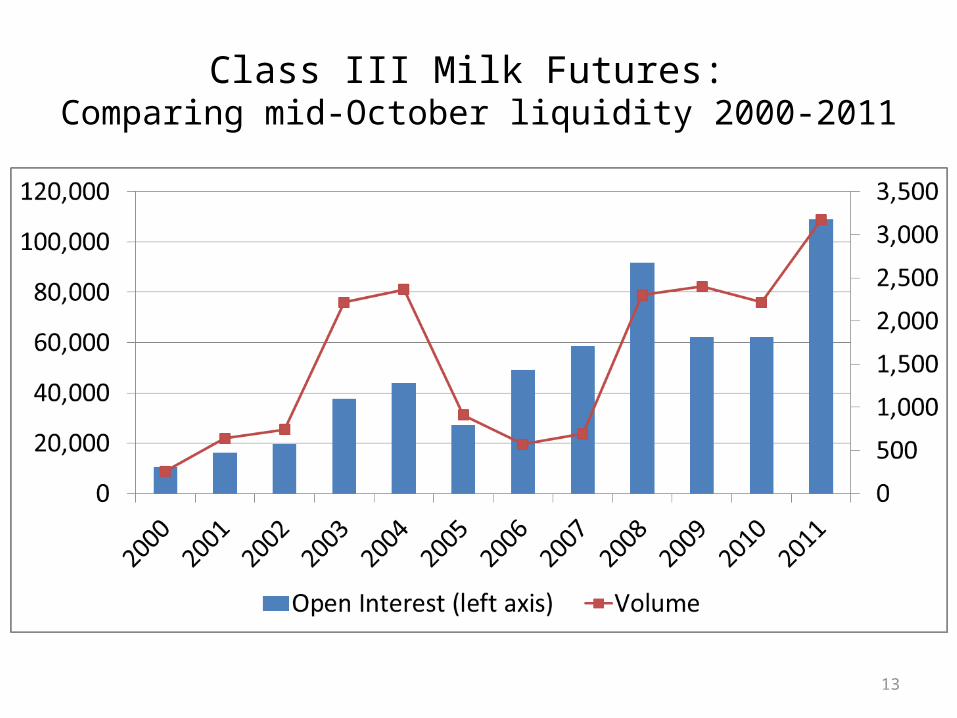
Class III Milk Futures: Comparing mid-October liquidity 2000-2011
14
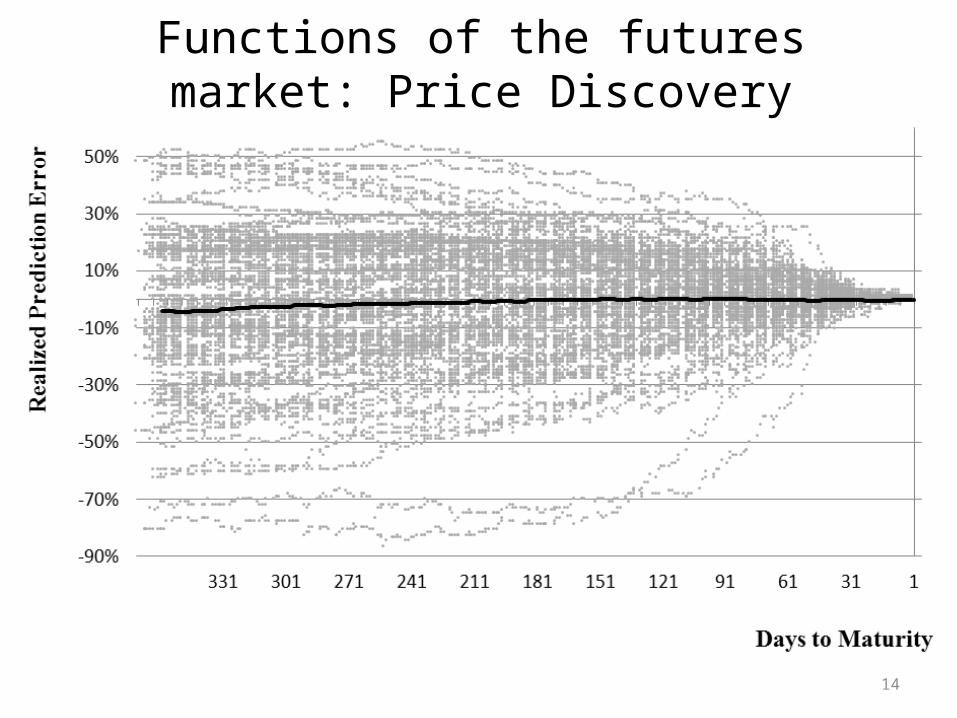
Functions of the futures market: Price Discovery
15
Questions of interest
• How do futures and cash market for cheese interact?– Price discovery– Volatility spillovers
• Impact of speculation on dairy futures
16
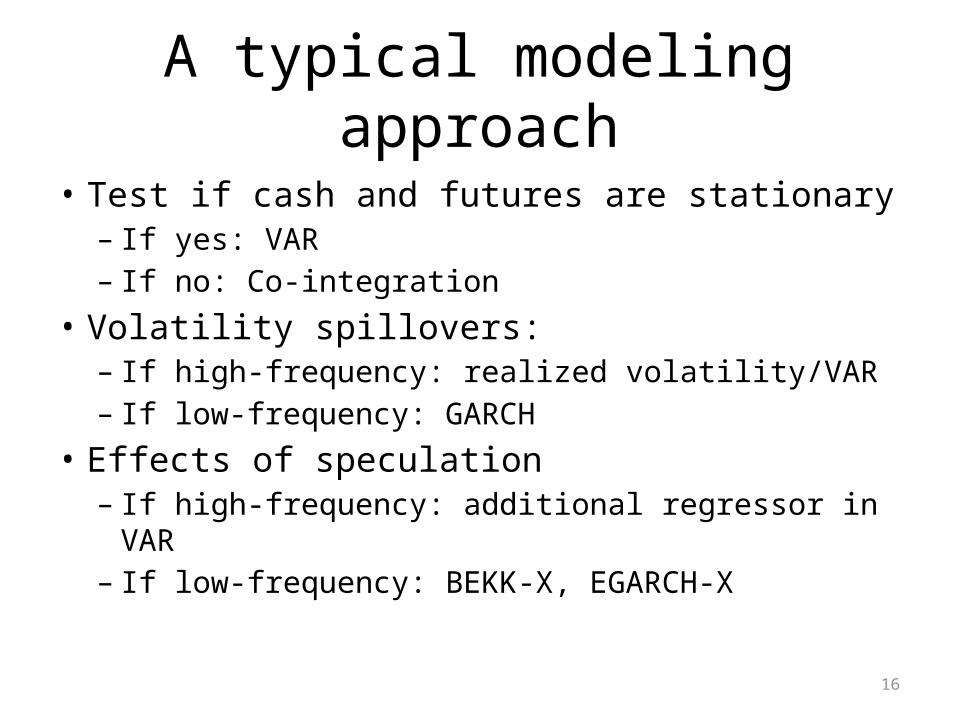
A typical modeling approach
• Test if cash and futures are stationary– If yes: VAR– If no: Co-integration
• Volatility spillovers:– If high-frequency: realized volatility/VAR– If low-frequency: GARCH
• Effects of speculation– If high-frequency: additional regressor in VAR– If low-frequency: BEKK-X, EGARCH-X
17
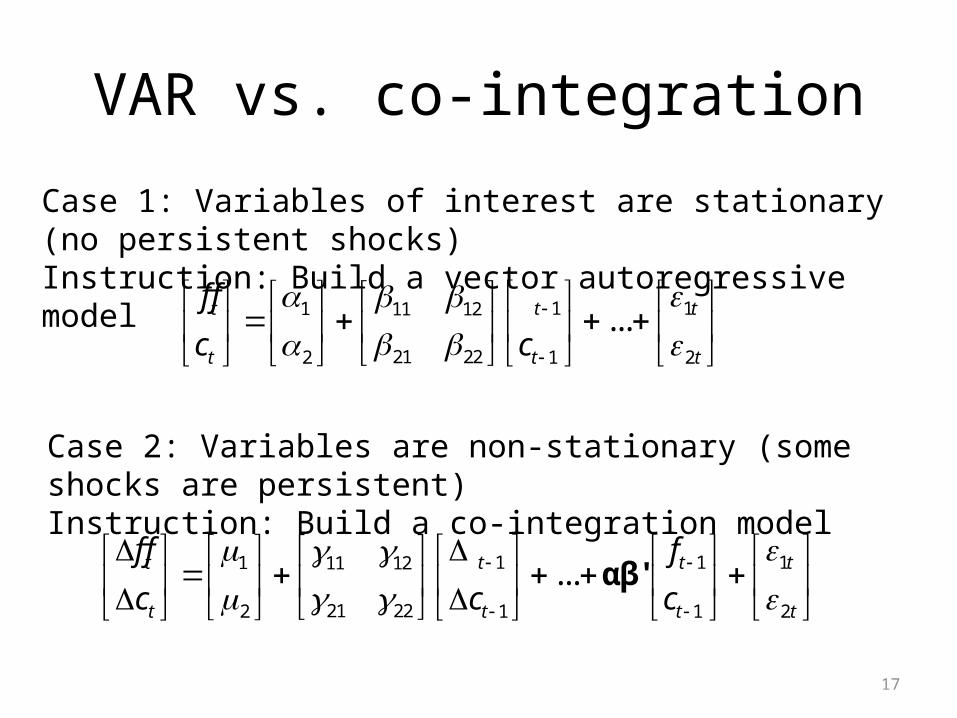
VAR vs. co-integration
1 11 11 12
21 222 1 2
...t t t
t t t
f f
c c
1 1 11 11 12
21 222 1 1 2
...t t t t
t t t t
f f f
c c c
αβ'
Case 1: Variables of interest are stationary (no persistent shocks)Instruction: Build a vector autoregressive model
Case 2: Variables are non-stationary (some shocks are persistent)Instruction: Build a co-integration model
18
Data limitations
• Cash market is thin– Closing price may indicate unfilled bid/uncovered
offer– No cash market for manufacturing grade milk or
dry whey• Futures market– Cheese futures market did not exist until 07/2010– Data on speculative positions available only
weekly
19
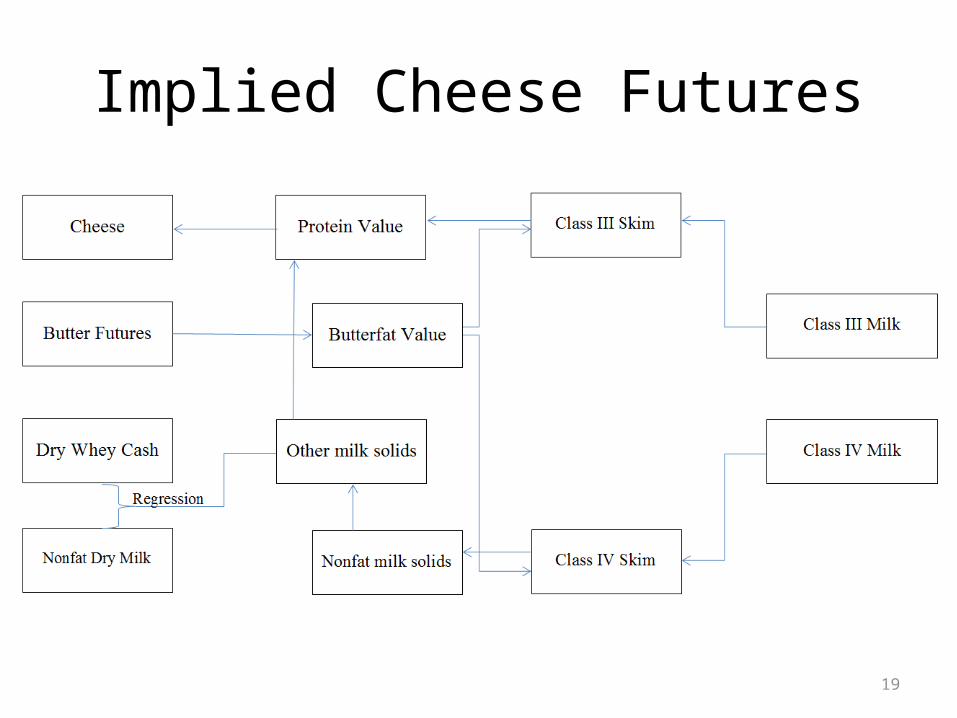
Implied Cheese Futures
20
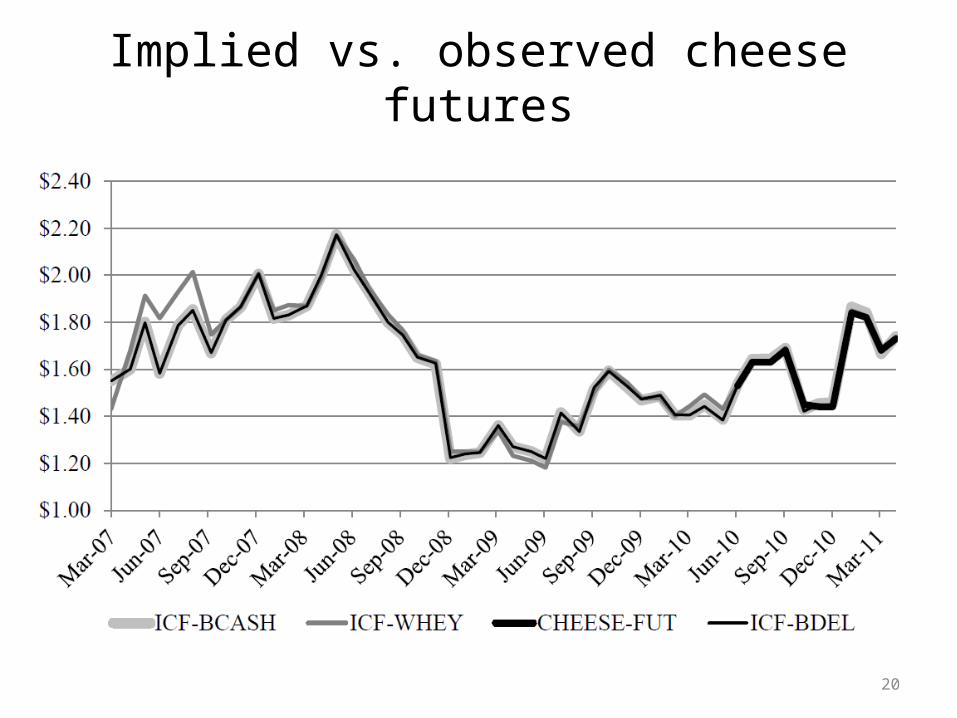
Implied vs. observed cheese futures
21
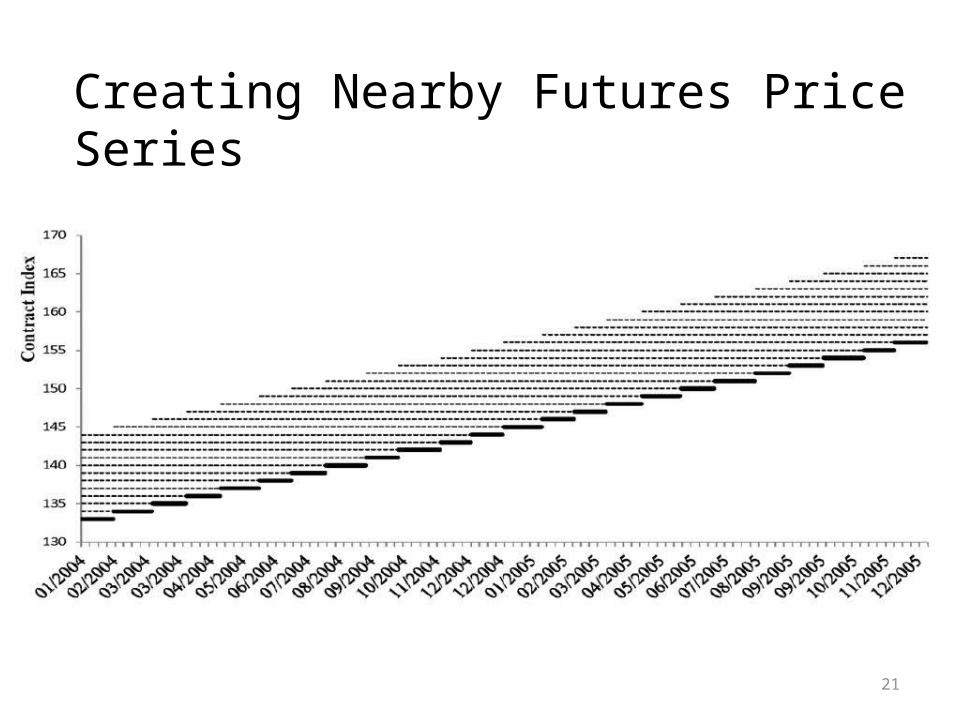
Creating Nearby Futures Price Series
22
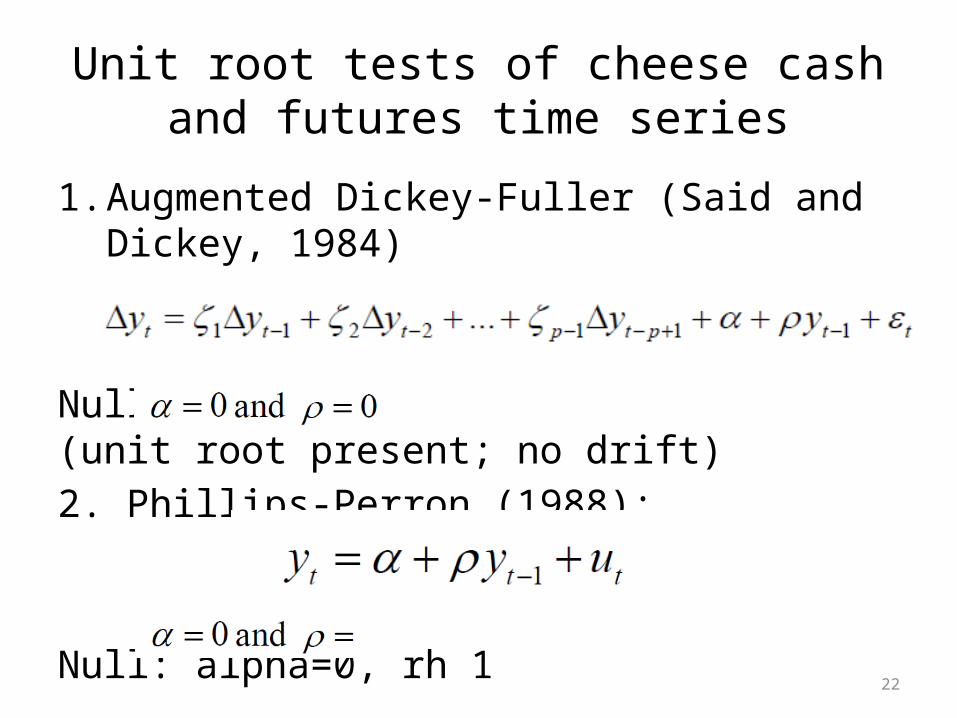
Unit root tests of cheese cash and futures time series
1. Augmented Dickey-Fuller (Said and Dickey, 1984)
Null: : (unit root present; no drift)2. Phillips-Perron (1988):
Null: alpha=0, rh 1
23
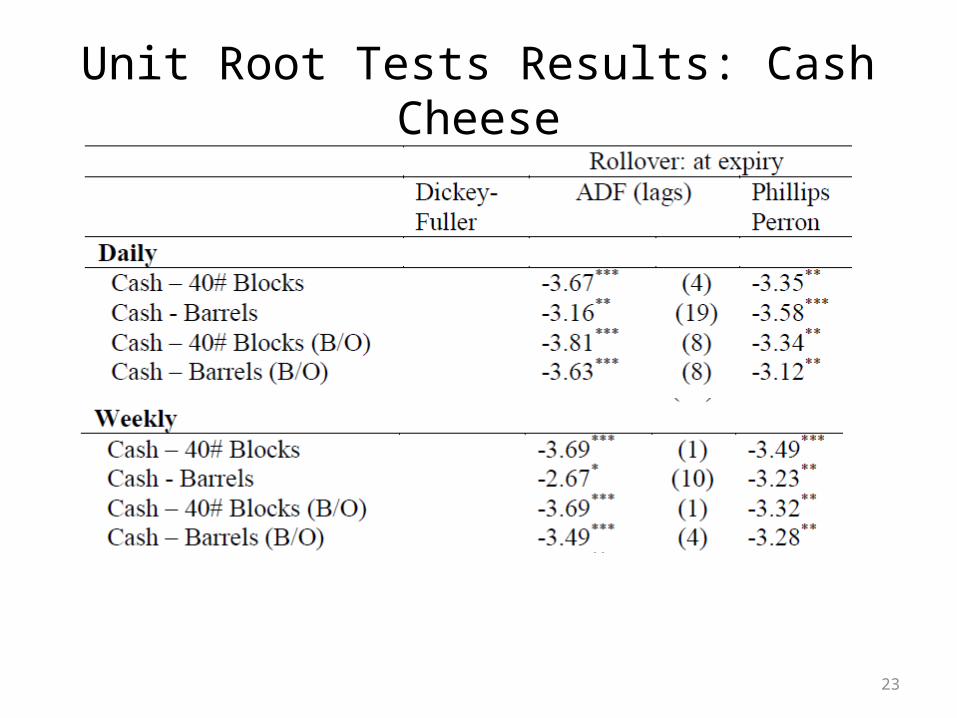
Unit Root Tests Results: Cash Cheese
24
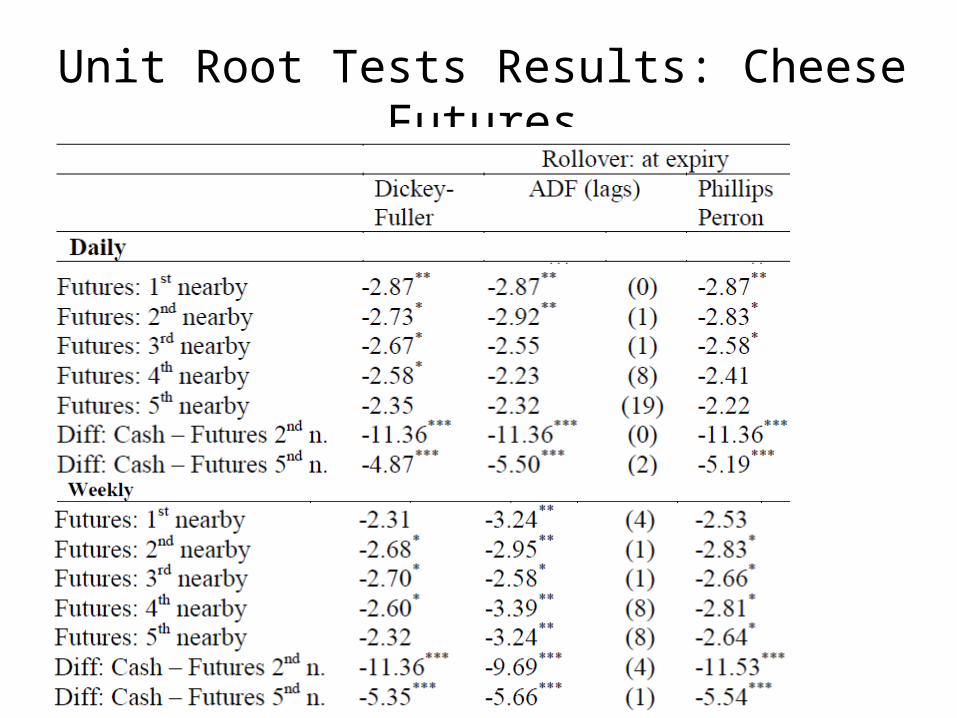
Unit Root Tests Results: Cheese Futures
25
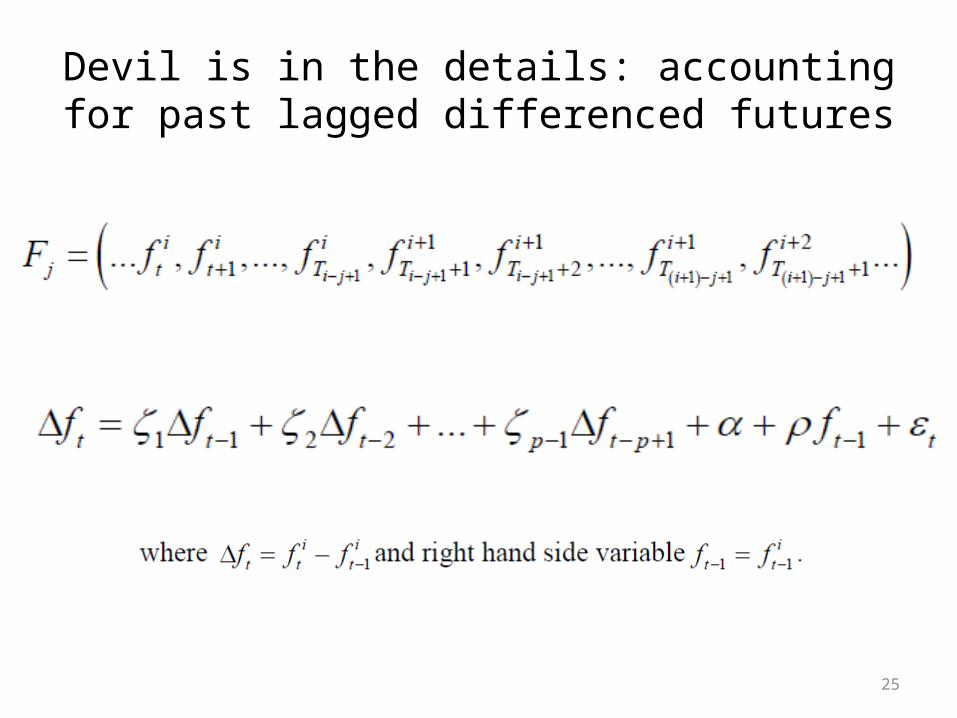
Devil is in the details: accounting for past lagged differenced futures

26
Unit Root Tests Results: Cheese Futures
27
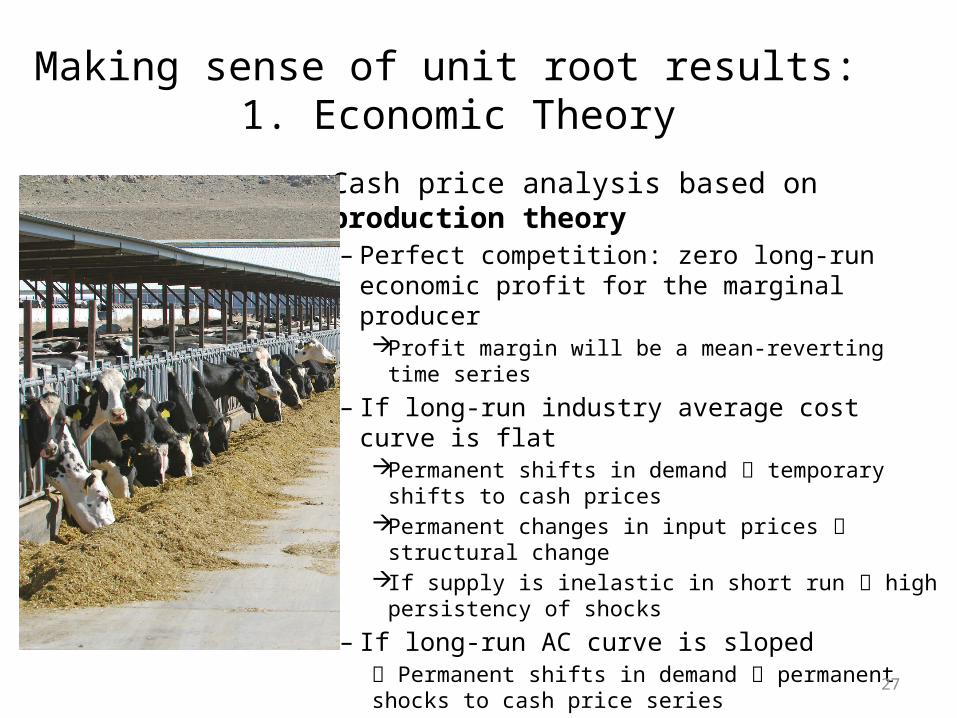
Making sense of unit root results: 1. Economic Theory• Cash price analysis based on production
theory– Perfect competition: zero long-run economic
profit for the marginal producerProfit margin will be a mean-reverting time series
– If long-run industry average cost curve is flatPermanent shifts in demand temporary shifts to
cash pricesPermanent changes in input prices structural
changeIf supply is inelastic in short run high persistency
of shocks
– If long-run AC curve is sloped Permanent shifts in demand permanent shocks to cash price series
28
Making sense of unit root results: 1. Economic Theory
• Futures price analysis based on finance theoryEfficient market
prices in a single contract will be martingales if the marginal risk premium is zero;
submartingales (downward biased) if marginal risk premium is positive
Supermartingales (upward biased) if marginal risk premium is negative
- In any case: efficient futures prices will be non-stationary, i.e. all shocks to futures prices are permanent
29
Making sense of unit root results: 2. Time Series Modeling Exercise
• What if there was a market in which cash price was indeed second-order stationary• If there was a futures contract designed to
cash-settle against such a spot price, what would be the characteristics of that time series?
• For simplicity, assume no marginal risk premium
30
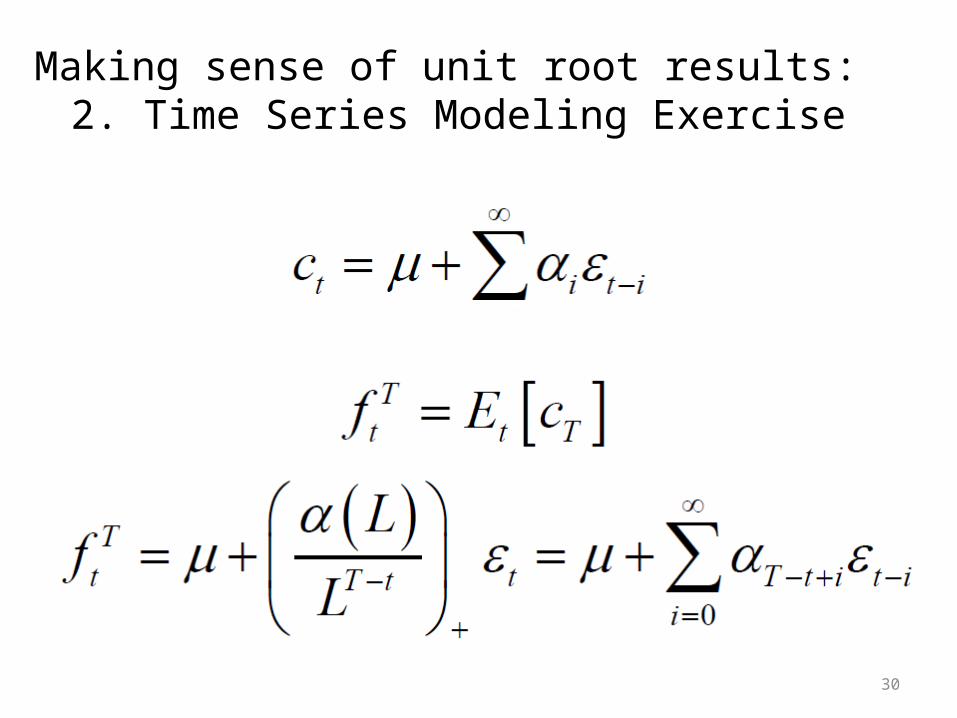
Making sense of unit root results: 2. Time Series Modeling Exercise
31
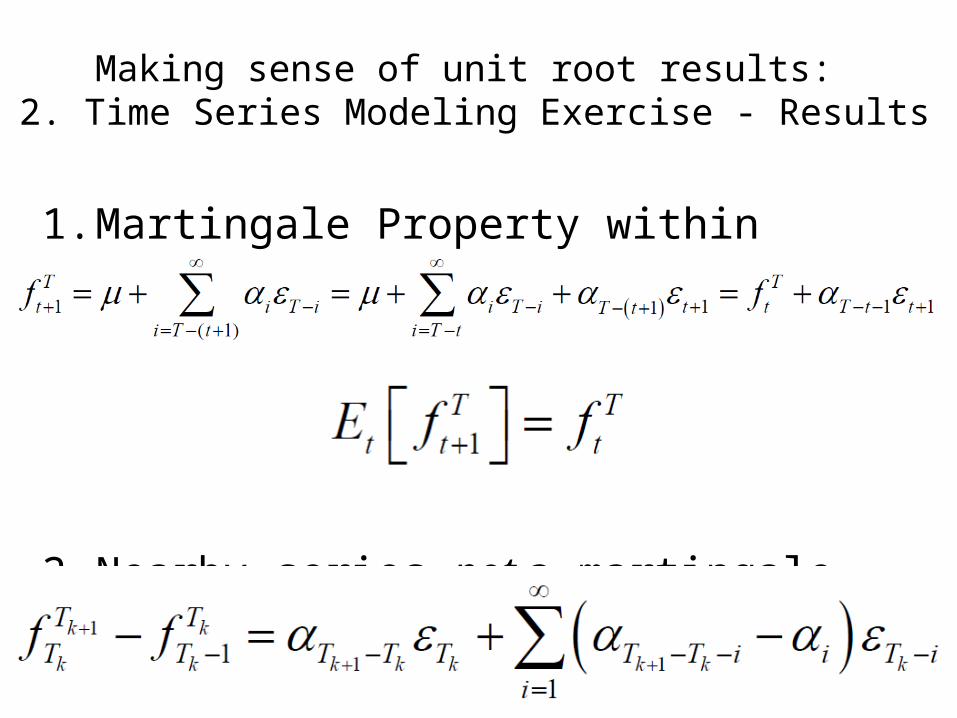
Making sense of unit root results: 2. Time Series Modeling Exercise - Results
1. Martingale Property within each contract
2. Nearby series not a martingale
32
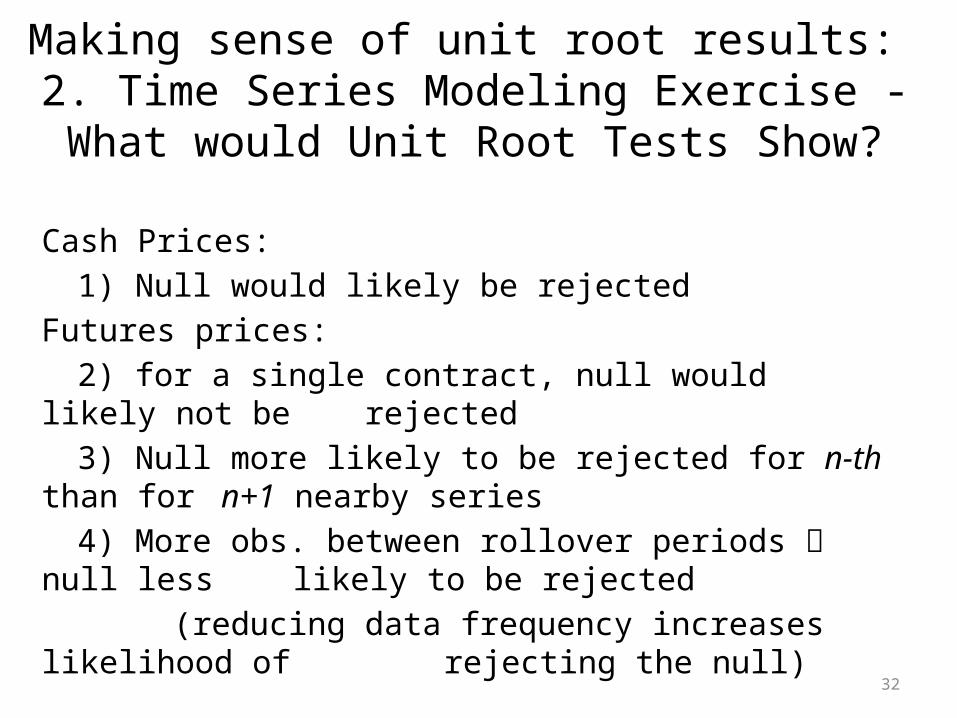
Making sense of unit root results: 2. Time Series Modeling Exercise -What would Unit Root Tests Show?
Cash Prices: 1) Null would likely be rejected
Futures prices: 2) for a single contract, null would likely not be
rejected3) Null more likely to be rejected for n-th than for
n+1 nearby series4) More obs. between rollover periods null less
likely to be rejected (reducing data frequency increases likelihood of
rejecting the null)
33
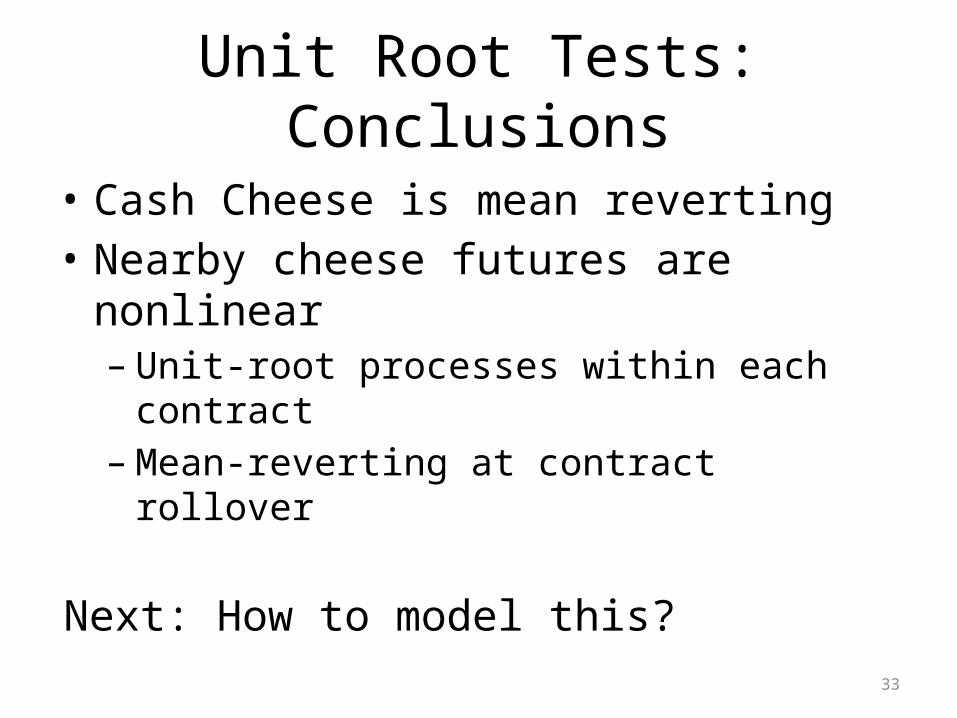
Unit Root Tests: Conclusions
• Cash Cheese is mean reverting• Nearby cheese futures are nonlinear– Unit-root processes within each contract– Mean-reverting at contract rollover
Next: How to model this?
34
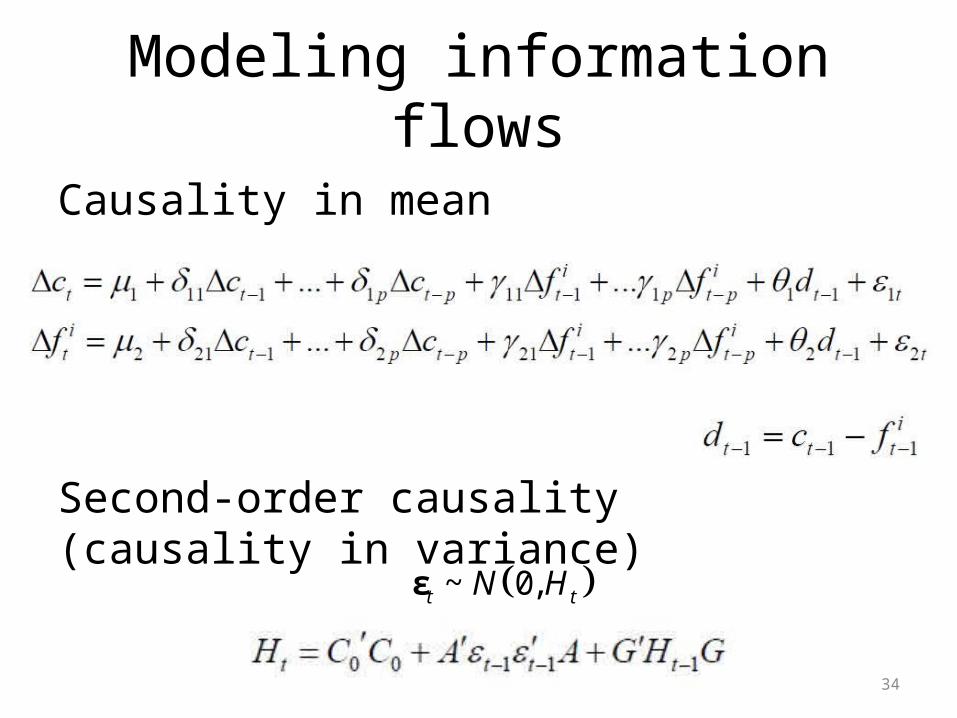
Modeling information flows
Causality in mean
Second-order causality (causality in variance)
~ 0,t tN Hε
35
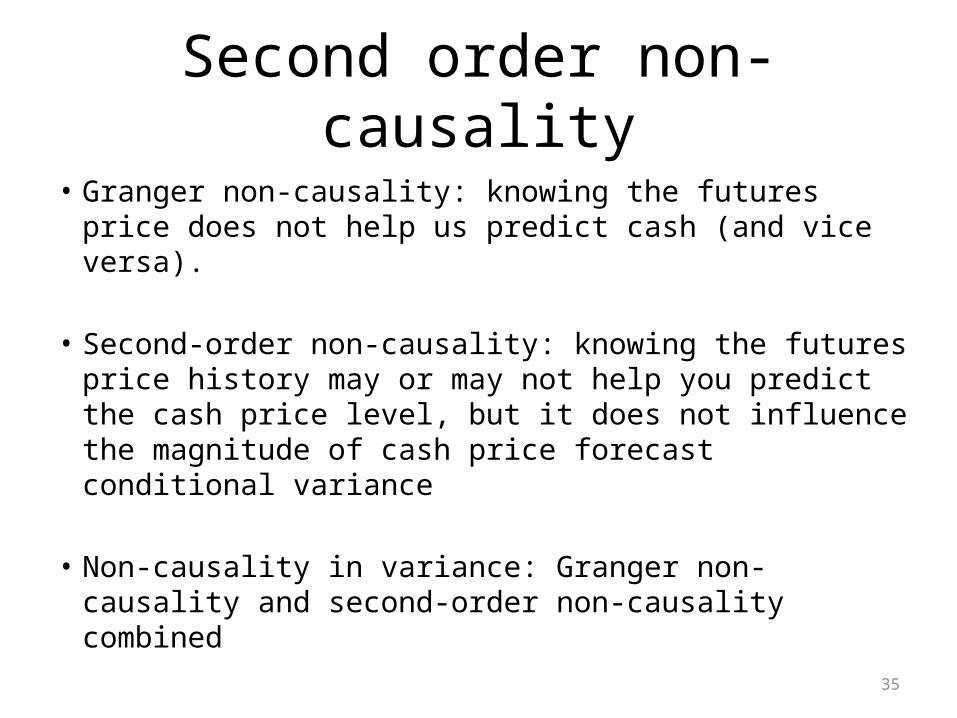
Second order non-causality
• Granger non-causality: knowing the futures price does not help us predict cash (and vice versa).
• Second-order non-causality: knowing the futures price history may or may not help you predict the cash price level, but it does not influence the magnitude of cash price forecast conditional variance
• Non-causality in variance: Granger non-causality and second-order non-causality combined
36
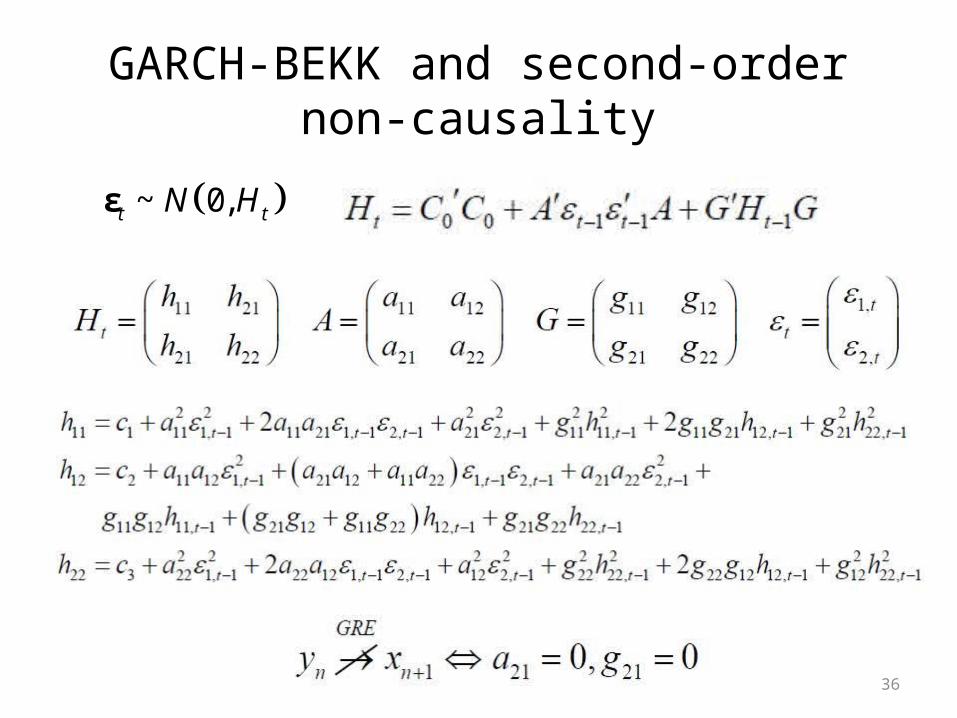
GARCH-BEKK and second-order non-causality
~ 0,t tN Hε
37
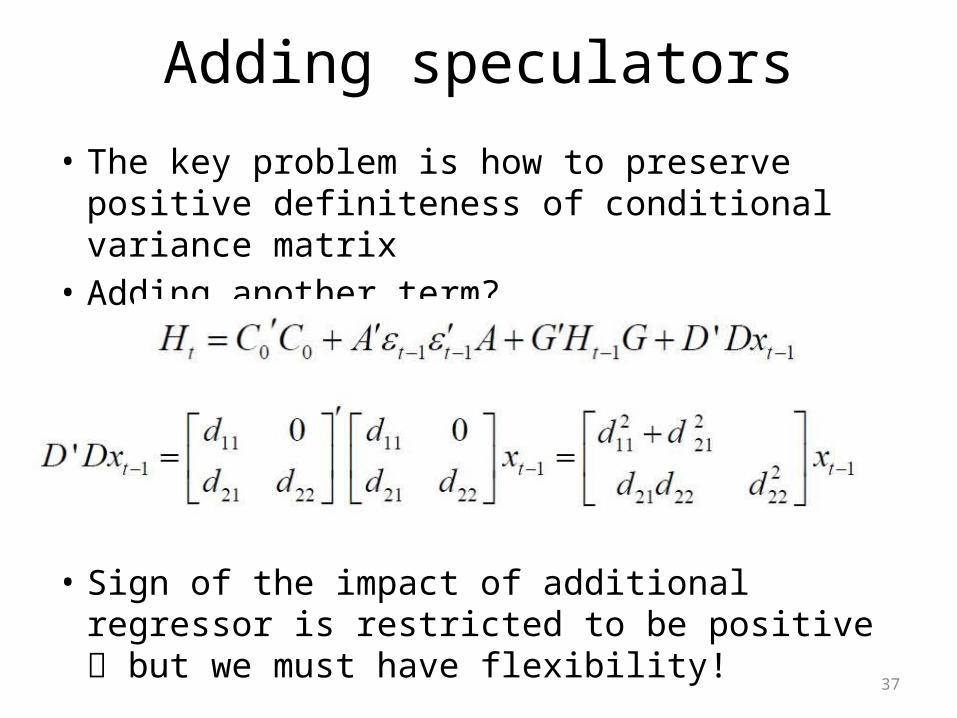
Adding speculators
• The key problem is how to preserve positive definiteness of conditional variance matrix
• Adding another term?
• Sign of the impact of additional regressor is restricted to be positive but we must have flexibility!
38
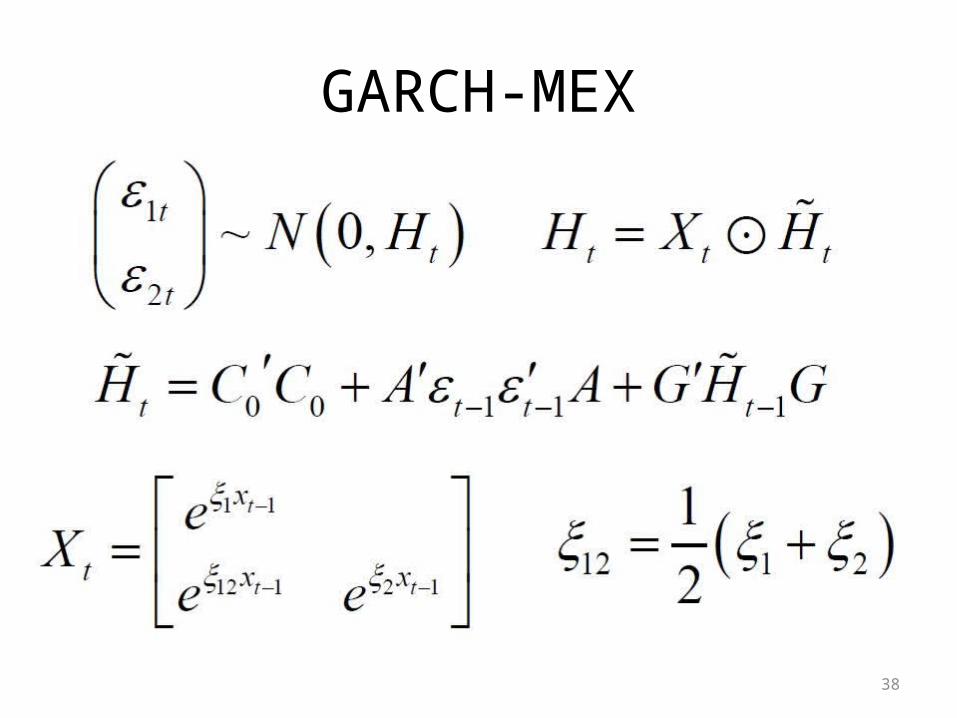
GARCH-MEX
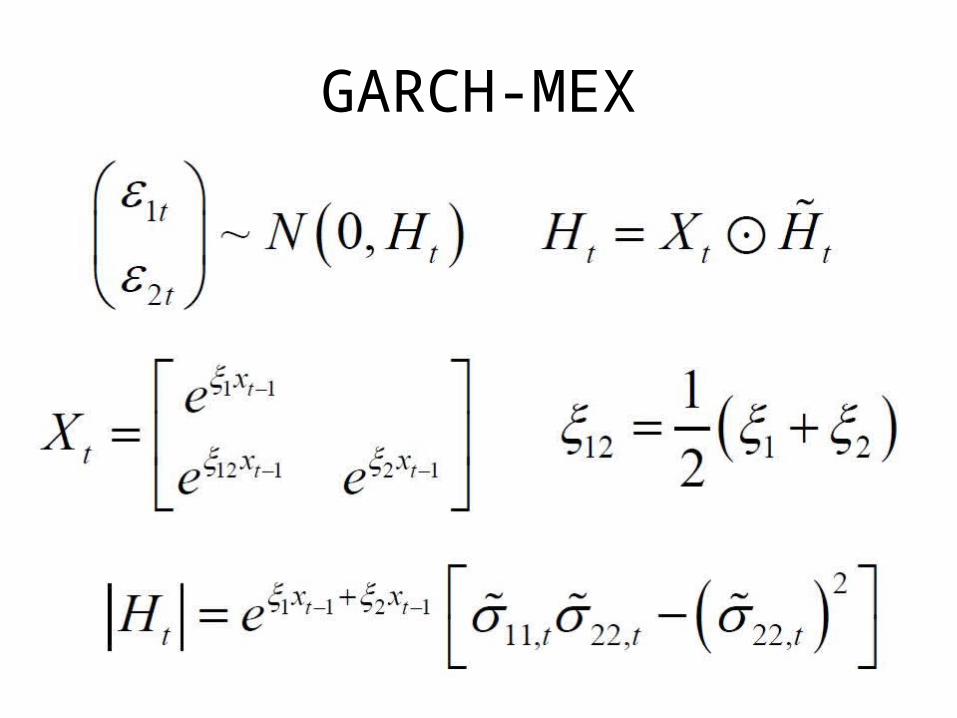
39
GARCH-MEX
40
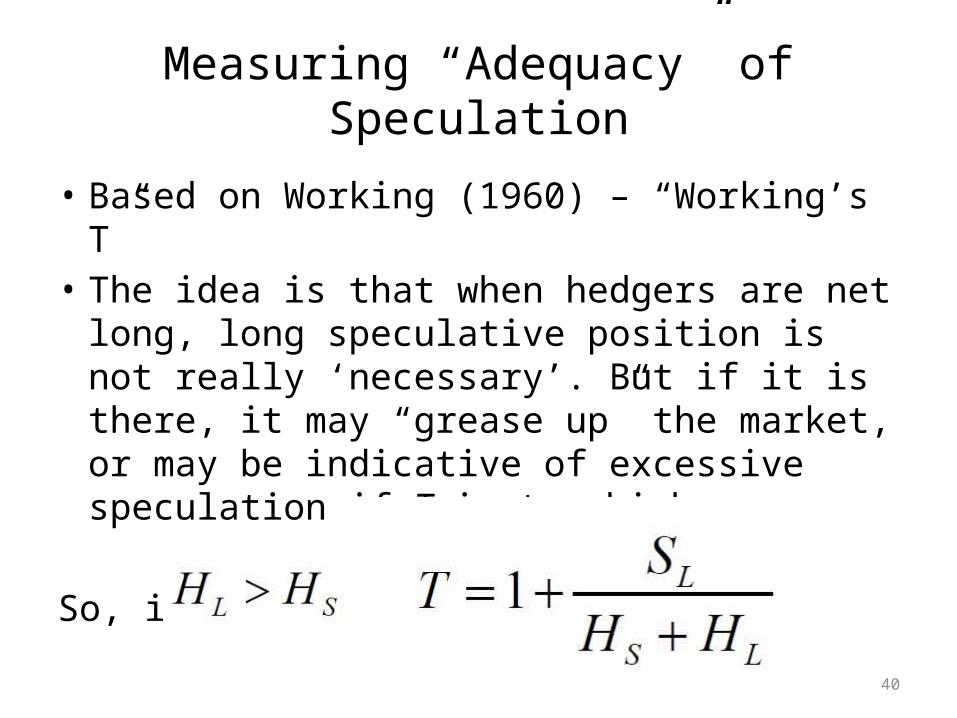
Measuring “Adequacy” of Speculation
• Based on Working (1960) – “Working’s T”• The idea is that when hedgers are net long,
long speculative position is not really ‘necessary’. But if it is there, it may “grease up” the market, or may be indicative of excessive speculation if T is too high.
So, if
41
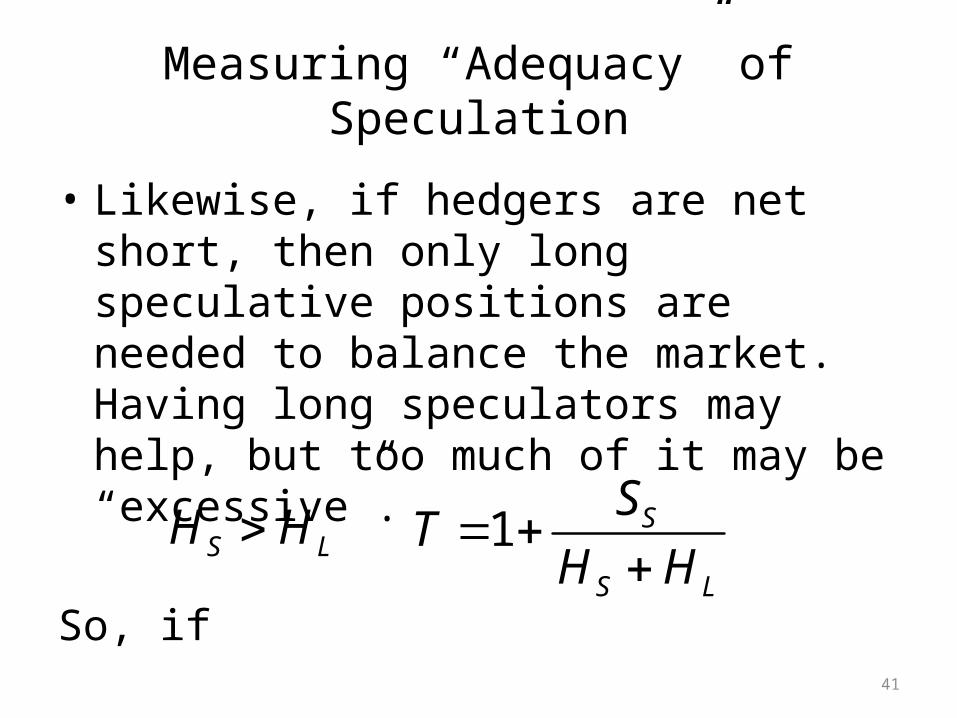
Measuring “Adequacy” of Speculation
• Likewise, if hedgers are net short, then only long speculative positions are needed to balance the market. Having long speculators may help, but too much of it may be “excessive”.
So, if
• Key assumption: how to treat unreportables.
S LH H 1 S
S L
ST
H H
42
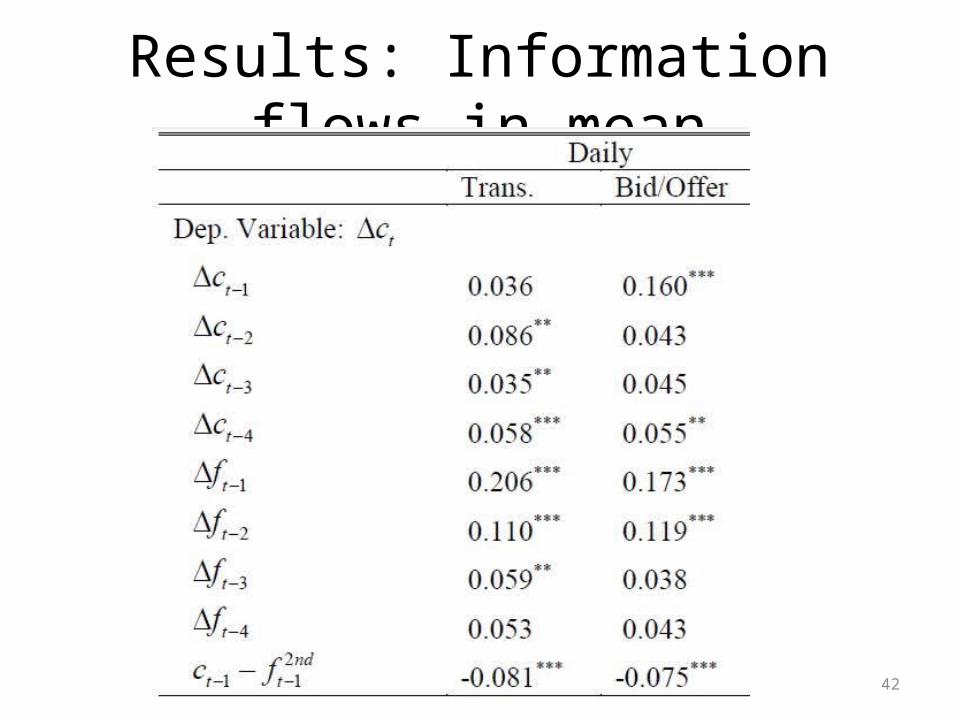
Results: Information flows in mean
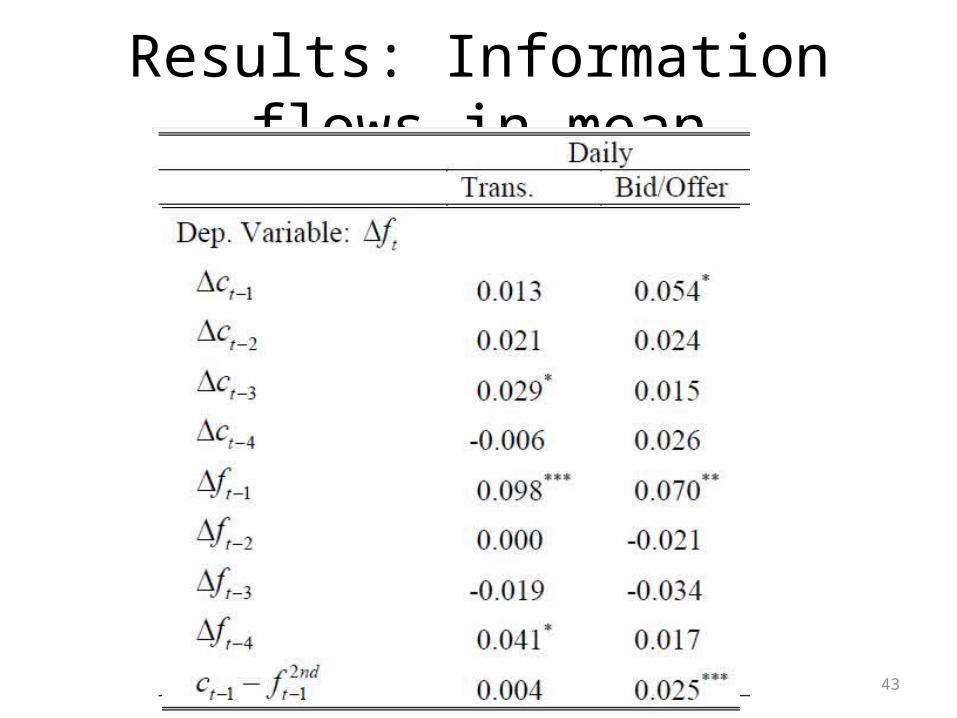
43
Results: Information flows in mean
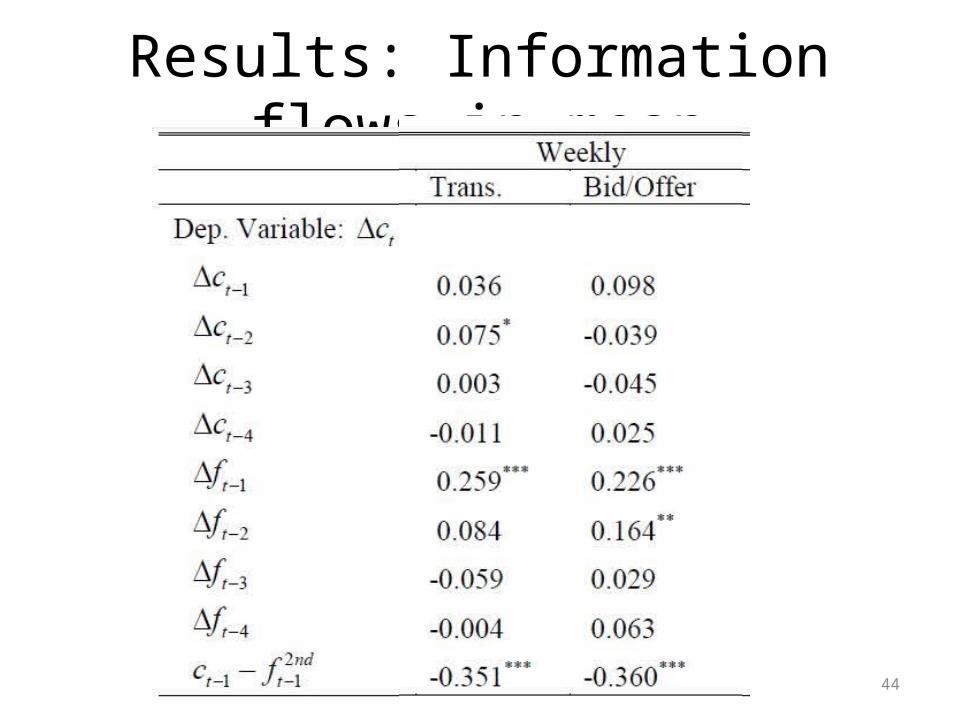
44
Results: Information flows in mean
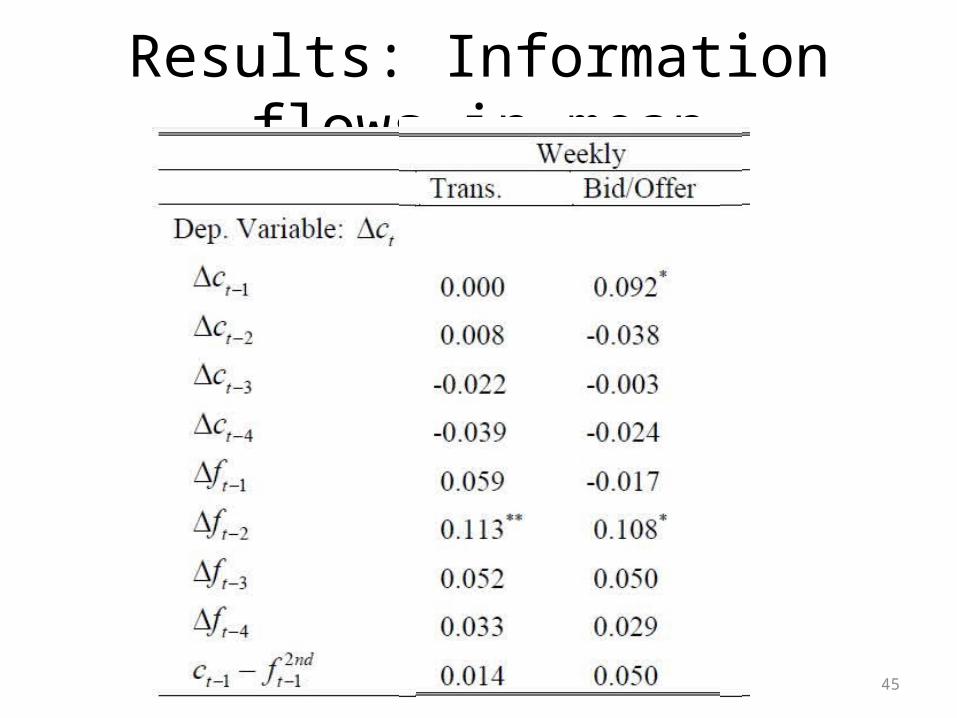
45
Results: Information flows in mean
46
Results: Information flows in mean
• Conclusion: Using daily close prices at either daily or weekly frequency, using either nominal or log prices, and either control for heteroskedasticity or not – we always find that adjustment to spread between cash and futures is done in the cash market
47
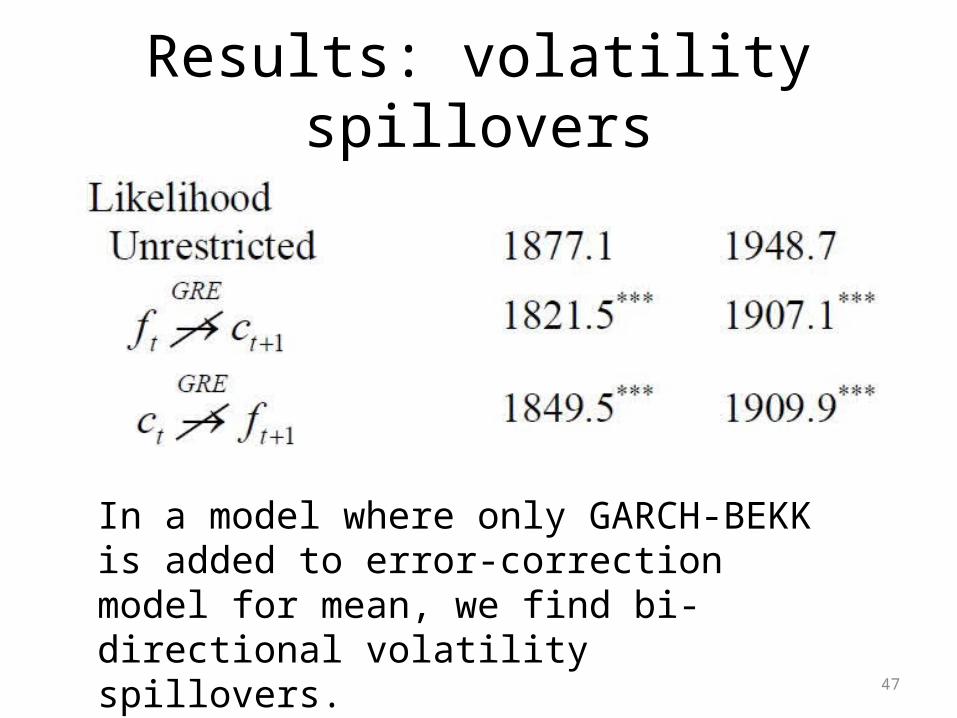
Results: volatility spillovers
In a model where only GARCH-BEKK is added to error-correction model for mean, we find bi-directional volatility spillovers.
48
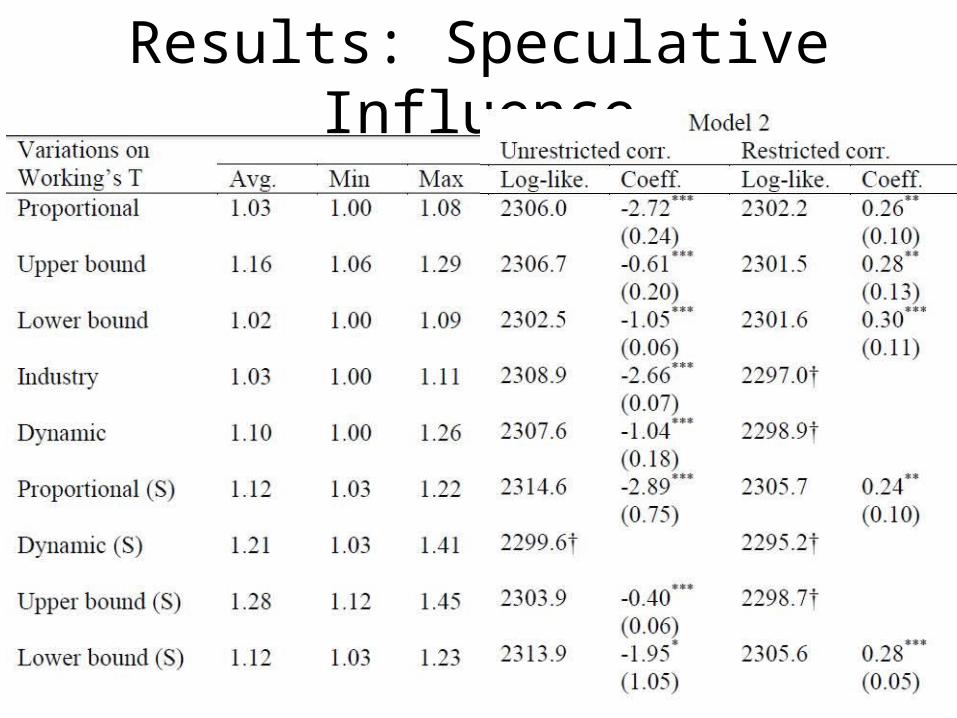
Results: Speculative Influence
49
Conclusions
• Not likely that speculators increased volatility in dairy futures; if anything, speculative presence seems to be below what is deemed required for liquid market.
• GARCH-MEX has a potential for allowing flexible functional form, but restriction on correlation coefficient may flip the sign (and reduce the likelihood)
50