price action trading strategies – 6 patterns that work
TRANSCRIPT
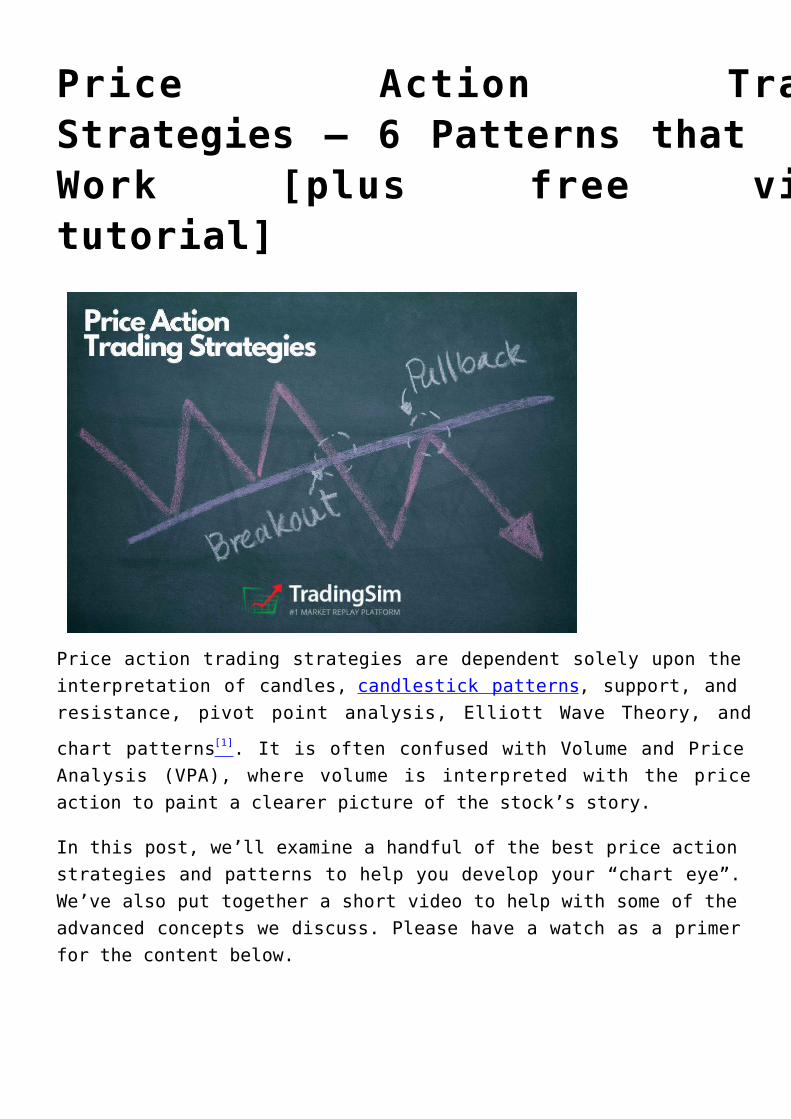
Price Action TradingStrategies – 6 Patterns thatWork [plus free videotutorial]
Price action trading strategies are dependent solely upon theinterpretation of candles, candlestick patterns, support, andresistance, pivot point analysis, Elliott Wave Theory, and
chart patterns[1]. It is often confused with Volume and PriceAnalysis (VPA), where volume is interpreted with the priceaction to paint a clearer picture of the stock’s story.
In this post, we’ll examine a handful of the best price actionstrategies and patterns to help you develop your “chart eye”.We’ve also put together a short video to help with some of theadvanced concepts we discuss. Please have a watch as a primerfor the content below.

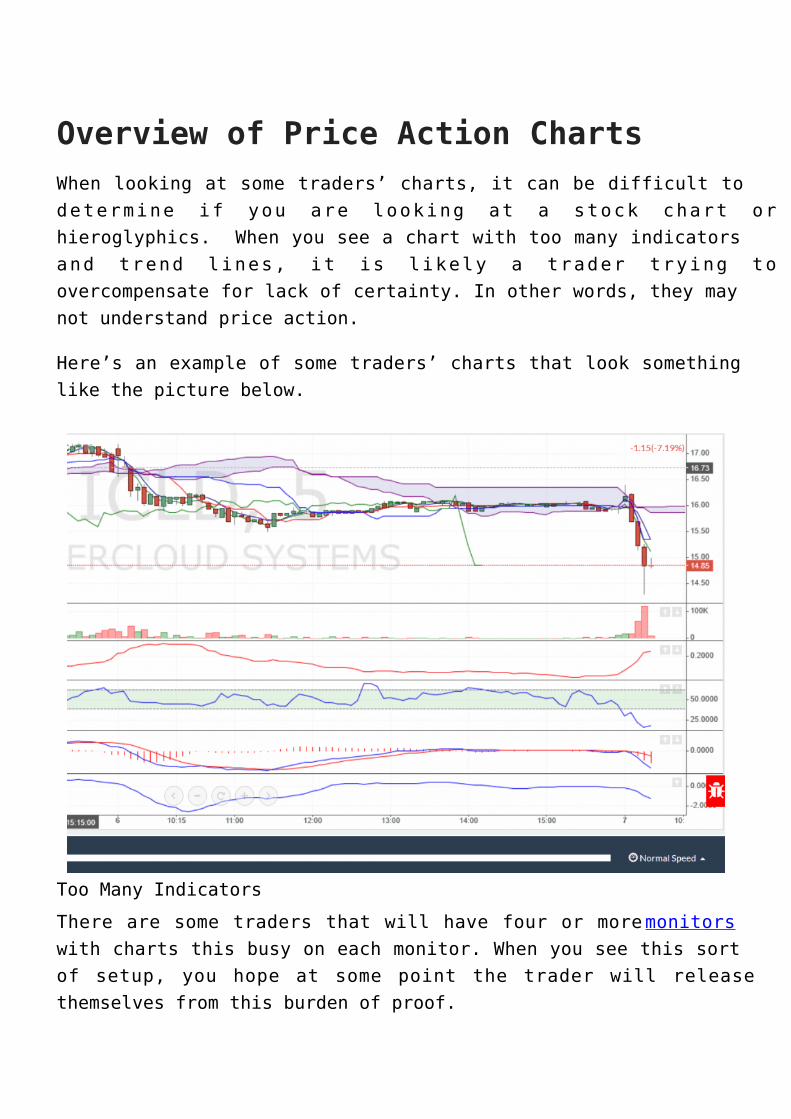
Overview of Price Action ChartsWhen looking at some traders’ charts, it can be difficult todetermine if you are looking at a stock chart orhieroglyphics. When you see a chart with too many indicatorsand trend lines, it is likely a trader trying toovercompensate for lack of certainty. In other words, they maynot understand price action.
Here’s an example of some traders’ charts that look somethinglike the picture below.
Too Many Indicators
There are some traders that will have four or more monitorswith charts this busy on each monitor. When you see this sortof setup, you hope at some point the trader will releasethemselves from this burden of proof.

Every trader has their own style, for sure. But at the end ofthe day, price is the final arbiter. And it would behoove alltraders to learn how to read the tape.
Clean ChartsWhat if we lived in a world where we just traded price actionstrategies? A world where traders picked simplicity over thecomplex world of technical indicators and automated tradingstrategies.
When you remove all the clutter from the trades, all thatremains is the price.
To see a chart minus all the indicators, take a look at thefollowing image and compare it to the previous one:
Price Action Trading ChartsAt first glance, it can almost be as intimidating as a chartfull of indicators. Like anything in life, we builddependencies and handicaps from the pain of real-lifeexperiences. If you have been trading with your favoriteindicator for years, going down to a bare chart can besomewhat traumatic.
While price action trading is simplistic in nature, there arevarious disciplines. As mentioned above, the disciplines canrange from Japanese candlestick patterns, support &resistance, pivot point analysis, Elliott Wave Theory, and
chart patterns[1].
From here on, we will explore the six best price actiontrading strategies and what it means to be a price actiontrader.
Price Action Trading StrategyBasicsBefore we dive into the price action trading strategies, youneed to understand the four pillars of the price actionindicator.
Candlesticks1.Bullish Trend2.Bearish Trend3.Flat Market4.
If you can recognize and understand these four concepts andhow they are related to one another, you’re well on your way.
Pillar 1 – CandlesticksCandlesticks are the most popular form of charting in today’strading world. Historically, point and figure charts, linegraphs and bar graphs were more important.
Not to make things too open-ended at the start, but you canuse the charting method of your choice. There is no hard linehere.
However, for the sake of not turning this into a thesis paper,we will focus on candlesticks. The below image gives you thestructure of a candlestick. To learn more about candlesticks,please visit this article that goes into detail about specificformations and techniques.
Feel free to download our candlestick reference guide:

The key point to remember with candlesticks is that eachcandle is relaying information, and each cluster or groupingof candles is also conveying a message. You have to begin tothink of the market in layers.
Pillar 2 – Bullish TrendThis is a simple item to identify on the chart, and as aretail investor, you are likely most familiar with thisformation.
A bullish trend develops when there is a grouping ofcandlesticks that extend up and to the right.
Think of a squiggly line on a 45-degree angle.
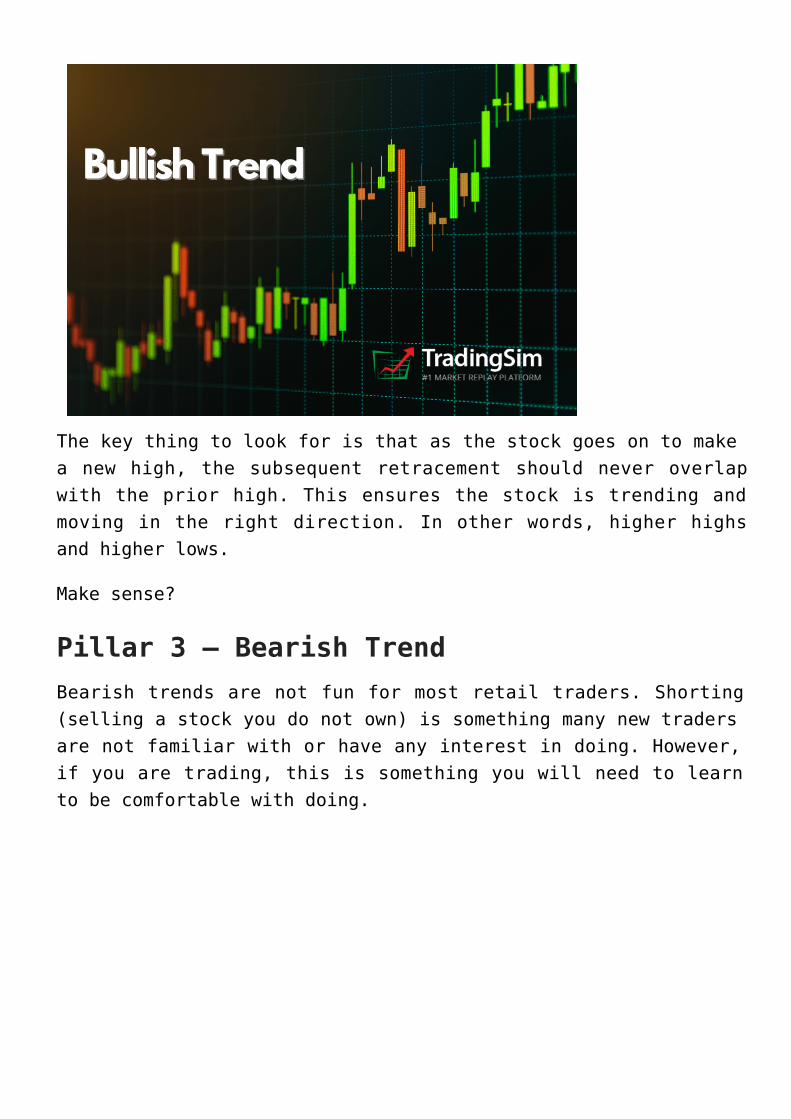
The key thing to look for is that as the stock goes on to makea new high, the subsequent retracement should never overlapwith the prior high. This ensures the stock is trending andmoving in the right direction. In other words, higher highsand higher lows.
Make sense?
Pillar 3 – Bearish TrendBearish trends are not fun for most retail traders. Shorting(selling a stock you do not own) is something many new tradersare not familiar with or have any interest in doing. However,if you are trading, this is something you will need to learnto be comfortable with doing.

This formation is the opposite of the bullish trend. The trendis right the opposite: lower highs and lower lows.
Pillar 4 – Flat MarketGet ready for this statement, because it is big. In generalterms, the market is in a flat trading range approximately 70%[2] of the time according to author Heikin Ashi Trader, which isthe pen name of a trader with over 15 years of futures andforex experience.
Rarely will securities trend all day in one direction. Youwill set your morning range within the first hour, then therest of the day is just a series of head fakes.
If you can re-imagine the charts in these more abstract terms,it is easy to size up a security’s next move quickly.
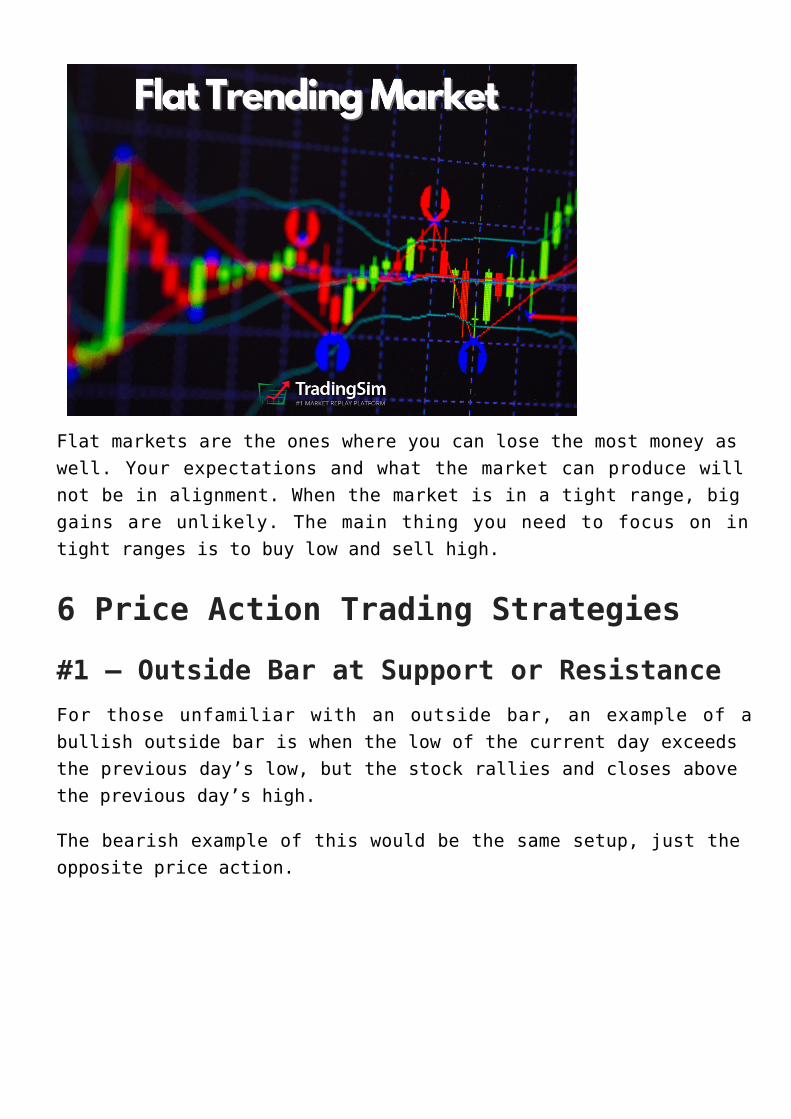
Flat markets are the ones where you can lose the most money aswell. Your expectations and what the market can produce willnot be in alignment. When the market is in a tight range, biggains are unlikely. The main thing you need to focus on intight ranges is to buy low and sell high.
6 Price Action Trading Strategies
#1 – Outside Bar at Support or ResistanceFor those unfamiliar with an outside bar, an example of abullish outside bar is when the low of the current day exceedsthe previous day’s low, but the stock rallies and closes abovethe previous day’s high.
The bearish example of this would be the same setup, just theopposite price action.

Outside down day price action
Therefore, it’s not just about finding an outside candlestickand placing a trade. As you can see in the above chart ofNIO, it’s best to find an outside day after a major break of atrend. In the NIO example, there was an uptrend for almost 3hours on a 5-minute chart prior to the start of the breakdown.
After the break, NIO finished with an outside down day, whichthen led to a nice sell-off into the early afternoon.
#2 – Spring at SupportA spring occurs when a stock tests the low of a trading range,only to quickly come back into the range and kick off a newtrend. According to Jim Forte, “springs, shakeouts, and testsusually occur late within the trading range and allow themarket and its dominant players to make a definitive test of
available supply before a markup campaign will unfold.”1.
Volume can help when confirming a spring; however, the focusof this article is to explore price action trading strategies,so we will zone in on the candlesticks alone.
The one common misinterpretation of springs among traders isthe need to wait for the last swing low to be breached. Justto be clear, a spring can occur if the stock comes within 1%to 2% of the swing low.

Trading setups rarely fit your exact requirement, so there isno point in obsessing over a few cents. To illustrate thispoint, please have a look at the below example of a springsetup.
Spring reversal
Notice how the previous low was never completely breached, butyou could tell from the price action that the stock reversednicely off the low. Thus, a long trade was in play.
#3 – Inside Bars after a BreakoutInside bars occur when you have many candlesticks clumpedtogether as the price action starts to coil into resistance orsupport. The candlesticks will fit inside of the high and lowof a recent swing point as the dominant traders suppress thestock to accumulate more shares.
In theory, it looks something like this:

To illustrate a series of inside bars after a breakout, pleasetake a look at the following intraday chart of NIO.
This chart of NIO is truly unique because the stock had abreakout after the fourth or fifth attempt at busting thehigh. Then there were inside bars that refused to give backany of the breakout gains. NIO then went on to rally the restof the day.
Please note inside bars can also occur prior to a breakout,which may strengthen the odds the stock will eventuallybreakthrough resistance.
The other benefit of inside bars is that gives you a cleanarea of support to place your stops under. This way you arenot basing your stop on one indicator or the low of onecandlestick.

This is popular strategy, and for good reason. These quickpullbacks often forecast higher price movements.
#4 – Long Wick CandlesThe long wick candlestick is another favorite day tradingsetup. These are often called hammer candles, or shootingstars.
The setup consists of a major gap up or down in the morning,followed by a significant push, which then retreats. Thisprice action produces a long wick. Often times, this priceaction is likely to be re-tested.
The reason for this is that many traders will enter thesepositions late, which leaves them all holding the bag uponreversal. Once they are shaken out, the counter pressure willbe weak comparatively, and the stock typically goes up again.This usually leads to a push back to the high.
Let’s look at a few examples:
Long wick price action trading example 1

Long wick price action trading example 2Are you able to see the consistent price action in thesecharts?
Notice after the long wicks NIO printed a handful of insiderbars in either direction before breaking out or breakingdown. After this break, the stock proceeded in the directionof the new trend.
#5 – Measuring Length of Intraday SwingsHave you ever heard the phrase, “history has a habit ofrepeating itself”? Well, trading is no different.
As a trader, it’s easy to let your emotions, and morespecifically – hope, take over your sense of logic. We tendto look at a price chart and see riches right before our eyes.
Well, that my friend is not always the reality. Let’s build onthis thought.
In the world of trading there are often dominant players thatconsistently trade very specific securities?
These traders live and breathe their favorite stock. Giventhe right level of capitalization, these select traders canalso control the price movement of these securities.
Knowing this, what can you do to better understand the priceaction of securities you are not intimately acquainted with on
a daily basis?
A good place to start is by measuring the price swings ofprior days.
As you perform your analysis, you will notice commonpercentage moves will appear right on the chart. For example,you may notice that the last 5 moves of a stock were all 5% to6%.
If you are swing trading, you may see a range of 18% to 20%. Bottom line, you shouldn’t expect stocks to all of a suddendouble or triple the size of their previous swings.
Sure, the market is limitless and can produce outlier days.However, it’s better to play the odds with the greatest chanceversus swinging for the fences. Over the long haul, slow andsteady always wins the race.
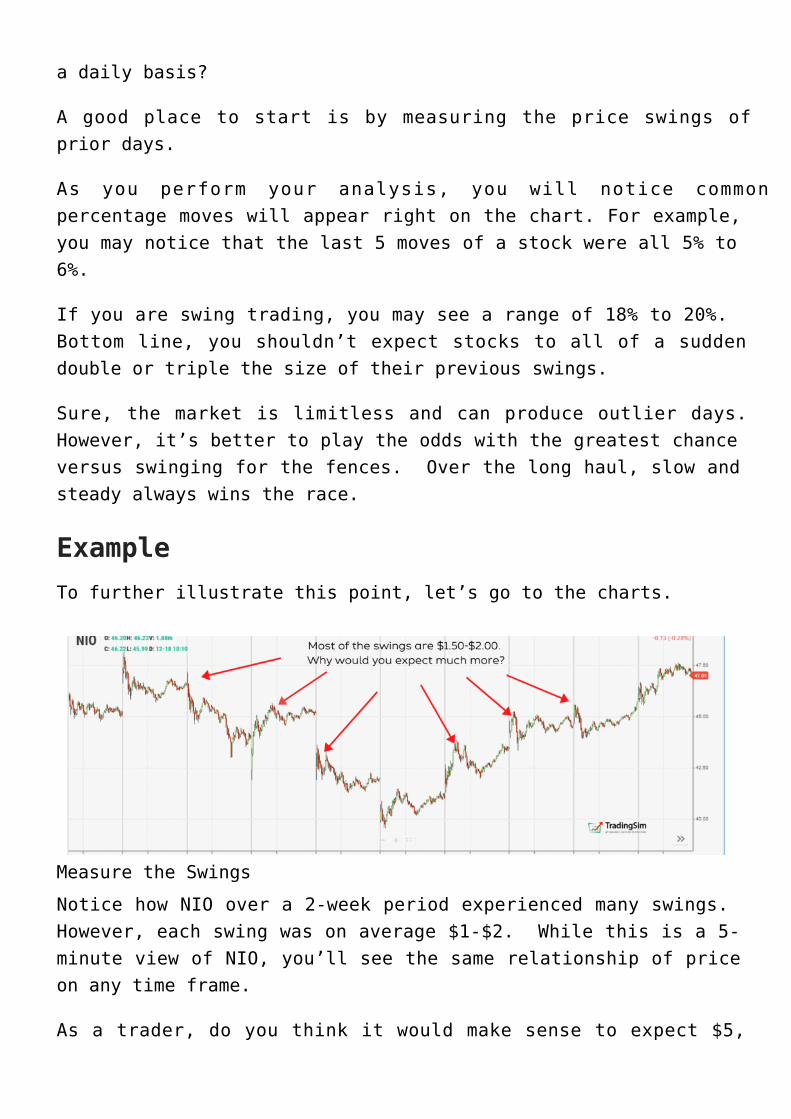
ExampleTo further illustrate this point, let’s go to the charts.
Measure the Swings
Notice how NIO over a 2-week period experienced many swings. However, each swing was on average $1-$2. While this is a 5-minute view of NIO, you’ll see the same relationship of priceon any time frame.
As a trader, do you think it would make sense to expect $5,

$10, or $15 dollars of profit on a day trade? At some point,the stock will make that sort of run, but there will likely bemore $1-2 moves before that occurs.
To that point, if you can trade each of these swingssuccessfully, you get the same effect of landing that home runtrade without all the risk and headache.
#6 – Little to No Price RetracementWithout going to deep on Fibonacci (we’ve saved that foranother post), it can be a useful tool with price actiontrading. At its simplest form, less retracement is proofpositive that the primary trend is strong and likely tocontinue.
Smaller retracementThe key takeaway is you want the retracement to be less than38.2%. If so, when the stock attempts to test the previousswing high or low, there is a greater chance the breakout willhold and continue in the direction of the primary trend.
This is especially true once you go beyond the 11 am timeframe. This is because breakouts after the morning tend tofail. So, in order to filter out these results, you will wantto focus on the stocks that have consistently trended in theright direction with smaller pullbacks.
Using Time to Your AdvantageTrading comes down to who can realize profits from their edgein the market. While it is easy to scroll through charts andsee all the winners in hindsight, it is much more difficult inreal time. The market is one big game of cat and mouse.
Between the quants and smart money, false setups show upeverywhere.
As a price action trader, you cannot rely on other off-chartindicators to provide you clues that a formation is false.However, since you live in the “now” and are reacting todirectly what is in front of you, you must have strict rulesto know when to get out.
With this in mind, in lieu of a technical indicator, onehelpful tool you can use is time.
Just to be clear, the chart formation is always your firstsignal, but if the charts are unclear, time is always thedeciding factor.
On a personal note, in a recent study of all my winningtrades, over 85% of them paid in full within 5 minutes.
If you have been trading for a while, go back and take a lookat how long it takes for your average winner to play out.
How to Protect Against the HeadFakes (False Setups)Let’s review a few head fake examples to get a feel for whatwe are up against in terms of false setups.
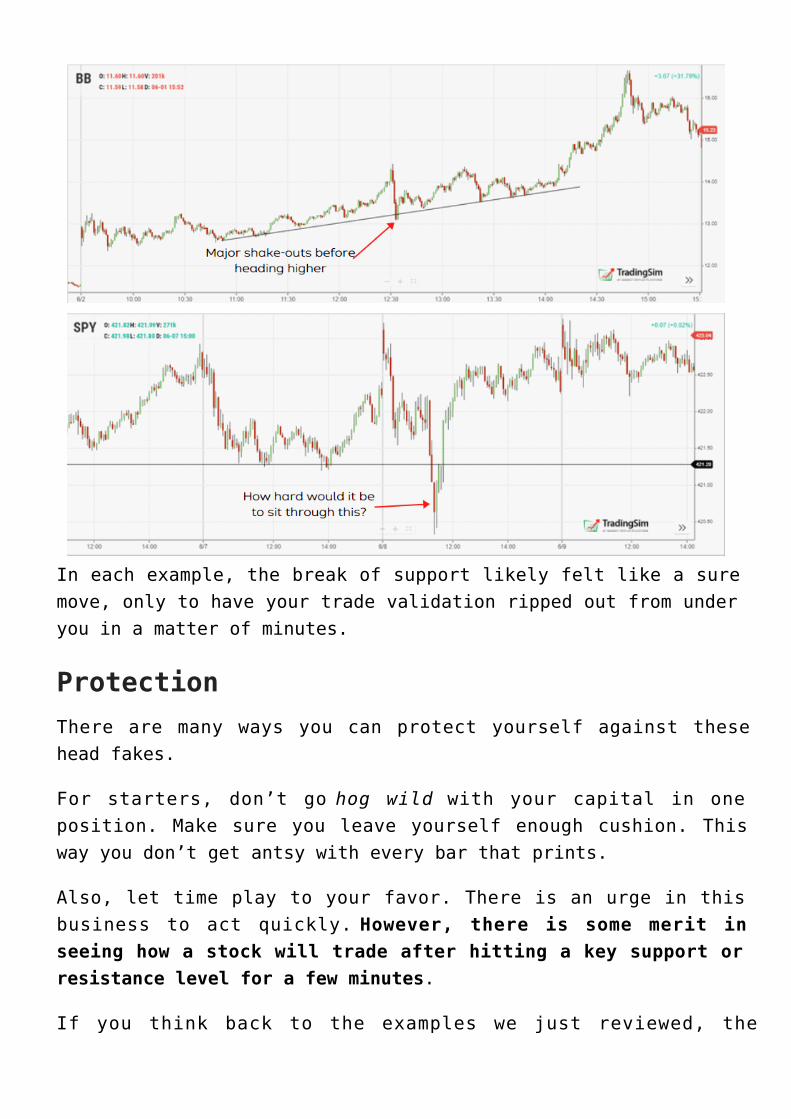
In each example, the break of support likely felt like a suremove, only to have your trade validation ripped out from underyou in a matter of minutes.
ProtectionThere are many ways you can protect yourself against thesehead fakes.
For starters, don’t go hog wild with your capital in oneposition. Make sure you leave yourself enough cushion. Thisway you don’t get antsy with every bar that prints.
Also, let time play to your favor. There is an urge in thisbusiness to act quickly. However, there is some merit inseeing how a stock will trade after hitting a key support orresistance level for a few minutes.
If you think back to the examples we just reviewed, the

security bounced back the other way within minutes of raidingstop losses and trapping traders.
Where to Place Your StopsOne thing to consider is placing your stop above or below keylevels. Since you are using price as your means to measure themarket, these levels are easy to identify.
Another easy way to do this as mentioned previously in thisarticle is to use swing points. A more advanced method is touse daily pivot points.
You are probably thinking, “but this is an indicator.” Wellyes and no. Unlike other indicators, pivot points do not moveregardless of what happens with the price action. They areessentially support and resistance lines.
So, let’s see how you can use pivot points to avoid gettingcaught in false signals.
Using Pivot Points to avoid false breakdownsNotice how the price barely peaked below the key pivot pointand then rallied back above the resistance level. In order toprotect yourself, you can place your stop below the break downlevel to avoid a blow-up trade.
Another option is to place your stop below the low of thebreakout candle. Some traders such as Peters Andrew even
recommends placing your stop two pivot points below. [4] Thismay not work for the risk averse trader, but it can work forsome.
This is honestly the most important thing for you to take awayfrom this article – protect your money by using stops. Do notlet ego or arrogance get in your way.
Benefits of Price Action TradingPrice action traders are the Zen traders in the active tradingworld.
These people believe the human brain is more powerful than anymachine.
Please do not mistake their Zen state for not having a system.The price action trader can interpret the charts and priceaction to make their next move.
Processing DataFor starters, there isn’t as much information to process, soyou can focus on the chart action.
Secondly, you have no one else to blame for getting caught ina trap. Don’t bother emailing the guru with the proprietarytrade signal that had you on the wrong side of the market.
The biggest benefit is that price action traders areprocessing data as it happens. There is no lag in theirprocess for interpreting trade data.
Chart PatternsBy relying solely on price, you will learn to recognizewinning chart patterns. The key is to identify which setupswork and to commit yourself to memorizing these setups.
The next key thing for you to do is to track how much thestock moves for and against you. This will allow you to setrealistic price objectives for each trade. You will ultimatelyget to a point where you will be able to not only see thesetup but also when to exit the trade.
Some ChallengesPrice action traders will need to resist the urge to addadditional indicators to your system. You will have to stayaway from the latest holy grail indicator that will solve allyour problems when you are going through a downturn.
The real challenge is that it’s extremely difficult to tradepurely on price. It’s not something you can just pick up andstart doing right away.
You need to think about the patterns listed in this articleand additional setups you will uncover on your own as stagesin your trading career.
First, learn to master one or two setups at a time. Learn howthey move and when the setup is likely to fail.
This, my friend, takes time; however, get past this hurdle andyou have achieved trading mastery.
To further your research on price action trading, you may wantto look into some courses like the ones offered at WyckoffAnalytics.
In SummaryPrice action trading strategies can be as simple or ascomplicated as you make them. While we have covered 6 commonpatterns in the market, take a look at your previous trades tosee if you can identify tradeable patterns. The key thing foryou is getting to a point where you can pinpoint one or two
strategies.
To start, focus on the morning setups. The morning is whereyou are likely to have the most success. Avoid the lunchtimeand end of day setups until you are able to turn a profittrading before 11 or 11:30 am.
To test drive trading with price action, please take a look atthe Tradingsim platform to see how we can help.
Much Success,
Al
External ReferencesSeo, Yong. (2017). ‘Scientific Guide to Price Action1.Trading‘. Algotrading-investment.com. p. 13Heikin Ashi Trader (2018). ‘How to Trade a Range: The2.Most Interesting Market in the World‘. DAO Press. p. 7(2009). ‘Nifty Ready for Mark Up’ [Report]. Prabhudas3.Lilladher. p. 2Peters, Andrew. (2010). ‘Trading Pivot Points‘.4.Fabrefactum. p. 2