preview chapter 1: evolution of china's exchange rate ...€¦ · evolution of china’s...
TRANSCRIPT

3
1Evolution of China’s Exchange Rate Regime in the Reform Era
Reforms of China’s exchange rate regime have been a key factor underlying the country’s growing participation in global trade since economic reform began in 1978. From 1949 until the late 1970s, the state fixed China’s exchange rate at a highly overvalued level as part of the country’s import-substitution industrialization strategy. Through its system of economic planning, the state adopted policies to accelerate industrial development in order to reduce China’s dependence on imported manufactured goods. These policies included direct controls on imports and exports, an overvalued exchange rate, and tight controls over foreign exchange. The overvaluation of the currency allowed the government to provide imported machinery and equipment to priority industries at a relatively lower domestic currency cost than otherwise would have been possible.
But the overvalued exchange rate led to excess demand for foreign exchange and turned the terms of trade against producers of China’s ex-ports, which in the 1950s were predominantly agricultural and processed food products. As early as 1950 the Chinese authorities introduced exten-sive exchange controls that, among other things, required the deposit of all sources of foreign exchange, including export earnings, in the Bank of China, the sole institution authorized to deal in foreign exchange.1 This surrender requirement was facilitated by the establishment of a small number of state-controlled trading companies that specialized in trade in well-defined, nonoverlapping product lines. By the mid-1950s, the few
1. Beginning in 1985 the state began to gradually allow other banks to conduct foreign exchange transactions. The Bank of China is a commercial bank while the People’s Bank of China is China’s central bank.
Peterson Institute for International Economics | www.piie.com

4 THE FUTURE OF CHINA’S EXCHANGE RATE POLICY
remaining nonstate companies engaged in international trade were na-tionalized, ensuring direct state control of virtually all sources of foreign exchange. The Bank of China, in turn, allocated the limited supply of for-eign exchange to priority uses identified by the state through its economic planning process.
The overvaluation of the currency naturally depressed the domestic prices of traditional export goods and undermined the incentive to produce them. The state sought to overcome this problem by requiring producers to achieve specified levels of output and product sales to state trading companies for sale in the international market.
Several types of evidence support the view that the Chinese currency was systematically overvalued for the three decades before reform be-gan in the late 1970s. First, the currency was inconvertible and subject to extensive exchange controls, summarized above. Second, the domestic currency cost of earning one dollar in export sales substantially exceeded the exchange rate throughout the 1950s–70s (Lardy 1992, 24–27), so for-eign trade companies, on average, lost money on their export sales. For example, in 1975 products that cost RMB3 on the domestic market could be sold internationally for $1; but since the exchange rate was only RMB1.86 per dollar, a trading company would incur a loss of RMB1.14 for every dollar’s worth of international sales. These losses on exports were cov-ered by the profits these firms earned from the domestic sales of imported goods whose prices were based on a markup over the cost of similar do-mestic goods (Lardy 1992, 26). Finally, as we explain below, when the cur-rency reached what was arguably close to an equilibrium level in 1994–95, this level represented a substantial depreciation from that which prevailed in the years before reform.
Transition to an Equilibrium Exchange Rate
China’s transition by the mid-1990s to a system in which the value of its currency was determined by supply and demand in a foreign exchange market was a gradual process spanning 15 years that involved changes in the official exchange rate, the use of a dual exchange rate system, and the introduction and gradual expansion of markets for foreign exchange.
The most important prerequisite for moving to a market-determined exchange rate was an easing of controls on trade and other current account transactions, as occurred in several very early steps. In 1979 the State Council approved a system allowing exporters and their provincial and local government owners to retain a share of their foreign exchange earnings, referred to as foreign exchange quotas (previously these earnings had to be surrendered in their entirety to the Bank of China).
At the same time, the government introduced a similar system to allow retention of part of the foreign exchange earnings from nontrade
Peterson Institute for International Economics | www.piie.com

EVOLUTION OF CHINA’S EXCHANGE RATE REGIME IN THE REFORM ERA 5
sources, such as overseas remittances, port fees paid by foreign vessels, and tourism. This foreign exchange retention system, introduced to provide increased incentives for exports and other sources of foreign exchange, evolved in complex ways. Different rates were set for different types of commodities—for some products retentions were allowed only for incremental exports above a base level, frequently the magnitude of exports in the recent past; and, over time, regionally differentiated rates came to replace product-specific rates. But the net result was that by the mid-1980s, only a few years after the system was introduced, about 40 percent of all foreign exchange earnings was in the hands of provinces and export producers while the central government controlled the rest (Lardy 1992, 51–57).
As early as October 1980, exporting firms that retained foreign ex-change above their own import needs were allowed to sell the excess through the state agency responsible for the management of China’s ex-change controls and its foreign exchange reserves, the State Administra-tion of Exchange Control.2 Beginning in the mid-1980s, the government sanctioned foreign exchange markets, known as swap centers, eventually in dozens of cities. The initial restrictions on participation in these markets gradually eroded and the volume of transactions expanded significantly, reaching more than $13 billion in 1990. Initially the government sought to control the price of foreign exchange in these markets, but controls were progressively eased and the market price invariably displayed a premium to the official exchange rate, again confirming the continued overvalu-ation of the renminbi by the official exchange rate.
The other major policy instrument the government used to move the currency toward a market-determined rate was devaluation, beginning in January 1981 when the State Council introduced an “internal settlement rate” of RMB2.8 to the dollar. At the time the official exchange rate was RMB1.5 so the new rate, which applied to all trade transactions, was a devaluation of almost 100 percent.3 In effect this measure introduced a dual exchange rate system, since the official exchange rate still applied to nontrade transactions. The government then began to devalue the official exchange rate, so that by the end of 1984 it had converged to the internal settlement rate of RMB2.8. In early 1985 the government abolished the internal settlement rate and all international transactions were settled at the official exchange rate (but the authorities continued to operate
2. Initially this agency was directly subordinate to the State Council. In 1993 it came under the administrative control of the People’s Bank of China, the country’s central bank. In 1997 the official English translation of the name of this organization was changed to the State Administration of Foreign Exchange, commonly known by its acronym SAFE. Its name in Chinese remains the same.
3. The official rate was pegged to a basket of currencies while the internal settlement rate was pegged exclusively to the dollar.
Peterson Institute for International Economics | www.piie.com

6 THE FUTURE OF CHINA’S EXCHANGE RATE POLICY
the internal swap market for foreign exchange and its role continued to expand).
After the internal settlement rate was abolished the authorities contin-ued to devalue the currency, to a rate of RMB3.2 by mid-1986 and then, in a single step on July 5, 1986, an additional 15 percent, to RMB3.7 (Lardy 2002, 49). A further devaluation in December 1989 took the rate to RMB4.7. Over the next four years the government devalued the currency until it reached RMB5.8 at year-end 1993. Then on January 1, 1994, the government unified the official and swap market rates by moving the official rate to the then prevailing swap market rate, RMB8.7. Over the next 18 months the government revalued the currency until it reached RMB8.30 in June 1995, and then slowly moved it to RMB8.28 by October 1997.4 From that time until the reform initiated on July 21, 2005, the nominal value of the currency vis-à-vis the dollar fluctuated in a very narrow range around RMB8.28.
Although tightly managed by the government, the official exchange rate during the mid-1990s was probably a reasonable approximation of an equilibrium rate, given the controls on capital account transactions that then prevailed. Several reasons underlie this judgment.
First, although commentators argued that the 1994 unification of the two rates amounted to a massive devaluation of the renminbi that left the currency significantly undervalued (Makin 1997), the evidence indicates that this interpretation is in error. Just before the unification of the official and swap market rates in January 1994, China’s foreign exchange retention system had widened so greatly that four-fifths of all foreign exchange transactions were flowing through the swap market, where the rate was RMB8.7 (IMF 1995, 13). Government allocation of foreign exchange at the official rate of RMB5.8 accounted for the remaining one-fifth of the market. Thus the effective depreciation of the exchange rate, calculated by comparing the weighted average of the swap market rate and the official exchange rate before unification with the new rate of RMB8.7, was 7 percent, not the 35 percent sometimes cited (Fernald, Edison, and Loungani 1998).
Second, the price of foreign exchange in the swap market by the time of the unification of the two rates was overwhelmingly market determined. Government intervention in the swap market, which was important in the mid-1980s, had effectively ended in 1988. Until then the government had set the price in the swap market on a daily basis and all transactions had to occur at the fixed price. But beginning in 1988 in Shanghai, the most important market, the government introduced a Walrasian auction system to determine the price. In this system, a market-clearing price
4. The move from RMB8.7 to RMB8.3 represents a nominal appreciation of 4.8 percent; from RMB8.3 to RMB8.28 is a nominal appreciation of 0.25 percent; the cumulative nominal appreciation was 5 percent.
Peterson Institute for International Economics | www.piie.com

EVOLUTION OF CHINA’S EXCHANGE RATE REGIME IN THE REFORM ERA 7
was established daily by auction, prior to the commencement of trading, and then all trades had to occur at that price (Lardy 1992, 63). In short, the swap market rate by the mid-1990s reflected supply and demand for foreign exchange, free of government interference. A weighted average of the swap market rate of RMB8.7 and the official rate of RMB5.8 before unification of the two rates is RMB8.1, suggesting that the unified rate of RMB8.7 might have been slightly undervalued.
The judgment that in January 1994 the renminbi at RMB8.7 was slightly undervalued is reinforced by developments in the swap market for foreign exchange in 1993. As the government plan to unify the official and the swap market rates became known in the last months of 1993, the swap market rate depreciated considerably.5 This was the inevitable result as importers, who were able to access foreign exchange at the official market rate, accelerated their transactions, knowing that within a matter of months they would have to pay much more for foreign exchange. On the other hand, exporters, who were required to surrender their foreign exchange at the official rate, postponed some of their trades until after the unification took place, in order to be able to convert their foreign exchange earnings at what they anticipated would be a much more favorable rate (People’s Bank of China 1995, 44; IMF 1995, 6). This seems to be the chief explanation of why China’s trade balance, which had been slightly positive in 1990–92, unexpectedly was in relatively large deficit in 1993 and then returned to a modest surplus in 1994.
If the renminbi was slightly undervalued at RMB8.7 in January 1994, subsequent developments brought it closer to an equilibrium level. As already noted, the nominal exchange rate of the renminbi vis-à-vis the dollar appreciated to RMB8.3 within 18 months of the rate unification. And China had relatively high inflation—indeed, the highest of the reform era—in 1994 when consumer prices shot up by 24 percent and again in 1995 when the price increase moderated but was still quite elevated at 17 percent. Inflation higher than the average of one’s trading partners is the equivalent of appreciation since it makes the country’s goods less competitive in international markets. The appreciation of the renminbi in real trade-weighted terms is reflected in figure 1.1. The International Monetary Fund (IMF) calculated that subsequent to the unification of the official and swap market exchange rates, the real effective exchange rate of the renminbi appreciated by 13 percent in 1994 and an additional 5 percent in 1995 (IMF 1996, 50).
Third, China’s current account position in 1994–96 was not far from equilibrium. As shown in figure 1.2, the current account deficit of 2.0 per-cent of gross domestic product in 1993 gave way to very modest surpluses of 1.4 percent in 1994, 0.2 percent in 1995, and 0.9 percent in 1996.
5. The swap market rate averaged a little over RMB8 per dollar in the first quarter of 1993 but in June fell sharply to a low of RMB10 per dollar before recovering to average about RMB8.7 per dollar in the last quarter of the year.
Peterson Institute for International Economics | www.piie.com

8 THE FUTURE OF CHINA’S EXCHANGE RATE POLICY
Fourth, anecdotal evidence suggests that the volume of transactions in the curb market for foreign exchange fell precipitously after the unifi-cation of the two rates, suggesting that the new unified rate was close to equilibrium.
Finally, the unification of the swap and official exchange rates in 1994 was accompanied by a substantial reduction in exchange controls on current account transactions and was followed less than two years later by a formal move to full convertibility on all current account transactions. In addition, the state abolished the foreign exchange retention system for domestic firms, instead requiring them to sell all their foreign exchange earnings to banks but, importantly, allowing them to freely purchase from banks the foreign exchange needed for trade transactions.6 Coincident with this reform, in April 1994 the state established the China Foreign Exchange Trading System based in Shanghai. This was the beginning of a unified interbank market in foreign exchange. On November 28, 1996, the government announced that effective December 1 it would approve all bona fide requests for foreign exchange for current payments and transfers
6. For a good subject to import licensing, a firm would have to obtain a license before purchasing foreign exchange to complete the transaction.
Figure 1.1 Real effective exchange rate of the renminbi, 1980–95
Note: The indices of the real effective exchange rate are based on the official exchange rate and thus do not take into account transactions in the swap market.
Sources: Citigroup, Competitive Trade- Weighted Exchange Rate Index; JPMorgan, Real Broad Effec-tive Exchange Rate Indices.
January 1990=100
300
250
200
150
100
50
0
19801981
19821983
19841985
19861987
19881989
19901991
19921993
1994
Citigroup
JPMorgan
1995
Peterson Institute for International Economics | www.piie.com

EVOLUTION OF CHINA’S EXCHANGE RATE REGIME IN THE REFORM ERA 9
(IMF 1997, 132).7 In effect, China formally accepted the obligations of the International Monetary Fund’s Article VIII, meaning that it had achieved convertibility on all current account transactions. This was perhaps the ultimate indication that the exchange rate had moved decisively toward an equilibrium rate. The government was confident that it could meet all legitimate requests for foreign exchange to finance imports and other current account transactions. Before the mid-1990s, this would have been impossible because the official exchange rate was still overvalued (i.e., there was excess demand for foreign exchange at the prevailing official exchange rate).
In contrast with the earlier policy of frequent exchange rate adjust-ments, after mid-1995 China’s authorities kept the currency closely pegged to the dollar. Given developments in international financial markets, how-ever, China’s real effective exchange rate was anything but stable. During the Asian financial crisis of 1997–98, the value of many Asian currencies vis-à-vis the US dollar plummeted. With the renminbi pegged to the dol-
7. The additional steps after 1994 to completely liberalize controls on current account transactions involved liberalizing the access of foreign-funded enterprises to the foreign exchange market and abolishing the foreign exchange balancing requirement for these firms (IMF 1997, 131–32).
Figure 1.2 Current account position, 1982–2008
Sources: National Bureau of Statistics of China (2007b); ISI Emerging Markets, CEIC Database; People’s Bank of China, Statistical Investigation Office (1997, 204–205); Xinhua News Agency, Press Conference of the State Council Information Office, “Maintaining Economic Growth, Preventing Risks and Improving the Future Balance of Payments,” February 18, 2009, www.xinhuanet.com.
percent of GDP
15
13
11
9
7
5
3
1
–1
–3
–5
19821984
19861988
19901992
19941996
19982000
20022004
20062008
Peterson Institute for International Economics | www.piie.com

10 THE FUTURE OF CHINA’S EXCHANGE RATE POLICY
lar, as the latter appreciated on a trade-weighted basis so too did the ren-minbi. As shown in figure 1.1, from mid-1995 to early 2002, when the value of the dollar reached a peak, the real trade-weighted value of the renminbi appreciated 24 percent.
The evolution of China’s current account over the second half of the 1990s and into the early part of the next decade suggests that China’s real effective exchange rate remained reasonably close to an equilibrium value. As figure 1.2 shows, China’s current account surplus was somewhat elevated in 1997 and 1998, largely reflecting the slowdown in China’s growth during those years, which significantly moderated the demand for imports. But as a more normal rate of growth resumed, the current account surplus fell, dropping to 1.3 percent of GDP by 2001.
Our interpretation is that, while China’s nominal exchange rate remained fixed vis-à-vis the dollar, the appreciation of the dollar was coincidentally roughly the amount needed to keep China’s current account position in reasonable equilibrium from 1994 through the early 2000s. Despite an annual real effective appreciation of the renminbi of over 3 percent per year from 1994 through 2001, it appears that the competitiveness of Chinese exports was not unduly affected. As we discuss in more detail in chapter 2, that suggests this period was characterized by substantial growth of total factor productivity in China’s export sector. In short, China’s actual real effective exchange rate seems to have roughly tracked the real equilibrium exchange rate from the mid-1990s to the very early part of the next decade.
In sharp contrast, after 2001 the Chinese policy of maintaining a fixed nominal exchange rate vis-à-vis the dollar produced very different results. The value of the dollar, after peaking in February 2002, began to depreciate, pulling down the value of the renminbi. By mid-2005, the value of the renminbi on a real trade-weighted basis had fallen by about 10 percent compared with its peak value in February 2002. Assuming that productivity growth in China’s export sector continued after 2001,8 the combination of these two factors suggests that by mid-2005 the renminbi was undervalued by about 20 percent. As a result, starting in 2002 the competitiveness of Chinese goods in international markets began to increase significantly, causing China’s trade and current accounts to move into increasingly large surplus positions.
Developments since Mid-2005
On July 21, 2005, China introduced a new currency regime that ended the decade-long fixed nominal exchange rate of the renminbi vis-à-vis the
8. Support for this assumption comes from the work by Dwight H. Perkins and Thomas G. Rawski (2008, 839). They estimate that total factor productivity growth for the economy as a whole was 3.2 percent per year in 1995–2000 and 3.1 percent per year in 2000–2005.
Peterson Institute for International Economics | www.piie.com

EVOLUTION OF CHINA’S EXCHANGE RATE REGIME IN THE REFORM ERA 11
US dollar (People’s Bank of China 2005). The authorities not only imme-diately revalued the official bilateral rate by 2.1 percent, moving it from RMB8.28 to RMB8.11 to the dollar but also announced that the renminbi henceforth would be managed “with reference to a basket of currencies” rather than being pegged to the dollar. Most importantly, the central bank said that the exchange rate was to become “more flexible” with its value based more on “market supply and demand.”
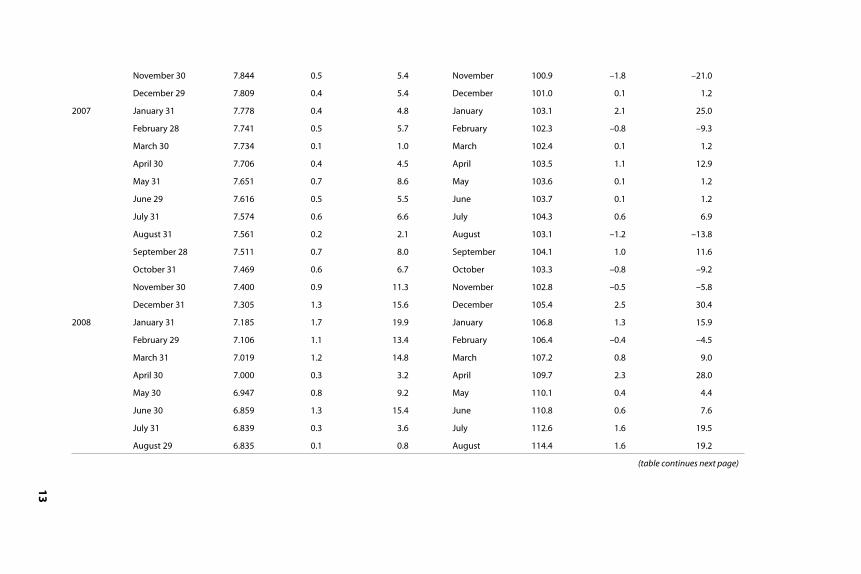
By the end of 2008 the nominal renminbi-dollar rate was RMB6.83, re-flecting a cumulative nominal appreciation against the US dollar of 21 per-cent compared with that in July 20, 2005. As shown in table 1.1, the rate of renminbi movement relative to the dollar was anything but uniform over this period—ranging from small depreciations of 0.3, 1.3, and 1.6 percent (at an annual rate) in May 2006 and October and November 2008, respec-tively, to large appreciations of more than 10 percent from November 2007 through March 2008 and again in June 2008. Taking the post–July 2005 period as a whole, the rate of nominal renminbi appreciation relative to the dollar has been on a rising trend, increasing from roughly 3 percent a year in 2005 and 2006 to approximately 7 percent a year in 2007 and 2008.
Next, consider the behavior of China’s real trade-weighted exchange rate, usually called the real effective exchange rate; this is the relative price most relevant for the evolution of China’s balance of payments position. Indices of real effective exchange rates, such as those shown in figure 1.1, provide a summary of how the renminbi has moved against a weighted average of the currencies of China’s trading partners, where the weights reflect the relative importance of each country in China’s trade.9 In ad-dition, indices of “real” as opposed to nominal effective exchange rates adjust for differences in inflation rates between the home currency and its trading partners. This adjustment accounts for the fact that an increase in domestic inflation compared with the home country’s trading partners has the same effect on the home country’s competitiveness as an apprecia-tion of its nominal exchange rate.
In table 1.2, we show the evolution of three popular indices (construct-ed by JPMorgan Chase, Citigroup, and the Bank for International Settle-ments [BIS]) of real effective exchange rates for the renminbi in February 2002–December 2008. The table shows the raw trade-weighted real index as well as the cumulative appreciation since February 2002, when the value of the US dollar peaked, and since June 2005, when China adopted its new exchange rate policy. While the three indices usually yield similar qualitative conclusions, they sometimes produce quite divergent quan-titative answers in the short run because their calculations are based on different country weights and because they use different domestic price indices. Nonetheless, several conclusions stand out.
9. In some indices the weights take into account the degree of competition between China and other countries in third-country markets.
Peterson Institute for International Economics | www.piie.com

12
TH
E FUTU
RE OF CH
INA’S EXCH
AN
GE RATE PO
LICY
Table 1.1 Movements in nominal US dollar and real effective exchange rate of the renminbi, June 2005 to
January 2009
Year
Nominal vis-à-vis US dollar JPMorgan real effective exchange rate
Date Rate
Appreciation (percent)
Month Rate
Appreciation (percent)
Month
(over previous
month)
Annualized
(month*12)
Month
(over previous
month)
Annualized
(month*12)
2005 June 30 8.277 June 96.7
July 29 8.108 2.1 24.9 July 99.7 3.1 37.2
August 31 8.097 0.1 1.6 August 99.1 –0.6 –7.2
September 30 8.093 0.1 0.6 September 100.9 1.8 21.8
October 31 8.084 0.1 1.3 October 102.2 1.3 15.5
November 30 8.080 0.1 0.7 November 102.6 0.4 4.7
December 31 8.070 0.1 1.4 December 102.2 –0.4 –4.7
2006 January 27 8.061 0.1 1.4 January 100.5 –1.7 –20.0
February 28 8.042 0.2 2.9 February 100.8 0.3 3.6
March 31 8.017 0.3 3.7 March 101.7 0.9 10.7
April 28 8.017 0.0 0.1 April 102.4 0.7 8.3
May 31 8.019 –0.0 –0.3 May 99.3 –3.0 –36.3
June 30 7.996 0.3 3.5 June 99.9 0.6 7.3
July 31 7.973 0.3 3.4 July 101.1 1.2 14.4
August 31 7.959 0.2 2.2 August 99.8 –1.3 –15.4
September 29 7.909 0.6 7.6 September 102.0 2.2 26.5
October 31 7.879 0.4 4.5 October 102.7 0.7 8.2
Peterson Institute for International E
conomics | w
ww
.piie.com
EVOLU
TION
OF CH
INA’S EXCH
AN
GE RATE REG
IME IN
THE REFO
RM ERA
1
3
November 30 7.844 0.5 5.4 November 100.9 –1.8 –21.0
December 29 7.809 0.4 5.4 December 101.0 0.1 1.2
2007 January 31 7.778 0.4 4.8 January 103.1 2.1 25.0
February 28 7.741 0.5 5.7 February 102.3 –0.8 –9.3
March 30 7.734 0.1 1.0 March 102.4 0.1 1.2
April 30 7.706 0.4 4.5 April 103.5 1.1 12.9
May 31 7.651 0.7 8.6 May 103.6 0.1 1.2
June 29 7.616 0.5 5.5 June 103.7 0.1 1.2
July 31 7.574 0.6 6.6 July 104.3 0.6 6.9
August 31 7.561 0.2 2.1 August 103.1 –1.2 –13.8
September 28 7.511 0.7 8.0 September 104.1 1.0 11.6
October 31 7.469 0.6 6.7 October 103.3 –0.8 –9.2
November 30 7.400 0.9 11.3 November 102.8 –0.5 –5.8
December 31 7.305 1.3 15.6 December 105.4 2.5 30.4
2008 January 31 7.185 1.7 19.9 January 106.8 1.3 15.9
February 29 7.106 1.1 13.4 February 106.4 –0.4 –4.5
March 31 7.019 1.2 14.8 March 107.2 0.8 9.0
April 30 7.000 0.3 3.2 April 109.7 2.3 28.0
May 30 6.947 0.8 9.2 May 110.1 0.4 4.4
June 30 6.859 1.3 15.4 June 110.8 0.6 7.6
July 31 6.839 0.3 3.6 July 112.6 1.6 19.5
August 29 6.835 0.1 0.8 August 114.4 1.6 19.2
(table continues next page)
Peterson Institute for International E
conomics | w
ww
.piie.com

14
TH
E FUTU
RE OF CH
INA’S EXCH
AN
GE RATE PO
LICY
Table 1.1 Movements in nominal US dollar and real effective exchange rate of the renminbi, June 2005 to
January 2009 (continued)
Year
Nominal vis-à-vis US dollar JPMorgan real effective exchange rate
Date Rate
Appreciation (percent)
Month Rate
Appreciation (percent)
Month
(over previous
month)
Annualized
(month*12)
Month
(over previous
month)
Annualized
(month*12)
2008(continued)
September 26 6.818 0.2 2.9 September 117.5 2.7 32.5
October 31 6.826 –0.1 –1.3 October 119.2 1.4 17.4
November 28 6.835 –0.1 –1.6 November 117.8 –1.2 –14.1
December 31 6.835 0.0 0.1 December 113.4 –3.7 –44.8
2009 January 23 6.838 –0.0 –0.6 January 112.8 –0.5 –6.3
Sources: State Administration of Foreign Exchange, www.safe.gov.cn; JPMorgan, Real Broad Effective Exchange Rate Indices.
Peterson Institute for International E
conomics | w
ww
.piie.com

EVOLU
TION
OF CH
INA’S EXCH
AN
GE RATE REG
IME IN
THE REFO
RM ERA
1
5
Table 1.2 Real effective exchange rate of the renminbi, 2002–08
Date
JPMorgan real trade-weighted rate Citi real trade-weighted rate BIS real trade-weighted rate
Index
(2000=100)
Cumulative appreciation
(percent)
Index
(January
1980=1)
Cumulative appreciation
(percent)
Index
(2005=100)
Cumulative appreciation
(percent)
Since
February
2002
Since
June 2005
Since
February
2002
Since
June 2005
Since
February
2002
Since
June 2005
2002
February 105.5 0.0 0.363 0.0 119.45 0.0
December 100.6 –4.6 0.334 –8.0 107.46 –10.0
2003
December 94.8 –10.1 0.329 –9.3 100.52 –15.8
2004
December 93.1 –11.8 0.317 –12.8 95.71 –19.9
2005
June 96.7 –8.3 0.0 0.314 –13.6 0.0 99.47 –16.7 0.0
July 99.7 –5.5 3.1 0.324 –10.7 3.4 101.21 –15.3 1.7
August 99.1 –6.1 2.5 0.331 –8.8 5.6 103.32 –13.5 3.9
September 100.9 –4.4 4.3 0.326 –10.2 3.9 103.11 –13.7 3.7
October 102.2 –3.1 5.7 0.325 –10.5 3.6 102.26 –14.4 2.8
November 102.6 –2.7 6.1 0.331 –8.7 5.6 103.04 –13.7 3.6
December 102.2 –3.1 5.7 0.336 –7.4 7.1 102.49 –14.2 3.0
2006
January 100.5 –4.7 3.9 0.323 –11.1 2.8 94.90 –20.6 –4.6
(table continues next page)
Peterson Institute for International E
conomics | w
ww
.piie.com

16
TH
E FUTU
RE OF CH
INA’S EXCH
AN
GE RATE PO
LICY
Table 1.2 Real effective exchange rate of the renminbi, 2002–08 (continued)
Date
JPMorgan real trade-weighted rate Citi real trade-weighted rate BIS real trade-weighted rate
Index
(2000=100)
Cumulative appreciation
(percent)
Index
(January
1980=1)
Cumulative appreciation
(percent)
Index
(2005=100)
Cumulative appreciation
(percent)
Since
February
2002
Since
June 2005
Since
February
2002
Since
June 2005
Since
February
2002
Since
June 2005
2006(continued)
February 100.8 –4.5 4.2 0.333 –8.4 6.0 103.71 –13.2 4.3
March 101.7 –3.6 5.2 0.324 –10.9 3.1 102.32 –14.3 2.9
April 102.4 –2.9 5.9 0.320 –12.0 1.8 102.80 –13.9 3.3
May 99.3 –5.9 2.7 0.314 –13.6 –0.1 101.00 –15.4 1.5
June 99.9 –5.3 3.3 0.318 –12.4 1.3 100.69 –15.7 1.2
July 101.1 –4.2 4.6 0.323 –11.1 2.9 100.43 –15.9 1.0
August 99.8 –5.4 3.2 0.328 –9.6 4.6 102.28 –14.4 2.8
September 102.0 –3.3 5.5 0.327 –10.0 4.2 103.37 –13.5 3.9
October 102.7 –2.7 6.2 0.325 –10.4 3.7 102.16 –14.5 2.7
November 100.9 –4.4 4.3 0.328 –9.8 4.4 101.31 –15.2 1.8
December 101.0 –4.3 4.4 0.335 –7.9 6.6 101.35 –15.2 1.9
2007
January 103.1 –2.3 6.6 0.330 –9.2 5.1 96.68 –19.1 –2.8
February 102.3 –3.0 5.8 0.340 –6.4 8.3 105.60 –11.6 6.2
March 102.4 –2.9 5.9 0.330 –9.2 5.1 104.02 –12.9 4.6
Peterson Institute for International E
conomics | w
ww
.piie.com

EVOLU
TION
OF CH
INA’S EXCH
AN
GE RATE REG
IME IN
THE REFO
RM ERA
1
7
April 103.5 –1.9 7.0 0.325 –10.4 3.7 104.31 –12.7 4.9
May 103.6 –1.8 7.1 0.329 –9.5 4.7 105.91 –11.3 6.5
June 103.7 –1.7 7.2 0.335 –7.8 6.7 105.94 –11.3 6.5
July 104.3 –1.1 7.9 0.343 –5.6 9.2 106.40 –10.9 7.0
August 103.1 –2.3 6.6 0.352 –3.1 12.2 109.54 –8.3 10.1
September 104.1 –1.3 7.7 0.345 –5.1 9.9 108.68 –9.0 9.3
October 103.3 –2.1 6.8 0.336 –7.5 7.1 104.97 –12.1 5.5
November 102.8 –2.6 6.3 0.339 –6.6 8.1 104.18 –12.8 4.7
December 105.4 –0.1 9.0 0.351 –3.4 11.7 105.93 –11.3 6.5
2008
January 106.8 1.2 10.4 0.345 –5.0 9.9 100.72 –15.7 1.3
February 106.4 0.9 10.0 0.361 –0.5 15.1 111.74 –6.5 12.3
March 107.2 1.6 10.9 0.349 –3.9 11.2 108.93 –8.8 9.5
April 109.7 4.0 13.4 0.350 –3.7 11.4 111.14 –7.0 11.7
May 110.1 4.4 13.9 0.351 –3.2 12.0 112.51 –5.8 13.1
June 110.8 5.0 14.6 0.356 –1.9 13.5 111.89 –6.3 12.5
July 112.6 6.7 16.4 0.363 0.0 15.8 111.91 –6.3 12.5
August 114.4 8.4 18.3 0.377 3.9 20.2 116.77 –2.2 17.4
September 117.5 11.4 21.5 0.371 2.3 18.4 119.14 –0.3 19.8
October 119.2 13.0 23.3 0.366 0.7 16.5 121.11 1.4 21.8
November 117.8 11.7 21.8 0.368 1.3 17.2 122.96 2.9 23.6
December 113.4 7.5 17.3 0.373 2.6 18.7 119.62 0.1 20.3
Sources: JPMorgan, Real Broad Effective Exchange Rate Indices; Citigroup, Competitive Trade–Weighted Exchange Rate Index; Bank for International Settlements, Effective Exchange Rate Indices.
Peterson Institute for International E
conomics | w
ww
.piie.com

18 THE FUTURE OF CHINA’S EXCHANGE RATE POLICY
First, the cumulative real effective appreciation of the renminbi between the July 2005 reform and year-end 2008 is sizable, ranging from 17 to 20 percent according to the three indices. It is worth noting that the cumulative real effective appreciation of the renminbi would be considerably smaller if one used some alternative benchmarks that have sometimes been used in the wider and longer-running discussions about the adjustment of external imbalances among the major economies. For example, 2002 is a relevant benchmark because (1) the US dollar, a key variable in the external imbalance problem, hit its peak (in February) and (2) China’s external imbalance began its prolonged rise that continued through 2008. If February 2002 is used as the base, then the cumulative real effective appreciation of the renminbi (as of December 2008) is substantially less, ranging from negligible to 7.5 percent, as shown in table 1.2. This earlier period illustrates how the three indices of real effective exchange rates can sometimes produce quite divergent answers.
Second, the pace of real effective appreciation of the renminbi has been quite variable.10 Initially appreciation was quite rapid: on an annualized basis it ranged in 2005 from 6 to 14 percent, according to the indices shown in table 1.2. But all three indices show that on a real effective basis the renminbi actually depreciated during 2006. Appreciation resumed in 2007, but at a modest pace. As a result of this pattern, as late as October 2007 the cumulative real effective appreciation of the renminbi (since the July 2005 reform) was only 5 to 7 percent (that is, approximately 2 to 3 percent a year), a fact that led at the time to the complaint that on the relative-price measure that mattered the most, real exchange rate adjustment for the renminbi was very modest (Goldstein 2007b).
Since late 2007, the pace of appreciation on a real effective basis has picked up considerably. For example, between November 2007 and December 2008, the real effective rate of the renminbi appreciated by 10 percent according to the JPMorgan and Citi indices and 14 percent according to the BIS index. For the latter index, the appreciation of the currency between November 2007 and December 2008 accounts for three-quarters of cumulative appreciation since July 2005; for the other two indices that share is at least half.
Further investigation reveals that while the renminbi appreciated against the currencies of 12 of China’s 13 major trading partners (the Japanese yen being the exception) from November 2007 to December 2008, particularly large (nominal) renminbi appreciations were registered against the Korean won (40 percent), the UK pound sterling and the Australian
10. Reinforcing this result, and as shown in the last column of table 1.1, according to the JPMorgan index, the rate of real effective appreciation has varied from depreciations (at an annual rate) of 20 percent or more (in January 2006, May 2006, November 2006, and December 2008) to appreciations of 20 percent or more (in September 2005, September 2006, January 2007, December 2007, April 2008, and September 2008).
Peterson Institute for International Economics | www.piie.com

EVOLUTION OF CHINA’S EXCHANGE RATE REGIME IN THE REFORM ERA 19
dollar (33 percent each), the Canadian dollar (27 percent), and the euro (21 percent); the appreciation against the US dollar during this period was 8 percent. Once one takes into account the weights of these currencies in the trade-weighted index (as well as that of the Taiwan dollar, which fell by 10 percent against the renminbi over this period), it emerges that the euro and the Korean won together accounted for about half of the renminbi appreciation (during the November 2007–November 2008 period) and that the US dollar, the Taiwan dollar, the pound sterling, and the Canadian dollar together made up roughly a third of it.11 As discussed in chapter 3, a major issue going forward is whether these large depreciations (vis-à-vis the renminbi) in most of China’s key trading partners will be largely reversed once recovery from the ongoing global economic and financial crisis is firmly established.
Turning from the size and variability of renminbi exchange rate changes to the claimed “basket” characteristics of the new currency re-gime, empirical studies (Eichengreen 2004b; Frankel and Wei 2007, 2008) have found that the renminbi has continued to track the US dollar and that there is little evidence of the Chinese authorities managing the renminbi with reference to a basket of currencies.12
Exchange rate changes, whether measured in bilateral and nominal terms or in real and effective terms, are of course not the only components of China’s competitiveness. Through mid-2008 the government took two other steps to reinforce the appreciation of the renminbi.
First, in a series of moves beginning in September 2006 the authorities reduced or eliminated the value-added tax (VAT) rebates paid to producers of exported goods, thus increasing the final cost of producing exports. For example, in the most comprehensive adjustment, which was announced in June 2007 and took effect July 1, the government eliminated rebates for 553 products and reduced the rate of rebate on another 2,268 products. Combined, these accounted for 37 percent of all export products.13 The
11. These calculations are based on the BIS real effective exchange rate index since the BIS provides publicly the currency weights needed for this exercise.
12. We updated that evidence by considering the relationship of the renminbi to other currencies in the reference basket. In these regressions we too found that the US dollar continues to dominate the movement of the renminbi in the post–currency reform period (July 2005–December 2008), in the sense that (1) the estimated coefficient on changes in the US dollar is the only one in the regression for changes in the renminbi that is consistently statistically significant and (2) the size of this coefficient is usually close to unity. In addition, when comparing the estimated coefficients on changes in the US dollar over time, there is no pronounced tendency for the size of that coefficient to decline during the post–currency reform period.
13. In the absence of monthly data on VAT rebates prior to 2007 it is difficult to estimate precisely the effect of cuts in VAT rebates in 2006 and 2007. For some years even the annual data can’t easily be used to measure trends in the effective rate of rebate. For example, a substantial portion of the rebates paid by the Ministry of Finance in 2006 was for payments
Peterson Institute for International Economics | www.piie.com

20 THE FUTURE OF CHINA’S EXCHANGE RATE POLICY
motivation for these adjustments varied. For example, the 553 products for which export rebates were eliminated were all judged to be very energy intensive, so lower rebates, which presumably would reduce exports and thus production, would have positive effects on the environment, a growing priority for the Chinese government.
Second, from time to time the authorities introduced changes in the ex-port processing regime that increased the costs of assembling exports from imported parts and components, thus reducing the competitiveness of these goods on international markets. In July 2007, for example, the authorities added 1,850 products to the “restricted list” for import processing.14
Despite the real trade-weighted appreciation of the renminbi, the re-duction in VAT rebate rates for a large number of export products, and the restrictions imposed on the export processing regime, over the three years following the introduction of a more flexible exchange rate, China’s global current account surplus expanded substantially (figure 1.2). It stood at $68.7 billion (3.6 percent of GDP) in 2004, but rose to $160.8 billion in 2005 (7.2 percent of GDP), $250 billion (9.4 percent of GDP) in 2006, and then $372 billion (11.0 percent of GDP) in 2007 (National Bureau of Statistics of China 2007b, 95; State Administration of Foreign Exchange, Balance of Payments Analysis Small Group 2007, 8; 2008a, 9, 11).15 By 2006 China’s absolute current account surplus was, by a wide margin, the largest of any country in the world. A surplus relative to GDP of the magnitude recorded in 2007 is “unprecedented for a country of China’s size and stage of devel-opment” (McGregor 2007).
China’s current account surplus in 2008 was $426 billion or 9.8 per-
in arrears from prior unspecified years. So comparing the average rebate rate in 2006 of 6.3 percent with the 2005 average of 6.5 percent would understate the decline. In 2007 rebates were 6 percent of the value of exports. The decline of only one-half of 1 percent over the two-year period suggests that rebate rate reductions on average raised the prices of Chinese exports only modestly. Keeping in mind that (unlike an appreciation of the currency) a downward adjustment of VAT rebate rates has no effect on the price of imports, the VAT adjustments in 2006 and 2007 would have an effect on China’s trade balance similar to a renminbi appreciation of only 0.25 percent.
14. This meant that firms importing parts and components to be assembled into exports could no longer import the items free of both import duties and VAT. Rather, firms had to deposit with the government an amount equal to half of the import duties and VAT, with these amounts to be refunded when the related final goods are exported. Some firms had to deposit amounts equal to the full amount of the import duties and VAT. The government estimated that the July 2007 expansion of the list would cost export processing firms RMB600 million, an amount equal to 2 percent of the value of the processed exports affected by the new restrictions (Shi Lu 2007).
15. Again, if one goes back to 2001, the expansion of China’s global current account surplus is much larger, as it was then only 1.3 percent of GDP. The 11.0 percent figure for 2007 is calculated based on the upward revision of China’s 2007 GDP, announced by the authorities on January 14, 2009. Prior to this revision the current account surplus in 2007 was 11.3 percent of GDP.
Peterson Institute for International Economics | www.piie.com

EVOLUTION OF CHINA’S EXCHANGE RATE REGIME IN THE REFORM ERA 21
cent of the preliminary GDP figure announced by the authorities in Janu-ary 2009 (State Administration of Foreign Exchange, Balance of Payments Analysis Small Group 2009, 10). The increase of about $54 billion com-pared with 2007 was primarily due to the increase in the trade surplus.16 Surpluses in investment income and current transfers were up moderately and the deficit in services increased slightly.
The buildup of official holdings of foreign exchange reserves also has accelerated in the first three years of the new foreign exchange regime.17 In the two 12-month periods through June 2005 and June 2006 reserves rose by $240 billion and $230 billion, respectively. Thus, despite the official statement in July 2005 that the value of the renminbi increasingly would be determined by supply and demand in the market, the pace of official intervention in the foreign exchange market in the first year of the new foreign exchange regime was little changed from the last year of the old regime. Moreover, subsequent government intervention in the market increased sharply. In the 12-month periods through June 2007 and June 2008, reserves rose by $391 billion and $476 billion, respectively, about 60 and 100 percent more, respectively, than in the previous two 12-month periods. Total reserves reached $1,809 billion at the end of June 2008 and $1,946 billion at the end of 2008 (People’s Bank of China 2008, 2009).
Figure 1.3 shows the buildup of reserves on a calendar-year basis, starting in 2001. China’s exchange market intervention as a share of GDP was modest in the early years of the decade but then expanded significantly, averaging almost 10 percent of GDP during 2004–06. Reserve buildup reached a peak of almost 14 percent of GDP in 2007 and then declined both
16. The goods surplus reported by the Ministry of Trade in 2008 was $295 billion, an increase of 12.5 percent over 2007. When converted to a balance of payments basis, in which imports are measured on a free-on-board basis, the goods surplus was $361 billion, up from $315 billion in 2007.
17. Increases in reported official holdings of foreign exchange reserves are a downward-biased estimate of the magnitude of official intervention in the foreign exchange market because periodically portions of these funds have been transferred or redeployed to other uses. For example, through the end of 2006 the central government transferred $66.4 billion in official foreign exchange reserves from the State Administration of Foreign Exchange (SAFE) to Central Huijin Investment Limited (commonly referred to as Central Huijin) (Kroeber 2007). Central Huijin used the funds to recapitalize four banks, three securities firms, and one insurance company. In 2007 the government created the China Investment Corporation (CIC) as a specialized investment vehicle. It received $200 billion from China’s foreign exchange reserves, about a third of which was used to acquire the assets of Central Huijin. SAFE also periodically has engaged in foreign exchange swap transactions with state-owned commercial banks, and these swaps have removed large amounts of foreign exchange from official reserves. Finally, since August 2007, when the central bank has raised the required reserve ratio, it has required China’s largest banks to deposit their additional reserves with the central bank in foreign exchange. That means the foreign exchange is still on the central bank’s balance sheet but is listed as a liability to banks rather than as official foreign exchange reserves.
Peterson Institute for International Economics | www.piie.com

22 THE FUTURE OF CHINA’S EXCHANGE RATE POLICY
absolutely and as a share of GDP in 2008. Figure 1.4 shows the monthly change in China’s foreign exchange reserves from 2001 through 2008. Again, the strong upward trend in China’s exchange market intervention is readily apparent, but so too is the fact that there is considerable month-to-month variation in this intervention activity. Also, it is worth noting that exchange market intervention fell off sharply in the final quarter of 2008; Stephen Green (2009) believes that this drop-off may be due to a combination of large short-term capital outflows, disruptions in trade financing, and possibly other transitory factors, suggesting that reserve buildup in 2009 might increase from the low levels observed in late 2008.
Some have claimed that the buildup of official holdings of foreign exchange reserves does not necessarily reflect an undervalued currency because it results primarily from capital account rather than current account transactions (Fang Xinghai 2005). This argument is not a persuasive explanation of the reserve buildup reflected in figure 1.3. It is true that the relative importance of the contributions of the current and capital accounts, respectively, to the reserve buildup has varied in recent years. In 2004, the capital account surplus was more than half again as large as the current account surplus and thus accounted for most of the reserve buildup. In 2005, however, the current account surplus was 2½
Figure 1.3 Change in foreign exchange reserves, 2001–08
Note: The bars show additions to the foreign exchange reserves in billions of dollars (left axis) and the line tracks additions to reserves as percent of GDP (right axis).
Sources: State Administration of Foreign Exchange, www.safe.gov.cn; ISI Emerging Markets, CEIC Database.
billions of US dollars
600
500
400
300
200
100
0
percent
16
14
12
10
8
6
4
2
02001 2002 2003 2004 2005 2006 2007 2008
Peterson Institute for International Economics | www.piie.com

EVOLU
TION
OF CH
INA’S EXCH
AN
GE RATE REG
IME IN
THE REFO
RM ERA
2
3
Figure 1.4 Monthly changes in foreign exchange reserves, 2001–08
billions of US dollars
Sources: State Administration of Foreign Exchange, www.safe.gov.cn; ISI Emerging Markets, CEIC Database.
80
60
40
20
0
–20
–402001 2002 2003 2004 2005 2006 2007 2008
Peterson Institute for International E
conomics | w
ww
.piie.com

24 THE FUTURE OF CHINA’S EXCHANGE RATE POLICY
times the capital account surplus (National Bureau of Statistics of China 2007b, 95), and by 2006 it was 25 times the capital account surplus and thus accounted for virtually the entire reserve buildup (State Administration of Foreign Exchange, Balance of Payments Analysis Small Group 2007).18 In 2007 the trend was reversed with the capital account surplus growing slightly to become the equivalent of a fifth of the current account surplus (State Administration of Foreign Exchange, Balance of Payments Analysis Small Group 2008a, 9). Thus the vast buildup of China’s foreign exchange reserves since 2004 is explained overwhelmingly by current account rather than capital account surpluses.
To sum up, China’s management of its foreign exchange regime in the 1980s and 1990s is one of the least heralded economic successes of the reform period. The old regime, with its highly overvalued exchange rate and rigid exchange controls, was part and parcel of the economic plan-ning system initially adopted in the 1950s. The handful of state trading companies, with their separate monopolies on imports and exports of well-defined commodity categories, could use their profits on the sale of imports to subsidize their losses on export transactions. But this cumber-some system was entirely unsuited to the more decentralized trading sys-tem the authorities began to introduce as early as 1979. Through a series of gradual steps between 1980 and 1995 the authorities devalued the curren-cy by about 70 percent in real effective terms (Lardy 2002, 49) and by the mid-1990s had eliminated almost all exchange controls on trade transac-tions for domestic firms. These and other developments strongly suggest that by the mid-1990s the official exchange rate reached what could be regarded as an equilibrium level. This appears to have been confirmed in late 1998 when the authorities eliminated all remaining controls on foreign exchange for current account transactions of foreign-invested enterprises and came fully into compliance with the IMF Article VIII requirement on current account convertibility.
Perhaps through serendipity the fixed exchange rate regime that China adopted in the mid-1990s worked reasonably well for a number of years. Given the combination of the rigid peg of the renminbi to the US dollar and dollar appreciation, the renminbi on a real effective basis appreciated gradually from 1994 through much of 2001, apparently just offsetting differential productivity growth in the export sector. As a result China’s average current account surplus was quite moderate.
But when the US dollar began to depreciate after February 2002, a nominal fixed exchange rate vis-à-vis the dollar took China on a very dif-ferent path. As shown in figure 1.5, throughout 2002–04 China’s currency depreciated on a real trade-weighted basis. Figure 1.5 also shows a simple extrapolation, through 2008, of the pace of real effective appreciation from
18. The capital account surplus was $10 billion and errors and omissions reflected an unrecorded outflow of $13 billion.
Peterson Institute for International Economics | www.piie.com

EVOLU
TION
OF CH
INA’S EXCH
AN
GE RATE REG
IME IN
THE REFO
RM ERA
2
5
Figure 1.5 Undervaluation of the renminbi, 1995–2008
June 1995=100
Source: JPMorgan, Real Broad Effective Exchange Rate Indices.
170
160
150
140
130
120
110
100
90
80
Real effective exchange rate
Estimated equilibrium exchange rate
Dec
embe
r 199
5
June
1995
Dec
embe
r 199
6
June
1996
Dec
embe
r 199
7
June
1997
Dec
embe
r 199
8
June
1998
Dec
embe
r 199
9
June
1999
Dec
embe
r 200
0
June
2000
Dec
embe
r 200
1
June
2001
Dec
embe
r 200
2
June
2002
Dec
embe
r 200
3
June
2003
Dec
embe
r 200
4
June
2004
Dec
embe
r 200
5
June
2005
Dec
embe
r 200
6
June
2006
Dec
embe
r 200
7
June
2007
Dec
embe
r 200
8
June
2008
June 2005 undervaluation, 23%
December 2008 undervaluation, 19%
Peterson Institute for International E
conomics | w
ww
.piie.com

26 THE FUTURE OF CHINA’S EXCHANGE RATE POLICY
the mid-1990s through 2001. On the assumption that productivity growth in China’s export sector from 2002 through 2008 was little changed from the pace from the mid-1990s through 2001, this is an approximation of the real equilibrium exchange rate.19 The gap between the two lines in the figure is an estimate of the undervaluation of the currency, which made Chinese goods ever more competitive in international markets.20
In short, after 2001 China’s currency became increasingly undervalued and thus its trade and current account surpluses began to soar. Although the authorities abandoned their “automatic pilot” approach to exchange rate policy in July 2005, figure 1.5 suggests that the pace of exchange rate adjustment initially was far too cautious. The estimated degree of un-dervaluation in mid-July 2005 was 23 percent. The initial appreciation of 2.1 percent and subsequent appreciation through the end of 2005 reduced the degree of undervaluation slightly, but the pace of real appreciation slowed dramatically in 2006 and 2007, widening the degree of undervalu-ation to 26 percent by November 2007. Thus China’s trade and current account surpluses continued to expand and foreign exchange reserves skyrocketed to levels unprecedented for any country. These developments posed a series of policy challenges that are the subject of the next chapter.
19. Note that the estimate of the real equilibrium exchange rate reflected in figure 1.5 is not the rate that would be expected to lead to a zero current account position but rather the rate that would lead to the average current account position in the base period 1995–2001, which was a surplus of 1.9 percent of GDP.
20. Drawing on the pioneering work of Balassa (1964) and Samuelson (1964), Mussa (2008) concluded that the long-term equilibrium path for China’s real exchange rate has a moderate upward tilt of about 2 percent per year. Like the results portrayed in figure 1.5, this exercise yields the conclusion that the renminbi became increasingly undervalued after 2001. In chapter 2 we present other estimates of the equilibrium exchange rate for the renminbi based on the proposition that the equilibrium rate would provide “balance” in the country’s balance of payments, and especially in the current account.
Peterson Institute for International Economics | www.piie.com