preventing obesity among rural children: why...
TRANSCRIPT

Preventing Obesity Among Rural Children: Why Changing the Context is Key
Deborah H. John, PhD, Katherine B. Gunter, PhD, FACSM, Jenny Jackson, MS, RD College of Public Health and Human Sciences
Kathy Gunter, Core Director, Healthy Lifestyles and Obesity Prevention, Moderator
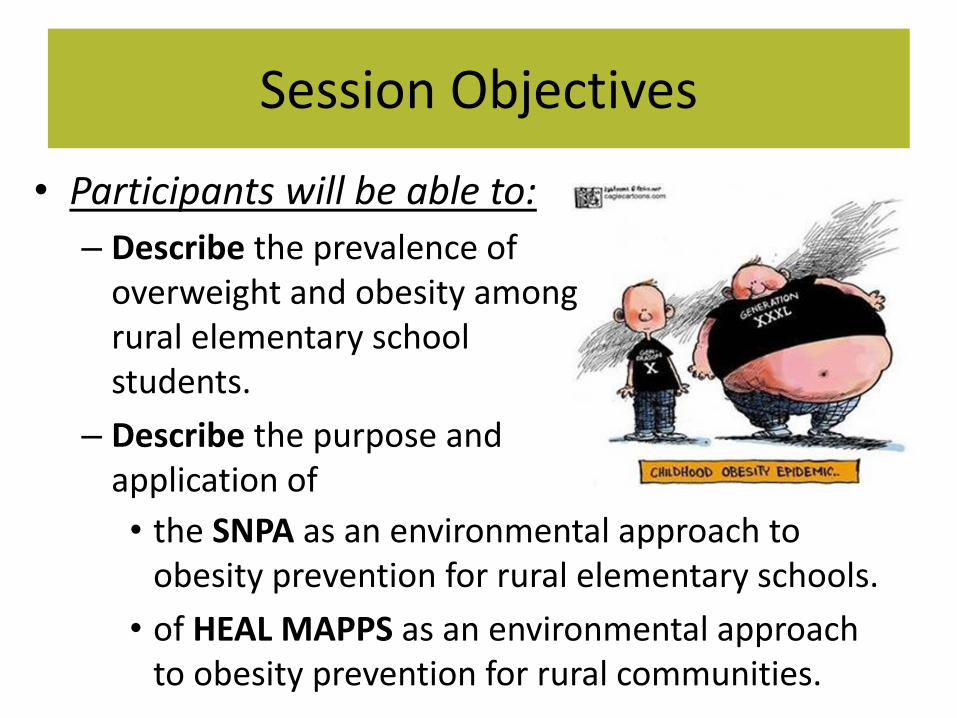
Session Objectives
• the SNPA as an environmental approach to obesity prevention for rural elementary schools.
• of HEAL MAPPS as an environmental approach to obesity prevention for rural communities.
• Participants will be able to:
– Describe the prevalence of overweight and obesity among rural elementary school students.
– Describe the purpose and application of

GROW HKC Specific Aims
• Our aim is to plan, implement, and evaluate a multi-level intervention targeting rural home, school, and community behavioral settings to promote Healthy Eating and increase Physical Activity, and thus improve weight status among rural children.

Promoting Environments that Support Obesity Preventing Behaviors
• Reducing obesity prevalence is dependent upon the extent to which obesity-preventing lifestyles can be adopted and sustained.
• Rural children, families and communities face unique challenges.
• Data support multi-level efforts as “best practice”

Intervention Design
Columbia Clackamas Klamath Condition
Intervention
Control
R
• All communities are low income – defined by elementary schools with >
50% of student population eligible for free/reduced meals
• Intervention efforts directed toward: – Community, School, Family Home
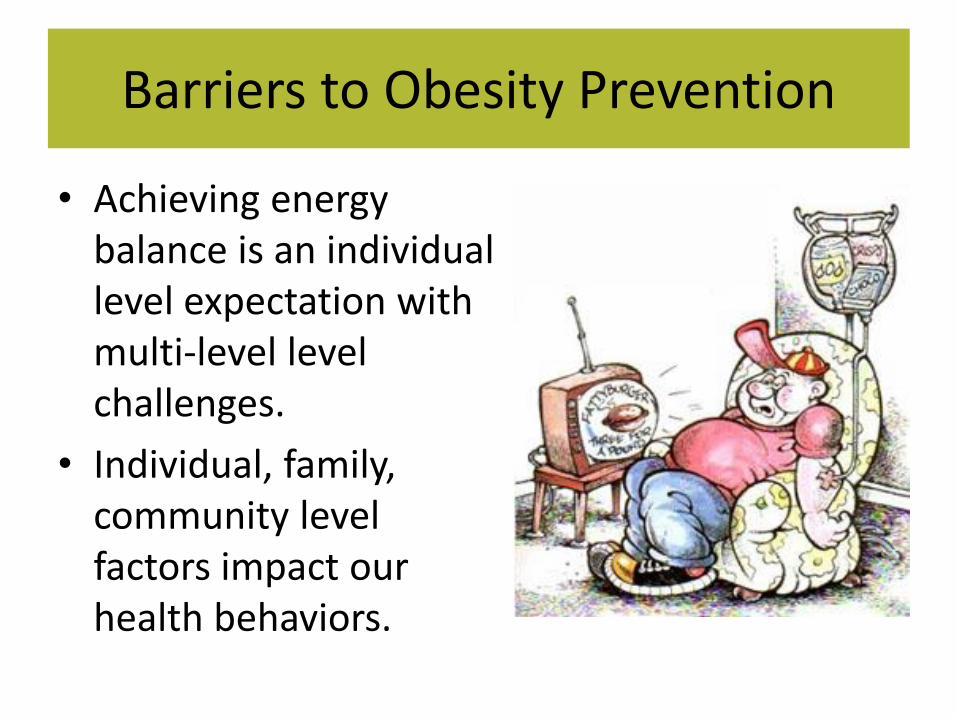
Barriers to Obesity Prevention
• Achieving energy balance is an individual level expectation with multi-level level challenges.
• Individual, family, community level factors impact our health behaviors.

% OBESE OR UNDER WT
Factors Influencing Obesity Prevalence
Globalization of Markets
Development
Media Advertising
International Factors
Urbanization
Media & Culture
Education
Health
Social Security
Food & Nutrition
Transportation
National/Regional Factors
Public Safety
Rural Food System
Local Agriculture/
Markets
Health Care
Sanitation
Rural Built Activity
Environment
Local Public Transit/Active Transportation
Community Factors
Local Environment Factors
Labor Influences
Family and Home Food
and PA
School Food and PA
Institutional Health
Workplace Food and PA
Leisure Activities and
Facilities
Population Weight
Image adapted from Kumanyika S K et al. Circulation 2008;118:428-464
Individual Factors
Energy Expenditure
Energy Intake Family and
Home Food and PA
School Food and PA
Community Factors

It takes a village to change behavior….
• Promoting PA
• Promoting HE
• Sectors of Influence
– Community
• Private
• Public
– Schools
– Family Homes
Positive efforts in one environment (e.g. schools) can be undone if other environments (home) do not promote opportunities for PA or HE or demonstrate value toward PA and HE.

Obesity Prevalence in GROW Rural Schools

Overweight and Obesity Definitions
• Adults, 20+ years: BMI Underweight: BMI < 18.5 kg/m2
Healthy: 18.5-24.9 kg/m2
Overweight: 25-29.9 kg/m2
Obese = > 30 kg/m2
• Children and adolescents, 2-19 years: BMI
Underweight: < 5th %ile
Healthy: 5th%ile - < 85th %ile
Overweight: > 85th < 95th %tile
Obese: > 95th %tile
Obese
Over-Weight
Healthy Weight
Under-Weight

Obesity Trends Among U.S. Children
12%
18%
SOURCE: CDC/NCHS, Health, United States, 2012. Data from the National Health and Nutrition Examination Survey (NHANES).

Height-Weight Assessment
• Height and weight assessments were conducted during the 2012-2013 school-year in six rural elementary schools.
• Assessments were conducted by research staff in partnership with Extension Field faculty and school volunteers.

Baseline Prevalence of Overweight and Obesity by Gender (n=2068)

All GROW Schools, Prevalence of Overweight or Obese, by Grade and Sex
0%
5%
10%
15%
20%
25%
30%
35%
40%
45%
50%
K 1 2 3 4 5 6
Pe
rce
nt
Grade Level
Boys (All Schools)
Girls (All Schoolsl)
P=0.011 P=0.001
31
39 40
44
n=1151
n=917
P=0.02
Prevalence among US Children ages 6-11 is 32.6%

All GROW Schools, Prevalence of Obese, by Grade and Sex
0%
5%
10%
15%
20%
25%
30%
K 1 2 3 4 5 6
Pe
rce
nt
Grade Level
Boys (All Schools)
Girls (All Schoolsl)
P<0.001
P=0.027
P=0.002
13
19
22
25
23
n=1151
n=917
P=0.001
Prevalence among US Children ages 6-11 is 18%
Environmental Assessment in GROW Schools: SNPA

Promoting Healthy Schools
• Schools are critically important environments that have significant impact on children’s health behaviors.
• In the past decade, schools have made improvements in nutrition and physical activity policies and practices; however, there remains room for improvement.
IOM. 2012. Accelerating Progress in Obesity Prevention: Solving the Weight of the Nation. CDC. 2013. Results from the School Health Policies and Practices Study 2012 .

School Nutrition and Physical Activity (SNPA)
Environmental Assessment Tool
Developed to: – Address gaps in
existing assessment tools
– Assess attributes of the school environment
– Align ‘best practice’ strategies for change with school-driven actions
Adapted from Maibach et al, BMC Public Health. 2007; 7: 88.

SNPA Model
• Physical Activity (N=16), e.g. – Indoor PA/Activity Space – Fixed Outdoor Features/Space – Garden Features – Natural Features – Neighborhood Features – Movement Opportunities – Portable Equipment – Atmosphere/Ambiance – PA & Wellness Policy – Structured Physical Education
• Nutrition (N=11), e.g. – Safe & Adequate Meal Service Area – School Meals – Healthy Food & Beverage Practices – Promoting Water Consumption – Nutrition & Wellness Policy – Health & Nutrition Education – Before/After School & Summer Programs
Each item is scored and the tool provides a baseline measure that is sensitive to change.
The SNPA also works as an intervention strategy identifying areas of “opportunity” to
improve the SNPA environment.

Applications 1) Assess school resources and
readiness to implement environmentally-focused interventions
2) Plan and implement partnerships, programs, and policies to change school contexts
3) Evaluate effectiveness of school-level efforts to increase resources and improve practices that support students’ nutrition and physical activity

Utility: Data Sources, Informants, and Criteria
Assess & mark each criteria using [-] for does not meet and [■] for meets all elements of the criteria description.
PE Teacher 10:30
■ --
■
O

22
Scoring the SNPA
< 25% 26 < 50% 51 < 75% 76 < 100% > 100%
LEVEL 1 Poor Practice
LEVEL 2 Fair Practice
LEVEL 3 Good Practice
LEVEL 4 Best Practice
LEVEL 5 Better than Best
1. Each Area of Interest is scored by: # criteria met/# criteria available = % met 2. Categorical scores may be calculated in the following environmental domains:
• Physical Activity • Physical • Nutrition • Situational • Policy
3. Overall SNPA score (# criteria met/# criteria available = % met)

GROW Schools Baseline SNPA Environmental Assessment
• SNPA assessments were conducted in 6 rural elementary schools between January-February, 2013.
• For each school, the SNPA was completed by two trained Extension Field Faculty in partnership with school staff.

Results: Descriptive Characteristics
Characteristic County 1 County 2 County 3 School 1 2 3 4 5 6
Student enrollment 553 441 494 363 182 176 Eligible (%) for free/reduced meals 69.8 67.8 57.3 61.7 77.5 94.3 Race/Ethnicity (%) White 80.7 63.5 92.3 82.4 65.9 36.4
Other
8.3
3.6
4.5
9.9 10.5 57.9
Hispanic
11.0 32.9
3.2
7.7 23.6
5.7

GROW HKC Schools - Baseline SNPA, Physical Activity, and Nutrition Scores
1.00
1.50
2.00
2.50
3.00
3.50
4.00
4.50
5.00
1 2 3 4 5 6
SNPA
Sco
re
Schools SNPA Physical Activity Nutrition
CON CON INT INT INT
Meets Best Practice
CON

GROW HKC Schools - Baseline Nutrition Environments
1.00
1.50
2.00
2.50
3.00
3.50
4.00
4.50
5.00
1 2 3 4 5 6
SNPA
Sco
re
Schools Physical Environment
Situational Environment
Policy Environment
CON INT INT INT CON CON
Meets Best Practice

GROW HKC Schools - Baseline Physical Activity Environments
1.00
1.50
2.00
2.50
3.00
3.50
4.00
4.50
5.00
1 2 3 4 5 6
SNPA
Sco
re
Schools Physical Environment
Situational Environment
Policy Environment
CON CON CON INT INT INT
Meets Best Practice
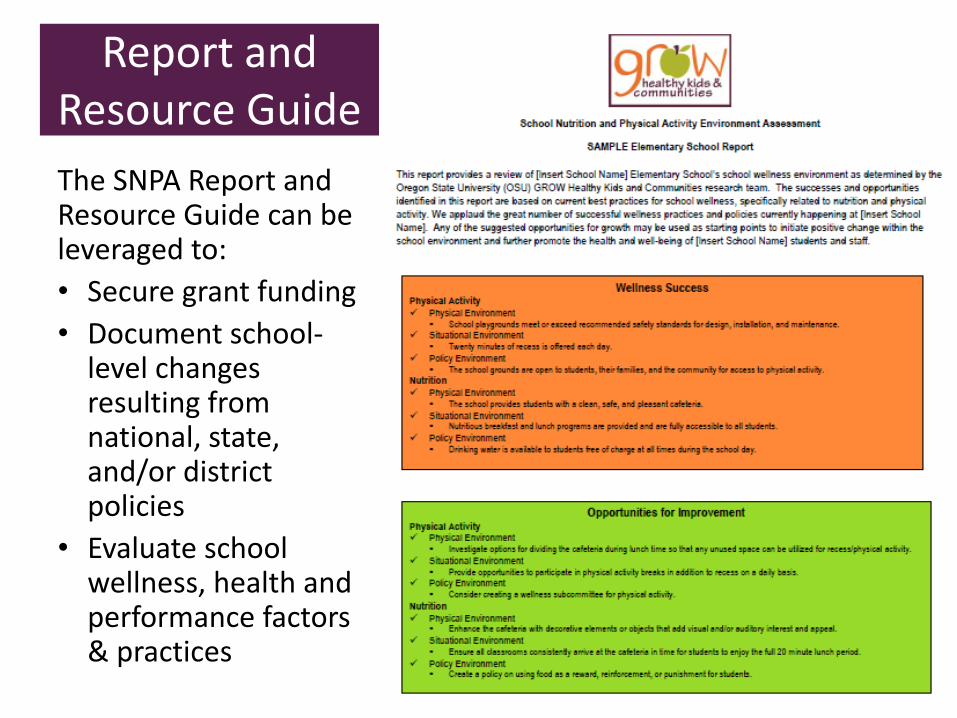
Report and Resource Guide
The SNPA Report and Resource Guide can be leveraged to:
• Secure grant funding
• Document school-level changes resulting from national, state, and/or district policies
• Evaluate school wellness, health and performance factors & practices

Participatory Environmental Assessment in GROW Communities:
HEAL MAPPS™

Childhood Obesity: Place Matters
• Rural residency increases the risk of childhood overweight and obesity • Rural Healthy People 2010
• Odds of obesity as much as 50% higher among rural elementary school children • McMurray et al., J Rural
Health, 1999
• Why?
High poverty
Lack of active transportation
Lack of health services
Geographic isolation
Fewer school and community physical activity opportunities
Compromised rural landscapes
Types, availability and cost of food
Distance to recreation
Safety
Boehmer et al., Am J Health Promot., 2009 Hennessy et al., Am. J. Prev. Med., 2010

Promoting Healthy Communities
Community-Engaged Assessment
Community-Engaged Research Model
HEAL
MAPPS
&
R-CFPA
• Mobilize and involve local people – the ‘true’ experts
• Train community residents to use our CBPR tools to
• Assess environmental features of their rural community that support nutrition and physical activity behaviors and habits
Community-Driven Planning and Intervention for Change • Improve community readiness
• Improve community attributes

Community-Engaged Assessments
Columbia Clackamas Klamath Condition
Intervention Community
Control Community
HEAL MAPPS™ Assessment Fall 2012 (Intervention) - Spring 2013 (Control)
Rural Residents’ Experience of Community Resources
*Rural Residents’ Photomap Audit of Community Resources added Summer 2013

Healthy Eating Active Living: Mapping Attributes using Participatory
Photographic Surveys
HEAL MAPPS™ CBPR Tools
Actual Toolkit

STEP ONE: Participatory photomapping
October 22, 2013
34
Community members are provided MAPPS equipment and
trained to use tools to map features of their community
On their own or with a partner,
they photograph (and map)
their direct experiences with
the food and physical activity
environment in the community
They record their
experiences of the
community features along
their route on their route
journal.
HEAL MAPPS™ Oregon – Community
11/2/2012
using camera-enabled GPS

October 22, 2013
35
Community MAPPers use GPS cameras to photograph features…

October 22, 2013
36
Community MAPPers use GPS to map routes…
HEAL MAPPS Routes and Photographs …tell a story of how people navigate the food and
physical activity features of their rural place

HEAL MAPPS™ Route Journal…documents one’s personal experience of each photographed feature
October 22, 2013
37
Bike path X Safe route for children to
bike to school
STEP TWO: MAPPers participate in a focus group to select and organize photographs for their community’s conversation…

STEP TWO: Focusing the group’s decisions…
• Focus group participants view and discuss all photos from all routes to determine the best 30-40 photos that represent the community’s food and physical activity attributes
• Next step – Community Conversation!
October 22, 2013
38

Polling opinions and discussing options – where personal experience informs public interests
• Does the feature in the photo make it easy or hard for a member of your community to eat healthy or be physically active? • Audience is polled and results are displayed
• Tell me more about this feature – who uses this feature – would every community member have the same experience? • The narrative is transcribed verbatim and
becomes a source of data for the community report
October 22, 2013
39 STEP THREE: Community Conversation

STEP FOUR: HEAL MAPPS™ Data and Reports…
• Data analyzed at local level are provided to participating communities as HEAL MAPPS Community Report
Oregon Rural Communities
HEAL MAPPS ™ Participants
Routes Mapped
Attributes Photographed
Reports Disseminated
6 228 54 690 6
• Community data are aggregated at the county and state level and analyzed to inform an Oregon model of rural obesity prevention

Rural Oregonians’ Experiences of Community Resources
• Qualitative data iteratively coded into categories aligning with dimensions of community readiness: – Efforts (CR)
• Support (Make EASY) • Barrier (Make HARD) • EITHER/BOTH
– Knowledge of Efforts (CR) – Leadership (CR) – Community Climate (CR) – Knowledge of Issue (CR) – BE Resources (CR)
• Nutrition • Physical Activity
Funding for
programs
Local grocery/ farmers market
Traffic safety/ calming
Bike lanes/ sidewalks/shoulders
Destination proximity
Parks/ Recreation areas
Land use/
joint use agreements Public transit
City/county
rules/regulations
Vagrancy
Crime/
drugs
Building
vacancies
Local
culture
Garbage/
Vandalism
Maintenance/
upkeep
Indoor PA facilities
Playgrounds/
sport fields
Parking/
signage
Food pantry/
assistance
School meals
Garden/local agriculture
Eateries
Community center
Convenience/
Quality/Cost

Rural Oregonians’ Perceptions of Community Readiness
Community Readiness Scoring Scale
2.9
4.3
M = 3.4 1. Edwards et al., J. Community Psychol., 2000
To assess the perceived resources and readiness of rural communities to affect positive community change, we applied the community
readiness model1 to qualitative data collected during HEAL MAPPS™ community conversations.
Generally, communities ranged from “vague awareness” to “pre-planning” indicating a need to increase (1) awareness that communities can and (2) knowledge of how to
affect change

Conclusions from baseline assessments…
Rural Children • Overweight and obesity prevails among
K-6 grade students and follows an upward trend beginning ~ grade 3
Rural Schools • Poised to improve environments to
support weight-healthy behaviors • Need resources to address the areas of
improvement identified by the SNPA assessment
Rural Communities • Vary in availability and accessibility of
affordable resources to make easy weight-healthy behaviors for all children and families
• Vary in stages and dimensions of readiness to take action to improve obesogenic context identified by HEAL MAPPS™ assessment

Grow HKC Research Team
• Principal Researchers – Deborah John, PhD – Kathy Gunter, PhD
• Co-Researchers – Melinda Manore, PhD, RD – Gail Langellotto, PhD – Lena Etuk, MS
• Research Assistants – Patrick Abi Nader, Alinna Ghavami,
John Hicks, Jenny Jackson, Brendan Klein
• County Extension Educators/Research Staff – Beret Halverson, Jenny Rudolph, Patty Case,
Erin Devlin, Liana Harden, Laurie Wayne
http://extension.oregonstate.edu/growhkc/about
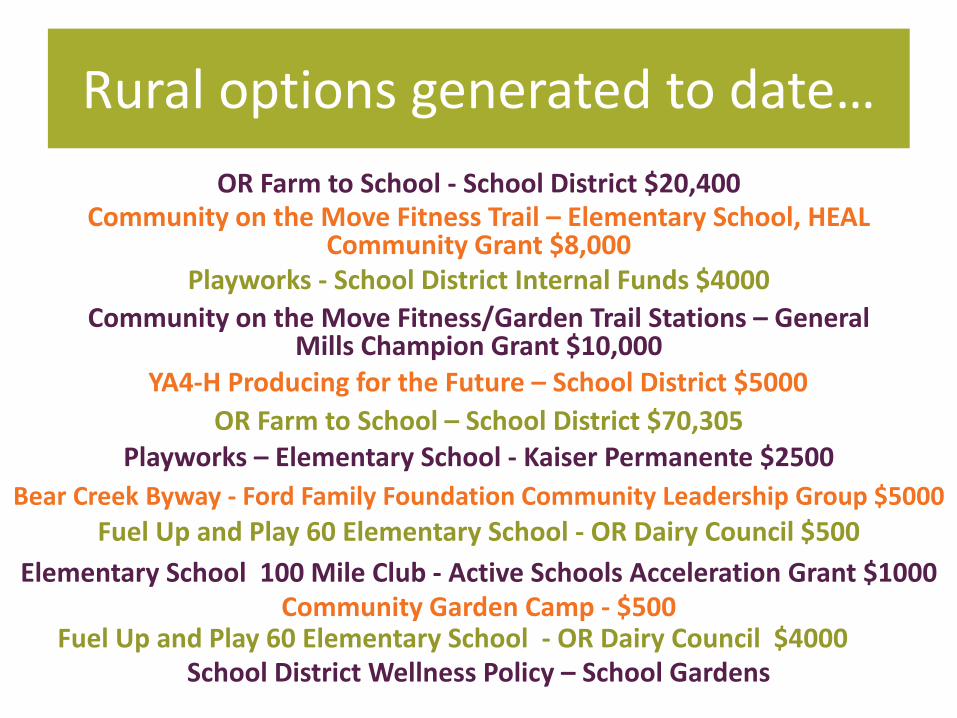
Community on the Move Fitness Trail – Elementary School, HEAL Community Grant $8,000
Rural options generated to date…
OR Farm to School - School District $20,400
Community on the Move Fitness/Garden Trail Stations – General Mills Champion Grant $10,000
YA4-H Producing for the Future – School District $5000
Playworks - School District Internal Funds $4000
OR Farm to School – School District $70,305 Playworks – Elementary School - Kaiser Permanente $2500
Fuel Up and Play 60 Elementary School - OR Dairy Council $500
Elementary School 100 Mile Club - Active Schools Acceleration Grant $1000 Community Garden Camp - $500
Fuel Up and Play 60 Elementary School - OR Dairy Council $4000
School District Wellness Policy – School Gardens
Bear Creek Byway - Ford Family Foundation Community Leadership Group $5000
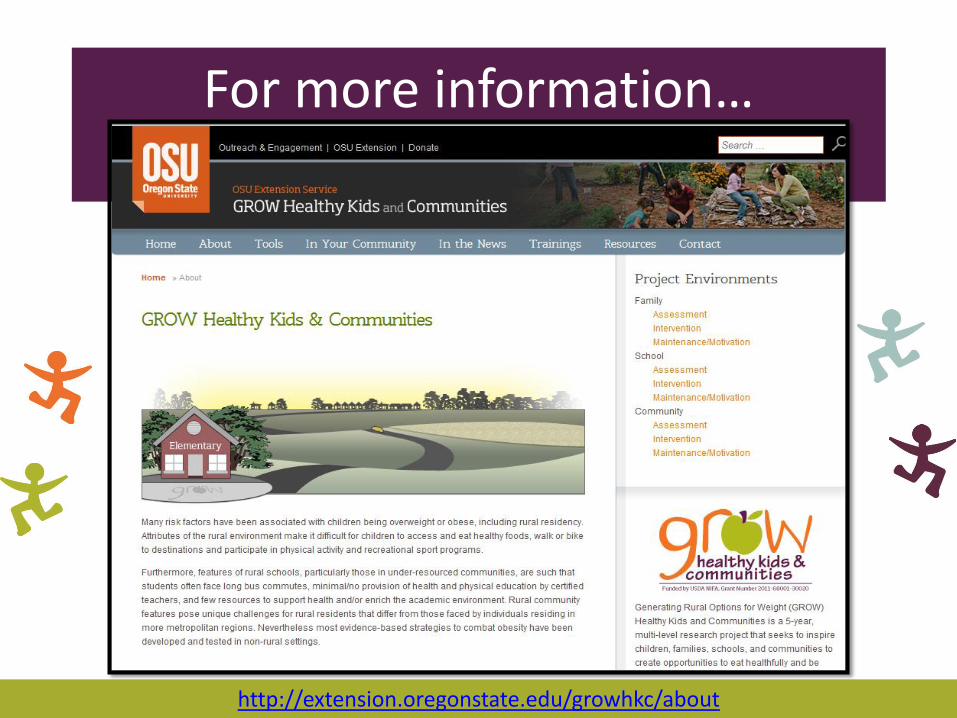
For more information…
http://extension.oregonstate.edu/growhkc/about