preventing falls in older people 2008
TRANSCRIPT

7/22/2019 Preventing Falls in Older People 2008
http://slidepdf.com/reader/full/preventing-falls-in-older-people-2008 1/240
PREVENTING FALLS IN OLDER PEOPLE
Simon Paul Conroy MB ChB MRCP
A thesis submitted in partial fulfilment of the requirements
for the degree of Doctor of Philosophy
December 2008, revised February 2009

7/22/2019 Preventing Falls in Older People 2008
http://slidepdf.com/reader/full/preventing-falls-in-older-people-2008 2/240
2
UNIVERSITY OF NOTTINGHAM
ABSTRACT
Preventing falls in older people
Simon Conroy
Falls are a major cause of injury fear of falling and death affecting 24% of
older people annually. Falls have a major impact on hospital services, and
are an important cause of carer strain and admission to long term care.
Multifactorial interventions delivered to fallers are effective in reducing falls
rates by 25%. However, no UK studies have evaluated the role of
screening older people living in the primary care setting and offering those
at high risk a falls prevention programme. This work describes two studies
– the evaluation of a postal falls risk screening tool, and a randomised
controlled trial assessing the benefits of offering a falls prevention
programme to those identified as being at high risk.
335 older people were recruited into the screening study, using a modified
version of the Falls Risk Assessment Tool. The sensitivity was 79%,
specificity 58%, positive predictive value 50% and the negative predictive
value 83%.
In the RCT, 364 community-dwelling older people at high risk of falls were
randomised into a pragmatic, multicentre trial evaluating falls prevention
programmes. 181 were allocated to the control group and 183 to the
intervention.
The primary outcome was the rate of falls; the adjusted IRR was 0.73
(0.51-1.03), p=0.071. There were no significant differences between the
groups in terms of the proportion of fallers, recurrent fallers, medically
verified falls, injurious falls, time to first fall or time to second fall. Nor

7/22/2019 Preventing Falls in Older People 2008
http://slidepdf.com/reader/full/preventing-falls-in-older-people-2008 3/240
were there significant differences in terms of institutionalisation, mortality,
basic or extended activities of daily living, or fear of falling.
Further work on the acceptability and implementation of falls prevention
interventions is required, but subject to these conditions being met and a
supportive cost-effectiveness analysis, the totality of the evidence suggests
that screening and intervening for individuals at high risk of fall may be
effective.

7/22/2019 Preventing Falls in Older People 2008
http://slidepdf.com/reader/full/preventing-falls-in-older-people-2008 4/240
4
ACKNOWLEDGMENTS
There are many people who have helped and supported me during the time
I have been working on this thesis. It would be imprudent not to mention
first and foremost my long suffering family – Marie-Hélène, Océane, Iléana
and Amaël, without whose support none of this would have been possible.
To the two angels sitting in my shoulders, John Gladman and Denise
Kendrick, thank you for your support and patient guidance, especially
Denise in such difficult times.
Someone had to do all of the work, so a huge thank you to Rachael Taylor
and Judi Edmans who did such a fantastic job recruiting and retaining the
many hundreds of participants, not to mention contacting the many
thousands who did not participate. Thank you for the laughter and smiles
when it was all getting a bit tough. No more chocolate thank you Rachael…
To Tash Masud and Rowan Harwood, the instigators and supporters of this
study, my heartfelt thanks and gratitude. Also to all of the other study
team members who made the study possible: Dr Carol Coupland, Dr Avril
Drummond, Dr Tracey Sach, Dr Pradeep Kumar, Dr Rob Morris and Dr Jane
Youde. A huge thank you to the study participants for their good humoured
participation and extraordinarily good diary completion. Also to all of the
day hospital staff and general practice staff without whose cooperation the
study would not have happened. A big thank you to all of those in the
Division of Rehabilitation and Ageing in Nottingham – long live geriatrics!
Last, but not least, a big thank you to our funders: Nottinghamshire,
Derbyshire and Lincolnshire research alliance, Research into Ageing and
the British Geriatrics Society and the Special Trustees of Nottingham
University Hospital NHS trust.

7/22/2019 Preventing Falls in Older People 2008
http://slidepdf.com/reader/full/preventing-falls-in-older-people-2008 5/240
5
TABLE OF CONTENTS
1 BACKGROUND AND LITERATURE REVIEW................................. 10 1.1 General overview: falls in older people 10 1.2 Epidemiology 10 1.3 The impact of falls 20
1.3.1 Fear of falling 20 1.3.2 Falls and depression 22 1.3.3 Fall related injuries 23 1.3.4 Falls and mortality 24 1.3.5 The impact of falls on hospital services 24 1.3.6 Falls and carer strain 26 1.3.7 Falls and admission to long term care 27 1.3.8 Falls risk factors 28 1.3.9 Falls screening tools 32
1.4 Why do people fall? 41 1.5 Interventions to prevent/reduce falls 42
1.5.1 Compliance 44 1.5.2 Published work on falls prevention since the 2003 NICE
guidelines 46 1.6 Setting for interventions 52 1.7 Summary of the literature review 53 1.8 Research questions 54 1.9 Overview 54 2 SCREENING .............................................................................. 56 2.1 Definitions 56 2.2 Criteria for a successful screening programme 58
2.2.1 The condition should be an important public health problem 59 2.2.2 There should be an accepted treatment 59 2.2.3 Facilities for diagnosis and treatment should be available 59 2.2.4 There should be a recognisable latent stage 60 2.2.5 The natural history of the condition should be understood 60 2.2.6 There should be a suitable and acceptable test 60 2.2.7 There should be an agreed policy on whom to treat 61 2.2.8 The cost of case-finding should be economically balanced 61 2.2.9 Case-finding should be a continuing process 61 2.2.10 Summary 61
2.3 Benefits and adverse effects of screening 62 2.4 Screening terminology 62
7/22/2019 Preventing Falls in Older People 2008
http://slidepdf.com/reader/full/preventing-falls-in-older-people-2008 6/240
6
2.4.1 Prevalence and incidence 62 2.4.2 Measures of effect and impact on populations 64 2.4.3 Sensitivity and specificity 65
2.5 Development of a screening tool 66 2.5.1 Developing an item pool 67 2.5.2 Validity 67 2.5.3 Reliability 70 2.5.4 Development of the screening tool 70
2.6 Evaluation of a falls screening tool - methods 77 2.6.1 Study design 77 2.6.2 Population, inclusion and exclusion criteria 78 2.6.3 Recruitment of individual participants 79 2.6.4 Outcomes 81 2.6.5 Sample size 82 2.6.6 Analyses 83
2.7 Evaluation of a falls screening tool - results 86 2.7.1 Recruitment 86 2.7.2 Data cleaning 89 2.7.3 Data available for analysis 90 2.7.4 Baseline characteristics 90 2.7.5 Describing the occurrence of falls 91
2.7.6 Predictive properties 93 2.7.7 Sensitivity analyses using imputed data 94 2.7.8 Secondary outcomes 97
2.8 Discussion 100 2.8.1 Summary 100 2.8.2 Strengths and limitations 101 2.8.3 Comparisons with previous studies 103 2.8.4 Generalisability 104 2.8.5 Interpretation 104
3 RANDOMISED CONTROL TRIAL............................................... 106 3.1 Overview 106 3.2 Design considerations 106
3.2.1 Evaluating complex interventions 106 3.2.2 External comparability 107 3.2.3 Internal validity 108
3.3 Trial design 119 3.4 Recruitment 121

7/22/2019 Preventing Falls in Older People 2008
http://slidepdf.com/reader/full/preventing-falls-in-older-people-2008 7/240
7
3.4.1 Recruitment of general practices 121 3.4.2 Recruitment of day hospitals 122 3.4.3 Recruitment of individual participants 123 3.4.4 Retention of study participants 128
3.5 Intervention under evaluation 128 3.5.1 Medical assessment and treatment 128 3.5.2 Physiotherapy assessment and individualised therapy
programme 129 3.5.3 Occupational therapy assessment and modifications 129 3.5.4 Control group 130
3.6 Outcome Measures 130 3.6.1 Baseline demographic and clinical characteristics 131 3.6.2 Primary outcome: rate of falling over a 12 month period postrecruitment 132 3.6.3 Secondary outcomes 134 3.6.4 Ascertaining outcome measures 138
3.7 Sample size 141 3.7.1 Power calculation and sample size estimates 142
3.8 Study design 144 3.9 Randomisation and stratification 146 3.10 Blinding 146
3.11 Research governance and ethical considerations 146
3.11.1 International Standard Randomised Control Number 147 3.12 Process monitoring 148
3.12.1 Behavioural mapping 148 3.12.2 Adherence to programme 149
3.13 Data handling 149 3.13.1 Data cleaning 149 3.13.2 Handling missing data 150
3.14 Data analysis 152 3.14.1 General considerations 152 3.14.2 Intention to treat analysis 153 3.14.3 Primary outcome: rate of falling 154 3.14.4 Secondary analyses 156
3.15 Results 158 3.15.1 Data Preparation 158 3.15.2 Recruitment 159 3.15.3 Randomisation 162

7/22/2019 Preventing Falls in Older People 2008
http://slidepdf.com/reader/full/preventing-falls-in-older-people-2008 8/240
8
3.15.4 Baseline data 163 3.16 Describing the intervention 165
3.16.1 Behavioural mapping 165 3.16.2 Day hospital attendances and logs 165 3.16.3 Describing the primary outcome 169 3.16.4 Adjusted analysis 172 3.16.5 Sub-group analyses 173 3.16.6 Secondary analyses 174
3.17 Summary of the findings from the randomised controlled trial 186 3.18 Discussion 188
3.18.1 Inadequate power and chance 188 3.18.2 Bias 190 3.18.3 Confounding 192 3.18.4 Insensitive outcomes 192 3.18.5 Reverse causation 192 3.18.6 Inadequate intervention 192 3.18.7 Summary 194 3.18.8 External validity 194 3.18.9 Generalisability 195 3.18.10 Implications 195 3.18.11 Overall evidence 198
3.18.12 Recommendations 200
4 APPENDICES........................................................................... 201 4.1 Literature review – search methods 201
4.1.1 Search terms for falls prevalence and incidence 201 4.1.2 Search terms for falls and admission to long term care 201 4.1.3 Search terms for fear of falling (from 8/2/2003) 202 4.1.4 Search terms for falls and depression 202 4.1.5 Search terms for falls and mortality 202 4.1.6 Search terms for falls and carer burden 203 4.1.7 Search terms for falls risk factors 203 4.1.8 Search terms for falls risk assessment tools 204 4.1.9 Search terms for falls interventions 205 4.1.10 Search terms for day hospital falls interventions 205
4.2 Screening questionnaire 206 4.3 Sample day hospital log 207 4.4 Data checking 4-208 4.5 Model checking results 209

7/22/2019 Preventing Falls in Older People 2008
http://slidepdf.com/reader/full/preventing-falls-in-older-people-2008 9/240
9
4.5.1 Primary outcome – negative binomial regression 209 4.6 Meta-analysis of falls prevention trials 211 4.7 Publications and presentations arising 216
4.7.1 Publications 216 4.7.2 Presentations 216
5 REFERENCES........................................................................... 217 LIST OF FIGURES
Figure 1.1 Bandura’s model of self efficacy...........................................20 Figure 1.2 Schema for assessing falls (adapted from Lord, 2000207) ........41 Figure 1.3 Factors that contribute to the risk of falls..............................42 Figure 1.4 Study outline ....................................................................55 Figure 2.1 Sensitivity and specificity....................................................65 Figure 2.2 Overall study recruitment ...................................................87 Figure 2.3 Histogram of the number of diaries returned per participant ...90 Figure 2.4 ROC curves comparing risk score and previous fall only..........94 Figure 3.1 Prospective plan of the study ............................................145 Figure 3.2 Overall study recruitment .................................................160 Figure 3.3 RCT participant flow.........................................................161 Figure 3.4 Number of FPP attendances by day hospital ........................166 Figure 3.5 Box and whisker plot of individual falls rate by allocation......170
Figure 3.6 Scatterplot of deviance residuals against study id ................171 Figure 3.7 Time to first fall by allocation - unadjusted analysis .............178 Figure 3.8 Time to second fall – unadjusted analysis ...........................179 Figure 3.9 Bland-Altman plot of mean difference versus average score for
self reported and verified GP visits ....................................................183 Figure 4.1 Scatterplot of deviance residuals against study id ................209 Figure 4.2 Scatterplot of Cook’s distance against study id ....................209 Figure 4.3 Scatterplot of leverage against study id ..............................210 Figure 4.4 Scatterplot of predicted mean number of falls against study id
(dbeta)..........................................................................................210 Figure 4.5 Meta-analysis of falls prevention studies using a random-effects
model............................................................................................213 Figure 4.6 Meta-analysis comparing pragmatic versus explanatory falls
prevention trials .............................................................................214 Figure 4.7 Funnel plot of all trials examined in the meta-analysis of falls
prevention studies ..........................................................................215

7/22/2019 Preventing Falls in Older People 2008
http://slidepdf.com/reader/full/preventing-falls-in-older-people-2008 10/240
10
1 BACKGROUND AND LITERATURE REVIEW
1.1 General overview: falls in older people
Falls are one of the ‘geriatric giants’ 1
. They are a common and potentially
serious problem for older people; falls may result in injury, fear of falling,
social isolation and death2. There is an important relationship between
frailty, falls and fractures3 4, with the three sharing risk factors. Falls are a
commonly cited factor leading to a care home admission and give rise to a
major financial demand on the National Health Service and Social
Services
5
.
Several systematic reviews have collated published work on falls6-11 and
show that interventions can reduce falls by up to one-third. Such
interventions typically consist of a medical review, home hazards
assessment, and strength and balance training. Individual components or
combinations of these components have been shown to be effective in
hospital, primary care and care home settings, and in many different
countries12 13.
This work will focus on falls prevention in community dwelling older people.
1.2 Epidemiology
Most studies on falls quote the seminal paper by Mary Tinetti - ‘one third
of those aged over 65 years fall annually, rising to one half of those aged
85’ 14, data from 1988 based on a well conducted cohort study of 336
individuals in the United States. Other groups reproduced Tinetti’s results
at around the same time15 16, which led to a focus on falls as a research
topic and the recognition of the importance of falls in health planning and
policy, not least the highlighting of falls in the United Kingdom (UK)
National Service Framework for Older People2. However, there have been
7/22/2019 Preventing Falls in Older People 2008
http://slidepdf.com/reader/full/preventing-falls-in-older-people-2008 11/240
11
relatively few well conducted studies on the incidence and/or prevalence of
falls in the UK in recent years.
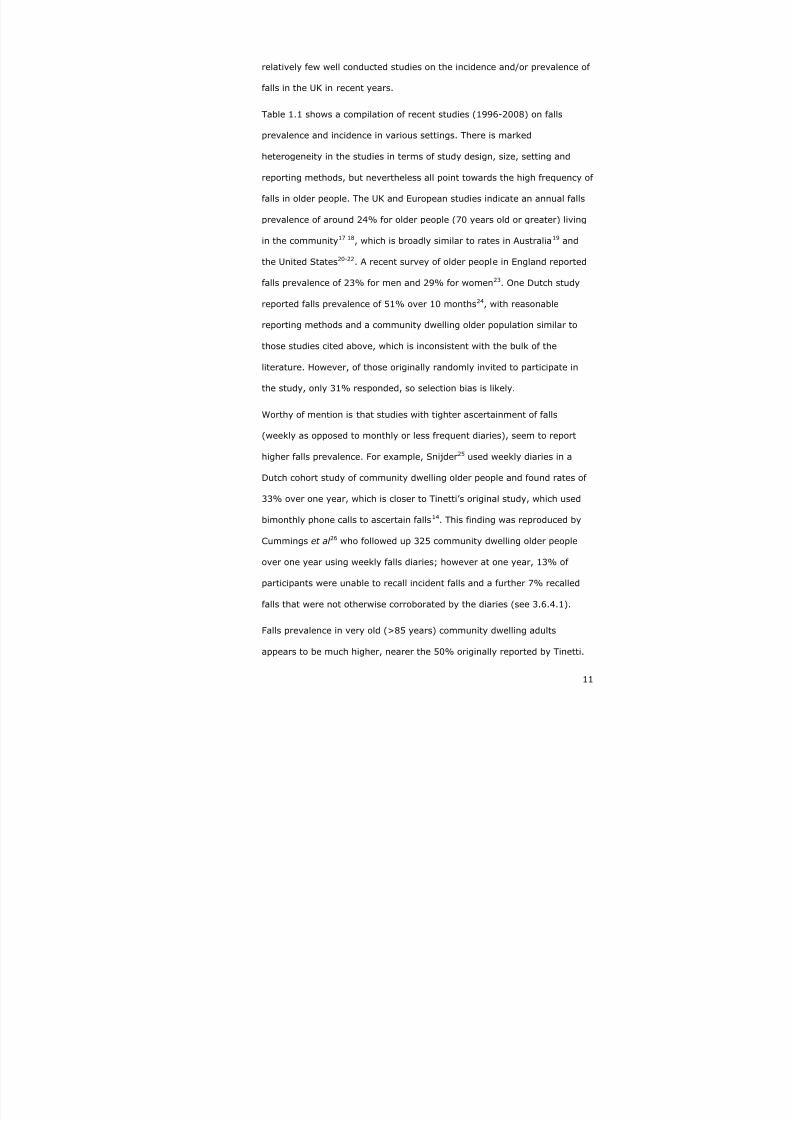
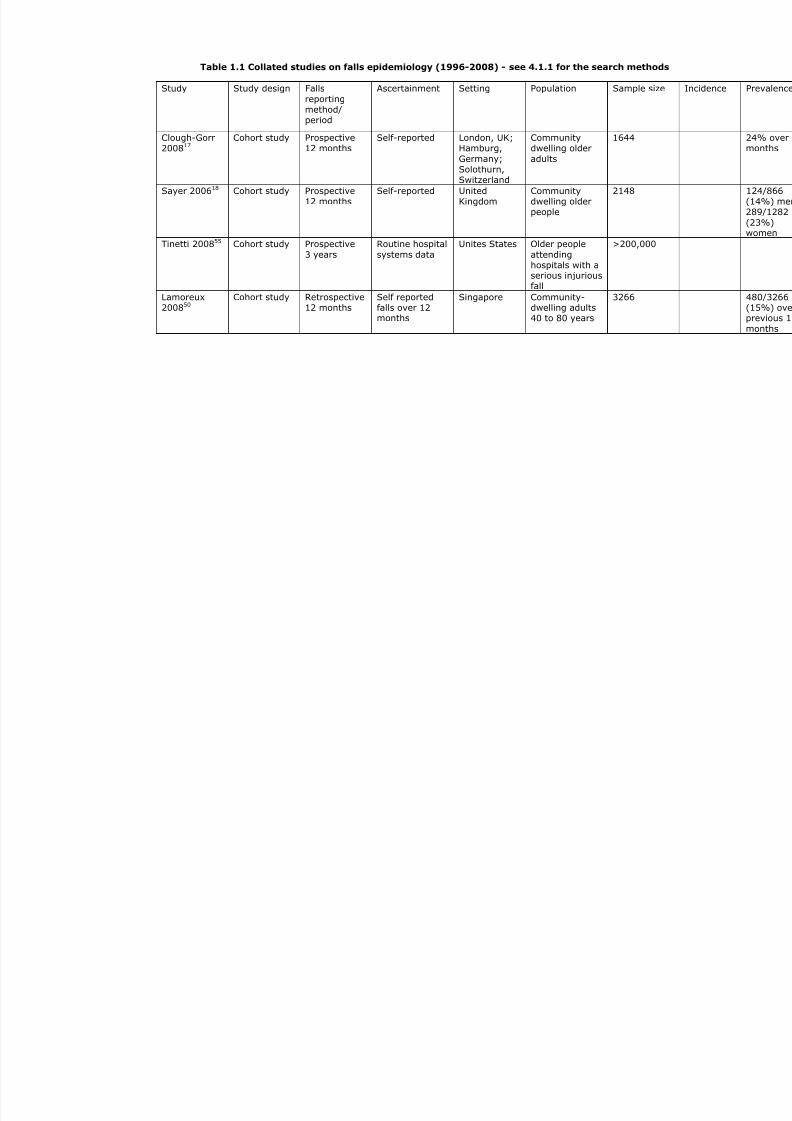
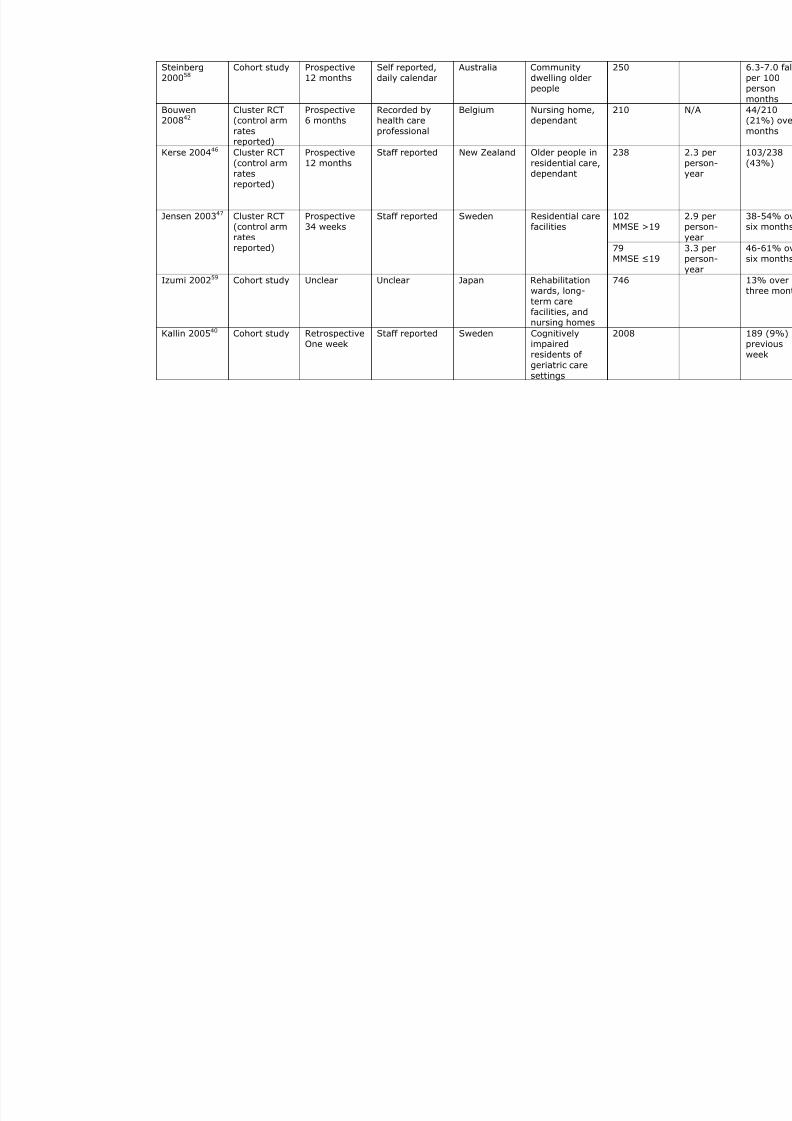
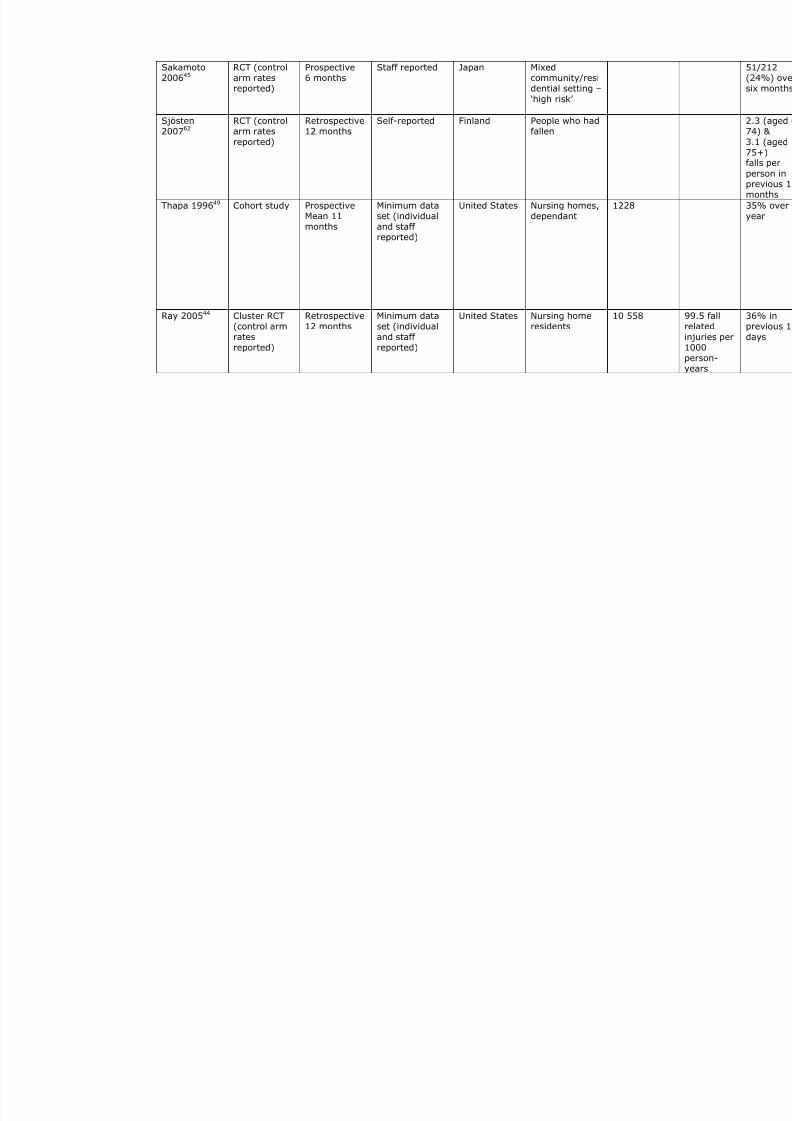
Table 1.1 shows a compilation of recent studies (1996-2008) on falls
prevalence and incidence in various settings. There is marked
heterogeneity in the studies in terms of study design, size, setting and
reporting methods, but nevertheless all point towards the high frequency of
falls in older people. The UK and European studies indicate an annual falls
prevalence of around 24% for older people (70 years old or greater) living
in the community17 18, which is broadly similar to rates in Australia19 and
the United States20-22. A recent survey of older people in England reported
falls prevalence of 23% for men and 29% for women23. One Dutch study
reported falls prevalence of 51% over 10 months24, with reasonable
reporting methods and a community dwelling older population similar to
those studies cited above, which is inconsistent with the bulk of the
literature. However, of those originally randomly invited to participate in
the study, only 31% responded, so selection bias is likely.
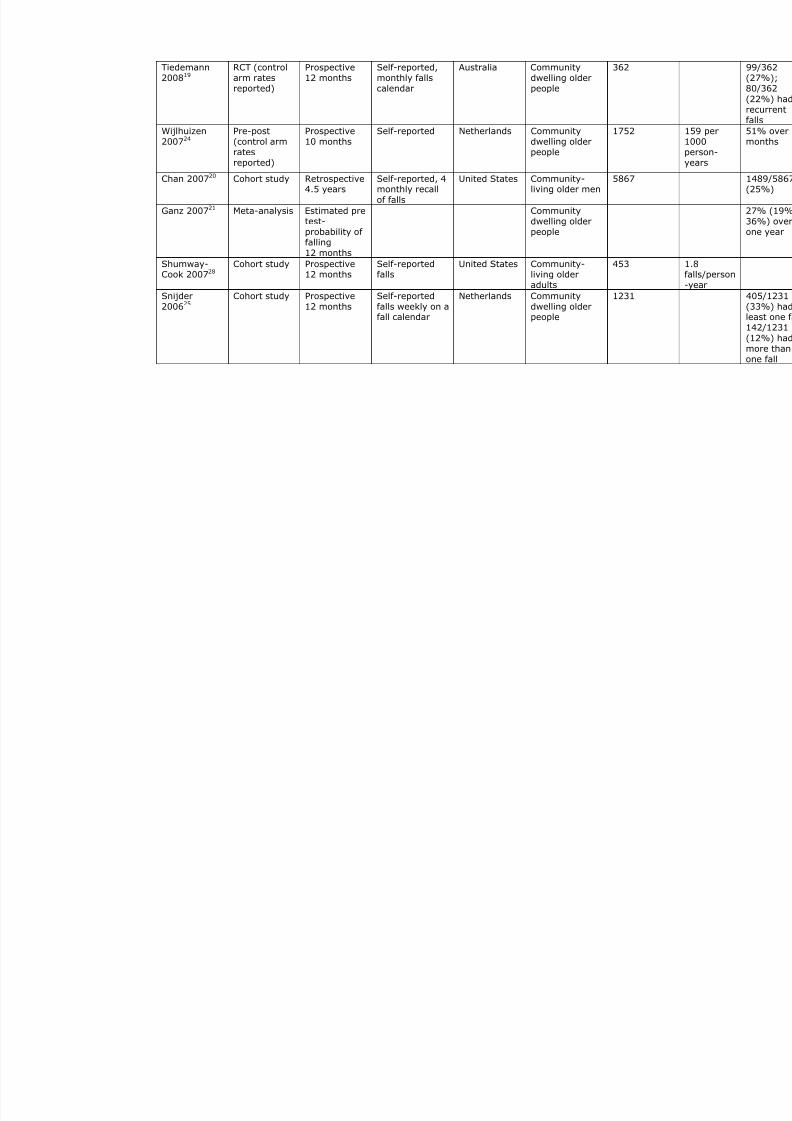
Worthy of mention is that studies with tighter ascertainment of falls
(weekly as opposed to monthly or less frequent diaries), seem to report
higher falls prevalence. For example, Snijder25 used weekly diaries in a
Dutch cohort study of community dwelling older people and found rates of
33% over one year, which is closer to Tinetti’s original study, which used
bimonthly phone calls to ascertain falls14. This finding was reproduced by
Cummings et al 26 who followed up 325 community dwelling older people
over one year using weekly falls diaries; however at one year, 13% of
participants were unable to recall incident falls and a further 7% recalled
falls that were not otherwise corroborated by the diaries (see 3.6.4.1).
Falls prevalence in very old (>85 years) community dwelling adults
appears to be much higher, nearer the 50% originally reported by Tinetti.

7/22/2019 Preventing Falls in Older People 2008
http://slidepdf.com/reader/full/preventing-falls-in-older-people-2008 12/240
12
For example, the Longitudinal Study on Ageing Amsterdam (LASA) cohort
of 85+ year olds found a 12 month fall prevalence of 44%27.
Few prospective cohort studies have reported falls incidence rates in
community dwelling older people, which is in the region of 1.1-1.8 falls per
person-year28 29, although many intervention trials use incidence as an
outcome measure9 30-36. Unpublished work using the THIN database general
practises in England has found reported falls rates of 3.6 per 100 person-
years (0.04 per person-year) in people aged 60 or more, though
underreporting is likely.
Rates for recurrent falls (i.e. more than one fall per annum) are more
consistent, at around 10-12% per annum25 37-39 though one Australian
study found rates for recurrent falls as high as 22%19, but this was a
randomised controlled study, and there is likely to be a degree of selection
bias.
By comparison, fall rates in high risk populations, such as those in care
homes or geriatric care settings, are consistently higher – 10% over one
week40, 12% over three months41, 20-50% over six months42-45 and 35-
60% over one year46-49.
Fall prevalence appears to be slightly lower in oriental countries, for
example rates in Singapore are around 15% over one year, although this
study did include a substantial proportion of younger participants (<70
years)50. Assantachai et al reported rates of 20% in community dwelling
Thai seniors (65+)51, albeit using two monthly diaries to ascertain self
reported falls. One study of community dwelling older people from India
reported 12 months falls prevalence of 48%, though the recruitment
methods (word of mouth) make selection bias highly likely52. Falls rates in
Turkish older people attending a geriatric outpatient setting are consistent
with figures from Western societies (29%)53.

7/22/2019 Preventing Falls in Older People 2008
http://slidepdf.com/reader/full/preventing-falls-in-older-people-2008 13/240
13
However, there are few studies comparing like with like which further
explore varying falls rates by country. One study compared fall rates
between white and African-American women54, but did not find any major
difference between the two different ethnic groups.
7/22/2019 Preventing Falls in Older People 2008
http://slidepdf.com/reader/full/preventing-falls-in-older-people-2008 14/240
Table 1.1 Collated studies on falls epidemiology (1996-2008) - see 4.1.1 for the search metho
Study Study design Falls
reportingmethod/period
Ascertainment Setting Population Sample si
Clough-Gorr200817
Cohort study Prospective12 months
Self-reported London, UK;Hamburg,
Germany;Solothurn,Switzerland
Communitydwelling older
adults
1644
Sayer 200618 Cohort study Prospective12 months
Self-reported UnitedKingdom
Communitydwelling olderpeople
2148
Tinetti 200855 Cohort study Prospective
3 years
Routine hospital
systems data
Unites States Older people
attendinghospitals with aserious injuriousfall
>200,000
Lamoreux200850
Cohort study Retrospective12 months
Self reportedfalls over 12months
Singapore Community-dwelling adults40 to 80 years
3266
7/22/2019 Preventing Falls in Older People 2008
http://slidepdf.com/reader/full/preventing-falls-in-older-people-2008 15/240
Tiedemann200819
RCT (controlarm ratesreported)
Prospective12 months
Self-reported,monthly fallscalendar
Australia Communitydwelling olderpeople
362
Wijlhuizen200724
Pre-post(control armratesreported)
Prospective10 months
Self-reported Netherlands Communitydwelling olderpeople
1752
Chan 200720 Cohort study Retrospective4.5 years
Self-reported, 4monthly recall
of falls
United States Community-living older men
5867
Ganz 200721 Meta-analysis Estimated pretest-probability offalling
12 months
Communitydwelling olderpeople
Shumway-Cook 200728
Cohort study Prospective12 months
Self-reportedfalls
United States Community-living olderadults
453
Snijder200625
Cohort study Prospective12 months
Self-reportedfalls weekly on afall calendar
Netherlands Communitydwelling olderpeople
1231

7/22/2019 Preventing Falls in Older People 2008
http://slidepdf.com/reader/full/preventing-falls-in-older-people-2008 16/240
Stone 200638 Cohort study Retrospective12 months
Self reported, 4monthly diary
United States Ambulatory,community-dwelling women
aged 65 andolder
8101
Campbell
200529
RCT (control
arm ratesreported)
Prospective
12 months
Self-reported
monthlypostcardcalendars withcross check
Australia Community
dwelling olderpeople
361
van Bemmel200527
Cohort study Retrospective12 months
Self-reportedrecall of falls
Netherlands Observationalpopulation-based study
599
Volpato200539
Cohort study Retrospective3 years
Self-reportedrecall of fallsevery six
months
US Communitydwelling olderpeople
878
Li 200622 Cohort study Retrospective12 months
Self-reportedfalls over oneyear
United States Communitydwelling olderpeople
2193
Tinetti 198814 Cohort study Retrospective
12 months
Bimonthly
telephone calls
US Community
dwelling olderpeople
336
Birks 200456 RCT (control
arm ratesreported)
Retrospective
Median 28months
Self reported UK Community
dwelling olderwomen at riskof fracture
4169
Assantachai200257
RCT (controlarm rates
reported)
Mixed12 months
Diary completedin retrospect
every 2 months
Thailand Communitydwelling older
people
1043
7/22/2019 Preventing Falls in Older People 2008
http://slidepdf.com/reader/full/preventing-falls-in-older-people-2008 17/240
Steinberg200058
Cohort study Prospective12 months
Self reported,daily calendar
Australia Communitydwelling olderpeople
250
Bouwen200842
Cluster RCT(control arm
ratesreported)
Prospective6 months
Recorded byhealth care
professional
Belgium Nursing home,dependant
210
Kerse 200446 Cluster RCT
(control armratesreported)
Prospective
12 months
Staff reported New Zealand Older people in
residential care,dependant
238
102MMSE >1
Jensen 200347 Cluster RCT(control arm
ratesreported)
Prospective34 weeks
Staff reported Sweden Residential carefacilities
79
MMSE ≤1
Izumi 200259 Cohort study Unclear Unclear Japan Rehabilitationwards, long-
term carefacilities, andnursing homes
746
Kallin 200540 Cohort study RetrospectiveOne week
Staff reported Sweden Cognitivelyimpairedresidents of
geriatric caresettings
2008

7/22/2019 Preventing Falls in Older People 2008
http://slidepdf.com/reader/full/preventing-falls-in-older-people-2008 18/240
Hill 200860 Cohort study Retrospective6 months
Self-reported –recall over sixmonths
Australia Falls clinic 254
Nowalk200148
RCT (controlarm ratesreported)
Retrospective24 months
Self reportedevery sixmonths
US Long-term carefacilities withservices rangingfromindependent
living to skillednursing
Psychogeriatric
clinic
Geriatricrehabilitationclinic
Nyberg
199761
Cohort study Prospective
Unclear
Staff reported Sweden
Nursing home
Rosendahl200843
RCT (controlarm ratesreported)
Prospective6 months
? Sweden Residential carefacilities,dependant inADLs
191
7/22/2019 Preventing Falls in Older People 2008
http://slidepdf.com/reader/full/preventing-falls-in-older-people-2008 19/240
Sakamoto200645
RCT (controlarm ratesreported)
Prospective6 months
Staff reported Japan Mixedcommunity/residential setting –
‘high risk’
Sjösten
200762
RCT (control
arm ratesreported)
Retrospective
12 months
Self-reported Finland People who had
fallen
Thapa 199649 Cohort study ProspectiveMean 11months
Minimum dataset (individualand staffreported)
United States Nursing homes,dependant
1228
Ray 200544 Cluster RCT(control arm
ratesreported)
Retrospective12 months
Minimum dataset (individual
and staffreported)
United States Nursing homeresidents
10 558
7/22/2019 Preventing Falls in Older People 2008
http://slidepdf.com/reader/full/preventing-falls-in-older-people-2008 20/240
20
1.3 The impact of falls
Falls in older people are undignified, a reminder of vulnerability – in
contrast to younger, typically more active individuals in whom falls may be
expected and innocuous. For some older people, they are also potentially
very serious in terms of health outcomes. Falls are strongly associated with
future falls, and recurrent falling can lead to a downwards spiral, leading to
fear of falling, reduced activity, deconditioning, more falls, social isolation
and depression.
1.3.1 Fear of falling
Fear of falling is a well recognised consequence of falling – the ‘post-fall
syndrome’, but also can be anticipatory - ‘ptophobia’, a phobic reaction to
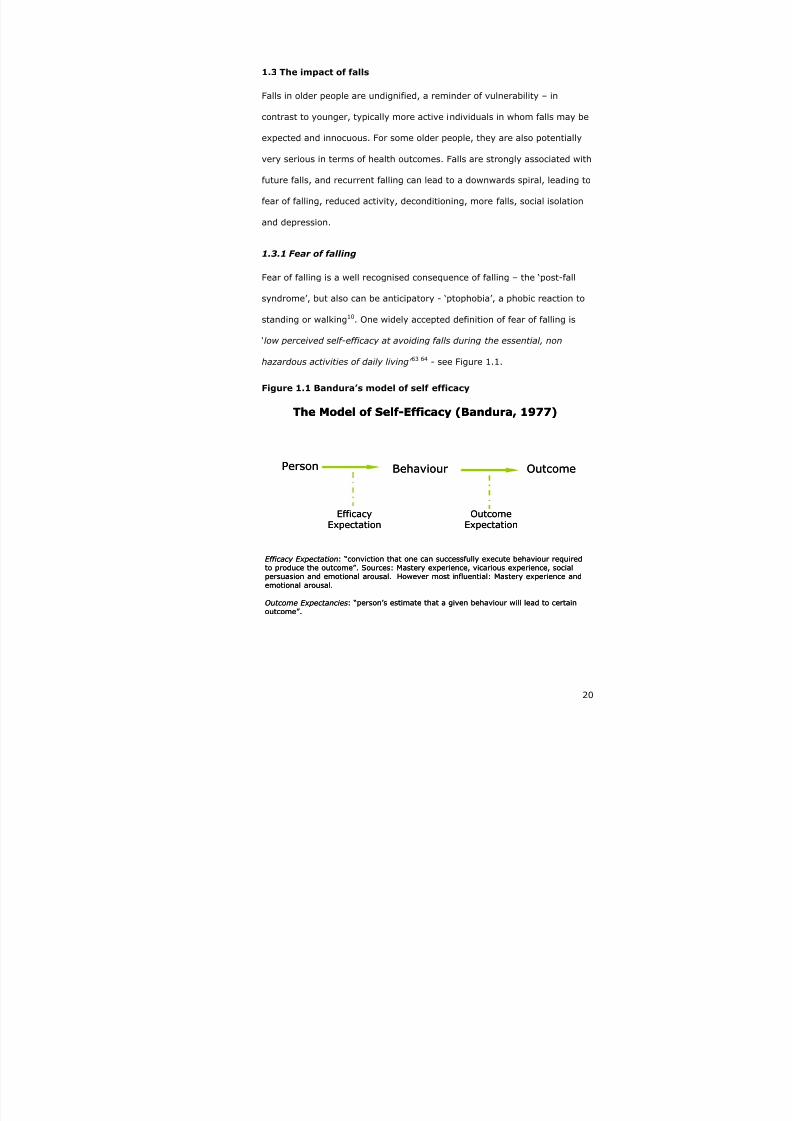
standing or walking10. One widely accepted definition of fear of falling is
‘low perceived self-efficacy at avoiding falls during the essential, non
hazardous activities of daily living’ 63 64 - see Figure 1.1.
Figure 1.1 Bandura’s model of self efficacy
Person Behaviour Outcome
EfficacyExpectation
OutcomeExpectation
The Model of Self-Efficacy (Bandura, 1977)
Efficacy Expectation: “conviction that one can successfully execute behaviour requiredto produce the outcome”. Sources: Mastery experience, vicarious experience, socialpersuasion and emotional arousal. However most influential: Mastery experience andemotional arousal.
Outcome Expectancies: “person’s estimate that a given behaviour will lead to certainoutcome”.

7/22/2019 Preventing Falls in Older People 2008
http://slidepdf.com/reader/full/preventing-falls-in-older-people-2008 21/240
21
Applied to falls, Bandura’s theory predicts that low self efficacy leads to
negative outcome expectations (‘I will fall’), or more simply, falls beget
falls.
Fear of falling was recently reviewed in the National Institute of Clinical
Excellence (NICE) guidelines on the assessment of falls in older people10,
and this section builds on their findings; see 1.1.1 for search methods.
The main findings from the NICE guidance were that there is considerable
overlap between fear of falling and falls in terms of risk factors and
associated outcomes. NICE recommended that falls assessments should
include a measure of fear of falling, and favoured the Falls Efficacy Scale63.
Risk factors for fear of falling include: age >80 years (relative risk 1.5), a
sedentary lifestyle (relative risk 2.0), a lack of emotional support (relative
risk 2.6) and visual impairment (relative risk 1.4)65 66. Further falls are
associated with fear of falling (relative risk 1.7)65, especially after hip
fracture associated with a fall67.
Other investigators have found an association between increased fear of
falling and balance performance68, whilst Hellstrom et al 69 found that falls
efficacy was a better predictor of daily function in people recovering from
stroke than more objective measures of balance. The association between
fear of falling and functional impairment and quality of life has been shown
in other studies70 71.
Fear of falling is also associated with serious adverse outcomes such as
institutionalisation and death in individuals recovering from hips fracture72
73 74.
The striking overlap in underlying risk factors and outcomes between falling
and fear of falling make falls prevention programmes an obvious
intervention to reduce not only falls but fear of falling65. Some investigators
7/22/2019 Preventing Falls in Older People 2008
http://slidepdf.com/reader/full/preventing-falls-in-older-people-2008 22/240
22
have found that any reduction in fear of falling is more likely related to
improvements in health and functional ability – irrespective of specific
nature of the interventions75 76. However, conventional exercise classes
have not been able to demonstrate a reduction in fear of falling77, though it
appears that Tai Chi based exercise regimes may be effective. In a
randomised controlled trial, Wolf et al showed no fear of falling in 47% of
people undergoing intensive Tai Chi classes, compared to 33% for those
receiving computerised balance training and 41% for those receiving
educational classes at between 7-20 months of follow up, though this was
not significant (p=0.55)78
.
1.3.2 Falls and depression
(See 4.1.4 for search methods)
Falls and depression are associated79-85 and share common risk factors86.
There is also an association between depression and fracture, which may
be in part mediated through increased falls87. Furthermore, depression is
independently associated with functional decline after a fall88.
There is an association between fear of falling and depression: in a cross-
sectional study of 540 community dwelling Dutch people aged 70+, 28%
and 26% with severe fear of falling had feelings of anxiety and symptoms
of depression respectively, and the severity of fear of falling was correlated
with symptoms of depression and anxiety89
. The association between fear
of falling and depression is also seen in Chinese communities (cross-
sectional study of 100 care home residents)90. People with depression and
fear of falling appear to be most likely to restrict their activity (InChianti
study – cross-sectional study of 926 Italians aged 65+)91.
Although several trials have suggested that falls prevention programmes
may reduce depression in fallers92-94
, and exercise is considered effective

7/22/2019 Preventing Falls in Older People 2008
http://slidepdf.com/reader/full/preventing-falls-in-older-people-2008 23/240
23
treatment for depression95 a recent systematic review96 and a large, well
conducted randomised controlled trial97 failed to find any robust evidence
that a multifactorial falls prevention programme can reduce depressive
symptoms in fallers.
The story gets more complicated; treatment with antidepressants
approximately doubles the risk of falling98-100 and is associated with a two-
fold increase in fragility fractures101-103. There is some weaker evidence
(cross-sectional study of 301 adults living in long term care settings having
fallen in the previous week) that newer anti-depressants (serotonin and
noradrenalin reuptake inhibitors (SNRIs)) are not associated with falls104.
In summary, depression may cause falls, and may be caused by falls,
especially in those fallers with fear of falling or functional decline. Falls
prevention interventions are not effective treatments of depression in
people who fall, and anti-depressants may increase falls risk, as well as the
risk of fracture.
The optimal management of depression in people who fall is unclear,
though careful attention to other modifiable falls risk factors is advisable
when starting anti-depressants in people at risk of falling105 106.
1.3.3 Fall related injuries
Approximately 30 to 50 percent of falls result in minor soft tissue injuries
that do not require medical attention107, although falls are a major cause of
trauma in older people108. Although falls in older people usually result in
relatively low impact energies, typically consisting of a fall from the stairs
or the standing position109 110, the effects of the fall can still be serious
because of other factors such as osteoporosis and diminished protective
reflexes. In community dwelling older people, an estimated 1% of falls
result in hip fractures; 3-5% result in other types of fractures, and an

7/22/2019 Preventing Falls in Older People 2008
http://slidepdf.com/reader/full/preventing-falls-in-older-people-2008 24/240
24
additional 5% produce serious soft tissue injuries14 111. Rates of fracture
resulting from a fall are as high as 10% in high risk populations (e.g. those
attending a falls service), with overall injurious falls being as high as
51%60. Injurious falls are also high (38%) amongst vulnerable populations
such as those living in care homes and other geriatric care settings44 49 61.
1.3.4 Falls and mortality
(See 4.1.5 for search methods)
Falls are the leading cause of mortality due to injury in people aged over
75 in the United Kingdom
5 112 113
. In Finnish community dwelling older
people, death rates from falls were 51/100,000 in 1995114 and increased to
55/100000 in 2002115. However, it should be noted that falls related
mortality in Finland is one of the highest in Europe. Amongst European
Union (EU) countries, the UK has one of the lowest rates of fall related
deaths (standardised mortality ratio 33)116.
Although people over 60 years of age make up 19% of the EU population,
they account for 28% of injury-related deaths116. The injury mortality rate
(age-standardised) in EU-15 is about 39 deaths per 100,000 people, while
in EU-25 it is about 45 deaths per 100,000 people116.
In the United States, death from falls overtook deaths from road traffic
accidents between 1990-1998, accounting for 9,604 deaths per 100,000
aged 65+ in 1998117; for the oldest old (>85 years) the rate was 109 per
100,000 in 1998118.
In Australia in 1998, there were 1,114 deaths from falls-related incidents
for people aged more than 65 years119.
1.3.5 The impact of falls on hospital services
In 1999 there were over 647,721 fall related A&E attendances in the UK for
people aged >60 years5. This is a rate of nearly 40/1000 people attending

7/22/2019 Preventing Falls in Older People 2008
http://slidepdf.com/reader/full/preventing-falls-in-older-people-2008 25/240
25
emergency departments per year because of a fall. International rates of
injurious falls (Table 1.1) range from 0.55-1.00 per person-year29 46 47, with
serious injurious falls rates in the region of 32 per 1000 person-years55.
The rate of injurious falls appears to be increasing (adjusted OR 1.08 (95%
CI 1.03–1.12)), according to a Finnish study of routine health service data
from 1991-1999120. This makes falls an issue for secondary care services
as well as primary care. Indeed, falling in hospital in-patients is also
common and serious121-123, but is out with the remit of this work.
The impact of falls on hospital services is difficult to estimate, as Hospital
Episode Statistics (HES) data do not specifically code falls (which is
appropriate given that a fall is usually a non-specific presentation of some
other disease process). But by way of example, HES data for the year
ending 2005/6 showing some common conditions and also falls-related
conditions are shown in Table 1.2.
These data illustrate that falls related hospital admissions have a similar
impact on hospital resource use to conditions such as stroke, and probably
a greater impact than traditionally high profile conditions such as acute
myocardial infarction.
Costs relating to hospital and nursing home care are greater in people who
fall, increasing annual hospital related costs by $11,042 (United States,
1996) compared to matched non-fallers; this relationship was stronger for
those with recurrent or injurious falls124.

7/22/2019 Preventing Falls in Older People 2008
http://slidepdf.com/reader/full/preventing-falls-in-older-people-2008 26/240
26
Table 1.2 Hospital Episode Statistical data by health resource
group, 2005/6125
HRG code MeanAge
Finishedconsultant
episodes*
MeanLength
ofStay
MedianSpell
Duration
Bed days†
E31 Syncope or Collapse >69 79 74842 5.7 2 293,914
H82 Extra-capsular Neck ofFemur Fracture with Fixation
81 2983 20.6 16 54,807
H84 Intra-capsular Neck ofFemur Fracture with Fixation
79 4134 19.7 14 71,837
H36 Closed Pelvis or LowerLimb Fractures >69
77 30137 19.5 11 445,992
A22 Non-Transient Stroke orCerebrovascular Accident >69 78 79922 25.7 13 1,126,041
E11 Acute Myocardial Infarction 77 28643 13.3 8 216,613
1.3.6 Falls and carer strain
(See 4.1.5 for search methods)
The previous sections have illustrated the impact of falls on individuals in
terms of morbidity, functional decline and depression. Many carers of older
people are themselves old, and likely to be at risk of falls and functional
decline. However, there are only a small number of papers which describe
the impact of falling on carers, all of which point to the increased carer
burden in those looking after people who fall.
Japanese carers of people who fall scored higher than those caring for non-
fallers on the Zarit Burden Interview126. In patients with Parkinson’s
disease, falls are associated with greater carer burden127 128. Falls are often
* A count of the number of HES records, submitted on behalf of EnglishNHS hospital providers that relate to episodes of admitted patient care thatended during the financial year (1 April to 31 March).† The sum of all the days that patients in the group occupied hospital bedsduring the financial year (1 April to 31 March).
7/22/2019 Preventing Falls in Older People 2008
http://slidepdf.com/reader/full/preventing-falls-in-older-people-2008 27/240
27
cited as a key driver of admission to long term care, presumably a
reflection of the increased carer burden.
1.3.7 Falls and admission to long term care
(See 4.1.2 for search methods)
People who fall have greater need of health and social care resources than
matched controls who have not fallen (1.4 relative risk for hospitalisation,
2.7 relative risk for nursing home admission), and often have some form of
limitation in basic (relative risk 1.4) or extended (relative risk 1.3)
activities of daily living
129
. However, the association is just that and it is not
correct to infer that falls cause increase health resource use, but are a
marker of an underlying ill-health, with the fall being a non-specific
manifestation of the underlying co-morbidities.
Rates of institutionalisation in long term care are 2-5 times greater after a
single fall compared to those who have not fallen82 130, and 2-20 times
greater for people with recurrent falls131-133
. Falls rates are 2-5 times higher
in those people admitted to long term care compared to age and gender
matched controls not admitted to long term care134 and those that fall in
long term care are at increased risk of death compared to those who do not
fall135. Much of this will be related to selection bias, though one might
argue that the care home environment might play a role, for example, the
type of flooring (wooden carpeted versus other types) influence the risk of
fracture from a fall (OR 1.8 (95% CI 1.3-2.4)), highlighting the importance
of the physical environment136.

7/22/2019 Preventing Falls in Older People 2008
http://slidepdf.com/reader/full/preventing-falls-in-older-people-2008 28/240
28
1.3.8 Falls risk factors
(See 4.1.7 for search methods)
There are many risk factors for falls. Fall risks factors were reviewed in the
NICE guidelines on falls prevention, and this section provides an update on
that work.
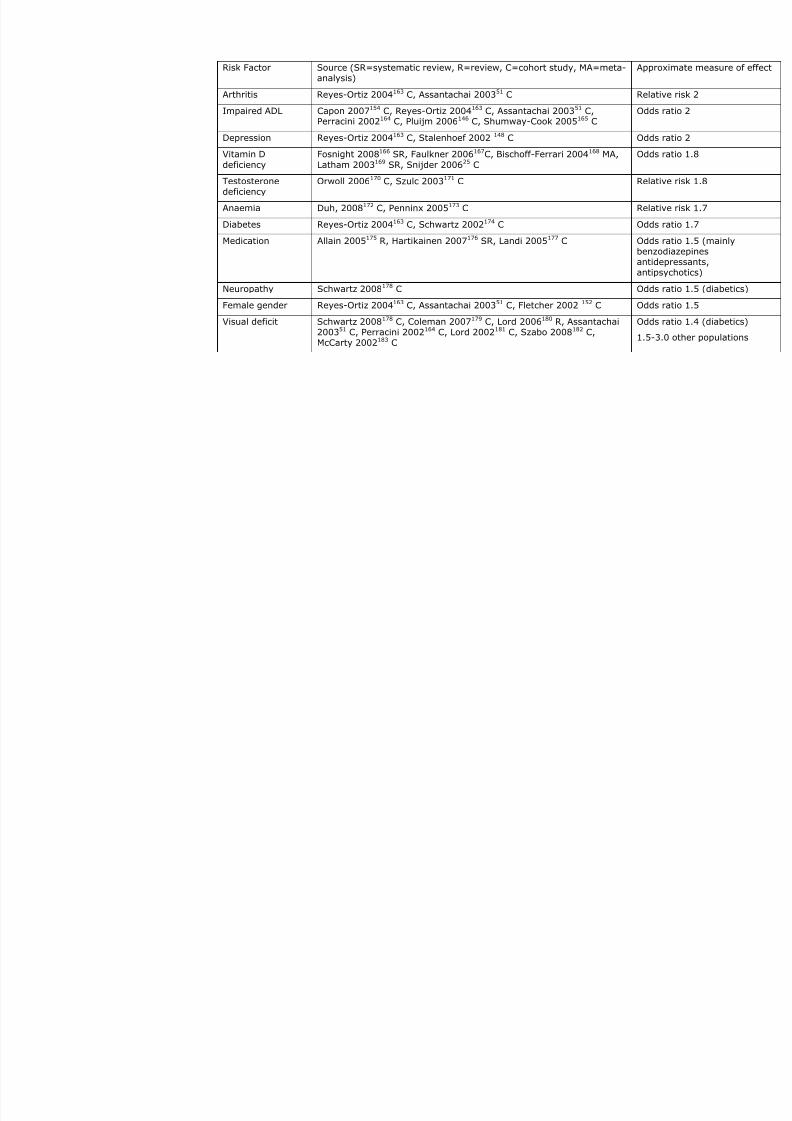
Table 1.3 summarises falls risk factors at the population level as identified
in prospective cohort studies, the gold standard method for identifying risk
factors137. Some systematic reviews which refer to older cohort studies are
also included. The use of falls risk assessment tools for individual patients
is considered separately (see section 1.3.9.5).
The major risk factors for falls include, in approximate descending order of
risk, balance deficits, reduced mobility, home hazards, muscle weakness,
history of falls, Parkinson’s disease, fear of falling, use of an assistive
device, frailty, cognitive impairment, arthritis, impaired ADL, depression,
vitamin D deficiency, testosterone deficiency, anaemia, diabetes,
medication, neuropathy, female gender and visual deficits (Table 1.3).
There are many other important but less well studied risk factors for falls,
such as disturbed sleep (odds ratio 1.3)38 and renal impairment (odds ratio
3.7). Preliminary studies indicate a possible role for genetic factors138 139.
The number of risk factors appears to be additive, with the risk of falling
increased linearly with the number of risk factors14.
Other studies have focussed on risk factors for falls in specific populations,
though there is considerable overlap. For example, in stroke patients,
depressive symptoms, disability, previous falls, and older age are
associated with falls, whereas higher cognitive and physical function were
protective140. Lee et al 141 examined falls risk factors in individuals in a

7/22/2019 Preventing Falls in Older People 2008
http://slidepdf.com/reader/full/preventing-falls-in-older-people-2008 29/240
29
rehabilitation setting and found poor cognitive and physical function to be
associated with in-patient falls.
1.3.8.1 Cognitive impairment and falls
Several studies have found that there is a significant association between
cognitive impairment and falls142. The odds ratio of falling when there is
cognitive impairment (≤26/30 on the mini-mental state examination
[MMSE]) has been reported as 5.0 (95% CI 1.8-13.7)14 and 2.2 (95% CI
1.5-3.2)143. The likely mechanisms behind falls in older people with
cognitive impairment include judgemental errors, cerebrovascular disease
and psychotropic medication or a combination of factors. However, the only
published randomised control trial examining a multifactorial intervention
(compared to usual care) to reduce fall in individuals with cognitive
impairment (MMSE ≤ 26) found no benefit – relative risk 0.92 (95% CI
0.81 to 1.05)144.

7/22/2019 Preventing Falls in Older People 2008
http://slidepdf.com/reader/full/preventing-falls-in-older-people-2008 30/240
Table 1.3 Published falls risk factors falls in community dwelling older people
Risk Factor Source (SR=systematic review, R=review, C=cohort study, MA=meta-
analysis)
Appr
Balance deficit Piirtola 2006145 R, Pluijm 2006146 C, Delbaere 2006147 C, Stalenhoef
2002148
C, Clark 2005149
C
Odd
Reduced mobility Morris 2007150 C, Tiedemann 200819 C Odd
Home hazards Lord 2006151 R, Fletcher 2002152 C, Pluijm 2006146 C
Van Bemmel 2005 27 C
Rela
Muscle weakness Otaka 2008 SR153, Moreland 2004 SR, Pluijm 2006146 C, Stalenhoef
2002148 C
Odd
History of falls Capon 2007154 C, Morris 2007150 C, Pluijm 2006146 C,
Papaioannou 2004155 C, Stalenhoef 2002 148 C
Odd
Parkinson’s disease Fink 2006156 C, Fletcher 2002 152 C Odd
Fear of falling Scheffer 200875 C, Delbaere 2004157 C, Pluijm 2006146 C, Delbaere
2006147 C, Delbaere 2004157 C, Murphy 200365 C
Odd
Use of an assistive
device
Nandy 2004158 R Rela
Frailty Ensrud 2008 159 C
(Two of: weight loss, the subject’s inability to rise from a chair 5 times
without using her arms, and reduced energy level)
Oddfrail
Cognitiveimpairment
Assantachai 200351 C, Shaw 2002160 R, Fletcher 2002152 C,Papaioannou 2004155 C, Van Doorn 2003161 C, Van Schoor 2002 162 SR
Odd
7/22/2019 Preventing Falls in Older People 2008
http://slidepdf.com/reader/full/preventing-falls-in-older-people-2008 31/240
Risk Factor Source (SR=systematic review, R=review, C=cohort study, MA=meta-analysis)
Appr
Arthritis Reyes-Ortiz 2004163 C, Assantachai 200351 C Rela
Impaired ADL Capon 2007154 C, Reyes-Ortiz 2004163 C, Assantachai 200351 C,Perracini 2002164 C, Pluijm 2006146 C, Shumway-Cook 2005165 C
Odd
Depression Reyes-Ortiz 2004163 C, Stalenhoef 2002 148 C Odd
Vitamin D
deficiency
Fosnight 2008166 SR, Faulkner 2006167C, Bischoff-Ferrari 2004168 MA,
Latham 2003169 SR, Snijder 200625 C
Odd
Testosteronedeficiency
Orwoll 2006170 C, Szulc 2003171 C Rela
Anaemia Duh, 2008172 C, Penninx 2005173 C Rela
Diabetes Reyes-Ortiz 2004163 C, Schwartz 2002174 C Odd
Medication Allain 2005175 R, Hartikainen 2007176 SR, Landi 2005177 C Oddbenzantidantip
Neuropathy Schwartz 2008178 C Odd
Female gender Reyes-Ortiz 2004163 C, Assantachai 200351 C, Fletcher 2002 152 C Odd
Visual deficit Schwartz 2008178 C, Coleman 2007179 C, Lord 2006180 R, Assantachai200351 C, Perracini 2002164 C, Lord 2002181 C, Szabo 2008182 C,McCarty 2002183 C
Odd
1.5-

7/22/2019 Preventing Falls in Older People 2008
http://slidepdf.com/reader/full/preventing-falls-in-older-people-2008 32/240
32
1.3.9 Falls screening tools
Having highlighted that there are multiple risk factors for falls in multiple domains
(physical, psychological, environmental etc). The logical progression is to combine these
risk factors into a single tool capable of predicting falls in the future.
Many falls risk screening tools have been published for use in a variety of settings. A
major limitation in several of the published screening tools is that they rely upon
retrospective recall of falls, which has been shown to be unreliable, underestimating the
true prevalence of falls26. Individuals who are truly at high risk of falling are likely to be
at high risk of injurious falls (because of multiple risk factors and recurrent falls); this
population are likely to report falls because of associated injury. This differential recall
leads to bias, in this case underestimating non-injurious falls.
The search used to identify published falls screening tools is listed in 4.1.8; only
multidimensional tools, evaluated prospectively and reporting sensitivity, specificity,
likelihood ratios and/or the area under the curve were reviewed.
1.3.9.1 Hospital based falls risk screening tools
Though not of immediate relevance to this study (focussing on community dwelling older
people), much of the original work on falls screening tools emerged from hospital
settings, and a brief review of such tools is appropriate.
Oliver et al 184 developed a falls risk screening tool for use in the hospital setting (stroke
unit, acute and rehabilitation wards). They identified five risk factors which were
associated with a future in-patient fall:
• Patient presented (to hospital) with a fall or had fallen in hospital
• Agitation
• Visual impairment affecting daily function
• Requiring help with toileting
• Transfer and mobility score of 3 or 4 (derived from the Barthel index185)

7/22/2019 Preventing Falls in Older People 2008
http://slidepdf.com/reader/full/preventing-falls-in-older-people-2008 33/240
33
The tool was prospectively validated in a separate in-patient setting. The sensitivity of
the tool for predicting a fall in the week after assessment was 92%, the specificity 68%.
The authors noted different sensitivity and specificity in two different settings where the
tool was validated. In general terms, tools developed for one setting should not be
assumed to perform equally well in a different setting, with a different population. Wijnia
et al tested the STRATIFY tool in a Dutch nursing home and found that it underperformed
(sensitivity 50%, specificity 76 %) compared to the results seen for STRATIFY in the
hospital setting186.
Though STRATIFY fulfilled a useful function in highlighting the importance of in-patient
falls, there has been a move to more simple approaches since its inception. For example,
in 2008 Salameh187 found previous fall and ‘acute impairing medical’ illness to be
predictive of a future in-patient fall and the combination of the two had a sensitivity of
64%, specificity 68%. Also in 2008, Vassallo188 found that clinical judgment based on
observed wandering had better predictive accuracy indicated by the number of patients
correctly classified (157/200, 79%) than either the STRATIFY (93/200, 47%) or the
Downton*189 falls risk assessment tool (100/200, 50%) in a geriatric rehabilitation
setting. The general consensus appears to be that falls are so common in hospital that
screening is not useful190, and that falls reduction strategies should be applied at the
level of the population, rather than on screened and selected individuals. This approach
has been tested in a well conducted cluster RCT of a multifactorial falls intervention in
Australia, though the results were negative191. However, this may be due to the relative
ineffectiveness of the intervention rather than the global approach per se; in particular
* The Downton falls screening tool has not been formally evaluated but consists of ahistory of falls, medications (tranquillisers/sedatives, diuretics, anti-hypertensivesexcluding diuretics, anti-Parkinsonian drugs, and antidepressants), sensory deficits(visual impairment, hearing impairment), limb abnormalities (such as hemiparesis),
confusion and an unsafe gait (with or without aids). Each one of these factors scores a
point, and scores of three or above
identified patients at risk.

7/22/2019 Preventing Falls in Older People 2008
http://slidepdf.com/reader/full/preventing-falls-in-older-people-2008 34/240
34
strength and balance training was only delivered over a short period, whereas any
improvements from such an approach take weeks to manifest.
Other investigators have used the STRATIFY tool in an attempt to predict falls in patients
being discharged from hospital. This is a plausible approach, as the items in STRATIFY
seem equally likely to predict falls in the primary care setting as in hospital. Smith192
tested the STRATIFY tool on people with stroke being discharged but found it performed
poorly (sensitivity 11% and specificity 90%) and suggested a disease specific tool.
Subsequently, Ashburn193 found that fall or near fall in hospital and upper limb
dysfunction were the strongest predictors of future fall in people with stroke being
discharged from hospital (specificity 70% and sensitivity 60%). Similarly, Mackintosh194
found that in people with stroke being discharged from hospital, a history of inpatient
falls and poor balance predicted future fall (sensitivity and specificity >80%).
Hyndman195 found that people with stroke living in the primary care setting who ‘stop
walking when talking’ (a test of the ability to perform dual tasks) had a sensitivity of
53% and specificity of 70% for future fall. The dual tasking phenomenon has also been
identified as a useful predictor of falls in patients with cognitive impairment196.
The PROFET study was one of the seminal falls prevention studies, in which older people
attending an emergency department with a primary ‘diagnosis’ of fall were offered a
multidisciplinary assessment197. Eligibility was on the basis of a fall, rather than a
screening process. In a further analysis of the risk factors predictive of future falls, three
of the six risk factors included a fall in the previous year, falling indoors and the inability
to rise following a fall198, the remaining items were negative predictors - moderate
alcohol consumption, a reduced abbreviated mental test score and admission to hospital
as a result of the fall. Again, the most powerful predictor of future fall was a history of a
previous fall.
1.3.9.2 Falls screening tools in residential settings
The Mobility Interaction Fall (MIF) Chart has been developed for use by a trained
assessor in residential community settings199. The MIF chart includes an observation of

7/22/2019 Preventing Falls in Older People 2008
http://slidepdf.com/reader/full/preventing-falls-in-older-people-2008 35/240
35
the ability to walk and simultaneously interact with a person or an object, a vision test,
and a concentration rating. Additionally, staff rated each resident's risk as high or low
and reported the resident's history of falls during the past six months. Detailed results
are not available, but the investigators reported that the combination of two high risk
scores (MIF chart, staff judgment, falls history) was better than any one individual
predictor.
Chen et al 200 derived a falls risk score to differentiate people at extremely high risk of
falling from those at moderate risk of falling, in an institutionalised population with an
overall prevalence of 50% of falls in one year and 30% prevalence for recurrent falls in
one year. Combining balance, cognition, illness severity, age and continence they derived
a risk score which at the extremes differentiated patients with an annual falls rate of 3.2
per person, six times greater than those at the lower end of the scale (0.5 falls person-
year). The assessments do require a trained assessor, but are relatively straightforward,
and should be readily applicable in a residential care setting, or other similar setting such
as intermediate care. However, the usefulness of identifying the very high risk versus
moderate risk individuals is questionable.
1.3.9.3 Falls screening tools in the primary care setting
A screening tool using prospective falls data has been developed by Tromp et al 201 in a
nested cohort study within the Longitudinal Aging Study Amsterdam (LASA). They
recorded falls prospectively using a weekly diary in 1,285 people living in the community,
aged over 65. Previous fall, visual impairment (can you recognise someone’s face at four
metres?), urinary incontinence and use of benzodiazepines were the strongest predictors
identified in the risk profile model for any falls (area under curve (AUC)=0.65), whereas
previous falls, visual impairment, urinary incontinence and functional limitations proved
to be the strongest predictors in the model for recurrent falls (AUC=0.71). The model
developed found that a previous fall (OR 2.5) was more strongly associated with future
falls than the other three risk factors (OR 1.6 for each of visual impairment, urinary
incontinence and functional limitation). The final model developed was a better predictor

7/22/2019 Preventing Falls in Older People 2008
http://slidepdf.com/reader/full/preventing-falls-in-older-people-2008 36/240
36
of recurrent falls (AUC 0.71) than a single fall (AUC 0.65). This was a well-conducted
study and there appears to be little reason to think that the findings are not externally
generalisable.
Stalenhoef et al 202 developed a risk model for predicting recurrent falls based on
retrospective self reported data. They identified six statistically significant associations
with self reported falls (age ≥80, female gender, musculoskeletal symptoms, balance
disturbance, chronic neurological disorder and the use of anti-depressants). These factors
were used to construct a predictive model, which gave a positive predictive value of 42%
and negative predictive value of 85%. The usefulness of this model is questionable, in
particular as the response rate was 60%; they acknowledged that the very old (≥ 80)
were under-represented in their sample. The use of retrospective monitoring of falls is
likely to have led to an underestimate of falls prevalence26, and so an underestimate of
the positive predictive value.
Stel et al 203, again using data from LASA, devised a tree-structured survival analysis to
predict falling. Building on the paper by Tromp, discussed above, they focussed on
recurrent falls (two falls within six months), with careful follow up over three years
(weekly falls calendar posted to the research centre at the end of every three months,
with telephone contact if they were unable to complete the fall calendar, if the fall
calendar was not returned even after a reminder, or if it was completed incorrectly). The
model that they developed identified the importance of a combination of risk factors in
identifying future fallers (grip strength, functional limitation and recurrent falls). The
baseline screening data was collected through a face to face interview, though the falls
diaries were self completed.
Pluijm et al 146, building on previous work in LASA identified nine variables which
combined gave modest predictive ability to identify recurrent fallers (a score of five or
more had 59% sensitivity and 71% specificity, AUC 0.71). The items included two or
more previous falls, dizziness, functional limitation, weak grip strength, low body weight,
fear of falling, the presence of dogs/cats in the household, a high educational level,

7/22/2019 Preventing Falls in Older People 2008
http://slidepdf.com/reader/full/preventing-falls-in-older-people-2008 37/240
37
drinking 18 or more alcoholic consumptions per week and two interaction terms (high
education x 18 or more alcohol consumptions per week and two or more previous falls x
fear of falling). Though comprehensive, this dataset offer limited advantages compared
to the more simple tools.
The Falls Risk Assessment Tool (FRAT)158, was developed in the United Kingdom and can
be administered by a non-health care professional. Using the presence of three risk
factors as a cut off point, it had good specificity, identifying 92% of people who did not
have a fall (14% reported falls in the previous six months), but poor sensitivity,
identifying only 42% of individuals who did have a fall; the positive predictive value was
57%. The methodology used in monitoring falls is questionable, as fall rates were based
upon retrospective recall at six months. Retrospective recall of falls has been shown to be
of limited accuracy; Cummings et al 26 carried out a study on falls reported by individuals
using prospective, weekly follow up and contrasting with retrospective recall by the same
individuals at three, six or twelve months of participants. At three months, 32% of falls
were forgotten, 26% at six months and 13% at one year; Hale et al204 found similar
results using comparable methodology. For the FRAT, recall bias may have resulted in an
under-estimate of falls prevalence, thus reducing the positive predictive value. It is
possible that a higher positive predictive value may be seen in practice.
Ensrud159 showed that a frailty score (consisting of weight loss, inability to rise from a
chair five times without using arms, and reduced energy level) predicted recurrent falls
over one year (AUC 0.61), fractures (AUC 0.64) as well as other frailty related outcomes
(death, institutionalisation).
The key characteristics of falls screening tools for use in the primary care are
summarised in Table 1.4.

7/22/2019 Preventing Falls in Older People 2008
http://slidepdf.com/reader/full/preventing-falls-in-older-people-2008 38/240
38
Table 1.4 Predictive value of published screening tools used in primary care
Study Uses previousfall in tool?
Sensitivity Specificity AUC
Stalenhoef et al 202 No 64% 71% 0.73
Tromp et al 201
Recurrent falls
Yes 0.71
Pluijm et al146 Yes 0.71
FRAT158 Yes 42% 92% Youden’sindex* 0.39;AUC~0.70205
Tromp et al 201
Any fall
Yes 54% 79% 0.65
Stel et al 203 Yes - - -
Ensrud159
Recurrent falls
No 0.61
With the exception of the Stalenhoef tool, which was specifically developed to able to
identify people at high risk of falls from routinely available primary care data, the
screening tools with the best predictive proprieties include previous fall as a ‘risk factor’.
It can be argued that identifying people who have fallen is more case-finding than
screening per se, though from a practical perspective, the distinction is not as important
as having a tool which is easy to use and has robust predictive properties.
1.3.9.4 Physical assessment scales
A variety of physical assessments have been tested for their ability to predict future falls
- the Tinetti balance and gait scale206, Physiological Profile Assessment (PPA)147 207, Timed
Get Up and Go Test (TUGT)208, Global Rating of Fall Risk (GLORF)209, the Modified Gait
Abnormality Rating Scale (MGARS), Physical Performance Test (PPT)210, Berg balance,
* For a two disease, two outcome measure (diagnostic testing) scenario, the area underthe curve is equivalent to (Youden’s index+1)/2, where Youden’s index equals sensitivity+ specificity

7/22/2019 Preventing Falls in Older People 2008
http://slidepdf.com/reader/full/preventing-falls-in-older-people-2008 39/240
39
ABC and reaction time211, and a variety of functional mobility assessments19, as detailed
in Table 1.5.
Table 1.5 Physical assessments of falls risk and reported predictive properties
Item Study Sensitivity Specificity
Areaunderthecurve
History of falls Nordin209 58% 76% 0.66
GLORF Nordin209 56% 80% 0.68
GUGm (high risk) Nordin209 7% 92% 0.62
TUGT 15 seconds Nordin209 96% 32% 0.69
TUGT 30 seconds
Women with vertebralfracture
Morris 2007150 33% 85% 0.60
PPA Laessoe 2007212 50% 43%
Two positives fromMGARS, history of falland PPT
VanSwearingen1998210
90% 87%
Sit-to-stand once ≥ 1s Tiedemann19 49%
Sit-to-stand five times ≥12s
Tiedemann19 66% 55%
Alternate-step test ≥ 10s Tiedemann19 69% 56%
Six-metre walk ≥ 6s Tiedemann19 50% 68%
Stair descent ≥ 5s Tiedemann19 63% 55%
Reaction time, total Bergscore and total ABC score
Lajoie,2004211 89% 96%
Aside from the necessity for a trained assessor to undertake these tests, the other main
limitation is that they are little better in predicting future fall than a history of previous
fall150.
1.3.9.5 Falls risk assessment tools
Once individuals have been identified as being at risk of falling on the basis of risk factors
or previous falls, there is a need then to identify the specific modifiable factors in that
individual that are amenable to intervention. This process of individualised assessment,
as opposed to risk stratification, lends itself to a structured assessment scale. Such
7/22/2019 Preventing Falls in Older People 2008
http://slidepdf.com/reader/full/preventing-falls-in-older-people-2008 40/240
40
scales are designed for use in individuals, rather than in populations, which can be a
source of confusion.
As individual practitioners and units will have their own approach to addressing falls
management with their individual clients, depending on local expertise and facilities,
there are an enormous number of assessment tools in the published literature. Rather
than complete an exhaustive search of these tools, the following section summarises the
findings from the 2004 NICE guidelines10.
The NICE guidelines state that in community dwelling older people and in extended care
settings (intermediate care, residential care, rehabilitation units), the important
assessment tools include:
• an assessment of balance and gait (for example, Timed Up and Go Test, Berg
Balance Scale)
• a multifactorial assessment addressing home hazards and individual risk factors
for falls
• in home care and residential settings, a Minimum Data Set (for example, that
developed by InterRAI 213) should be used to guide management.
Such tools are not considered further here.
1.3.9.6 Summary – screening tools
Despite the proliferation of screening tools which have been developed over the last 15
years, many of which are valid, few are better at identifying future falls than a history of
a previous fall. This phenomenon is seen in other frailty related conditions, such as
fracture214, in which the best predictor of future event is to have had the event already.
This highlights the difficulty of screening for frailty related outcomes (i.e. identifying
individuals at high risk before they have had the event).
The FRAT tool is the only published screening tool based on a UK population, albeit that
the evaluation was carried using self-reported recall of falls.

7/22/2019 Preventing Falls in Older People 2008
http://slidepdf.com/reader/full/preventing-falls-in-older-people-2008 41/240
41
1.4 Why do people fall?
Lord’s Physiological Profile Assessment215 provides an excellent understanding as to why
an individual might fall. As detailed in Figure 1.2, the upright posture is dependant upon
five key physiological mechanisms – vision, vestibular system, proprioception, central
control and muscle strength. Accumulative defects in these systems, for example
because of a disease process such as diabetes, leads to increased falls risk.
Figure 1.2 Schema for assessing falls (adapted from Lord, 2000207)
In addition to these intrinsic factors, extrinsic factors play an important part such as
environmental hazards and medication. The relative contribution of intrinsic and extrinsic
factors will vary from individual to individual, but it is likely that in most people, there will
be more than one cause for a fall (see 1.3.8). Figure 1.3 succinctly encapsulates the
potential contribution of intrinsic an extrinsic risk factors.
Central processing – integratesensory inputs and coordinateeffectors mechanisms
Proprioception
Effectormechanisms –
muscle strength
Vision
Vestibularsystem

7/22/2019 Preventing Falls in Older People 2008
http://slidepdf.com/reader/full/preventing-falls-in-older-people-2008 42/240
42
Figure 1.3 Factors that contribute to the risk of falls
Key:A = Patient with an accidental fall and no intrinsic or extrinsic risk factors
B = Patient with acute illnessC = Patient with moderate illness, loss of mobility and some prescription medicationswho falls because of an extrinsic factorD = Severely ill patient with many medications who falls even without extrinsic factorsE = Elderly patient with numerous age-related changes who falls because of an extrinsicfactor
From Steinweg KK. The changing approach to falls in the elderly. Am Fam Physician1997;56:1815-22,1823.
1.5 Interventions to prevent/reduce falls
Interventions to reduce falls in older people have been reviewed extensively in recent
years; a summary of the most recent reviews is presented here. One of the main reviews
influencing the 2004 NICE guidelines10 is the Cochrane systematic review on
interventions to reduce falls in older people9, due to be updated very soon216.
The 2003 Cochrane review assessed 62 randomised trials involving 21,668 people. The
main outcomes were the number of fallers, or falls. The main findings were that

7/22/2019 Preventing Falls in Older People 2008
http://slidepdf.com/reader/full/preventing-falls-in-older-people-2008 43/240
43
multidisciplinary, multifactorial, health/environmental risk factor screening/intervention
programmes in primary care both for an unselected population of older people (4 trials,
1,651 participants, pooled RR 0.73, 95%CI 0.63 to 0.85), and for older people with a
history of falling or selected because of known risk factors (5 trials, 1,176 participants,
pooled RR 0.86, 95%CI 0.76 to 0.98), were likely to be effective. This reflects the
multifactorial causes of falls discussed in previous sections. However, unifactorial
interventions can to be of benefit, namely:
• muscle strengthening and balance retraining, individually prescribed at home by a
trained health professional (3 trials, 566 participants, pooled relative risk 0.80,
95% CI 0.66 to 0.98)
• home hazard assessment and modification that is professionally prescribed for
older people with a history of falling (3 trials, 374 participants, RR 0.66, 95% CI
0.54 to 0.81)
• withdrawal of psychotropic medication (1 trial, 93 participants, relative hazard
ratio 0.34, 95% CI 0.16 to 0.74)
• cardiac pacing for fallers with cardioinhibitory carotid sinus hypersensitivity (1
trial, 175 participants, weighted mean difference -5.20, 95% CI -9.40 to -1.00)
• a 15 week Tai Chi group exercise intervention (1 trial, 200 participants, risk ratio
0.51, 95% CI 0.36 to 0.73).
They concluded ‘interventions to prevent falls that are likely to be effective are now
available; less is known about their effectiveness in preventing fall-related injuries…’
The Cochrane review was integrated into the NICE guidance10, which stated that ‘all older
people with recurrent falls or assessed as being at increased risk of falling, should be
considered for an individualised multifactorial intervention.’ NICE stipulated that such
programmes should consist of ‘strength and balance training, a home hazards
assessment and interventions, visual assessment and referral and a medication review

7/22/2019 Preventing Falls in Older People 2008
http://slidepdf.com/reader/full/preventing-falls-in-older-people-2008 44/240
44
with modifications.’ This guidance is consistent with recent Canadian evidence based
guidelines217.
The NICE guideline group went on to pool data from studies looking at unselected
community dwelling older people, recruited on the basis of age and domestic
circumstances, but not specifically falls risk factors. The pooled estimates showed that
multifactorial interventions are effective in reducing the proportion of fallers in the
intervention group (pooled relative risk reduction 0.73, 95% CI 0.63-0.85).
In a targeted population identified on the basis of falls status or known risk factors, the
pooled data showed a significant reduction in the proportion of fallers in the intervention
groups (RR 0.86, 95% CI 0.76-0.98).
Outside the remit of this PhD, but of interest, the NICE guidance did not find sufficient
evidence to be able to recommend multifactorial interventions specifically in extended
care settings or for people with cognitive impairment, but instead emphasised the need
to provide multifactorial interventions to targeted, high risk populations (irrespective of
domicile or cognition).
1.5.1 Compliance
A key issue with interventions for frail older people is compliance – or better still,
concordance. An intervention which is highly efficient (it works when taken/complied
with), but not acceptable to the population for which it is intended, may not be effective
in clinical practice.
The NICE guidelines examined this issue in some detail and showed that drop out rates
from falls interventions are significant (Table 1.6), with typical rates of around 20%.
Some of the drop outs will be unavoidable – mortality, change of residence etc, but some
will be related to the acceptability (or not) of the intervention.

7/22/2019 Preventing Falls in Older People 2008
http://slidepdf.com/reader/full/preventing-falls-in-older-people-2008 45/240
45
Table 1.6 Adherence to various falls prevention interventions (from NICE
guidelines10)
Type of intervention Drop out rates Follow up period
Tai Chi 20% 7-20 monthsHome hazards intervention 2-28% 12-18 months
Psychotropic medicationwithdrawal
68% 24 months
Cardiac pacing 9% 12 months
Untargeted multidisciplinaryinterventions
6-28% 12-36 months
Targeted multidisciplinaryinterventions
3-26% 3-18 months
Other investigators have highlighted the importance of the language used in encouraging
older people to attend such interventions218, suggesting a more positive approach,
emphasising healthy ageing rather than falls prevention. Programmes using more user
friendly strategies may see better adherence. Key enabling factors include ‘social
support, low intensity exercise, greater education, involvement in decision-making, and a
perception of the programmes as relevant and life-enhancing’, whilst barriers include
‘fatalism, denial and under-estimation of the risk of falling, poor self-efficacy, no previous
history of exercise, fear of falling, poor health and functional ability, low health
expectations and the stigma associated with programmes that targeted older people’ 219.
Herein lies the paradox – those most in need are least likely or able to access the service
that may confer benefit (‘differential challenge’). We know fall interventions work, but the
key issue is getting people at high risk of falls to attend.

7/22/2019 Preventing Falls in Older People 2008
http://slidepdf.com/reader/full/preventing-falls-in-older-people-2008 46/240
46
1.5.2 Published work on falls prevention since the 2003 NICE guidelines
The search strategy for this part of the literature review is detailed in 4.1.9.
1.5.2.1 Tai Chi
There has been a growing interest in Tai Chi as a potential strategy for falls prevention.
Initial trials failed to show any significant difference compared to ‘wellness education’
(placebo)78, though the confidence intervals for falls reduction were consistent with a
marked beneficial effect over 48 weeks (RR=0.75, 95% CI 0.52-1.08, p=0.10). A smaller
study was unable to show benefit from thrice weekly Tai Chi220. Li 2004221 showed a
reduction in falls following on from a programme of Tai Chi, but only in those patients in
whom an improvement in functional balance could be demonstrated.
In 2005 Li222 showed a reduction in falls (7% vs. 18%; p=0.03) compared with the
‘stretching-only’ control group. After adjusting for baseline covariates, the risk for
multiple falls in the Tai Chi group was 55% lower than that of the stretching control
group (risk ratio 0.45; 95% confidence interval, 0.30 to 0.70). Compared with the
stretching control participants, the Tai Chi participants showed significant improvements
following intensive Tai Chi (three times per week). Voukelatos223 also showed benefit
from once per week Tai Chi classes, the proportion of fallers after 24 weeks was 0.67
(95% CI=0.49-0.93, p=0.02).
These studies suggest that Tai Chi is a useful intervention to reduce both falls and
recurrent falls in community dwelling older people.
1.5.2.2 Interventions in specific populations
Increasingly, investigators have focussed interventions on specific populations.
Clemson224 showed a reduction in falls following a multifaceted community-based
program, for community dwelling older people who had already fallen in the previous
year: relative risk 0.69, 95% CI 0.50-0.96, p=0.025. Shumway-Cook28 was unable to

7/22/2019 Preventing Falls in Older People 2008
http://slidepdf.com/reader/full/preventing-falls-in-older-people-2008 47/240
47
show a reduction in falls following a community-based multifactorial intervention in a
community dwelling population (Incidence Rate Ratio (IRR) 0.75, 95% CI 0.52-1.09).
Weatherall225 carried out a meta-analysis and reinforced the prevailing view that
multifactorial interventions (OR 0.64, 95% CI 0.47-0.88) are superior to unifactorial
interventions in falls prevention (OR 0.81, 95% CI 0.58-1.14). But Gates et al 226 sparked
controversy with their meta-analysis of 19 multifactorial fall prevention programmes in
primary care, community, or emergency care settings, which showed no overall benefit
(risk ratio for the number of fallers 0.91, 95% CI 0.82-1.02). However, this paper was
roundly criticised for its methods – mainly inappropriate trial selection (namely including
trials in which the intervention was suboptimal or consisted of advice only), which at
present the authors do not appear to have rebutted.
More recent trials have focussed on pragmatic (effectiveness) trials as opposed to
explanatory (efficacy) trials. Pragmatic/effectiveness trials concern established clinical
services, and evaluate interventions delivered in routine clinical practice.
Explanatory/efficacy trials evaluate clearly defined, protocol driven interventions under
highly controlled conditions227 228. Using the analogy of drug trials, in an efficacy trial of
Aspirin, double blinding and careful control of all other conditions are used to ensure the
only difference between groups is the drug. In contrast an effectiveness trial will address
how Aspirin works in practice, and will be subject to real-life conditions, such as whether
trial participants actually take the drug, or abandon it because of side-effects etc.
A recent pragmatic RCT of a multifactorial falls prevention programme in New Zealand
also failed to show any evidence of benefit (n=312, mean age 81, IRR 0.96 95% CI 0.70-
1.34), which the authors tentatively ascribe to inadequate follow through of referrals to
the relevant professionals229. Similarly negative findings over 12 months were found in a
pragmatic RCT of a multifactorial falls prevention programme delivered to older people
attending the emergency department following a fall carried out in the Netherlands
(n=333, OR 0.86, 95% CI 0.50–1.49)230. These two trials raise concerns about the

7/22/2019 Preventing Falls in Older People 2008
http://slidepdf.com/reader/full/preventing-falls-in-older-people-2008 48/240
48
application of the evidence base in clinical practice – the difference between efficacy and
effectiveness.
Lord231 assessed a group exercise programme in frail older people living in intermediate
or sheltered care settings, and showed a reduction in falls rates (IRR=0.69, 95%
CI=0.48-0.99). Suzuki232 showed a reduction in fallers from 13.6% in the intervention
group, compared to 54.5% (p = 0.0097) at 20 months in Japanese elders attending a
comprehensive geriatric assessment and receiving an exercise intervention, though the
numbers were small (52 in total). Weerdesteyn233 showed a reduction in falls in people
attending a falls service (IRR 0.54, 95% CI 0.34-0.86).
Morgan234 suggested that a low intensity exercise programme may be of benefit in the
convalescent setting, but only in those with limited baseline function. Nikolaus235
reinforced the importance of addressing home hazards in a high risk populations
(recently admitted to hospital with functional decline) in reducing falls (IRR 0.69, 95% CI
0.51-0.97). Though in a similar Australian population, Latham et al 236 failed to show any
benefit from 10 weeks of high-intensity home-based quadriceps resistance exercise or
vitamin D (calciferol 300,000 International Units).
Shaw237 evaluated a multifactorial programme in patents with dementia presenting to an
emergency department with a falls and showed no reduction in the proportion of fallers
(relative risk ratio 0.92, 95% CI 0.81 to 1.05). Similar results were seen in cognitively
intact older people with recurrent falls (RR for the total number of falls 0.64, 95% CI
0.46-0.90) – but no change in the proportion of fallers.
Ashburn238 showed a non-significant trend towards a reduction in falls in patients with
Parkinson’s disease with a history of falling using a personalised exercise strategy.
Campbell239 showed that a home safety programme was superior to an exercise
programme in reducing falls in people with visual impairment (≤6/24). Harwood240
showed a reduction in falls rates in patients undergoing expedited cataract surgery (IRR
0.66, 95% CI 0.45-0.96, p=0.03), though the study was unable to show a significant
result for second eye surgery241. A larger study (n=616) showed an increase in falls in

7/22/2019 Preventing Falls in Older People 2008
http://slidepdf.com/reader/full/preventing-falls-in-older-people-2008 49/240
49
older people attending a geriatric service referred for visual correction (IRR 1.57, 95% CI
1.20-2.05, p=0.001)242. The authors posited a variety of explanations for this finding, the
most plausible of which were differential reporting bias (those in the control group may
have been less motivated to report falls), increased activity or a period of increased risk
during a period of adjustment in the visual aid group.
Additional work has looked at refining falls interventions. For example, Barnett77 looked
at group exercise (including Tai Chi) over one year against falls education and showed a
reduction in falls rate (IRR=0.60, 95% CI 0.36-0.99). Other investigators reported
benefits such as increased confidence and mobility from enhanced balance training over
six weeks, but did not record falls as an end-point243.
Other unifactorial interventions however, have not been able to demonstrate a reduction
in falls, including 15 weeks of physiotherapy244, 12 weeks of physiotherapy245 (small
trials); Lord 2005 246 and Liu-Ambrose 2004 247 showed a reduction in falls risk
(measured using Lord’s Physiological Profile Assessment), but not falls. Means248 was
able to show a reduction in falls following six weeks of exercise, which included an
obstacle course. Sakamoto45 failed to showed a reduction in falls burden from unipedal
standing. But 36 weeks of specific falls prevention directed physiotherapy, including
balance training reduced falls (IRR 0.66, 95% CI 0.49–0.90), as did a fitness intervention
in apparently low risk individuals recruited from a health insurance company database,
RR = 0.77, 95% CI 0.60-0.97)249.
Campbell12 has suggested that well conducted unifactorial intervention might be effective
for primary care based prevention. This was based on a meta-analysis of trials meeting
the following relatively stringent criteria:
• participants were randomly allocated to intervention and control groups
• all participants were aged 65 years or older
• the majority lived independently in the community

7/22/2019 Preventing Falls in Older People 2008
http://slidepdf.com/reader/full/preventing-falls-in-older-people-2008 50/240
50
• fall events were recorded prospectively using a diary or calendar during the entire
trial and monitored at least monthly
• follow up was for 12 months or longer
• at least 70% of participants completed the trial
• all falls during the trial for at least 50 participants were included in the analysis
• a relative rate ratio with 95% CI comparing the number of falls in the intervention
and control groups was reported.
This meta-analysis identified 14/90 falls prevention trials including 5,968 individuals
meeting the above criteria. The meta-regression showed that single interventions were
as effective in reducing falls as interventions with multiple components (pooled rate
ratios 0.77, 95% CI 0.67–0.89 and 0.78, 0.68–0.89 respectively). A sensitivity analysis,
using less stringent selection criteria identified 27 interventions involving 8,380
individuals, but this also failed to shown any trend toward multifactorial programmes
being more effective.
1.5.2.3 Vitamin D
There is a growing body of evidence suggesting a role for vitamin D in reducing falls250-
254, including in patients with renal impairment255-257. A systematic review suggested that
vitamin D supplementation is effective in reducing falls by up to 20%258.
1.5.2.4 Medication reviews
Haumschild259 and colleagues used a pre-post design to look at a fall-focused
pharmaceutical intervention and showed a 47% reduction in falls in the intervention
group. Huang260 showed a home hazards assessment combined with a focus on
medication safety reduced falls, though this was a small, quasi-randomised study.
Zermansky261 showed a reduction in the number of falls per person following a
pharmacist medication review in a large RCT of care home residents (n=661, 0.8 vs. 1.3
falls per patient, p< 0.0001) Pit262 showed a reduction in the proportion of falls through

7/22/2019 Preventing Falls in Older People 2008
http://slidepdf.com/reader/full/preventing-falls-in-older-people-2008 51/240
51
the implementation of a broad based educational programme given to GPs in an
Australian cluster RCT (n=849, adjusted OR 0.61, 95% CI 0.41-0.91). Another
educational intervention aimed at primary care, using a review of electronic prescribing
records and advice to the prescriber, failed to show any reduction in falls263.
1.5.2.5 Injurious falls
NICE and the Cochrane reviewers concluded that there is uncertainty around the
effectiveness of multifactorial falls prevention programmes in reducing injurious falls.
This is important, as the morbidity and mortality resulting from falls is attributable to
injurious falls, rather than fall per se. An intervention which for some reason reduced
falls, but had little or no impact upon injurious falls, may not achieve the desired
outcome of improving well being and reducing morbidity or mortality.
McClure and colleagues carried out a Cochrane systematic review aimed at identifying
population-based intervention effective in reducing falls-related injuries amongst older
people264. The methodology was robust, though on this occasion study heterogeneity
precluded a meta-analysis. Perhaps unsurprisingly, the reviewers did not find any
randomised studies addressing this issue at the population level – as opposed to targeted
populations described in the previous section. Such large scale randomised trials are
extremely unusual, given the practical difficulties and costs of carrying out such studies
(see 3.2.3.1.2).
The reviewers did identify six controlled studies addressing injury reduction, including
multifactorial educational interventions aimed at health care professionals and
individuals265 as well as provision of safer environments266-270 and in one study,
widespread promotion of Tai Chi271. All six studies reported benefits in the intervention
groups, ranging from 6-33% relative risk reduction. The reviewers concluded that though
evidence was far from certain, given the methodological limitations of these large scale
trials (internal validity, external generalisability, limited comparator groups, uncertain
ascertainment and positive publication bias, regression to mean and confounding by
secular trends), the studies support the preliminary claim that a population-based

7/22/2019 Preventing Falls in Older People 2008
http://slidepdf.com/reader/full/preventing-falls-in-older-people-2008 52/240
52
approach to the prevention of fall-related injury is effective264. The most recent study
from Tinetti et al 55 which was a pragmatic, non-randomised evaluation of falls prevention
services in the US, showed a 9% reduction in serious fall-related injuries. Day et al 272
have predicted similar outcome in Australia.
There is a large body of studies addressing fracture reduction specifically, often using
pharmacological treatments, but not usually including interventions to reduce falls and
fractures combined273. These studies have not been addressed in this work.
1.6 Setting for interventions
Most falls prevention studies in community dwelling older people have delivered the
intervention in the primary care setting, in which the interventions are delivered by staff
working in the community, and with general practitioners providing the medical
intervention28 29 224 231 249 274-277. The advantage of this model is that treatments are
delivered in the context of an established relationship between patients and their carers,
rather than the intervention being delivered by secondary care specialists, who may have
no long term relationship with the patients. No trials have evaluated a falls prevention
programme delivered in a secondary care setting against one in a primary care setting.
The consensus appears to be that the components of a successful falls prevention
intervention are strength and balance training, home hazards assessment and
medical/medication review; the setting in which these components are delivered is of
less importance, as long as it is acceptable to the intended participants.
One systematic review has looked at the benefit of day hospital for older people against
other forms of comprehensive care. Including papers up until 1999, Forster et al278 found
that day hospitals are effective in terms of death or poor outcome, disability, and use of
resources compared to no comprehensive care, but hold no advantage over other
settings. A search on Medline and EMBASE using a similar search strategy did not reveal
any additional studies of relevance to falls prevention.

7/22/2019 Preventing Falls in Older People 2008
http://slidepdf.com/reader/full/preventing-falls-in-older-people-2008 53/240
53
There is no particular reasons to suspect that a falls programme delivered in a day
hospital would have any advantage over a primary care delivered intervention – indeed
the opposite is more likely to be true, as care closer to home is likely to see better
compliance.
1.7 Summary of the literature review
Falls are a common problem for older people, with 24% of people aged over 65 years
falling at least once every year. The method of falls reporting has a critical influence on
rates, with more frequent follow up resulting in a greater number of falls being
ascertained. Falls incidence is around 1.7 falls per person per annum using such
methods.
Fear of falling is an important consequence of falls and has a set of risk factors in
common with falls. Interventions to reduce falls are likely to reduce fear of falling as long
as there is an improvement in overall function. The management of depression in fallers
is more complex, and though there are similarities with fear of falling in the shared risk
factors and interventions, pharmacological treatment of depression may increase the risk
of falls.
Falls are the leading cause of trauma in older people and a prime cause of fracture; they
are also a major cause of mortality in older people. Falls have as similar impact on
hospital services to other major conditions such as stroke and myocardial infarction. Falls
are a cause of carer strain, though this is poorly studied, and are a leading cause of
admission to long term care.
Screening for falls is confounded by the fact that the best predictor of future fall is a
previous fall, so most falls screening tools serve a case finding function as much as
perform a true screening function. Nevertheless, multifactorial interventions delivered to
previous fallers and others at high risk have been effective in reducing falls rates by
around 15%. The best evidence is for multifactorial interventions, though targeted
unifactorial interventions (including Tai Chi, medication reviews and vitamin D) can be
7/22/2019 Preventing Falls in Older People 2008
http://slidepdf.com/reader/full/preventing-falls-in-older-people-2008 54/240
54
equally beneficial. More recent studies have cast doubt on the effectiveness of
multifactorial falls prevention programmes (as opposed to the efficacy as demonstrated
in clinical trials).
1.8 Research questions
The literature review has highlighted that screening for community dwelling older people
at high risk of falling can be done, but there is no prospectively evaluated tool that has
been tested in the United Kingdom. The first research question then was ‘can a falls risk
screening tool identify community dwelling older people at high risk of falls and can it
identify those at low risk of falling?’
The second research question identified in the literature review concerns the
effectiveness, as opposed to the efficacy, of a falls prevention programme – ‘does a
multifactorial falls prevention programme, delivered in a day hospital, reduce the rate of
falls in community dwelling older people identified by a screening process as being a high
risk of future falls?’
1.9 Overview
This thesis describes two main studies: an evaluation of a falls screening tool (referred to
as the cohort study) and a randomised controlled trial (Figure 1.4). Both the cohort study
and the RCT share similar methodology regarding ascertaining outcomes.
All participants in the cohort study were asked to complete a screening questionnaire.
Those at high risk were first invited to participate in the RCT. If they declined, they were
invited to participate in the cohort study, along with those individual as low risk of falls.
Prospective data collected from the cohort was used to validate the screening
questionnaire (chapter 2). Those screened as being at high risk and entered into the RCT
were allocated to a multifactorial day hospital intervention or control (usual care). The
primary outcome measure was the rate of falls (chapter 3). These form the two main
components of this work - developing a screening tool and evaluating a falls prevention

7/22/2019 Preventing Falls in Older People 2008
http://slidepdf.com/reader/full/preventing-falls-in-older-people-2008 55/240
55
programme. A concomitant economic analysis has been undertaken but is not discussed
in this thesis.
Figure 1.4 Study outline
≥70 years old ®istered withparticipating GP
Excluded
by GP
Potentiallyeligible
Baseline data
RCTScreeningcohort
DeclineExclude
Riskstratification

7/22/2019 Preventing Falls in Older People 2008
http://slidepdf.com/reader/full/preventing-falls-in-older-people-2008 56/240
56
2 SCREENING
2.1 Definitions
Several different definitions of screening exist, but the essence is to
identify a population at an early stage in a disease process, and to then
provide an intervention which prevents more serious consequences of the
disease manifesting at a later stage.
Screening has been defined as ‘applying a test to a defined group of
persons in order to identify an early stage, a preliminary stage, a risk
factor or a combination of risk factors of a disease. The object of screening
as a service is to identify a certain disease or risk factor for a disease
before the affected person spontaneously seeks treatment, in order to cure
the disease or prevent or delay its progression or onset by (early)
intervention’ (Council of Europe)279.
An alternative definition of screening is ‘a public health service in which
members of a defined population, who do not necessarily perceive they are
at risk of, or are already affected by, a disease or its complications, are
asked a question or offered a test to identify those individuals who are
more likely to be helped than harmed by further tests or treatment to
reduce the risk of disease or its complications’ (UK National Screening
Committee)280.
Screening is but one method of disease management, which can be
considered as having four possible levels of intervention. Primordial
prevention is concerned with establishing conditions that minimise the
hazards to health by preventing the development of risk factors or
underlying conditions leading to causation; these are typically
environmental factors (economic, social or behavioural)281. An example
relating to falls might include reducing socio-economic deprivation, which

7/22/2019 Preventing Falls in Older People 2008
http://slidepdf.com/reader/full/preventing-falls-in-older-people-2008 57/240
57
has been linked with an increase in hospital admission rates related to
falls282. For primordial prevention, interventions are made at the population
level.
Primary prevention is directed at specific causal factors, usually at the
population level, such as increasing levels of physical activity in the
population as a whole. More targeted primary prevention might define a
population in whom specific risk factors are known to be prevalent, and
provide an intervention. An example related to falls might include giving
calcium and vitamin D supplements to prevent falls in care home
residents168, irrespective of a given individual’s vitamin D status.
When the risk factor for a disease process is continuous measure, such as
vitamin D levels and the risk of falling, there are two possible approaches.
Firstly, to introduce population level changes which shift the distribution of
the risk factor to the left. This might include supplementing the
population’s diet with vitamin D – by way of example, margarine has added
vitamin D. This achieves a greater reduction in the population attributable
risk (see 2.4.2). Secondly, prevention could focus on those at highest risk
alone (such as individuals with severe vitamin D deficiency). Individuals
with very low levels of serum vitamin D will be at the highest risk of
developing myopathy or muscle weakness and so have a higher risk of
falling, but the greatest population effect is seen by increasing the vitamin
D levels of those at intermediate or even low risk. Screening is not required
with a population level approach, but the consequence is that low risk
individuals are included that may not benefit from the intervention. If an
intervention has the potential to cause harm (such as vitamin D induced
hypercalcaemia), then the absolute benefit obtained may be reduced.
Secondary prevention is directed at slowing the progression of a disease
identified at an early stage and preventing more serious consequences,

7/22/2019 Preventing Falls in Older People 2008
http://slidepdf.com/reader/full/preventing-falls-in-older-people-2008 58/240
58
such as injury related to falls. A example of secondary prevention might be
the use of hip protectors in someone who falls frequently283.
Tertiary prevention is used at a late stage in a disease processes and is
mainly restorative or adaptive284. An example might include rehabilitation
following a hip fracture resulting from a fall, either by improving balance
and gait (restorative) and/or by improving stability by providing a walking
frame (adaptive).
2.2 Criteria for a successful screening programme
The most commonly cited criteria against which the suitability of a
proposed screening programme may be assessed are those conceived by
Wilson & Jungner in 1968285:
• the condition should be an important public health problem
• there should be an accepted treatment
• facilities for diagnosis and treatment should be available
• there should be a recognisable latent or early asymptomatic stage
• there should be a suitable test
• the test should be acceptable to the population
• the natural history of the condition should be understood
• there should be an agreed policy on whom to treat as patients
• the cost of case-finding should be economically balanced in relation
to the possible expenditure as a whole
• case-finding should be a continuing process.
It is useful to consider the case for screening for falls on a point by point
basis.

7/22/2019 Preventing Falls in Older People 2008
http://slidepdf.com/reader/full/preventing-falls-in-older-people-2008 59/240
59
2.2.1 The condition should be an important public health problem
Key determinants of the importance of a public health problem include the
frequency of the problem, the impact on individuals and the impact upon
society, in terms of costs and resource use. For example, synringomyelia
(a progressive neurological condition) can have a major impact upon
individuals and their carers, but is relatively rare and so not a major public
health problem (which is not to say that it is not important). By contrast,
falls in older people are common (24% of people aged 65 plus fall each
year), may have serious consequences, including fracture286 and are a
major determinant of health and social costs in the United Kingdom287, thus
making falls a major public health issue.
2.2.2 There should be an accepted treatment
Several studies or reviews have highlighted the efficacy of a multifactorial
assessment and intervention falls prevention programme, which can reduce
falls in a variety of settings, typically by around 25%10 12 288.
2.2.3 Facilities for diagnosis and treatment should be available
Most previous studies rely on self reporting of falls, as indeed does clinical
practice. There is no ‘gold standard’ test for falls, other than a good
collateral history. Medically verified falls are used to add some degree of
validity to self-reporting, but using this technique alone will inevitably lead
to under reporting (minor falls may not be reported to the general
practitioner). So ‘diagnosing’ a fall is difficult - indeed from the clinical
perspective, falls are not a diagnosis but a symptom of other underlying
problems which require a diagnosis.
A variety of facilities or services are available for the identification and
management of people who fall. These can be divided into primary care
services (falls prevention schemes, general practitioner, intermediate care

7/22/2019 Preventing Falls in Older People 2008
http://slidepdf.com/reader/full/preventing-falls-in-older-people-2008 60/240
60
services) or secondary care services (geriatric day hospitals, falls clinics).
Often a combination of resources is used in the management of any one
individual and as such there is not one single discrete locus for diagnosis
and care.
2.2.4 There should be a recognisable latent stage
Many cohort studies and case-control studies have identified risk factors for
falling14 15 34 143 168 201 207 289-296. Randomised control trials have
demonstrated that intervening on the reversible risk factors can reduce
subsequent falls8 9 31 33 36 297-299. Interventions provided to the high risk
individuals have been successful in reducing falls. It is generally accepted
that there is a latent stage during which an individual is at risk, for
example because of reduced balance and mobility, but has not yet fallen
(see 1.4).
2.2.5 The natural history of the condition should be understood
The natural history of falls is reasonably well understood, namely an
accumulation of intrinsic risk factors, combined with extrinsic risk factors,
triggering a fall (see 1.4). In essence, there is a threshold at which we are
all at risk of falling. Extrinsic factors (accidents) can overwhelm this
threshold and give rise to a fall. Additionally, cumulative intrinsic factors
lower the threshold for falling (muscle weakness, reduced balance). Many
of these factors are potentially reversible, as is the risk of falling. Different
risk factors are associated with different magnitudes of risk.
2.2.6 There should be a suitable and acceptable test
This point usually refers to a biological test for a condition, which does not
apply to falls. The joint British Geriatrics Society/American Geriatrics
Society guidelines advocate the use of the ‘get up and go test’ to indicate
the risk of an individual falling300. Screening tools are reasonably good at

7/22/2019 Preventing Falls in Older People 2008
http://slidepdf.com/reader/full/preventing-falls-in-older-people-2008 61/240
61
differentiating people at high versus low risk of future fall, typically with a
sensitivity of 50-60% and specificity of 80%202 (see 1.3.9.6).
2.2.7 There should be an agreed policy on whom to treat
There is general guidance on who should be considered for falls reduction
strategies (National Service Framework for Older People2 and guidance
from the National Institute of Clinical Excellence10) but as people who fall
represent such a heterogeneous population, it is not possible to be precise
as to who should and who should not be treated. In general terms, an
individual with an isolated fall and no other risk factors for falling, such as a
gait disturbance, would not be considered for a falls prevention
programme10 300. Current practice is mainly opportunistic, whereas this
thesis will examine the role of a more systematic approach.
2.2.8 The cost of case-finding should be economically balanced
Screening and a concomitant cost analysis in the primary care setting for
individuals thought to be at risk of falling has not taken place in the United
Kingdom.
2.2.9 Case-finding should be a continuing process
Current recommendations state that all people over 70 should be asked
about falling on an annual basis10 300, and assessments offered to those
thought to be at high risk.
2.2.10 Summary
It appears that there is a theoretical role for screening for people at risk of
falling and offering an intervention, but some of the key questions needed
to justify a large scale screening programme have yet to be answered.
These include having a robust screening tool, and determining the costs of
a screening programme and the associated intervention.

7/22/2019 Preventing Falls in Older People 2008
http://slidepdf.com/reader/full/preventing-falls-in-older-people-2008 62/240
62
2.3 Benefits and adverse effects of screening
In the United Kingdom, screening programmes have centred on non-
communicable diseases with a pre-symptomatic phase, where interventions
during the pre-symptomatic phase can prevent progression to overt
disease. Examples include cervical cancer, breast cancer and
cardiovascular disease. Potential advantages of screening are the
prevention of disease, improvement in quality of life (through avoiding ill-
health), reduction in mortality and cost savings. Screening has potential
disadvantages as well as advantages, such as:
• delay in diagnosing false negatives
• the effects, side effects and psychological distress relating to
potentially invasive clinical diagnosis of false positives
• psychological distress where there is no cure for the disease or
where the treatment and/or intervention is unacceptable to the
individual concerned
• individuals who are positively screened might experience difficulties
such as access to insurance, employment or social stigmatisation
• unfavourable cost-benefit relationship of a screening programme
Relating to falls, screening may increase fear of falling by alerting people to
previously unrecognised risk, for example. The costs of a systematic falls
screening programme are not known, so it is possible that the cost may
outweigh the benefits.
2.4 Screening terminology
2.4.1 Prevalence and incidence
The prevalence of a disease is the number of cases in a defined population
at a specified point in time whereas the incidence of a disease reflects the

7/22/2019 Preventing Falls in Older People 2008
http://slidepdf.com/reader/full/preventing-falls-in-older-people-2008 63/240
63
number of new cases arising in a population in a given period301. The two
measures provide different and complimentary information. For a chronic
condition such as multiple sclerosis, the incidence may be low but the
prevalence high. This is because there are relatively few new cases of
multiple sclerosis each year, but once contracted it is (usually) permanent,
so increasing the prevalence. This is in contrast to short-lived conditions
such as the common cold, in which the incidence in one year may be high
(we all get colds) and the prevalence low, as at any one time only a
relatively few people will be affected.
Point prevalence refers to the prevalence at any given point in time; an
alternative measure is period prevalence, which is the number of people
affected by a disease in a specified period. Prevalence is influenced by the
severity and duration of the illness as well as the incidence and diagnostic
accuracy.
Incidence is the number of newly identified cases occurring over a period of
time. The incidence rate is given as the number of new cases detected
during a defined period of time, divided by the sum of the length of time at
which each person is at risk. Incidence rates are often measured in events
per person-year.
An alternative measure of incidence is cumulative incidence, which
measures the number of new cases divided by the number of disease-free
individuals at the beginning of the period (and is a proportion). This
measure is useful for comparing risk of disease in different populations.
The third possible measure of incidence is the odds of disease, a measure
of the number of new cases in a given period divided by the number of
‘disease-free’ individuals at the end of the study period. Odds can also be
calculated for prevalent cases.

7/22/2019 Preventing Falls in Older People 2008
http://slidepdf.com/reader/full/preventing-falls-in-older-people-2008 64/240
64
2.4.2 Measures of effect and impact on populations
The population attributable risk (PAR) is the amount of risk that can be
reduced if the risk for the exposed group was reduced to that of the risk of
the unexposed. The PAR is derived from measures of relative risk. To
calculate the relative risk, we need to know the rate (incidence - 2.4.1) or
the risk in the exposed (r1 - in this case individuals at high risk of falling)
and the unexposed (r0 - low risk); the rate ratio is r1 / r0.
An alternative measure of effect is the risk difference, which reflects the
excess risk in the exposed population: risk difference = r1 - r0. It is
important to recognise that risk difference assumes causality, which is an
over-simplification, as in practice, few diseases have a single causative
factor. Risk difference further assumes that removal of the risk factor will
reduce risk in the exposed group to the level of risk in the unexposed
group, again an over-simplification.
Given the assumptions made in estimating risk differences, a more useful
measure of effect is the risk difference percent (also the ‘attributable
fraction’) – the proportion of cases that could have been prevented in the
exposed group if they had not been exposed.
Risk difference percent (RD%) = (r1- r0) / r1
Measures of effect tell us little about the impact upon a population; the
impact measures the amount of disease in a population that could be
prevented if the exposed became unexposed (assuming causality). The
impact of an exposure on a population depends upon the prevalence of the
exposure and is called the population attributable risk (PAR): R – r0, where
R is the rate in the whole population and is given by the weighted sum of r0
and r1, weighted by the prevalence (p) of the risk factor in the population:
R = pr1 + (1-p)ro. By rearranging the equation PAR = p(r1- r0).

7/22/2019 Preventing Falls in Older People 2008
http://slidepdf.com/reader/full/preventing-falls-in-older-people-2008 65/240
65
As with risk difference, this is more usefully expressed as a percentage –
the proportion of all cases in the whole population that may be attributable
to the exposure: population attributable fraction (PAF) = p(r1- r0)/R. The
PAF can also be estimated from risk ratios (or odds ratios in a case-control
study): p(RR-1) / [p(RR-1)+1].
Or, more simply, the PAR equals the attributable risk multiplied by the
proportion of the population exposed.
2.4.3 Sensitivity and specificity
Sensitivity refers to how good a test is at identifying people who have a
disease; specificity reflects how good a test is at identifying those who do
not have the disease302. These are crucial to determining the effectiveness
of a screening programme. Taking the screening questionnaire to be used
in this study, the aim is to identify those that are at high risk of falling.
Ideally, it should be sensitive (correctly identifying all of those that fall)
and specific (excluding those that do not fall); this is best represented in a
two by two table (Figure 2.1).
Figure 2.1 Sensitivity and specificity
Falls status
Fall in the futureNo fall in thefuture
Total
High riska
True positives
b
False positivesa + b
S c r e e n i n g
q u e s t
i o n n a i r e
Low riskc
False negatives
d
True negativesc + d
Total a + c b + d a + b + c + d
Sensitivity is a/(a + c) and specificity is d/(b + d), both expressed as a
percentage. There will inevitably be a trade off between sensitivity and
specificity; for example, a test which is always positive will have 100%

7/22/2019 Preventing Falls in Older People 2008
http://slidepdf.com/reader/full/preventing-falls-in-older-people-2008 66/240
66
sensitivity but the specificity would be 0% and so the test would be
clinically useless. Assuming that the intervention is relatively harm-free,
the ideal properties of the screening tool would be high sensitivity with less
emphasis on specificity. But a reduced emphasis on specificity may result
in individuals being assessed that are not going to benefit. A good
screening test will have high sensitivity and specificity (above 95%), but
the optimal values for a particular screening test (using a continuous
measure) will be determined by a receiver-operator characteristic curve
(ROC curve). The ROC curve plots sensitivity against (1-specificity); the
area under the curve (AUC) can be calculated, and the higher this value,
the more discriminatory the test.
Perhaps more clinically useful in the context of a screening questionnaire
are the positive predictive value (PPV) and the negative predictive value
(NPV). The crude PPV give the probability of having a falls when the
screening tool identifies the individual as being at high risk: a/(a + b). The
crude negative predictive value gives the probability of the individual not
falling when they are screened as being at low risk: d/(c + d).
As the prevalence of a condition changes, the predictive value of the test
will change, even though the sensitivity and specificity remain constant.
This is important, as a test with a high PPV in one context will may have a
lower PPV in another context where prevalence is lower; it means that
screening tests from one setting cannot always be reliably adopted in
another where prevalence is different.
2.5 Development of a screening tool
The screening tool is a health measurement scale and if it is to be of use in
future falls screening programmes, it needs to be valid (it needs to do what
it sets out to do) and reliable. The screening tool used in this study is a

7/22/2019 Preventing Falls in Older People 2008
http://slidepdf.com/reader/full/preventing-falls-in-older-people-2008 67/240
67
postal questionnaire, designed to select out older people living in the
primary care setting who are at high risk of falls over the following year.
2.5.1 Developing an item pool
The first step for developing a health outcome measure is to develop an
item pool. These items should be known to be associated with the outcome
of interest. Where an outcome has been well studied, such items might be
drawn from a review of the literature. Where an outcome has been less
well studied, the items will need to be generated de novo, typically by
using qualitative methods such as key informant interviews, to generate
the domains relevant to the outcome.
2.5.2 Validity
There are three forms of validity – face validity, content validity and
construct validity.
2.5.2.1 Face validity
Face validity ‘indicates whether, on the face if it, the instrument appears to
be assessing the desired qualities’ 303. This is usually measured subjectively,
typically by a panel of experts; the Delphi technique304 can be useful in this
process. The Delphi process is a structured approach to establishing face
validity of items under consideration for an outcome measure. Once the
item pool has been generated, the items are collated and sent out to a
group of experts in the field. These experts usually include content experts
(clinicians), both researchers in the field and practitioners, and should be
interdisciplinary. The interdisciplinarity of the group is crucial to ensure
that the items selected are valid, relevant and reasonable305. The Delphi
group should ideally include representatives from various sectors, such as
primary and secondary health care306 and may include patients or patient
representative bodies. Delphi groups are usually quite large, numbering

7/22/2019 Preventing Falls in Older People 2008
http://slidepdf.com/reader/full/preventing-falls-in-older-people-2008 68/240
68
many tens or even hundreds of participants. The panel should vote on each
item, indicating how valid they felt it was, the results would then be
collated and items selected on the basis of their overall ranking.
An alternative to the Delphi technique is the Nominal Group technique,
more typically used in constructing guidelines, though equally useful for
assessing face validity. The principles are similar to the Delphi technique,
in that the group should be interdisciplinary, but the group size is smaller,
and should assemble for a face to face meeting307. At the meeting, each
item would be discussed and then voted on in a structured manner, with
each participant being given the opportunity to comment. A disadvantage
of the nominal group technique is that more verbose members may
dominate proceedings and some stakeholder may not contribute as fully.
Once the items have been selected on the basis of their face validity, it is
reasonable to then check the items with patients to check face validity from
the patient perspective, although patients should be represented on the
panel in any case.
2.5.2.2 Content validity
Content validity assesses ‘the extent to which the measurement
incorporates the domain of the phenomenon under study’ 281. To have
acceptable content validity, a tool should include items reflecting the range
of concepts relating to the question. For example, if asking about functional
health status, the tool should include items not only relating to physical
health, but cognition, activities of daily living, social aspects and so on. It is
possible to assess the properties of a tool against a gold standard if one
exists, comparing the result obtained with the new tool against similar
items in the gold standard, known as criterion validity.

7/22/2019 Preventing Falls in Older People 2008
http://slidepdf.com/reader/full/preventing-falls-in-older-people-2008 69/240
69
2.5.2.3 Construct validity
Construct validity reflects whether the measurement of the construct
adequately represents what is intended by theoretical account of the
construct being measured, by using various forms of validity checks. For
example, do the observed results from a screening questionnaire confirm
the expected results? It would be expected that those that screen as high
risk, do in reality fall more often than those screened at low risk.
Other important areas include convergent validity and sensitivity to
change.
2.5.2.4 Convergent validity
Convergent validity for an outcome measure is used when the items are
being generated de novo, and involve comparing patient’s self-reported
data for the measure against either spouse or peer-reports for the patient.
This data helps establish confidence in the accuracy of the self-reported
measure.
Convergent validity can also be examined by looking at the scale’s
relationship with other outcome measures included in a study. By exploring
these relationships further validity for the scale can be established by
showing expected relationships with other measures relevant to falls (e.g.
fear of faling).
2.5.2.5 Sensitivity to change
For health measurement scales, sensitivity to change is very important –
does the outcome measure score change as the patient’s condition changes
or once an intervention has been applied. However, for a screening tool,
this property is not so relevant.

7/22/2019 Preventing Falls in Older People 2008
http://slidepdf.com/reader/full/preventing-falls-in-older-people-2008 70/240
70
2.5.3 Reliability
Reliability examines the concept of reproducibility – the tool should
produce similar results for questions asked of the same individual at
different times or by different interviewers. Reliability is usually measured
as a ratio (score 0-1) of the variability between individuals compared to the
overall variability; there are various possible measures of reliability
described below.
2.5.3.1 Internal consistency
For large questionnaires, several items may correlate with each other.
Using the example of a functional health questionnaire, it is likely that
there will be several items assessing physical function. These can be
correlated, for example using Cronbach’s alpha308. Correlations amongst
items measuring similar attributes should be in the range of 0.7-0.9309.
2.5.3.2 Stability
The stability of responses to a tool can be assessed between observers
(inter-observer reliability) or ‘within’ observer (the same observer
obtaining the same result on different occasions (intra-observer reliability).
It can also be assessed by checking to see of the same respondent
provides the same answers at different times (test-retest reliability); this
however assumes that the item being tested should provide a consistent
response over time (not the case with falls for example). There are no
clearly defined gold standards by which to measure reliability, but it is
generally accepted that measures of reliability should be above 0.7302.
2.5.4 Development of the screening tool
It can be seen from the above sections that the development of a valid and
reliable screening tool represents a large body of work, including a
literature review, convening an interdisciplinary panel and a series of

7/22/2019 Preventing Falls in Older People 2008
http://slidepdf.com/reader/full/preventing-falls-in-older-people-2008 71/240
71
validity and reliability checks, which would require studying a large cohort
of participants. Fortunately, previous work in the United Kingdom had
already identified a set of items (Table 2.1) suitable for inclusion in a fall
screening tool (FRAT158), which was modified for use in this study. We
considered if the existing items were useful and further considered
additional possible items.
Table 2.1 Items included in the FRAT
History of falling in the previous year,
Taking four or more prescribed medications,
History of stroke
History of Parkinson’s disease
Reported problems with balance
Loss of proximal muscle strength
The aim of the screening tool was to gather information from community
dwelling older people using a postal questionnaire. The information
gathered should differentiate between individuals who go on to fall and
those that do not. The questionnaire should be brief, easy to understand
and reliable.
2.5.4.1 Selection of items for inclusion in the screening tool
Questions about cognitive impairment (see 3.4.3.1.1) were deemed
inappropriate on a postal questionnaire, because of the practical difficulties
in obtaining an accurate cognitive assessment by post.
It was felt insensitive to ask a question about depression without additional
support, although the geriatric depression scale has been validated for use
as a postal questionnaire in older people. However, this comprises a
minimum of four items, and is even then only a screening tool rather than
a diagnostic tool310. We were seeking questions relevant to falls, which
7/22/2019 Preventing Falls in Older People 2008
http://slidepdf.com/reader/full/preventing-falls-in-older-people-2008 72/240
72
were concise and valid, and felt that introducing a section screening for
depression would not be helpful.
Items asking about a diagnosis risk the introduction of reporting bias.
However, self-reporting of many diagnoses has been shown to be valid
when compared to medical records311; these include diabetes312, and other
chronic diseases. Important exclusions to this caveat are osteoarthritis and
peripheral vascular disease313. Stroke reported by older people agrees
moderately well with GP records (kappa 0.56) in Holland313, though other
studies have found that it is underreported by patients314 315. Diabetes is
valid as a self-reported diagnosis, and an increasingly recognised risk
factor for falling316, but is not as powerful a risk factor as the items
selected, and therefore was not included. Stroke and Parkinson’s disease
were included as self-reported items in the screening tool because of their
major impact on falls risk.
Visual acuity is a modest predictor of falls (RR 1.4) but was not included as
it is difficult to measure using a postal questionnaire – though it has been
successfully used in the LASA study201. Furthermore, there is the obvious
difficulty that those with impaired vision may not be able to read the
questionnaire.
Fear of falling is a strong predictor of falls, but was not included as
published tools are lengthy and so not easily incorporated into the planned
screening questionnaire317.
For the purposes of this study, it was decided to use modify the Falls Risk
Assessment Tool, being the only published screening tool used in a UK
population; the FRAT contains previous fall, so serves a function of case
identification, but also other robust predictors of future fall. However, it has
only been validated in a retrospective cohort, it was decided to undertake a

7/22/2019 Preventing Falls in Older People 2008
http://slidepdf.com/reader/full/preventing-falls-in-older-people-2008 73/240
73
series of checks to determine the validity, reliability and prospective
predictive properties of the tool.
Three extra items were introduced into the FRAT, self-reported mobility
limitation as a composite item reflecting balance and muscle strength,
rather than self reported problems with balance originally used (see Table
2.2), use of a mobility aid as a further marker of mobility limitation and
poor balance and symptoms of dizziness on standing as a marker of
postural hypotension. Self-reported mobility was formulated as a Likert
scale rating of mobility: not at all/with assistance/around one level of the
house/up & down stairs/to the local shops/unlimited), and for analysis was
dichotomised to housebound/not housebound). This item is a composite
measure of several well established risk factors predicting future falls
(reduced mobility, lower limb disability, activity limitation, gait deficit). Use
of a mobility aid was a simple question about whether the individual used a
stick or walking frame.
Table 2.2 Risk factors selected for inclusion in the screening
questionnaire
Item
1 Fall in the previous twelve months
2 Taking more than four prescribed medications
3 Previous stroke
4 Parkinson’s disease
5 Inability to stand from a chair without using arms to push up
6 Symptoms of dizziness on standing
7 Use of a mobility aid
8 Housebound (mobility impairment)
2.5.4.2 Format of the screening questionnaire
The finalised version of the screening questionnaire was designed to be
easy for older people to read (font size 14, sans serif, double spaced, one

7/22/2019 Preventing Falls in Older People 2008
http://slidepdf.com/reader/full/preventing-falls-in-older-people-2008 74/240
74
double sided sheet with clear instructions to complete both sides) (see
appendix 4.2).
The answers to the questions were in the form of a simple yes/no
response, except for item 8, which was on a six point Likert scale. A simple
closed response was selected because such questions are easy to
complete, define the domain of interest and are easy to standardise, code
and analyse318. The disadvantage of selecting this style of question is that
some participants may just guess, tick any response at random or make
errors.
The screening questionnaire had a clear title and instructions and was
accompanied by a letter of introduction from the potential participants’
general practitioner. A patient information leaflet explaining the study was
included. The reverse of the screening questionnaire contained sections for
recording demographic data and for the potential participants to indicate
their willingness to be contacted. A stamped, addressed envelope was
included for return of the questionnaire.
2.5.4.3 Determining risk
Whilst individual risk factors for falls may be more or less powerful in
predicting future risk, the combination of risk factors is the key predictor of
recurrent falls14 203 295.
Of the risk factors included in this study, falls in the previous year was felt
to be robust and reliable (90% of individuals falling in the previous year
report this correctly26 204), as well as being a strong predictor (relative risk
from previous studies 1.9-2.4). In the predictive model developed by
Stel203, a fall in the previous year was the strongest risk factor for future
falls203. Furthermore, further assessment of people who have already fallen
is mandatory following on from the NICE guidance10
. Given these facts, it

7/22/2019 Preventing Falls in Older People 2008
http://slidepdf.com/reader/full/preventing-falls-in-older-people-2008 75/240
75
was felt appropriate to use a previous fall or a combination of any two of
the other risk factors as the entry criterion to the study (i.e. defining high
risk).
2.5.4.4 Validity of screening tool
Most risk factors for falls have ‘face validity’ 319, and the bulk of the items
selected had been assessed by a panel of experts in developing the FRAT.
The face validity of the modified FRAT was ascertained through informal
consensus by a panel of experts in the field of falls research (Prof Tahir
Masud, geriatrician/Prof John Gladman, geriatrician/Prof Denise Kendrick,
GP and expertise in injuries/Dr Rob Morris, geriatrician/Dr Avril Drummond,
occupational therapist/Prof Rowan Harwood, geriatrician/Dr Carol
Coupland, statistician with an interest in injures). The panel felt that the
screening questions were sensible, relevant, reasonable and clear.
Validity was further assessed amongst primary healthcare workers (DK),
physiotherapists (day hospital staff), occupational therapists (AD, day
hospital staff) and day hospital patients. All participants in the pilot were
asked to comment on the tool screening questionnaire. Further comments
were obtained after the screening questionnaire had been used in practice.
It was not possible to assess the criterion validity of the modified FRAT, as
there is no gold standard tool for predicting future falls in community
dwelling older people.
Construct validity is discussed in the main results section, and assessed by
determining if those assessed as being at high risk went on to fall more
than those at low risk (see section 2.7.5.1).
Convergent and discriminant validity of the tool are best examined by
evaluating the tool’s relationship with other baseline measures included in
the study. By exploring these relationships it should be possible establish

7/22/2019 Preventing Falls in Older People 2008
http://slidepdf.com/reader/full/preventing-falls-in-older-people-2008 76/240
76
further validity for the scale by showing expected relationships with other
measures. For example, the item asking about mobility could be assessed
by comparing response against a standardised measure of mobility, such
as a timed walk. However, given the potential burden to participants and
added cost, this was not possible.
2.5.4.5 Test-retest reliability
The test-retest reliability properties of the screening questionnaire were
determined during the recruitment phase. Twenty high risk and 20 low risk
study participants returning the questionnaire were sent a second
questionnaire a week later, with a request that it be completed within one
week and returned. No attempt was made to follow up any participants
who did not send back either the second questionnaire and if the second
questionnaire was sent back after two weeks or longer it was discarded.
Sixteen high risk and 12 low risk participants completed the second
questionnaire. Reliability was examined using kappa scores for each of the
eight items in the screening questionnaire. Mobility was collapsed into two
categories for the purpose of analysis (Table 2.3).
Table 2.3 Recoding of mobility in screening questionnaire
Mobility response (How far can youwalk, with or without the help of astick or frame?)
Recoded as
Not at all
With assistance
Around one level of the house
Housebound
Up & down stairs
To the local shops
Unlimited
Not housebound
The kappa scores for each item on the screening questionnaire are shown
in Table 2.4.

7/22/2019 Preventing Falls in Older People 2008
http://slidepdf.com/reader/full/preventing-falls-in-older-people-2008 77/240
77
Table 2.4 Test-retest reliability scores for screening questionnaire
Item Observedagreement
Expectedagreement
Kappa Agreement*
Fall in last year 85.2% 58.3% 0.64 Good
≥ 4 medications 89.3% 60.7% 0.73 Good
Previous stroke 92.9% 62.5% 0.81 Very good
History of Parkinson’sdisease
100% 1.0 Perfect (nodiscordantcases)
Able to stand unaided 82.1% 50% 0.64 Good
Dizzy on standing 82.1% 57.7% 0.58 Moderate
Requires mobility aid 89.3% 53.1% 0.77 Very good
Housebound 92.0% 78.6% 0.63 Good
2.5.4.6 Summary - development of the screening tool
The initial development of the screening tool indicates that it is valid and
reliable; further evaluation of the predictive properties is detailed in the
next section.
2.6 Evaluation of a falls screening tool - methods
The cohort study examining the screening tool was carried out in parallel to
the randomised controlled trial, and many of the methodological aspects
are common to both studies. The methods for the cohort study are
presented here, but the methodological considerations are mainly
highlighted in chapter 3.
2.6.1 Study design
We carried out a cohort study to determine the predictive properties of the
screening tool over the course of one year. The study started in 2004 and
the last follow up was in 2007.
* Agreement according to Altman, 1997

7/22/2019 Preventing Falls in Older People 2008
http://slidepdf.com/reader/full/preventing-falls-in-older-people-2008 78/240
78
2.6.2 Population, inclusion and exclusion criteria
The purpose of the screening tool was to identify older people in the
community; accordingly participants were recruited from a primary care
setting; this first necessitated recruiting general practices willing to allow
access to their patients.
2.6.2.1 Recruitment of general practices
General practices that were registered with the Trent Focus for Primary
Care Research, Collaborative Research Network (CRN), were approached
by the researchers (DK, SC). The CRN has a Research Practices Board
which assesses studies on behalf of the member practices. This study was
submitted to the board and approved in June 2004. The CRN then
advertised the project to member practices, who then indicated their
interest in taking part in the study. The CRN Practices expressing an
interest were visited by the study nurse to explain the study, to ensure
that they would be able to identify the potential participants and to answer
any queries about the study protocol.
Only one CRN practice was registered in the Derby area and declined to
participate in this trial. In order to overcome this barrier, the principal
investigator at Derby (Dr J Youde), wrote to all practices within the Central
Derby PCT, inviting them to participate. Two practices were enrolled
following this invitation and were included in the trial in the same way as
the CRN practices.

7/22/2019 Preventing Falls in Older People 2008
http://slidepdf.com/reader/full/preventing-falls-in-older-people-2008 79/240
79
2.6.3 Recruitment of individual participants
The individual participant inclusion criteria were kept as broad as possible
to try and maximise external generalisability. The criteria were that the
individual should be:
• aged 70 or over
• registered on the practice list of one of the participating general
practices
• scored two or more on the screening questionnaire (previous fall or
two or more other risk factors).
2.6.3.1 Exclusion criteria
The exclusion criteria were kept to the minimum possible however, in order
to reduce contamination and in the interests of research governance, some
exclusion criteria were necessary. The general practices were asked to
exclude individuals if they were:
• residents in nursing or residential homes (the interventions required
to reduce falls in care home residents are different from those living
in their own homes
or
• patients with terminal illnesses (would not be ethical)
The study nurse excluded potential participants if they met the following
criteria:
• individuals already attending one of the day hospitals (it would not
be ethical to randomise them to usual care if they had already been
referred to the day hospital for a non-falls indication. if attending for
falls prevention, these individuals are already receiving an

7/22/2019 Preventing Falls in Older People 2008
http://slidepdf.com/reader/full/preventing-falls-in-older-people-2008 80/240
80
intervention and so by definition are not part of the screening
population that this study targeted)
• patients under follow up with an existing primary care based falls
prevention scheme (these individuals are already receiving an
intervention and so by definition are not part of the screening
population that this study targeted)
• those unwilling or unable to travel to the day hospital, using
transport as provided (not eligible for the intervention arm)
• patients unwilling or unable to provide fully informed consent
(would not be ethical).
Individuals who preferred not to participate in the randomised trial were
offered the possibility of completing monthly diaries only as part of the
screening cohort (section 2.5).
2.6.3.2 Recruitment interviews
Recruitment of individuals was carried out by three researchers (SC, RT,
JE). The general practices were provided with recruitment packs,
containing a letter of introduction (signed by one of the general
practitioners at each practice), a screening questionnaire, a patient
information leaflet and a reply-paid envelope. Each pack was in a sealed
envelope and the addresses of potential participants were affixed by the
practice staff, who then arranged for the invitation to be posted.
On receipt of a completed questionnaire indicating that the individual was
willing to participate further in the study, one of the three researchers
responsible for recruitment made telephone contact with the potential
participant. The telephone conversations followed a standardised format. If
the individual was willing to participate, verbal consent was obtained over

7/22/2019 Preventing Falls in Older People 2008
http://slidepdf.com/reader/full/preventing-falls-in-older-people-2008 81/240
81
the telephone. On a few occasions, a home visit was required to recruit
individuals (for example, where hearing or vision was an issue).
Day hospital and primary care falls prevention service records were
checked to ensure that the potential participant was not currently attending
the service or under active follow up (exclusion criteria). Active follow up in
this context was defined as regular visits with either of the services, or on-
going telephone contact between the service and the participant.
A consent form was then mailed to the individual, who was asked to sign
and return the form.
2.6.4 Outcomes
2.6.4.1 Baseline characteristics
Participants were described in terms of their age at entry into the study,
their gender and their responses to the screening questionnaire (fall in the
previous twelve months, taking more than four prescribed medications,
previous stroke, Parkinson’s disease, inability to stand from a chair without
using arms to push up, symptoms of dizziness on standing, use of a
mobility aid, housebound/not housebound - see 2.5.4.1). Respondents
were categorised as high risk of fall based on the presence of a previous
fall or two or more of the other risk factors.
2.6.4.2 Primary outcomes
The primary outcomes were the predictive properties of the falls screening
tool, described in terms of prevalence, sensitivity, specificity, positive and
negative predictive values and their 95% confidence intervals (CIs).
2.6.4.3 Secondary outcomes
We asked for self reports of whether the fall was injurious or not but no
secondary outcomes were pre-specified in the study protocol for the cohort
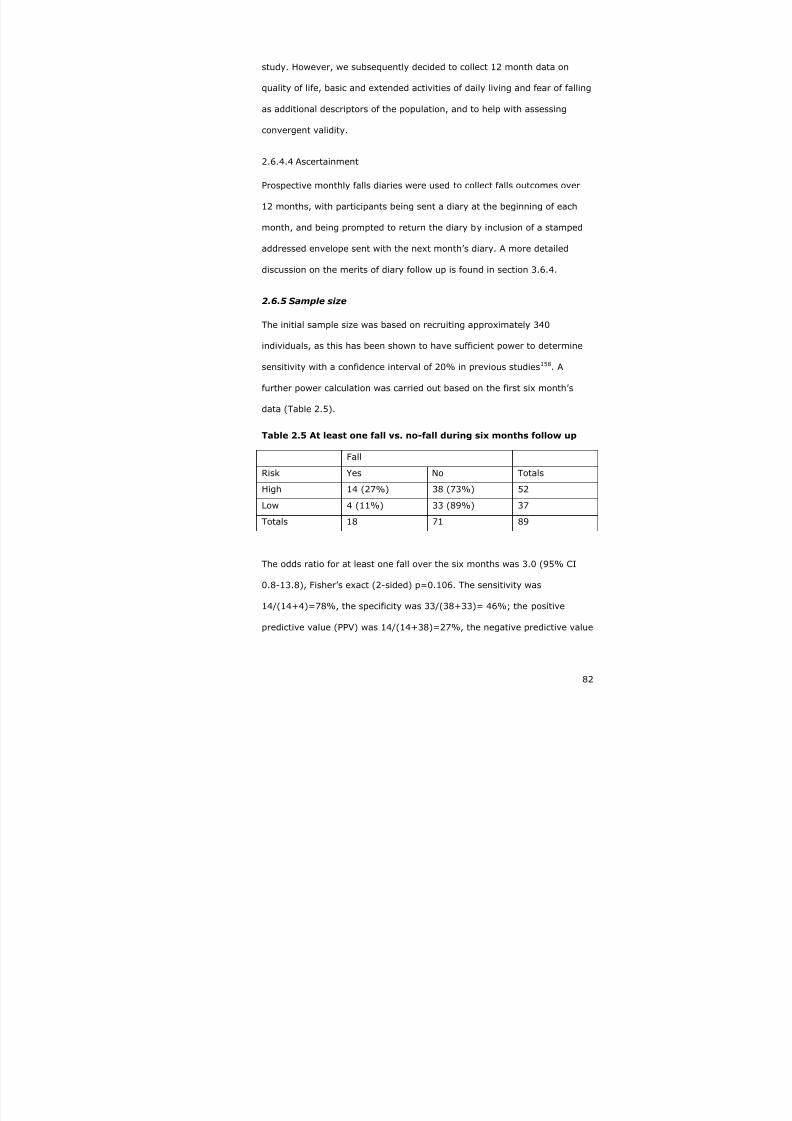
7/22/2019 Preventing Falls in Older People 2008
http://slidepdf.com/reader/full/preventing-falls-in-older-people-2008 82/240
82
study. However, we subsequently decided to collect 12 month data on
quality of life, basic and extended activities of daily living and fear of falling
as additional descriptors of the population, and to help with assessing
convergent validity.
2.6.4.4 Ascertainment
Prospective monthly falls diaries were used to collect falls outcomes over
12 months, with participants being sent a diary at the beginning of each
month, and being prompted to return the diary by inclusion of a stamped
addressed envelope sent with the next month’s diary. A more detailed
discussion on the merits of diary follow up is found in section 3.6.4.
2.6.5 Sample size
The initial sample size was based on recruiting approximately 340
individuals, as this has been shown to have sufficient power to determine
sensitivity with a confidence interval of 20% in previous studies158. A
further power calculation was carried out based on the first six month’s
data (Table 2.5).
Table 2.5 At least one fall vs. no-fall during six months follow up
Fall
Risk Yes No Totals
High 14 (27%) 38 (73%) 52
Low 4 (11%) 33 (89%) 37
Totals 18 71 89
The odds ratio for at least one fall over the six months was 3.0 (95% CI
0.8-13.8), Fisher’s exact (2-sided) p=0.106. The sensitivity was
14/(14+4)=78%, the specificity was 33/(38+33)= 46%; the positive
predictive value (PPV) was 14/(14+38)=27%, the negative predictive value

7/22/2019 Preventing Falls in Older People 2008
http://slidepdf.com/reader/full/preventing-falls-in-older-people-2008 83/240
83
(NPV) was 33/(4+33)=89%, with a falls prevalence over the first six
months of 18/89=20%.
nQuery was used to calculate the sample size; 17 individuals with falls
would be needed to be able to demonstrate a sensitivity of 78% (95% CI
58-98%), using a two-sided test with α at 0.05. Assuming the falls
prevalence remained constant at 20%, we will need to recruit
(17/20%=85) individuals. Using more narrow confidence intervals (70-
90%), we would have needed 66 individuals who fell, or a sample size of
(66/20%=330). We initially planned to recruit 330 individuals into the
cohort study.
2.6.6 Analyses
All analyses were carried out in Stata version 9.
The baseline and fall data were described in terms of proportions, and age
using medians and the interquartile range because of the skewed nature of
the data. The predictive properties were described using sensitivity,
specificity, positive and negative predictive values with their 95%
confidence intervals. The choice of the optimal cut off point for determining
high and low risk of falls was examined by calculating the sensitivity and
specificity for differing cut off points and by plotting a receiver operating
curve. Falls rates were calculated using Poisson regression and
comparisons between groups were calculated as incident rate ratios.
Quality of life, activities of daily living and fear of falling were compared
between those at high and low risk and between fallers and non-fallers.
The functional outcomes were continuous data but not normally
distributed. Various transformations were tried, but none were suitable.
Accordingly, scores were dichotomised on the basis of the median value,
and comparisons made using chi square tests and logistic regression.

7/22/2019 Preventing Falls in Older People 2008
http://slidepdf.com/reader/full/preventing-falls-in-older-people-2008 84/240
84
2.6.6.1 Handling missing data
Postal questionnaires were used to gather outcome measures. The
advantages of postal questionnaires include:
• no interviewer bias309 320 (particularly important in any therapy
interventions)
• standardised measurement across a large number of participants
• participants are more likely to answer sensitive questions
honestly321
• postal questionnaire are relatively cheap322.
The disadvantages of postal questionnaires include missing or unclear data,
and low response rates, which may introduce bias if responders are
different to non-responders323. Missing data reduces the effective sample
size as regression models require that all cases have complete data.
During the course of the study it became apparent that some of the
monthly falls diaries had not been sent to some participants because of
clerical error. Stata handles missing data by a process of ‘listwise deletion’
or ‘complete cases only’, that is to say only using complete datasets for
regression commands. However, this is inappropriate for the falls and
functional outcomes as it risks introducing bias. The conventional response
to missing data for the Barthel and Nottingham Extended activities of Daily
Living (NEADL) scales is to code missing as ‘never’ or ‘not at all’ i.e. worst
possible outcome324. Alternatively, for hierarchical scales such as the
NEADL it is reasonable to assume that if an individual fails an easy item
they would have failed a more difficult item. An alternative is to replace
missing items with the mean for a given subscale, providing there are not
too many missing items. Multiple responses to single choice items are
treated in the same way as missing items.

7/22/2019 Preventing Falls in Older People 2008
http://slidepdf.com/reader/full/preventing-falls-in-older-people-2008 85/240
85
In view of the missing data, we carried out a series of analyses:
• restricting analysis to those participants completing all 12 monthly
diaries
• restricting analysis to those participants who had a fall or had
complete diaries
• imputing missing data.
A sensitivity analysis was undertaken where missing data on whether a fall
occurred or not over the 12 month follow up period was imputed using the
multiple imputation procedure in Stata. Variables used in the equation for
predicting a missing value for falls were age, gender, (plus a term for the
interaction between age and gender where there was evidence of a
significant interaction), falls risk (low or high), all eight risk factor
variables, the number of returned diaries, plus the Barthel, NEADL, FES
and EuroQoL scores. Ten imputed datasets were created. Sensitivity,
specificity and predictive value were estimated on each of the 10 imputed
datasets and the mean and 95% confidence intervals of the values for
sensitivity, specificity and predictive value were estimated using Rubin’s
rules.
A second sensitivity analysis was undertaken comparing secondary
outcomes by falls risk and by whether a fall occurred or not using the
micombine command with the linear regression option. If scores were not
normally distributed and no suitable transformation could be found, scores
were dichotomised at the median and analysed using logistic regression.
7/22/2019 Preventing Falls in Older People 2008
http://slidepdf.com/reader/full/preventing-falls-in-older-people-2008 86/240
86
2.7 Evaluation of a falls screening tool - results
2.7.1 Recruitment
Recruitment into the cohort study took place in parallel to recruitment in to
the RCT. Overall, 2846/5312 (54%) of people completed at least some
parts of the screening questionnaire. Overall study recruitment is shown in
Figure 2.2; 335 individuals agreed to participate in the evaluation of the
screening tool.
Five individuals replied but supplied insufficient information to allow their
risk to be calculated, and did not give additional contact details. Reasons
for exclusion included residence in a care home (2) or recent attendance at
a falls programme (10). We recruited 335 participants into the cohort
study, but due to clerical error, some of the participants did not receive
study diaries and have incomplete data.

7/22/2019 Preventing Falls in Older People 2008
http://slidepdf.com/reader/full/preventing-falls-in-older-people-2008 87/240
87
Figure 2.2 Overall study recruitment
≥70registered
with GP6133
Excludedby GP821
5312 eligible
No reply2466
Baseline data2846
1481 highrisk
1360 lowrisk
5 unable toclassify, notcontactable
DeclinedRCT1105
Excludedby
studynurse 12
Declined1192
Screeningcohort168
RCT364
No furtherinvolvement
938
Agreed toscreening
cohort167
Screeningcohort
n=335
High risk167
Low risk168
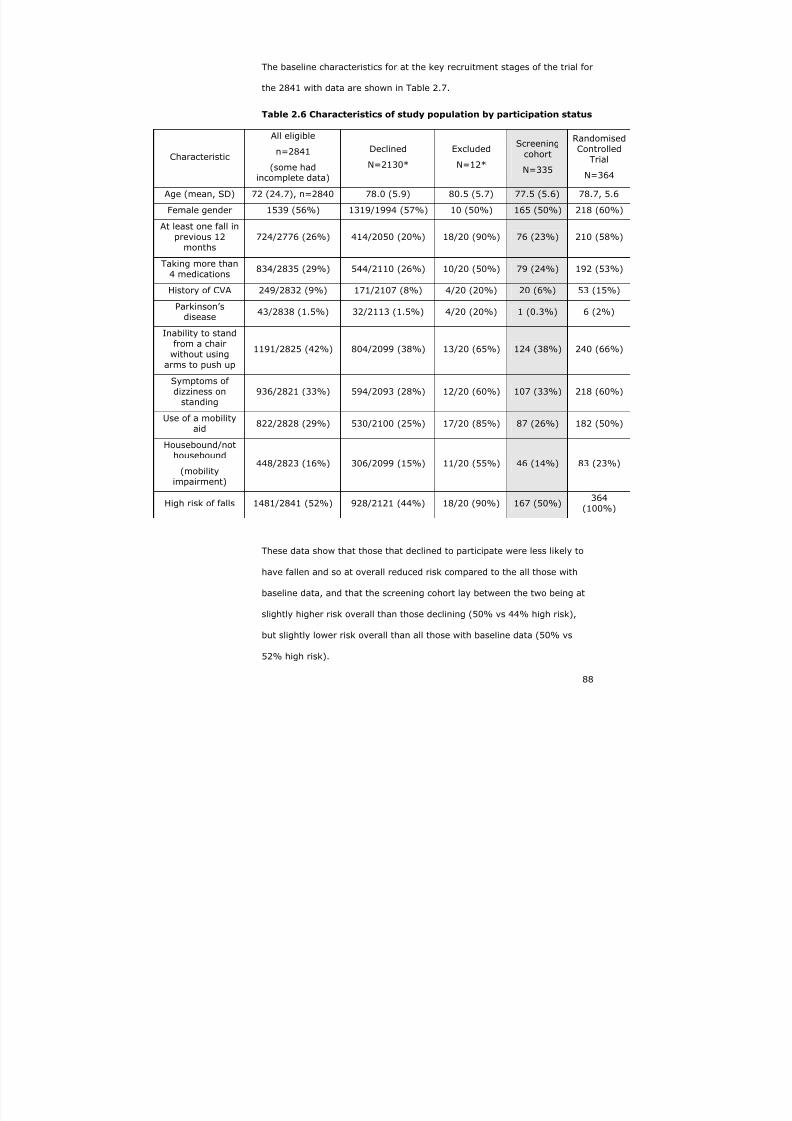
7/22/2019 Preventing Falls in Older People 2008
http://slidepdf.com/reader/full/preventing-falls-in-older-people-2008 88/240
88
The baseline characteristics for at the key recruitment stages of the trial for
the 2841 with data are shown in Table 2.7.
Table 2.6 Characteristics of study population by participation status
Characteristic
All eligible
n=2841
(some hadincomplete data)
Declined
N=2130*
Excluded
N=12*
Screeningcohort
N=335
RandomisedControlled
Trial
N=364
Age (mean, SD) 72 (24.7), n=2840 78.0 (5.9) 80.5 (5.7) 77.5 (5.6) 78.7, 5.6
Female gender 1539 (56%) 1319/1994 (57%) 10 (50%) 165 (50%) 218 (60%)
At least one fall inprevious 12
months724/2776 (26%) 414/2050 (20%) 18/20 (90%) 76 (23%) 210 (58%)
Taking more than4 medications
834/2835 (29%) 544/2110 (26%) 10/20 (50%) 79 (24%) 192 (53%)
History of CVA 249/2832 (9%) 171/2107 (8%) 4/20 (20%) 20 (6%) 53 (15%)
Parkinson’sdisease
43/2838 (1.5%) 32/2113 (1.5%) 4/20 (20%) 1 (0.3%) 6 (2%)
Inability to standfrom a chair
without usingarms to push up
1191/2825 (42%) 804/2099 (38%) 13/20 (65%) 124 (38%) 240 (66%)
Symptoms ofdizziness on
standing936/2821 (33%) 594/2093 (28%) 12/20 (60%) 107 (33%) 218 (60%)
Use of a mobilityaid
822/2828 (29%) 530/2100 (25%) 17/20 (85%) 87 (26%) 182 (50%)
Housebound/nothousebound
(mobilityimpairment)
448/2823 (16%) 306/2099 (15%) 11/20 (55%) 46 (14%) 83 (23%)
High risk of falls 1481/2841 (52%) 928/2121 (44%) 18/20 (90%) 167 (50%)364
(100%)
These data show that those that declined to participate were less likely to
have fallen and so at overall reduced risk compared to the all those with
baseline data, and that the screening cohort lay between the two being at
slightly higher risk overall than those declining (50% vs 44% high risk),
but slightly lower risk overall than all those with baseline data (50% vs
52% high risk).
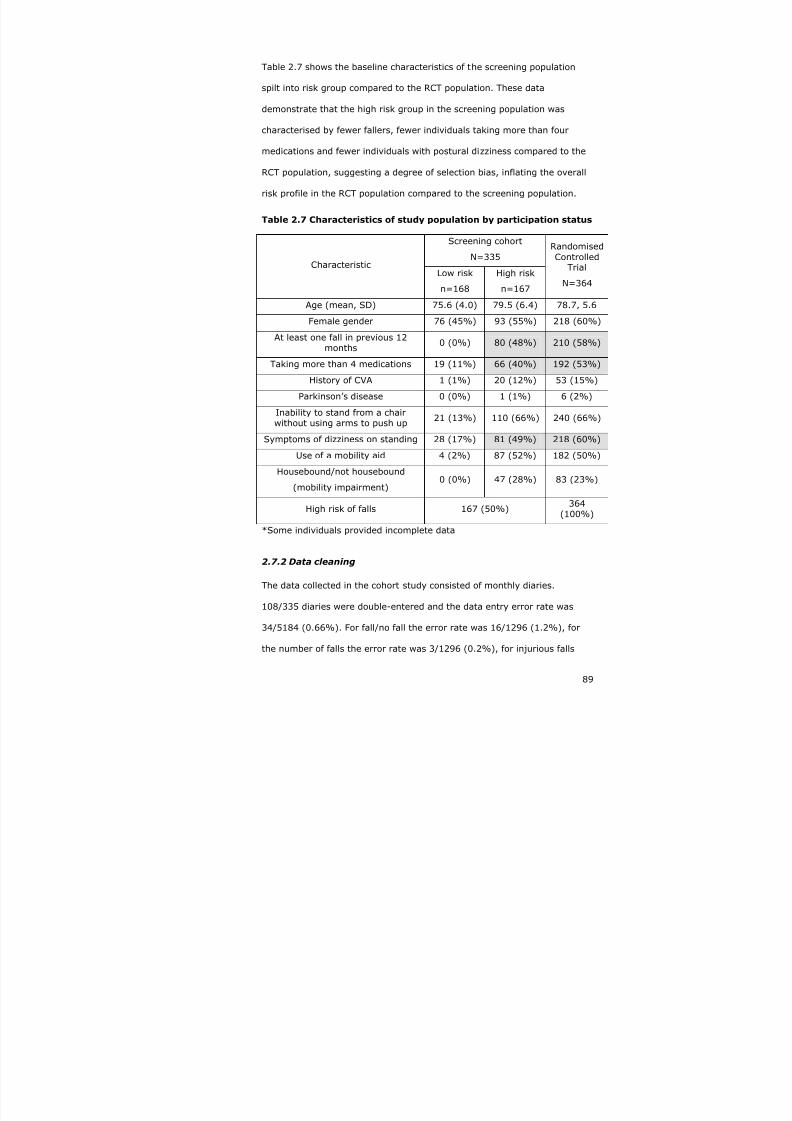
7/22/2019 Preventing Falls in Older People 2008
http://slidepdf.com/reader/full/preventing-falls-in-older-people-2008 89/240
89
Table 2.7 shows the baseline characteristics of the screening population
spilt into risk group compared to the RCT population. These data
demonstrate that the high risk group in the screening population was
characterised by fewer fallers, fewer individuals taking more than four
medications and fewer individuals with postural dizziness compared to the
RCT population, suggesting a degree of selection bias, inflating the overall
risk profile in the RCT population compared to the screening population.
Table 2.7 Characteristics of study population by participation status
Screening cohort
N=335CharacteristicLow risk
n=168
High risk
n=167
Randomised
ControlledTrial
N=364
Age (mean, SD) 75.6 (4.0) 79.5 (6.4) 78.7, 5.6
Female gender 76 (45%) 93 (55%) 218 (60%)
At least one fall in previous 12months
0 (0%) 80 (48%) 210 (58%)
Taking more than 4 medications 19 (11%) 66 (40%) 192 (53%)
History of CVA 1 (1%) 20 (12%) 53 (15%)
Parkinson’s disease 0 (0%) 1 (1%) 6 (2%)
Inability to stand from a chairwithout using arms to push up
21 (13%) 110 (66%) 240 (66%)
Symptoms of dizziness on standing 28 (17%) 81 (49%) 218 (60%)
Use of a mobility aid 4 (2%) 87 (52%) 182 (50%)
Housebound/not housebound
(mobility impairment)0 (0%) 47 (28%) 83 (23%)
High risk of falls 167 (50%)364
(100%)
*Some individuals provided incomplete data
2.7.2 Data cleaning
The data collected in the cohort study consisted of monthly diaries.
108/335 diaries were double-entered and the data entry error rate was
34/5184 (0.66%). For fall/no fall the error rate was 16/1296 (1.2%), for
the number of falls the error rate was 3/1296 (0.2%), for injurious falls
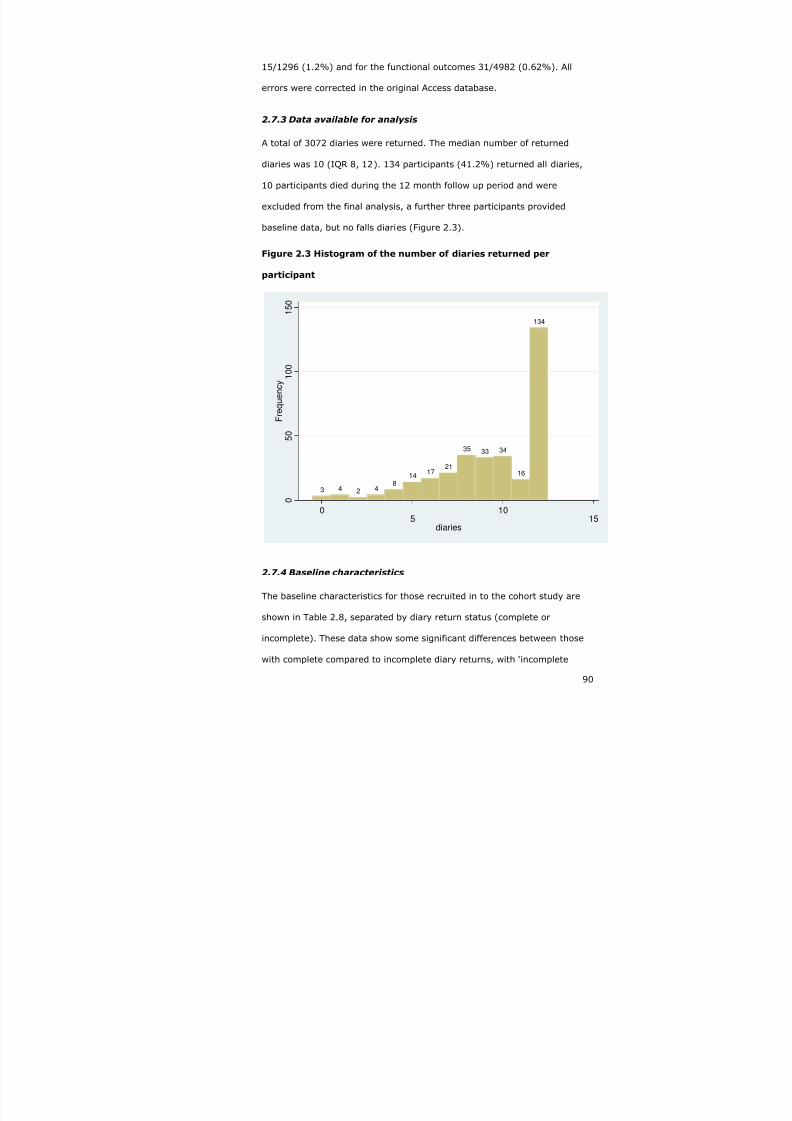
7/22/2019 Preventing Falls in Older People 2008
http://slidepdf.com/reader/full/preventing-falls-in-older-people-2008 90/240
90
15/1296 (1.2%) and for the functional outcomes 31/4982 (0.62%). All
errors were corrected in the original Access database.
2.7.3 Data available for analysis
A total of 3072 diaries were returned. The median number of returned
diaries was 10 (IQR 8, 12). 134 participants (41.2%) returned all diaries,
10 participants died during the 12 month follow up period and were
excluded from the final analysis, a further three participants provided
baseline data, but no falls diaries (Figure 2.3).
Figure 2.3 Histogram of the number of diaries returned per
participant
3 4 2 48
14 17
21
35 33 34
16
134
0
5 0
1 0 0
1 5 0
F r e q u e n c y
0 5 10 15diaries
2.7.4 Baseline characteristics
The baseline characteristics for those recruited in to the cohort study are
shown in Table 2.8, separated by diary return status (complete or
incomplete). These data show some significant differences between those
with complete compared to incomplete diary returns, with ‘incomplete

7/22/2019 Preventing Falls in Older People 2008
http://slidepdf.com/reader/full/preventing-falls-in-older-people-2008 91/240
91
returners’ being less likely to have had a previous fall (20% vs. 28%),
previous stroke (4% vs. 10%) and less likely to have postural dizziness
(28% vs. 40%). The proportion of people at high risk was greater in the
population returning all diaries compared to those with incomplete diaries
(55% vs. 45%), which is a potential source of bias.
Table 2.8 Baseline characteristics according to diary returns
CharacteristicComplete
diaries n=134
Incomplete
diaries n=191
Significance
test
Age (mean, SD) 77.5 77.5 P=0.913
Female gender 75 (56%) 90 (47%) p=0.116
At least one fall in previous12 months
37 (28%) 39 (20%) p=0.013
Taking more than fourmedications
39 (29%) 40 (21%) p=0.091
History of stroke 13 (10%) 7 (4%) p=0.026
Parkinson’s disease 0 (0%) 1 (1%) p=0.402
Inability to stand from achair without using arms topush up
56 (42%) 68 (36%) p=0.258
Symptoms of dizziness onstanding
53 (40%) 54 (28%) p=0.029
Use of a mobility aid 37 (28%) 50 (26%) p=0.774
Housebound/nothousebound
(mobility impairment)
18 (13%) 28 (15%) p=0.755
High risk of falls 74 (55%) 86 (45%) p=0.070
2.7.5 Describing the occurrence of falls
A total of 191 falls were recorded in 3072 returned diaries. The annual falls
rate was 746/1000 person-years (0.75 per person-year). Table 2.9 shows
the number of falls and type of fall by the different diary return groups
(those with complete follow up vs. all participants).

7/22/2019 Preventing Falls in Older People 2008
http://slidepdf.com/reader/full/preventing-falls-in-older-people-2008 92/240
92
Table 2.9 Number of participants with falls, rate of falls, risk
category, recurrent falls and injurious falls by diary return category
Returned all diaries[n=134]
All participants[n=322]
Number at high risk (%) 74 (55%) 158 (49%)
At least one fall in follow upperiod (%)
47 (35%) 96 (30%)
Rate of falls per person-year(Poisson, 95% CI)
0.35
(95% CI 0.26-0.47)
0.39
(95% CI 0.31-0.47)
Had more than 1 fall infollow up period (%)
24 (18%) 43 (13%)
Had injurious fall in follow upperiod (%)
26 (19%) 56 (17%)
The data in Table 2.9 demonstrate the effect of including those participants
with incomplete diary returns, who were at lower risk of falls as shown in
Table 2.8, namely an attenuation of adverse falls related outcomes.
2.7.5.1 Falls by risk group
Considering those who returned all 12 diaries (n=134), 37/74 (50%) of
those at high risk fell at least once, compared to 10/60 (17%) at low risk;
odds ratio 5.0 (95% CI 2.1-12.6, Fisher’s exact (2-sided) p=0.0001.
For all participants surviving at 12 months (n=322), 66/158 (42%) high
risk versus 30/164 (18%) low risk participants reported at least one fall,
odds ratio 3.2 (95% CI 1.9-5.5), Fisher’s exact (2-sided) p<0.0001. This is
likely to be a biased estimate, as many of those alive at 12 months did not
complete all 12 diaries and are at lower risk than those that did complete
all twelve diaries.
The rate of falls in the high risk group (using data from all diaries returned)
was 1.2 (95% CI 1.0-1.4) compared to 0.3 (95% CI 0.25-0.46) falls per
person-year in the low risk group, incidence rate ratio 3.4 (95% CI 2.5-
4.6), p<0.0001.
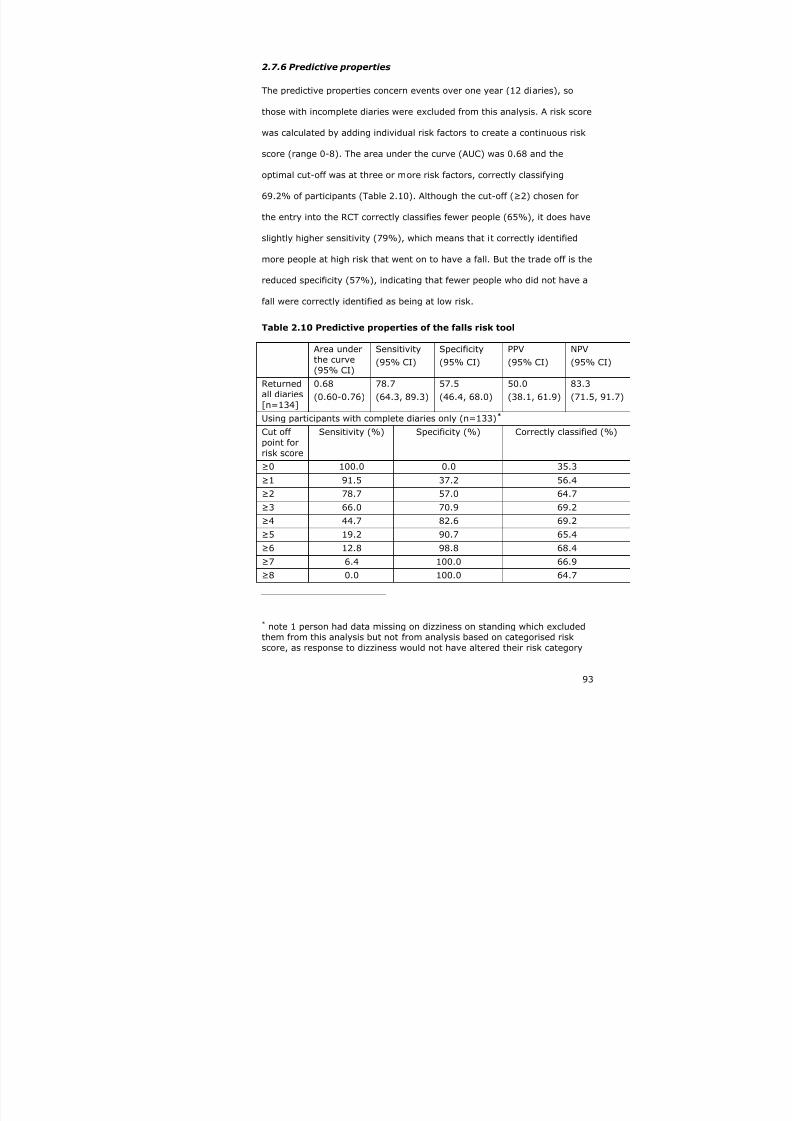
7/22/2019 Preventing Falls in Older People 2008
http://slidepdf.com/reader/full/preventing-falls-in-older-people-2008 93/240
93
2.7.6 Predictive properties
The predictive properties concern events over one year (12 diaries), so
those with incomplete diaries were excluded from this analysis. A risk score
was calculated by adding individual risk factors to create a continuous risk
score (range 0-8). The area under the curve (AUC) was 0.68 and the
optimal cut-off was at three or more risk factors, correctly classifying
69.2% of participants (Table 2.10). Although the cut-off (≥2) chosen for
the entry into the RCT correctly classifies fewer people (65%), it does have
slightly higher sensitivity (79%), which means that it correctly identified
more people at high risk that went on to have a fall. But the trade off is the
reduced specificity (57%), indicating that fewer people who did not have a
fall were correctly identified as being at low risk.
Table 2.10 Predictive properties of the falls risk tool
Area underthe curve(95% CI)
Sensitivity
(95% CI)
Specificity
(95% CI)
PPV
(95% CI)
NPV
(95% CI)
Returnedall diaries[n=134]
0.68(0.60-0.76)
78.7(64.3, 89.3)
57.5(46.4, 68.0)
50.0(38.1, 61.9)
83.3(71.5, 91.7)
Using participants with complete diaries only (n=133)*
Cut offpoint forrisk score
Sensitivity (%) Specificity (%) Correctly classified (%)
≥0 100.0 0.0 35.3
≥1 91.5 37.2 56.4
≥2 78.7 57.0 64.7
≥3 66.0 70.9 69.2
≥4 44.7 82.6 69.2
≥5 19.2 90.7 65.4
≥6 12.8 98.8 68.4
≥7 6.4 100.0 66.9
≥8 0.0 100.0 64.7
* note 1 person had data missing on dizziness on standing which excludedthem from this analysis but not from analysis based on categorised riskscore, as response to dizziness would not have altered their risk category
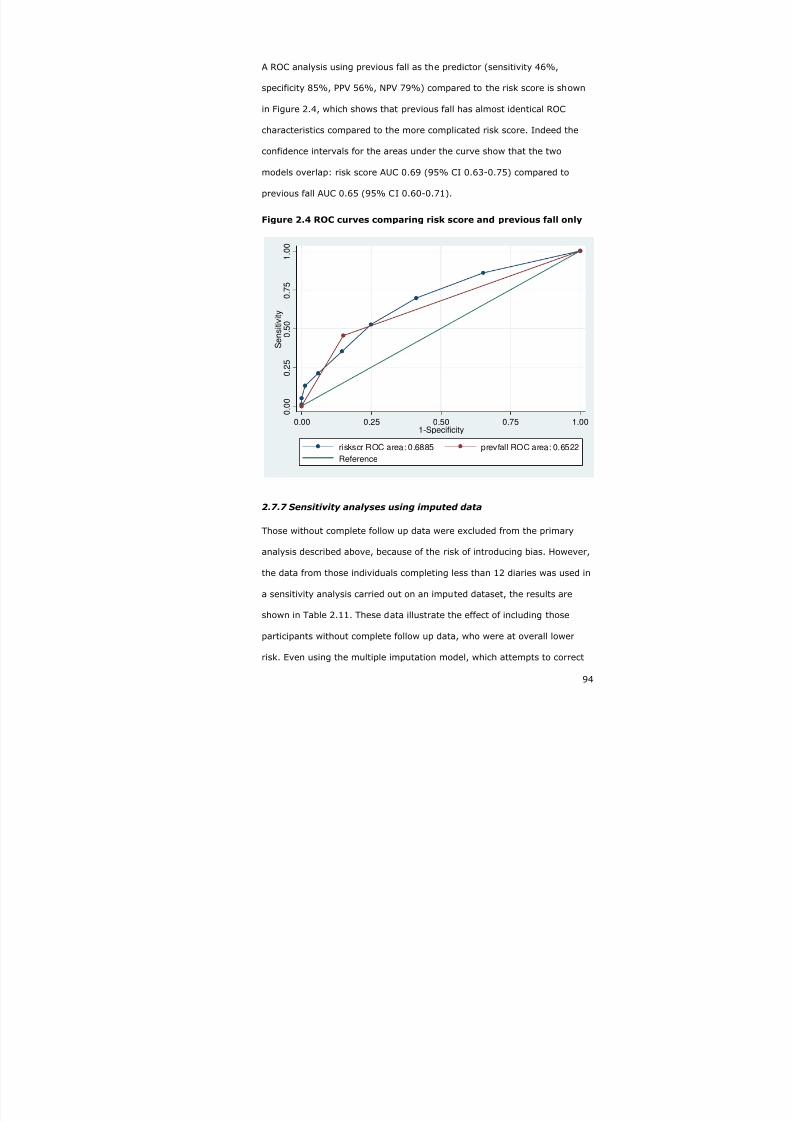
7/22/2019 Preventing Falls in Older People 2008
http://slidepdf.com/reader/full/preventing-falls-in-older-people-2008 94/240
94
A ROC analysis using previous fall as the predictor (sensitivity 46%,
specificity 85%, PPV 56%, NPV 79%) compared to the risk score is shown
in Figure 2.4, which shows that previous fall has almost identical ROC
characteristics compared to the more complicated risk score. Indeed the
confidence intervals for the areas under the curve show that the two
models overlap: risk score AUC 0.69 (95% CI 0.63-0.75) compared to
previous fall AUC 0.65 (95% CI 0.60-0.71).
Figure 2.4 ROC curves comparing risk score and previous fall only
0 . 0
0
0 . 2
5
0 . 5
0
0 . 7
5
1
. 0 0
S e n s i t i v i t y
0.00 0.25 0.50 0.75 1.001-Specificity
riskscr ROC area: 0.6885 prevfall ROC area: 0.6522
Reference
2.7.7 Sensitivity analyses using imputed data
Those without complete follow up data were excluded from the primary
analysis described above, because of the risk of introducing bias. However,
the data from those individuals completing less than 12 diaries was used in
a sensitivity analysis carried out on an imputed dataset, the results are
shown in Table 2.11. These data illustrate the effect of including those
participants without complete follow up data, who were at overall lower
risk. Even using the multiple imputation model, which attempts to correct

7/22/2019 Preventing Falls in Older People 2008
http://slidepdf.com/reader/full/preventing-falls-in-older-people-2008 95/240
95
for baseline variables, there were fewer falls, with a correspondingly lower
positive predictive value. This means that the imputed model is still biased
and the data are not representative of the population with complete follow
up. So the best estimate available from the cohort study is the primary
analysis based on those with complete follow up only, even though with
relatively small numbers the confidence intervals are wide.

7/22/2019 Preventing Falls in Older People 2008
http://slidepdf.com/reader/full/preventing-falls-in-older-people-2008 96/240
Table 2.11 Predictive properties comparing imputed data against original data
Prevalence
of falls
Sensitivity
(95% CI)
Specificity
(95% CI)
PPV
(95% CI)
NPV
(95% CI)
Area under
curve
(95% CI)
Returned alldiaries[n=134]
35.1% 78.7
(64.3-89.3)
57.5
(46.4-68.0)
50.0
(38.1-61.9)
83.3
(71.5-91.7)
0.68
(0.60-0.76
Imputed
data
29.7% 68.9
(66.0-71.6)
59.1
(57.1-61.0)
41.5
(39.2-43.9)
81.8
(80.0-83.6)
0.64
(0.62-0.66
Imputed dataset
Cut off pointfor risk score
Sensitivity (%) Specificity (%) Correctly classified
≥0 100.0 0.0 29.7
≥1 85.4 35.2 50.1
≥2 68.8 58.9 61.8
≥3 52.2 74.7 68.0
≥4 34.3 85.5 70.3
≥5 20.8 94.3 72.5
≥6 12.5 98.7 73.1
≥7 4.2 100.0 71.5
≥8 0.0 100.0 70.3
7/22/2019 Preventing Falls in Older People 2008
http://slidepdf.com/reader/full/preventing-falls-in-older-people-2008 97/240
97
2.7.8 Secondary outcomes
Clerical error and loss to follow-up resulted in missing data for some of the
functional outcomes, as detailed below:
• EuroQoL (301/325)
• Barthel index of daily living (301/325)
• Nottingham Extended Activities of Daily Living (304/325)
• Falls Efficacy Scale (269/325).
The ADL, FES and QoL scores were not normally distributed and suitable
transformations could not be found. They were therefore dichotomised at
or above the median value., depending on the number in each group in
order to ensure a balanced distribution.
We compared activities of daily living (ADL), fear of falling (FES) and
quality of life (QoL) between fallers and non fallers (based on complete
diaries) and between those at high and low risk of falls (based on all
participants) Table 2.12. These shown that fallers have substantially
reduced function, both basic and advanced, increased fear of falling and
worse quality of life compared to non-fallers.
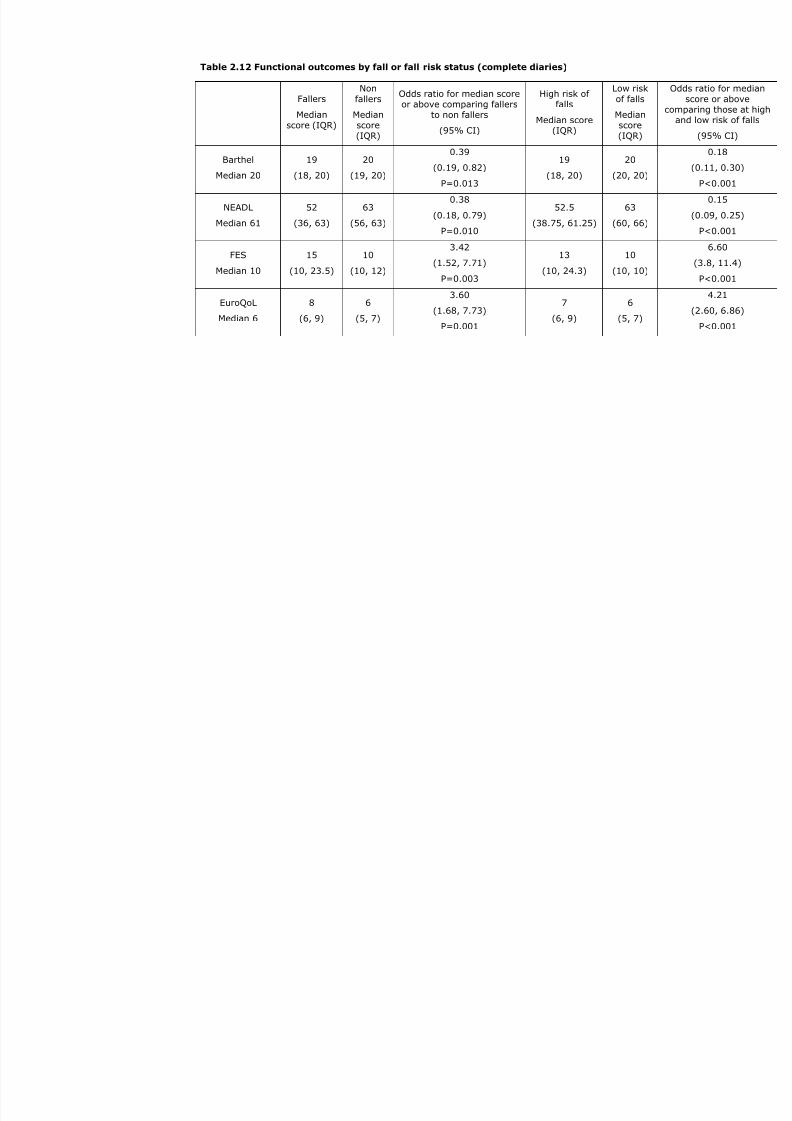
7/22/2019 Preventing Falls in Older People 2008
http://slidepdf.com/reader/full/preventing-falls-in-older-people-2008 98/240
Table 2.12 Functional outcomes by fall or fall risk status (complete diaries)
Fallers
Median
score (IQR)
Non
fallers
Median
score(IQR)
Odds ratio for median scoreor above comparing fallers
to non fallers
(95% CI)
High risk offalls
Median score
(IQR)
Low risk
of falls
Median
score(IQR)
Barthel
Median 20
19
(18, 20)
20
(19, 20)
0.39
(0.19, 0.82)
P=0.013
19
(18, 20)
20
(20, 20)
NEADL
Median 61
52
(36, 63)
63
(56, 63)
0.38
(0.18, 0.79)
P=0.010
52.5
(38.75, 61.25)
63
(60, 66)
FES
Median 10
15
(10, 23.5)
10
(10, 12)
3.42
(1.52, 7.71)
P=0.003
13
(10, 24.3)
10
(10, 10)
EuroQoL
Median 6
8
(6, 9)
6
(5, 7)
3.60
(1.68, 7.73)
P=0.001
7
(6, 9)
6
(5, 7)
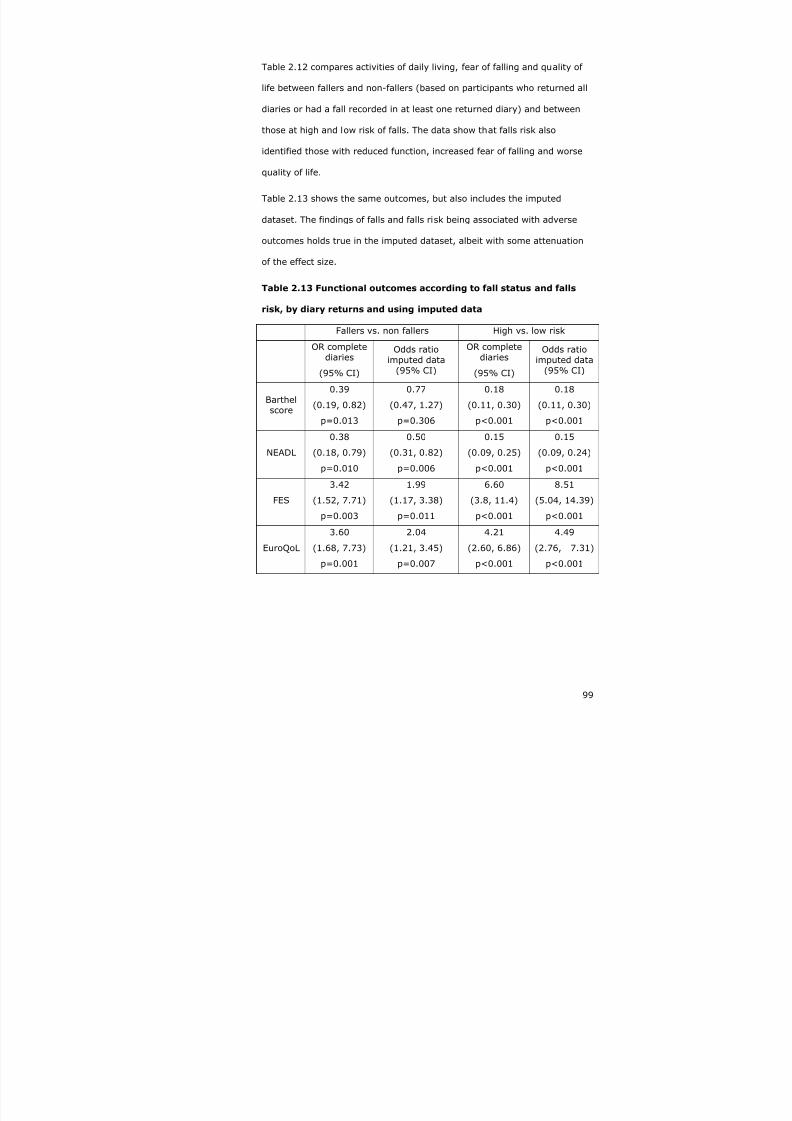
7/22/2019 Preventing Falls in Older People 2008
http://slidepdf.com/reader/full/preventing-falls-in-older-people-2008 99/240
99
Table 2.12 compares activities of daily living, fear of falling and quality of
life between fallers and non-fallers (based on participants who returned all
diaries or had a fall recorded in at least one returned diary) and between
those at high and low risk of falls. The data show that falls risk also
identified those with reduced function, increased fear of falling and worse
quality of life.
Table 2.13 shows the same outcomes, but also includes the imputed
dataset. The findings of falls and falls risk being associated with adverse
outcomes holds true in the imputed dataset, albeit with some attenuation
of the effect size.
Table 2.13 Functional outcomes according to fall status and falls
risk, by diary returns and using imputed data
Fallers vs. non fallers High vs. low risk
OR completediaries
(95% CI)
Odds ratioimputed data
(95% CI)
OR completediaries
(95% CI)
Odds ratioimputed data
(95% CI)
Barthelscore
0.39
(0.19, 0.82)
p=0.013
0.77
(0.47, 1.27)
p=0.306
0.18
(0.11, 0.30)
p<0.001
0.18
(0.11, 0.30)
p<0.001
NEADL
0.38
(0.18, 0.79)
p=0.010
0.50
(0.31, 0.82)
p=0.006
0.15
(0.09, 0.25)
p<0.001
0.15
(0.09, 0.24)
p<0.001
FES
3.42
(1.52, 7.71)
p=0.003
1.99
(1.17, 3.38)
p=0.011
6.60
(3.8, 11.4)
p<0.001
8.51
(5.04, 14.39)
p<0.001
EuroQoL
3.60
(1.68, 7.73)
p=0.001
2.04
(1.21, 3.45)
p=0.007
4.21
(2.60, 6.86)
p<0.001
4.49
(2.76, 7.31)
p<0.001

7/22/2019 Preventing Falls in Older People 2008
http://slidepdf.com/reader/full/preventing-falls-in-older-people-2008 100/240
100
2.8 Discussion
2.8.1 Summary
We recruited 335 older people into the cohort study; the screening
population are very similar in terms of baseline characteristics to those who
declined to participate.
The modified FRAT, consists of eight simple questions, can be sent out as a
postal questionnaire (54% response rate), has reasonable face validity and
good to very good test-retest reliability. The construct validity of the tool is
demonstrated by the increased number of fallers in the high risk group
compared to the low risk group (odds ratio 5).
The predictive properties of the tool are reasonable: sensitivity 79% and
specificity 58%. The positive predictive value of 50% indicates that for
every two people identified as being at high risk, one would go onto to
have a fall in the following year. The 83% negative predictive value means
that of those screened as being at low risk, approximately on in six will go
on to have a fall, but five out of six will not have a fall.
However, the predictive properties of this relatively simple tool were not
significantly better than just using previous fall alone as the predictor for
future fall (risk score AUC 0.69 (95% CI 0.63-0.75) compared to previous
fall AUC 0.65 (95% CI 0.60-0.71)). The positive predictive value using
previous fall alone is slightly better than using the screening tool (56%
versus 50%), but the negative predictive value is lower (79% versus
83%). Using previous fall as the sole identifier, slightly more than one in
two people classified at high risk would go onto fall, but one in five of those
classified at low risk would fall – compared to one in six using the
screening tool.

7/22/2019 Preventing Falls in Older People 2008
http://slidepdf.com/reader/full/preventing-falls-in-older-people-2008 101/240
101
Fallers had reduced function as measured by the Barthel and the NEADL,
than non-fallers at twelve months. The magnitude of this effect was similar
for both extended and basic activities of daily living (odds ratio~0.4,
p<0.02). Fallers also had a three-fold increased in fear of falling (OR 3.3,
p=0.003). Linked to the increase in fear of falling and reduced function is
the worse quality of life in people who had fallen. We used the EuroQoL to
measure quality of life, which comprise five domains (mobility, self-care,
daily activities, pain and mood) each with three levels of response (no
problem – 0, some/moderate difficulty – 1 and unable/extreme difficulty -
2). This study showed a three-four fold worsening of self rated quality of
life in fallers (OR 3.6, p=0.001).
The finding that quality of life was worse in people who have fallen (median
8 versus 6 on a 12 point scale) holds for the mobility domain within the
EuroQoL (median 2 versus 1) in this study. It appears that we have
affirmed the fall-reduced function-fear of falling-reduced quality of life
theory in this cohort study. This further supports the construct validity of
this screening tool, demonstrating the expected association between falls,
reduced function, fear of falling and reduced quality of life.
2.8.2 Strengths and limitations
The strengths of this study include the prospective design, the monthly
ascertainment of falls, and the collection of an array of secondary
outcomes at follow up.
Those at high risk in the screening cohort were slightly less likely to have
fallen compared to all those with baseline data. Those at high risk and
having fallen who agreed to participate were differentially recruited into the
RCT rather than the screening cohort. This makes the screening cohort
somewhat unrepresentative. Ideally, the cohort study validating the
screening tool should have been carried out prior to the RCT (i.e. in series

7/22/2019 Preventing Falls in Older People 2008
http://slidepdf.com/reader/full/preventing-falls-in-older-people-2008 102/240
102
rather than in parallel), but resources (namely time) were insufficient to
allow this process. It is not possible to be certain in which direction this
bias may have affected the result, but it is reasonable to hypothesise that
it led to an underestimate of the true falls prevalence in the high risk group
in the screening cohort. This would have the effect of reducing the
sensitivity and the positive predictive value of the screening tool.
There is clearly an issue around those participants who returned
incomplete diaries, and the comparisons in Table 2.8 and section 2.7.5.1
suggest that they were at slightly lower risk of falls than those that
completed the study.
We carried out a sensitivity analyses to determine the robustness of the
results based on the smaller sample of 134 participants completing 12
months of follow up. This included all participants alive at 12 months; this
slightly underestimated falls prevalence (30%) (Table 2.11). The complete
dataset based on 134 participants is small, with correspondingly wide
confidence intervals around the various estimates. The imputed dataset
appears to offer biased estimates, and so cannot be used to refine the
estimate seen in the original dataset. The analysis of those with complete
follow up is consistent with other similar studies (see below).
It would have been possible to increase the number of high risk individuals
used to validate the screening tool by including those assigned to the
control group of the RCT in the analysis of the predictive properties of the
screening tool. However, this was not done as the follow-up diaries used in
ascertaining falls outcomes were different in the two studies and there
were concerns that the different reporting (more detailed in the RCT) may
have led to differential reporting and bias. Also, as discussed above, those
participating in the RCT may be in some way different to those at high risk
agreeing only to the cohort study, creating further risk of bias.

7/22/2019 Preventing Falls in Older People 2008
http://slidepdf.com/reader/full/preventing-falls-in-older-people-2008 103/240
103
2.8.3 Comparisons with previous studies
The predictive properties of the screening tool were measured using the
area under the curve (AUC 0.68 using the 134 participants with complete
follow up). This compares favourably to other falls screening tools – 0.65
from Tromp et al 201, 0.71 from Pluijm et al 146 and ~0.70 from Nandy et
al 158. A slightly better score could have been obtained if we had used three
or more individual risk factors as the cut off (AUC 0.73).
The finding of reduced basic and extended functional ability in fallers is
consistent with previous reports of worse function leading to admission to
long term care in people who have fallen129; however, as we did not
measure function at baseline, we cannot be sure that this relationship is
causal. Given that 18% people who fell had more than one fall, and that
nearly 20% of falls were injurious, it is reasonable to hypothesise that falls
cause reduced function. There was also a three-fold increase in fear of
falling in fallers compared to non-fallers, which may also have contributed
to the reduced function, as has been shown other studies70 71.
The worse quality of life measured in people who had fallen is consistent
with previous studies70 71 325-328 which have demonstrated a link between
fear of falling, functional impairment and a reduction in quality of life in
people who have fallen. Indeed 80% of women asked would rather be dead
than experience the loss of independence and quality of life that results
from a [fall,] bad hip fracture and subsequent admission to a nursing
home329. The reduced quality of life is thought to be mediated through a
loss of autonomy330, and fear of falling leading to restricted activity and
reduced social interaction.
Falls efficacy is the belief that an individual can master falling and so
despite having fallen, has the confidence to continue activities; fallers in
this study has a substantial increase in fear of falling, measured using the

7/22/2019 Preventing Falls in Older People 2008
http://slidepdf.com/reader/full/preventing-falls-in-older-people-2008 104/240
104
Falls Efficacy Scale. Also linked to fear of falling and quality of life are
individuals’ expectations - people who have fallen may have lower
expectations and are ‘pleasantly surprised’ by their perceived quality of
life; one paper examined this theory and did not find evidence to support
this adaptive theory in older fallers331. In a related sub-study carried out in
parallel to this screening study, it was found that low self-efficacy for falls
was linked to negative outcome expectation to falls, further casting doubt
of the adaptive approach (I Clonis, personal communication).
2.8.4 Generalisability
The proportion of people with a fall in the previous 12 months at baseline
(28%) is in keeping with previous estimates of falls prevalence in UK
populations (see 1.2). The fall rate during follow up (0.75 falls per person-
year) is higher than estimates of falls rates from UK primary care
records37, which tend to underestimate falls, but below the lower end of the
range for international estimates for falls rates in community dwelling older
people, mainly based on intervention studies (1.1-1.8 falls per person-
year). This suggests that the cohort studied is reasonably representative,
at least in comparison to previous studies of fall in community dwelling
older people. The subsequent fall prevalence of 35% over one year, using
monthly diaries, is consistent with other studies which have shown that
more careful ascertainment results in more falls being recorded, typically
reporting annual falls prevalence using weekly or monthly diaries of around
33%14 25 26.
2.8.5 Interpretation
We have developed a screening tool which is valid, reliable and
generalisable. It is easy to use in the primary care setting, and can be
completed by post, with a reasonable response rate (54%). It could be
equally well completed at a routine primary care visit. The predictive

7/22/2019 Preventing Falls in Older People 2008
http://slidepdf.com/reader/full/preventing-falls-in-older-people-2008 105/240
105
properties of the tool are as good (sensitivity 79% and specificity 58%), if
not better than previously published falls screening tools (FRAT158
sensitivity 42%, specificity 92%). The tool performs slightly better than
just using previous falls to identify those at risk, mainly because of its
superior negative predictive value – this has important implications in
terms of the cost-effectiveness and acceptability of the subsequent
intervention. Falls prevention programmes are expensive, requiring
multiple team members delivering an intervention over several weeks, so
need to be targeted at those most likely to benefit if they are to be
clinically and cost-effective. However, from a practical perspective, using
previous fall alone is very simple and has similar predictive properties
compared to the screening tool. Aside from the tool’s ability to identify
those at risk of future fall, it also identifies a cohort at risk of functional
decline and reduced quality of life, and so may be useful method of
targeting older people in the primary care setting for interventions aimed
at maintaining their independence. Such interventions, generally known as
comprehensive geriatric assessment, have shown benefit in primary care
settings for frail older people with a variety of geriatric syndromes, not just
falls332-334.
What is not known, at least in the UK setting, is if a multifactorial
intervention to prevent falls provided to individuals identified as being at
high risk of falls using this screening tool offers any benefit.

7/22/2019 Preventing Falls in Older People 2008
http://slidepdf.com/reader/full/preventing-falls-in-older-people-2008 106/240
106
3 RANDOMISED CONTROL TRIAL
3.1 Overview
In chapter one, the evidence supporting the clinical effectiveness of a
multifactorial intervention to reduce the rate of falls was presented. The
case was made for screening for falls in the primary care setting, with the
aim of identifying individuals who are at risk of falls or who have already
fallen but have not presented to health services. Screening methodology
and results showing that a screening tool is effective in identifying such
high risk individuals was discussed in chapter two. In this chapter, the
methodology, results and implications of a randomised controlled trial of a
falls prevention programme applied to the high risk population are
discussed.
3.2 Design considerations
3.2.1 Evaluating complex interventions
A multifactorial intervention such as that used to manage people who have
fallen, can be considered a complex intervention according to the MRC
framework335 (note this has been updated since this work was started336).
When evaluating such complex interventions, it is essential that the
individual ingredients are clearly defined, so as to allow reproducibility.
Furthermore, it is important to try and determine the relationship between
the various components – to unpick the ‘black box’.
The MRC suggest a series of developmental steps which are required to
clearly define the nature of a complex intervention335:
• pre-clinical – exploring the relevant theory
•
phase I – modelling the individual components, developing an
understanding of their mechanisms and their interdependency

7/22/2019 Preventing Falls in Older People 2008
http://slidepdf.com/reader/full/preventing-falls-in-older-people-2008 107/240
107
• phase II – exploratory trial to describe the constant and variable
components of the intervention with a view to defining the protocol
for a definitive comparison
• phase III – definitive RCT
• phase IV – long term implementation – assessing if the intervention
can be delivered successfully in other settings.
This process is long and requires multiple separate studies. The plethora of
positive RCTs on falls prevention detailed in section 1.5 suggested that the
essential ingredients of falls prevention programmes have been elucidated.
However, the purpose of this study is to evaluate the complex intervention
in a different population and setting to that which has previously been
studied in the United Kingdom (i.e. the screened population, managed in
the day hospital) – though several international studies have already
carried out this work in a ‘high risk populations10 12 217 224 225.
The definition of the complex intervention intended to be delivered in this
study is detailed in section 3.5, but in brief consisted of a medical review,
strength and balance training and a home hazards assessment. We
attempted to assess whether the intended intervention were being
delivered as planned using behavioural mapping and an audit of activity in
the falls prevention programme, detailed in appendix 1.1.
3.2.2 External comparability
Given that there have been several previous clinical trials evaluating falls
prevention programmes, it is important that the results of this trial can be
interpreted in context – in terms of what this trial can add to the literature.
A critical appraiser reviewing this trial will examine various aspects of trial
conduct to determine if the results are a useful addition to the literature. A
variety of critical appraisal tools have been developed which allow the

7/22/2019 Preventing Falls in Older People 2008
http://slidepdf.com/reader/full/preventing-falls-in-older-people-2008 108/240
108
appraiser to carry out this process in a systematic manner337, and in
designing a trial, it is helpful to consider these criteria.
3.2.3 Internal validity
Internal validity asks the question ‘do these results represent an unbiased
estimate of the treatment effect, or have they been influenced in some
systematic fashion to lead to a false conclusion?’ 338. Fundamental aspects
of the internal validity of a randomised controlled trial concern
randomisation and group balance, participant allocation and follow up,
blinding, and isolation of the experimental intervention.
3.2.3.1 Randomisation
Randomised controlled trials (RCTs) are considered to be the most rigorous
of clinical trials281 339 because in theory there should be no difference
between the control and intervention groups except the treatment being
tested. Randomised controlled trials are designed to avoid sampling bias (a
form of selection bias), a weakness of case-control and cohort studies, but
are still open to non-response bias, a different form of selection bias. This
is why it is important to use intention to treat analysis, which analyses
individual based on allocation, irrespective of whether or not the
participants actually received the allocated treatment340. Pre-specified per
protocol analyses can be carried out to examine outcomes such as adverse
events.
Randomisation should ensure that known and unknown confounding factors
are equally allocated between groups. However, because participants are
allocated to control or intervention groups randomly, it is possible that
baseline imbalances between the groups can arise by chance. It is
recommended that important prognostic variables are recorded for each
group at baseline341, allowing a comparison to be made between groups,

7/22/2019 Preventing Falls in Older People 2008
http://slidepdf.com/reader/full/preventing-falls-in-older-people-2008 109/240
109
and then if there are any major imbalance, these can be adjusted for at the
analysis stage.
However, it is not clear how such imbalances should be evaluated; testing
for statistical significance between the groups might be used, but the
question remains, is a statistically significant difference a reflection of a
failure of randomisation, or is it a chance finding and should the analyses
be adjusted342? This issue is all the more important when combining trials
with various baseline imbalance in a meta-analysis343. To overcome this
uncertainty in handling baseline imbalances, several groups have
suggested the following strategies342 344 345:
1. at the planning stage of a study baseline variables of prognostic
value should be identified on the basis of available evidence.
2. these should be fitted in an analysis of covariance or equivalent
technique for other data types.
3. other variables should not be added to the analysis unless
information from other sources during the course of the trial
suggests their inclusion.
Approaches 1 and 2 are supported by other groups – Pocok et al 346, Hauck
et al 347 who suggest adjusting for prognostically important baseline
variables, whether they are imbalanced or not. Also supporting this
approach, Hernndez et al 348
further demonstrated that adjusting for
baseline covariates improves the power of a clinical trial.
Some investigators have questioned whether randomised studies are
always preferable to non-randomised studies. Arguments in favour of non-
randomised studies exist where the effect of the intervention is so
obviously dramatic (such as defibrillation for ventricular fibrillation), or

7/22/2019 Preventing Falls in Older People 2008
http://slidepdf.com/reader/full/preventing-falls-in-older-people-2008 110/240
110
where the size, duration and cost of a randomised trial outweighs the
potential benefits of identifying rare adverse events349.
The ‘gold standard’ RCT is the double-blind placebo controlled drug trial, in
which the only variance between groups is the intervention under effect
and the placebo is identical in appearance, taste and smell to the
intervention. The classic example is a drug trial, in which sugar pills are
given in place of the intervention medication; other examples include sham
treatments or psychological placebos (e.g. talking versus counselling).
Even in these circumstances, it is has been suggested that there is a
beneficial effect from a placebo, particularly where the outcome is a
continuous measure rather than a binary outcome350. Moreover, some
placebos lead to better outcomes than others – a clinical trial comparing a
pill placebo against a sham treatment placebo found that self-reported pain
(using a continuous pain scale) was more effective than the pill placebo351.
Reasons cited for why the placebo effect might confer benefit are
regression to the mean (e.g. the natural history of hypertension is for it to
fall after an initial consultation), the effect of time (e.g. operator skill
improves, natural history of the condition is one of improvement) and
unidentified parallel interventions352.
Allocation concealment can be especially difficult when it is not possible to
blind participants to the intervention, a common feature of many therapy
intervention trials. There the therapist factors: is it the therapist’s attitude,
charisma or communication skills, or the therapy technique which they are
using that is being tested? The participant is not blinded to the fact that
they are receiving the intervention, and so may be anxious to please the
investigators, thus introduce reporting bias into their replies to outcome
measures.

7/22/2019 Preventing Falls in Older People 2008
http://slidepdf.com/reader/full/preventing-falls-in-older-people-2008 111/240
111
3.2.3.1.1 Methods of random allocation
Random allocation between the arms of a trial aims to ensure that there is
no sampling bias introduced by the investigators, but should also ensure
that any bias due to unknown effects is addressed. In a blinded RCT, it is
imperative that the allocation to the arms of the study is truly concealed,
so as not to introduce any bias353. This relies upon careful concealment of
the allocation groups from the investigators, without which treatment
effects may be artificially elevated354.
Various techniques have been used to conceal the allocation from the
investigator, ranging from the use of sealed envelopes (least reliable and
prone to tampering), through to telephone or web-based randomisation
sequences. Even the latter are prone to subversion, depending on the
nature of the allocation sequence.
The simplest form of randomisation is to toss a coin – heads being one
group, tails another. A problem with this method is that it is prone to
tampering or it might be possible for the investigator to guess which group
the next participants will be allocated, and this in turn could lead to bias.
A more sophisticated approach is to generate a series of random numbers,
with even numbers indicating one group and odd numbers the other.
Because the list is randomly generated, it is less predictable. Stratified
randomisation allocates participants randomly within blocks according to
important characteristics, such as age or location.
Block randomisation (or restriction), can be used to try and keep the
numbers in each group equal, but allows the investigator to guess the
allocation of the last participant in that block. To overcome this, random
permutated block sequences can be used355; with this technique
(Hadamard Randomization), the allocation sequence is contained within

7/22/2019 Preventing Falls in Older People 2008
http://slidepdf.com/reader/full/preventing-falls-in-older-people-2008 112/240
112
random block sizes, which make it difficult for an observer to guess the
next allocation.
Minimisation is a more refined approach and allows multiple potential
confounding factors to be taken into account; but a problem with
minimisation is that the group size can be very small356.
3.2.3.1.2 Alternative randomisation procedures
In un-blinded RCTs, participants allocated to the control group may not be
happy, having been made aware during the consent process that a new (as
yet unproven) treatment is being offered to the intervention group – this
may lead to poor compliance and/or reporting bias. Recognising this
dilemma, Zelen proposed an alternative strategy in which participants are
consented after they have been randomised357. In Zelen’s single consent
process, those allocated to the intervention are told of alterative therapies,
but those in the control group are not told about the intervention; analysis
is per the original allocation. In the double consent design, participants are
offered the initial randomisation arm treatments, but if they decline, they
are then offered the alternative therapy; again analysis is by the original
allocation. This technique is designed to help with compliance and
adherence to follow up, so reducing sampling bias.
Zelen randomisation is controversial, but has been used in clinical trials
such as those looking at screening, where it is especially important to avoid
the ‘Hawthorne effect’, in which the presence of a trial may alter the
behaviour of those in the control group. The practicalities of carrying out
such research are challenging, and require follow up ‘at a distance’ such
that the control group are not aware they are being monitored; this can be
achieved through record linkage studies or registries358. Not obtaining
consent from the control group (an ethical requirement) does mean that
this design is only rarely used.

7/22/2019 Preventing Falls in Older People 2008
http://slidepdf.com/reader/full/preventing-falls-in-older-people-2008 113/240
113
3.2.3.1.3 Public perceptions of randomisation
Although the general public understand the concept of random allocation,
they are not always persuaded of its appropriateness in the context of a
clinical trial, which is partly due to difficulties accepting the notion of
equipoise359. Equipoise is a key factor in deciding if a randomised trial is
appropriate – in the investigators mind there should be uncertainty about
which treatment option is best. The lay public appear to believe that
doctors should always know what is best – so there should be no equipoise
in a clinical setting, though this is less of an issue in the context of a
clinical trial359. This can make recruitment into clinical trials difficult; efforts
to inform potential participants about the rationale for randomisation
should focus on improving knowledge and understanding rather than
clinical aspects of equipoise359.
3.2.3.1.4 Randomisation – internal validity versus external validity
In the previous sections, some of the reasons why a randomised design
might be chosen have been highlighted, namely to reduce bias. Another
factor which makes RCTs sometimes difficult to interpret more broadly
(external validity) is the entry process. There may be differing participation
rates from one centre to another, differing practises from one centre to
another or one practitioner to another – in other words, elucidating the
precise components of a given intervention that can be extrapolated to the
wider setting. The entry criteria for an RCT may be more rigorous and not
reflect clinical practice, which is where non-randomised studies might have
an advantage. The concerns that the public hold about randomisation
(section 3.2.3.1.3) may also mean that those entering the trial may not be
not representative of the population as a whole.
The external validity of RCTs can be addressed by having pragmatic entry
criteria, which as much as possible reflect clinical practice, by using
7/22/2019 Preventing Falls in Older People 2008
http://slidepdf.com/reader/full/preventing-falls-in-older-people-2008 114/240
114
multiple centres (which allows comparison across different sites to see if
any treatment benefit holds good in different settings) and minimal
exclusion criteria.
3.2.3.2 Bias
Bias is defined as ‘any trend in the collection, analysis, interpretation,
publication or review of data that can lead to conclusions that are
systematically different from the truth’ 281. The two main forms of bias are
information bias and selection bias360. Publication bias refers to the
tendency for negative trials not to be published361 362 363 364 365, or for the
publication to be delayed366; this is more of an issue for systematic reviews
and meta-analyses than the internal validity of a trial. This is the rationale
for international trial registries, discussed in section 3.11.1.
3.2.3.2.1 Information bias
Information bias is concerned with the misclassification of information
gathered; this can be sub-divided into random and non-random
misclassification. Random misclassification can be misclassification of the
exposure independent of the outcome or vice versa; this form is non-
differential and the effect is to bias the measure of effect towards the null
hypothesis.
Non-random (or differential) misclassification can bias associations in either
direction. An example is recall bias, in which respondents either over-
report or under-report an exposure; this is a particular problem in case-
control studies, where cases and control may report exposure differently
because of their disease status. Recall bias is best overcome by having
objectively verifiable outcome or exposure measures (such as medically
verified falls as compared to self reported falls). Recall bias can be further
7/22/2019 Preventing Falls in Older People 2008
http://slidepdf.com/reader/full/preventing-falls-in-older-people-2008 115/240
115
minimised by prospectively recording outcomes, rather than relying upon
retrospective recall.
A second example is observer bias, in which the investigator interprets or
gathers information differently in different groups. Observer bias can be
reduced by using standardised outcome assessment measures, ensuring
observers are rigorously trained, and through blinding. Blinding reduces
bias that may be introduced by an awareness of the allocation group; trial
participants can be blinded to the treatment that they are offered (single-
blind trial).
Double-blinding is possible, where both the participants and the observers
are unaware of treatment allocation; a typical example would be a double-
blind placebo controlled drug trial.
Finally, triple blinding is possible, where participants, observers and the
analysts are blinded to allocation, with allocation only being revealed at the
end of the analysis. Given the impracticality of blinding participants to
allocation in this trial, the option available to reduce bias is to have the
analysis blinded to the allocation group. This was achieved by having the
allocation group recorded in a numeric code (0 or 1) in the study database,
rather than by allocation group (intervention or control).
3.2.3.2.2 Selection bias
Selection bias can be related to sampling (the initial choice of study
participants) or loss to follow up; both are major challenges in longitudinal
studies.
Sampling bias is a particular problem in case-control studies if the controls
do not represent the population from which the cases are selected. For
example, if we compared people who had fallen and attended the day
hospital to people who had fallen and not attended the day hospital, there

7/22/2019 Preventing Falls in Older People 2008
http://slidepdf.com/reader/full/preventing-falls-in-older-people-2008 116/240
116
would be a high risk of sampling bias. Individuals attending the day
hospital might be sicker or more frail than those not attending, and so any
difference between the two groups may be related to the population rather
than any intervention delivered in the day hospital. Other examples of
selection bias include case series or cohort studies reporting a positive
effect of a novel intervention compared to a group not receiving the novel
intervention – which is in fact related to patient selection. An example
would be patients selected for a novel surgical procedure, as the surgeon
might choose the fitter patients, less likely to suffer complications which in
turn lead to over inflated reported benefit from the intervention. But when
equal populations are compared in a randomised controlled trial, the
intervention may have minimal benefit or even cause harm.
Non-response bias (or loss to follow up) is a major issue, as non-
responders may be different in many ways (e.g. sicker, possibly dead) than
responders. If non-responders are not included, there is a tendency to
under-report adverse outcomes. For example, non-responders in this study
may be individuals who have fallen and been hospitalised. Equally, non-
responders may be very well and not see the point of replying to
questionnaires. In either case, loss to follow up can systematically alter the
outcomes of the trial. Different strategies may be employed in the analysis
stage to test for the effects of non-response bias (section 3.13.2).
3.2.3.3 Precision
The second aspect concerning the validity of clinical trials alluded to in
Guyatt’s statement (section 3.2.3) is precision – or the ‘estimate of
treatment effect’, a key determinant of which is random error.
Random error is ‘the divergence, due to chance alone, of an observation on
a sample from the true population value, leading to a lack of precision in
the measurement of an association’ 301. Random error is related to

7/22/2019 Preventing Falls in Older People 2008
http://slidepdf.com/reader/full/preventing-falls-in-older-people-2008 117/240
117
sampling, as individual samples of a population will always vary and it
possible that the samples selected are not representative of the population
at large.
In a type I error (or alpha error), the null hypothesis is rejected when it is
in fact true – there is no real difference between the study populations.
This is related to the statistical significance of the outcome, conventionally
measured as a p-value. Conventionally, a p-value of <0.05 is said to be
statistically significant, but in reality, the probability of erroneously
rejecting the null hypothesis is a continuous measure. A p-value of 0.04
means that the likelihood of obtaining a positive study result when the null
hypothesis is in fact true is 4 in 100. The level at which one is comfortable
in accepting the statistical significance will depend on the actual study
outcome and the context of the trial. It is important to be aware that the
more statistical tests that are carried out, the greater the possibility of
finding a statistically significant result by chance alone. This is why the trial
outcomes should be defined in advance, so that accusations of ‘data-
dredging’ can be countered.
In a type II error (or beta error), the null hypothesis is accepted when it is
in fact false. That is to say that the study result is negative, but the truth is
that the true effect is positive. The likelihood of this form of error is related
to the power of the study; the probability of a type II error is (1-power).
The power of a study should be calculated in advance, using a statistical
package (e.g. Stata or nQuery); typical acceptable values for the power of
a study would include 80%, 90% or 95%. If a trial is under-powered, and
finds that there is no difference between the groups, it would be incorrect
to state that the intervention is ineffective; it is the failure to demonstrate
an effect367. A larger trial may go on to identify the effect.
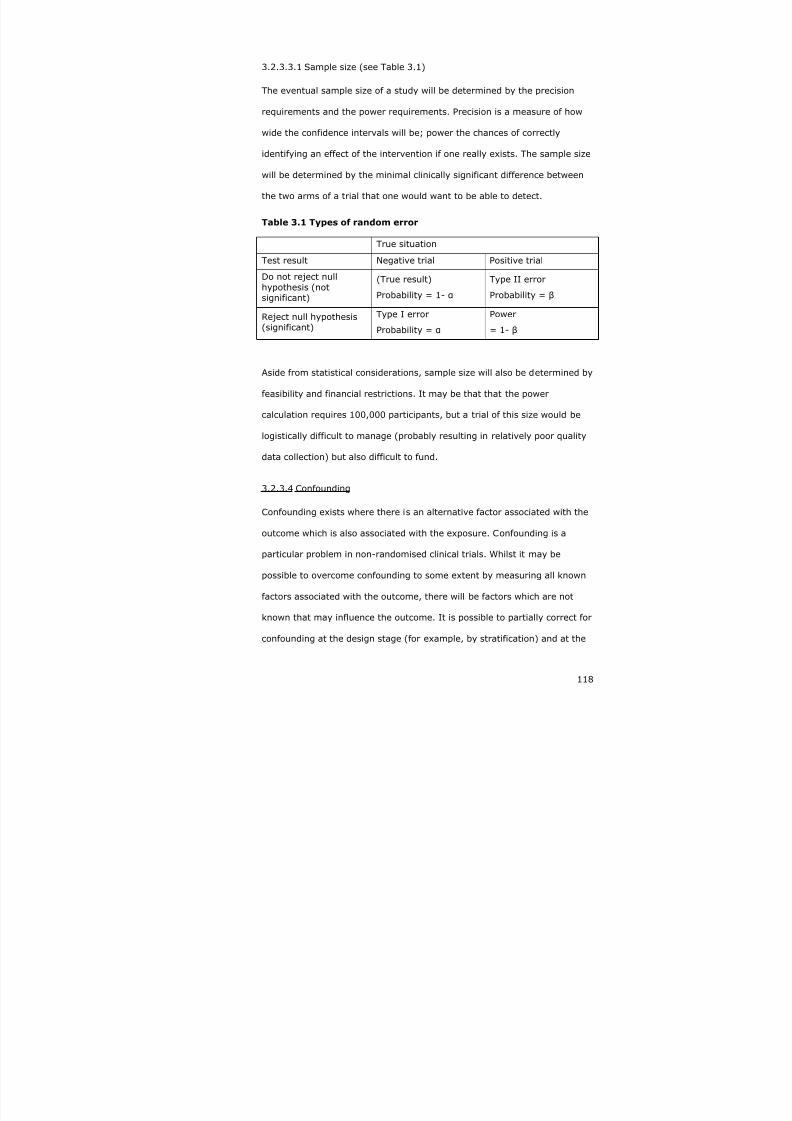
7/22/2019 Preventing Falls in Older People 2008
http://slidepdf.com/reader/full/preventing-falls-in-older-people-2008 118/240
118
3.2.3.3.1 Sample size (see Table 3.1)
The eventual sample size of a study will be determined by the precision
requirements and the power requirements. Precision is a measure of how
wide the confidence intervals will be; power the chances of correctly
identifying an effect of the intervention if one really exists. The sample size
will be determined by the minimal clinically significant difference between
the two arms of a trial that one would want to be able to detect.
Table 3.1 Types of random error
True situation
Test result Negative trial Positive trial
Do not reject nullhypothesis (notsignificant)
(True result)
Probability = 1- α
Type II error
Probability = β
Reject null hypothesis(significant)
Type I error
Probability = α
Power
= 1- β
Aside from statistical considerations, sample size will also be determined by
feasibility and financial restrictions. It may be that that the power
calculation requires 100,000 participants, but a trial of this size would be
logistically difficult to manage (probably resulting in relatively poor quality
data collection) but also difficult to fund.
3.2.3.4 Confounding
Confounding exists where there is an alternative factor associated with the
outcome which is also associated with the exposure. Confounding is a
particular problem in non-randomised clinical trials. Whilst it may be
possible to overcome confounding to some extent by measuring all known
factors associated with the outcome, there will be factors which are not
known that may influence the outcome. It is possible to partially correct for
confounding at the design stage (for example, by stratification) and at the
7/22/2019 Preventing Falls in Older People 2008
http://slidepdf.com/reader/full/preventing-falls-in-older-people-2008 119/240
119
analysis stage by adjusting for confounding variables but only if the
responsible variables have been measured.
Restriction can help to reduce confounding; for example, if smoking was
thought to be a confounding factor in a study, then recruitment could be
limited to non-smokers; however this strategy reduces the generalisability
of any findings to a non-smoking population. Alternatively, matching can
be employed (in case-control studies), such that cases and controls are
matched according to known confounding factors. The disadvantage of this
approach is that not all confounding factors may be known, so there may
be residual imbalance.
The best method of reducing confounding is randomisation. By randomly
allocating trial participants into control or intervention groups, any
confounding factors should be equally distributed between groups and
imbalance reduced. It is then possible to compare the baseline
characteristics of the groups, in this trial derived from the screening
questionnaire, in order to crudely assess if randomisation has been
successful (see 3.2.3.1).
3.3 Trial design
Give the problems of non-randomised designs in the form of confounding
and bias, a randomised control trial design was chosen as the most
appropriate method of comparing the intervention with routine practice349
.
This design is particularly strong in its ability to examine benefits and
hazards of a specific intervention while avoiding allocation bias that may be
seen in non-randomised controlled studies335. Within randomised designs,
there are two main options – individual or cluster randomised design.
Cluster randomised trials are particularly suited to assessing complex
interventions, which result in organisational-level changes. According to the

7/22/2019 Preventing Falls in Older People 2008
http://slidepdf.com/reader/full/preventing-falls-in-older-people-2008 120/240
120
Medical Research Council (MRC)368, a cluster randomised trial is
appropriate when:
• the intervention to be studied is itself delivered to and affects
groups of people rather than individuals
• the intervention is targeted at health professionals with the aim of
studying its impact on patient outcomes
• the intervention is given to individuals but might affect others within
that cluster
• if the intervention involves supplying equipment or staff to an
administrative unit, then by randomising these units rather than
individuals only a subset of the units would receive the equipment
or staff.
It might have been possible to randomise different practices to either
intervention or control, thus satisfying the first of these criteria. However,
the disadvantage of this approach is that different practices may cater for
different populations, in terms of socio-economic status, age distribution
and other confounding factors which could lead to group imbalance and
bias. This can be overcome to some extent by matching practices for
confounding variables, but matching has limitations (section 3.2.3.4). The
second and fourth of the MRC criteria do not apply to this trial but the third
option deserves consideration. Whilst contamination may not take in the
sense that individuals can only attend the day hospital ‘by invitation’, it is
possible that increased awareness of falls risk factors in the intervention
group may be transferred to controls (who with a conventional RCT may be
living in the same street or even same house as a participant in the
intervention arm). Against employing a cluster design is the loss of power
and so need to increase sample size, leading to increased cost and
complexity. Torgerson369 recommends that an individual randomised design

7/22/2019 Preventing Falls in Older People 2008
http://slidepdf.com/reader/full/preventing-falls-in-older-people-2008 121/240
121
is used unless there are very strong reasons why a cluster design should
be employed. Noting the arguments above, it was decided to use an
individual randomised design for this trial.
Finally, the collection of numerical data in a randomised controlled trial
allows the results to be more easily combined with other studies. This is
especially useful for systematic reviews and meta-analyses, which combine
the results of a series of smaller studies. For valid information to be
obtained then certain methodologies, or design considerations, have to be
followed, described in the CONSORT guidelines370, reflected in the reporting
of the RCT in this study.
3.4 Recruitment
3.4.1 Recruitment of general practices
GP practices that were registered with the Trent Focus for Primary Care
Research, Collaborative Research Network (CRN), were approached by the
researchers (DK, SC). The CRN has a Research Practices Board which
assesses studies on behalf of the member practices. This study was
submitted to the board and approved in June 2004. The CRN then
advertised the project to member practices, who then indicated their
interest in taking part in the study. The CRN Practices expressing an
interest were visited by the study nurse to explain the study, ensure that
they would be able to identify the potential participants and answer any
queries about the study protocol. These practices were asked to identify
men and women, 70 years or older registered with their practice. From this
list, those known to be suffering from a terminal illness were excluded
using the general practice register or by consulting the general
practitioners themselves. These individuals are usually well known to the
practices, but it is not possible to be sure that some were not included in

7/22/2019 Preventing Falls in Older People 2008
http://slidepdf.com/reader/full/preventing-falls-in-older-people-2008 122/240
122
the invitation list drawn up. Similarly, those known to live in a care home
(nursing or residential) were also excluded.
Recruitment of general practices was staggered over 12 months so as to
allow a gradual increase in the number of participants at each day hospital.
The practices were also contacted towards the end of the study and access
to participants records requested to ascertain the outcome data.
Participating practises were paid a small fee to reimburse staff for their
assistance with the study.
Only one CRN practice was registered in the Derby area and declined to
participate in this trial. In order to overcome this barrier, the principal
investigator at Derby (Dr J Youde) wrote to all practices within the Central
Derby PCT, inviting them to participate. Two practices were enrolled
following this invitation and were included in the trial in the same way as
the CRN practices.
3.4.2 Recruitment of day hospitals
Originally, five day hospitals agreed to participate in this study:
• Sherwood Day Hospital, Nottingham City Hospital
• Gibson Day Hospital, Nottingham
• Leengate Day Hospital, Queen’s Medical Centre
•
Derbyshire Royal Infirmary Day Hospital
• Lincoln County Hospital.
However, two day hospitals closed prior to the study start date (Gibson and
Lincoln) due to local service restructuring so had to withdraw.
Each of the participating day hospitals were briefed by the project manager
and study nurse on the study and their level of involvement. Regular
contact was maintained to ensure that the referral processes from the

7/22/2019 Preventing Falls in Older People 2008
http://slidepdf.com/reader/full/preventing-falls-in-older-people-2008 123/240
123
study to the day hospital ran smoothly. Each of the day hospitals agreed to
help with an observational audit (see 3.12), which was carried out to
assess the features of the falls prevention programmes delivered in each of
the day hospitals.
3.4.3 Recruitment of individual participants
Detailed information on the inclusion and exclusion criteria are given in
section 2.6.3, but are briefly summarised here. Individuals were eligible to
participate if they were:
•
aged 70 or over
• registered on the practice list of one of the participating general
practices
• scored 2 or more on the screening questionnaire (previous fall or
two or more other risk factors).
The exclusion criteria were:
• patients already attending one of the day hospitals
• patients under follow up with an existing primary care based falls
prevention scheme
• residents in nursing or residential homes
• patients with terminal illnesses
• those unwilling or unable to travel to the day hospital, using
transport as provided
• patients unwilling or unable to provide fully informed consent
Individuals who preferred not to participate in the randomised trial were
offered the possibility of completing monthly diaries only as part of the
screening cohort (2.5).

7/22/2019 Preventing Falls in Older People 2008
http://slidepdf.com/reader/full/preventing-falls-in-older-people-2008 124/240
124
3.4.3.1 Recruitment interviews
Recruitment of individuals was carried out by three researchers (SC, RT,
JE). The general practices were provided with recruitment packs,
containing a letter of introduction (signed by one of the general
practitioners at each practice), a screening questionnaire, a patient
information leaflet and a reply-paid envelope. Each pack was in a sealed
envelope and the addresses of potential participants were affixed by the
practice staff, who then arranged for the invitation to be posted.
On receipt of a completed questionnaire indicating that the individual was
willing to participate further in the study, one of the three researchers
responsible for recruitment made telephone contact with the potential
participant. The telephone conversations followed a standardised format. If
the individual was willing to participate, verbal consent was obtained over
the telephone. On a few occasions, a home visit was required to recruit
individuals (for example, where hearing or vision was an issue).
Day hospital and primary care falls prevention service records were
checked to ensure that the potential participant was not currently attending
the service or under active follow up (exclusion criteria). Active follow up in
this context was defined as regular visits with either of the services, or on-
going telephone contact between the service and the participant.
A consent form was then mailed to the individual, who was asked to sign
and return the form. On receipt of the consent form, those participating in
the RCT were then randomised to either usual care or the day hospital falls
prevention programme (see section 3.9 for details). A letter of confirmation
was sent out to the participant (both groups) along with their first monthly
diary and a generic falls prevention information pack (Slip, trips and broken
hips, Department of Health, now out of print).
7/22/2019 Preventing Falls in Older People 2008
http://slidepdf.com/reader/full/preventing-falls-in-older-people-2008 125/240
125
3.4.3.1.1 Cognitive impairment and capacity
The issue of cognitive impairment in the context of this study is important
for two main reasons. Firstly, cognitive impairment is a strong predictor of
future falls (section 1.3.8). Secondly, cognitive impairment raises the issue
of capacity to consent.
It is possible to measure cognitive impairment without a face-to-face
interview; a telephone assessment of cognitive function371 was used in the
Heart Protection Study as a proxy marker of cognitive impairment372.
Unfortunately there were insufficient resources in this trial to be able to
measure cognitive function in all trial participants. However, most
participants attending the day hospital underwent a mini-mental state
examination and, assuming there was no failure of randomisation, it is
reasonable to extrapolate the findings from this arm of the study to the
controls and hence describe the cognitive function of the trial population.
The problem with this approach is that individuals with significant cognitive
impairment may not actually get to the day hospital (because they forgot
the appointment for example) and so the MMSE score of those attending
the day hospital may not truly reflect that of the day hospital cohort.
On a more pragmatic note, the recruitment process for the trial excluded
individuals with major cognitive impairment, as potential participants
needed to be able to read, complete and return the screening questionnaire
as well as give verbal consent over the telephone. This means that the trial
results will not be generalisable to individuals with significant cognitive
impairment.
Aside from measuring cognitive impairment as a possible risk factor for
falls, it can also be argued that some measure of cognitive impairment
should be undertaken in order to ascertain the individuals’ capacity to give
consent to participate in the trial. However, cognitive impairment does not
7/22/2019 Preventing Falls in Older People 2008
http://slidepdf.com/reader/full/preventing-falls-in-older-people-2008 126/240
126
correlate well with capacity to give consent373. People with no cognitive
impairment may lack the capacity to participate in a clinical trial, whereas
some people with mild-moderate cognitive impairment may have capacity
to participate. Capacity requires that an individual can understand, retain
and manipulate the information being presented to them374. The trial
recruitment process catered for these requirements, through a step-wise
consent process – understanding the initial invitation, completing the
screening questionnaire, telephone discussion about the trial and then a
final opportunity to reflect before signing and returning the consent form.
Given the degree of active involvement the intervention arm of the trial
required, it was felt to be inappropriate to use assent to participate when
individuals themselves did not have capacity to give consent.
3.4.3.1.2 Discussing risk
A potential problem with screening is that individuals are appraised of their
potential risk of an event, which they had not previously considered. It is
important that the issue of risk is handled sensitively, so as not to
engender excessive fear or anxiety, and using language which is easily
understandable to communicate what can be difficult concepts375. Methods
used to introduce the concept of risk in this study include the provision of
the patient information leaflet at the outset, which discusses the risk of
falling and the telephone contact made on receipt of the completed
questionnaire. The recruitment discussion handled the concept of risk of
falling in a matter of fact manner, rather than giving an impression of
imminent danger. For example, ‘according to the questionnaire that you
completed, we think that you might be at risk of falling in the future. Do
you worry about falling… ?’ In fact, many of the individuals contacted were
already aware of their risk of falling from anecdotal information from their
friends or relatives.

7/22/2019 Preventing Falls in Older People 2008
http://slidepdf.com/reader/full/preventing-falls-in-older-people-2008 127/240
127
Evidence that came to light during the lifetime of the trial suggested that
talking to older people about the risk of falling and the dangers of falling is
not very helpful and tends to dissuade rather than encourage participation
in falls prevention programmes218. Rather, a more positive approach is
suggested218, emphasising the benefits of exercise on general health and
well-being, avoiding a focus on falls per se; we adjusted our recruitment
interviews accordingly.
Individuals asking advice about reducing their risk of falling during the
recruitment discussions were given simple guidance, for example about
maintaining activity, increasing awareness of home hazards and in the first
instance contacting their general practitioner of they were concerned about
their health or medication. They were referred to the falls prevention leaflet
and for those with internet access, to the study website (now closed).
There was no attempt to quantify the level of risk for a given individual
beyond high or low risk. There is no equivalent of the Framingham tables
for coronary heart disease that can generalise risk of falling for an
individual. In any event, epidemiological data has limited relevance for a
given individual, but describes a population and ascribes a risk or likelihood
of an outcome given certain risk factors. Accepted descriptors of risk were
not though to be useful in this study, given the high background
prevalence of falls (Table 3.2).
Table 3.2 European verbal descriptors of harm376
Verbal Frequency Probability
Very common Over 10% More than 1 in 10
Common 1-10% 1 in 100 to 1 in 10
Uncommon 0.1-1% 1 in 1000 to 1 in 100
Rare 0.01-0.1% 1 in 10000 to 1 in 1000
Very rare Less than 0.01% Less than 1 in 10000
7/22/2019 Preventing Falls in Older People 2008
http://slidepdf.com/reader/full/preventing-falls-in-older-people-2008 128/240
128
For the purposes of this study, it was felt reasonable to leave the
discussion of risk as stated above. Support for participants was provided
through ready telephone contact with the study nurse (all participants were
provided with contact numbers) and access to a website
(http://www.fallsprevention.org – now defunct).
3.4.4 Retention of study participants
Aside from monthly postal reminders, telephone contact was maintained
with the participants every three months. Additionally, a quarterly study
newsletter was dispatched with the diaries and a study website was
maintained, with the aim of keeping participants interested in the study
and maximising retention377. Participants were regularly thanked for their
on-going involvement in the study, when contacted by members of the
study team and those that were interested will be sent copies of major
reports resulting from the trial.
3.5 Intervention under evaluation
Randomised controlled trials require that the interventions under
evaluation are un-ambiguous, well defined and amenable to measurement.
The individual components of the multifactorial intervention delivered in
isolation (medical review, strength and balance training and a home
hazards assessment) are detailed below.
3.5.1 Medical assessment and treatment
The medical assessment included a clinical history (including medications);
a full physical examination including visual acuity and orthostatic blood
pressure measurement; laboratory tests where indicated; 12-lead ECG and
where appropriate a neurovascular assessment (carotid sinus massage and
tilt tests). Treatments varied according to the medical diagnoses made and
included a medication review, appropriate referral to an optician or
7/22/2019 Preventing Falls in Older People 2008
http://slidepdf.com/reader/full/preventing-falls-in-older-people-2008 129/240
129
ophthalmologist for visual impairment and referral to other specialists
where necessary.
3.5.2 Physiotherapy assessment and individualised therapy
programme
The physiotherapy intervention included an assessment of gait, balance,
mobility and muscle strength. The original intention was to use the Tinetti
method206 and measurement of ankle dorsiflexion strength378 as standard,
but as the different day hospitals had slightly different policies and
practice, this was not possible. Interventions included gait re-education
and functional training programme using the principles of Koch379, and a
muscle strengthening exercise programme based on a modified Dunedin
protocol32, and where indicated the provision of an appropriate walking aid.
Again, local policies and practice varied in the specific interventions
delivered. Feet and footwear were assessed for abnormalities that could
impair gait and appropriate referrals to a chiropodist or an orthotist were
made when necessary. The number and timings of follow up visits at the
day hospital for further assessment and therapy varied according to the
individualised needs of the participants.
3.5.3 Occupational therapy assessment and modifications
The occupational therapy intervention included an interview with the
participant using a standardised checklist to investigate home hazards380
.
Where necessary, a home visit was also performed. The aim of a home
visit was to identify any potential hazards that may increase the risk of
falling, such as poor fitting carpets, poor lighting and access problems. Any
interventions necessary were recommended and arranged if the participant
gave permission.
7/22/2019 Preventing Falls in Older People 2008
http://slidepdf.com/reader/full/preventing-falls-in-older-people-2008 130/240
130
3.5.4 Control group
The control group received usual care. Despite increased awareness of the
importance of preventing falls and the interventions available, there was
relatively little preventative work being carried out at the time the study
started. People at risk of falls but who had not presented to the health
service because of a fall related issue, receive little, if any intervention.
Accordingly, the usual care group did not receive a specific intervention,
reflecting usual practice. If they came into contact with a falls prevention
service during the course of the study, this was considered usual practice
and did not constitute a breach of protocol. This reflects current practice
throughout most of the United Kingdom2 10 and so adds to the
generalisability of the trial.
Individuals in the usual care group received the same patient information
leaflet and falls prevention leaflet as the intervention group, and were
asked to complete the diaries on the same monthly basis. No additional
treatment was offered.
3.6 Outcome Measures
Randomised controlled trials demand that the interventions evaluated are
amenable to measurement and that outcome measures are, where
possible, standardised, relevant, reliable, valid and sensitive381. Using
established standardised measures with well defined and comprehensive
instructions reduces ambiguity and improves consistency382. The use of
standardised measures will:
• provide a trial with meaningful results
• allow them to be communicated more easily
• allow them to be compared with other trials
7/22/2019 Preventing Falls in Older People 2008
http://slidepdf.com/reader/full/preventing-falls-in-older-people-2008 131/240
131
• allow them to be used in subsequent studies such as meta-analysis
and systematic reviews.
Many conventional trials use mortality as the primary outcome measure.
However, for falls studies, mortality is not the most important outcome.
Frail older people have limited life expectancy and may die during the
study, often for reasons unrelated to falls; cardiovascular disease, cancers
and other important causes of mortality are common in old age. This is
increasingly being seen in cancer trials as survival improves, there is a
move away from using mortality as an endpoint, towards using
intermediate outcomes, such as disease free survival383.
No single trial can feasibly aim to address the common causes of mortality
in older people, in contrast to studies involving younger people, where
there is usually only a single pathology. However, it is clearly important to
be sure that the intervention in question does not increase mortality, and
so death is included as a secondary outcome. It is good practice to analyse
function and mortality, because no intervention would be judged useful if it
prevented disability but, at the same time, reduced survival384.
3.6.1 Baseline demographic and clinical characteristics
In an adequately sized trial with effective randomisation, any differences in
baseline characteristics and possible prognostic factors between the control
and intervention groups will arise by chance alone. However, it is important
that there is some record of the baseline characteristics of the trial
participants to be able to compare the two groups at outset in case of any
major discrepancies. Baseline characteristics available for all trial
participants include the following:
• age/date of birth
• gender

7/22/2019 Preventing Falls in Older People 2008
http://slidepdf.com/reader/full/preventing-falls-in-older-people-2008 132/240
132
• responses from the screening questionnaire
• fall in the previous twelve months
• taking more than four prescribed medications
• previous stroke
• Parkinson’s disease
• inability to stand from a chair without using arms to push up
(muscle weakness)
• symptoms of dizziness on standing
• use of a mobility aid
• housebound (mobility impairment).
3.6.2 Primary outcome: rate of falling over a 12 month period post
recruitment
Previous primary care based falls studies report falls related outcomes over
a period of one year9 30 31 34-36 224. One year is an appropriate time, as it
allows time for the intervention to take effect. Broadly, people who fall can
be divided into two categories; first, recurrent fallers who will have many
falls over a short period of follow up; second, people who have occasional
falls, possibly less than once per year. The intervention needs to show an
impact upon both groups of fallers if it is to be successful and subsequently
employed in a primary care based prevention strategy.
Falls rate is a fundamental outcome - each fall accumulates risk for
fracture, admission, loss of confidence and other adverse outcomes. Using
the rate of falls as the outcome measure introduces the element of time,
allowing the best use of the data collected (see section 3.14.3); as the
population being studied is relatively frail and older, it is likely that
significant numbers of participants will drop out over time – typically 20%

7/22/2019 Preventing Falls in Older People 2008
http://slidepdf.com/reader/full/preventing-falls-in-older-people-2008 133/240
133
in trials on similar populations385 386. This may be due to a variety of
reasons, including death, move to a care home (study end-points), ill-
health or because they simply do not want to participate any further. This
is especially likely in the day hospital intervention group, who may find the
travel to the day hospital tiresome. By using the rate of falls, we are able
to capture outcomes over the period of an individual’s participation in the
study.
Ideally, falls caused by syncopal episodes should also be considered
separately384. However, without key witness informants to verify the nature
of the fall, it is difficult to ascertain if a fall involved a loss of
consciousness. Syncopal falls are frequently associated with amnesia,
either antegrade or retrograde, such that the informant may not reliably
recall the true nature of the fall387. Rather than introduce yet more
reporting error, all falls were considered conjointly, irrespective of the
aetiology. Published studies record the rate of syncopal falls in community
dwelling individuals as 3%388 389, but these figures may well be an
underestimate of the true rate of syncopal falls because of associated
amnesia.
By contrast, it was possible to ascertain falls associated with major injury
and attendance at primary or secondary care services through examining
health service records. This enabled discrete analysis of injurious and non-
injurious falls.
The definition of a fall used in this study was the most commonly used
definition, identified in a recent Cochrane review9 of falls interventions -
'unintentionally coming to rest on the ground, floor or other lower level;
excludes coming to rest against furniture, wall, or other structure'.
This clarifies that falls due to syncope are to be included as a primary
outcome measure. The actual definition given to study participants was:

7/22/2019 Preventing Falls in Older People 2008
http://slidepdf.com/reader/full/preventing-falls-in-older-people-2008 134/240
134
‘We want to know about any falls you have that caused you to land on the
ground or a bed or chair, whether you pass out or not. A stumble or near
miss does not count ’.
3.6.3 Secondary outcomes
For this trial, the most appropriate primary outcome was deemed to be a
reduction in the rate of falls. It can be argued that falls are only a
surrogate for more robust outcome measures, such as fractures. But falls
represent more than just a risk of fracture for older people. Falls can be
viewed as a syndrome, which encompasses many domains: frailty, multiple
comorbidities, fractures, fear of falling and functional decline. The
secondary outcomes used in this trial are designed to capture some of
these elements.
3.6.3.1 Medically validated versus self reported falls
We examined primary and secondary care records for all participants in the
RCT searching for falls related consultations and medically validated falls.
3.6.3.2 Proportion of people with single or recurrent falls
There are advantages to using multiple falls instead of any fall as an
endpoint. Isolated falls are more likely to be random, ‘one-off’ events,
whereas recurrent falls are usually associated with underlying neurological
or musculoskeletal problems and are a stronger predictor of negative
health outcomes30 295 390. We analysed both arms of the trial looking for
differences in single versus recurrent (two or more) falls.
3.6.3.3 Fall-related injuries
Falls related injuries clarify the consequences of the fall and are useful
comparators. Falls associated with major injuries were analysed separately
from non-injurious falls.
7/22/2019 Preventing Falls in Older People 2008
http://slidepdf.com/reader/full/preventing-falls-in-older-people-2008 135/240
135
In order to standardise reporting of injuries in such a way as to ensure
external comparability, the Severity of Injury Scale391 was used to code
injuries. This is a relatively simple, internationally recognised injury
severity score, detailed below:
• no injury
• minor (abrasion, contusion)
• moderate to serious (laceration, tissue tear, haematoma, impaired
mobility due to injury, fear of subsequent fall and fall injury)
• serious (fracture, multiple fracture, subdural haematoma, head
injury).
3.6.3.4 Time to first fall
At best falls prevention programmes can be expected to reduce falls rates
by up to one-third, they do not abolish falls completely. However, they
may delay the time to the next fall, which may in turn be beneficial to
patients. Time to first fall was a pre-specified secondary outcome, as
recommended by the ProFANE task force392; time to second fall was also
calculated as a post hoc analysis.
When carrying out a survival analysis for time to first fall, censoring should
consider individuals who do not complete the full follow up period of the
study. Individuals may fail to complete the full period of follow up for four
possible reasons:
• death directly related to a fall
• death from non-falls related disease
• migration (out of the study)
• they join the study too late to complete the full follow up period (not
applicable in this study).
7/22/2019 Preventing Falls in Older People 2008
http://slidepdf.com/reader/full/preventing-falls-in-older-people-2008 136/240
136
Accordingly only including the period under follow up is important so as not
to bias the results of the survival analysis.
3.6.3.5 Mortality
In many cases, mortality and the primary outcome are correlated or
‘censoring from mortality’ is informative. This is the case with falls, which
are associated with a significant 2.6-fold increase in mortality rate131.
Mortality was checked against primary and secondary care records.
3.6.3.6 Disability or activity limitation
A measure of functional ability is essential in any trial involving older
people, as function is a key determinant of quality of life and a useful
comparator across studies384. The standard measures of disability included
in this trial are the Barthel index of activities of daily living and the
Nottingham Extended Activities of Daily Living (NEADL) scale. Both the
Barthel index and NEADL are well validated measures of functional abilities
and can be used as postal questionnaires185. The two measures are
complementary; the Barthel index is a 10 item scale which assesses basic
function, such as mobility, personal care and continence, with scores
ranging from 0 (dependant) to 20 (independent). The NEADL assess higher
function; it comprises 22 activities of daily living self-report items, divided
into four domains: mobility (six activities), kitchen (five activities),
domestic (five activities) and leisure (six activities), with scores ranging
from 0 (dependant) to 66 (independent).
3.6.3.7 Fear of falling
Several scales are available for measuring fear of falling, but two that have
been validated in the United Kingdom include the Falls Efficacy Scale (FES-
UK) and the Activities-specific Balance Confidence scale (ABC-UK). Previous
studies suggest that the FES had the better postal completion rate (94%

7/22/2019 Preventing Falls in Older People 2008
http://slidepdf.com/reader/full/preventing-falls-in-older-people-2008 137/240
137
versus 86%), and both scales are able to detect differences in falls related
quality of life measures when compared to non-falling controls393. The FES
has been validated in the UK as both a face to face and self-completed
questionnaire. On a more practical note, the FES is more widely used in the
local services and so staff involved in the trial would be more familiar with
this measure should the study participants have any queries about the
scale. The FES consists of ten items with each item being scored from 1
(most confident) to 10 (least confident).
3.6.3.8 Quality of life
Quality of life measures are important for two main reasons. Firstly, they
acknowledge the impact of falls upon quality of life and secondly, they
facilitate measurement of cost-utility. The measure used to determine
quality of life for this study was the EuroQoL-5D, which is well validated
and a useful cross study comparator. The EuroQoL contains five items
(mobility, self care, participation, pain and mood), each scored from 1 (no
problems) to 3 (extreme problems). It is a key determinant in the
economic outcome analyses. The York A1 Tariff scoring algorithm was used
to convert EuroQoL scores into a utility score394, which is used for economic
analyses (not discussed here).
3.6.3.9 Institutionalisation, use of services and cost analysis
The self-reported institutionalisation data (change of residency – move to a
care home or sheltered accommodation) were corroborated though
reference to primary care records. Health service utilisation was collected
in a similar manner, from both primary and secondary care records.
Participants also returned monthly information on any assistance that they
required:
• help with ADLs (carer, relative, paid/unpaid)

7/22/2019 Preventing Falls in Older People 2008
http://slidepdf.com/reader/full/preventing-falls-in-older-people-2008 138/240
138
• meals delivered (funding)
• equipment purchased because of falls (e.g. mobility aid)
• any home adaptations made because of falls and costs.
3.6.4 Ascertaining outcome measures
Postal questionnaires were used to collect the outcome data. Postal
questionnaires have several advantages over face to face assessment324:
• they reduce the chance of observer bias (misclassification) – a face
to face interviewer may be aware of the allocation of the individual
in this single–blind trial and so may record outcomes differentially
• they are practical to use for large trials
• they are relatively inexpensive
• they are relatively unobtrusive for the participant (as compared to
arranging a follow up interview with an observer).
However, there is a possibility that some participants are unable to
complete the questionnaire due to physical limitations, eyesight or inability
to read English. Participants who were unable to complete and return the
questionnaires were offered the help of the study nurse who would visit
them at home. Participants who were sent a questionnaire but who did not
return it were contacted by the study nurse and offered a second posting
or a visit at home. When questionnaires were returned with questions
missing or ambiguous answers given, the independent assessor contacted
the participant by telephone and asked about individual questions. These
steps should have prevented recall bias arising from higher response rates
in those given active treatment, if post alone was used324.

7/22/2019 Preventing Falls in Older People 2008
http://slidepdf.com/reader/full/preventing-falls-in-older-people-2008 139/240
139
3.6.4.1 Primary outcome measure: falls
Obtaining high-quality reports of falls is resource intensive. Older persons
may forget falls, and fall ascertainment based on long-term recall is
incomplete. Cummings et al 26 followed up 325 community dwelling men
and women over one year using weekly falls diaries. At one year, 13% of
participants were unable to recall incident falls and a further 7% recalled
falls that were not otherwise corroborated. Failure to recall falls was
associated with a statistically, but not clinically significant one-point
reduction in the Mini-Mental State Examination. However, there is no
better method of recording falls available at the present time.
Most major falls studies have used follow up diaries, supplemented by
telephone contacts. For community-dwelling older persons, the gold
standard for tracking falls requires asking participants to mail a follow up
card weekly or monthly, soliciting non-responders, and characterising each
event by directly visiting the participants26 395. In this study, it would not
have been possible to characterise each event through a direct visit. With
nearly 400 trial participants and with an expected rate of falls of 2/year per
person36, we could have anticipated around 800 events that would have
required corroboration. Given the wide geographical spread of participants
(Nottinghamshire and Derbyshire) and the limited resources (staff and
financial), it would have been difficult to verify each event
contemporaneously. However, the study team maintained regular
telephone contact with study participants to ensure as well as possible the
accuracy of any reported events, checking information where diary record
were unclear.
For this study, falls were recorded by giving each participant a diary and
reply paid envelope. Participants were asked to record falls in the diary,
along with the outcome (saw GP, phoned ambulance, sent to hospital,

7/22/2019 Preventing Falls in Older People 2008
http://slidepdf.com/reader/full/preventing-falls-in-older-people-2008 140/240
140
injuries). The diaries were mailed back to the research team at the end of
every month. Participants who had not returned the diaries within three
days of the end of the month were contacted via telephone by the study
nurse to encourage return of the diaries. Those requiring help to complete
the diaries were visited at home. Previous falls trials using similar
methodology obtained a 90% response rate, with 20% of participants
requiring telephone contact and 10% a visit to help complete the diaries
( personal communications, Fiona Shaw & Lesley Day ). Falls were
monitored until withdrawal from the study, death, admission to care home
or the end of 12 months follow up, which ever event occurred first.
3.6.4.2 Secondary outcome measures
The principal method was self-reporting using the monthly diary. This
contained a section on falls and the outcomes (carried on as usual, called
for help, waited for someone to help, called GP, called ambulance, taken to
hospital, nature of any injury). Additionally, there was a section for
recording health service utilisation, covering primary care contacts and
hospital admissions.
The self-reported falls outcomes were supplemented by recording falls
related attendances logged in primary or secondary care records. For
hospital admissions, the speciality relating to the admission and the length
of stay were obtained. This level of information allowed a more accurate
ascertainment of events as well as the costs associated. Information on
falls-related drug treatment (such as bone protection therapy) was
obtained from the GP records. These data were collected by the project
manager (SC) and the study nurse (RT) on standardised forms.
Fall-related injuries data were collected from the diary information,
supplemented by telephone interview where appropriate. As above, falls-
7/22/2019 Preventing Falls in Older People 2008
http://slidepdf.com/reader/full/preventing-falls-in-older-people-2008 141/240
141
related injuries recorded on primary or secondary care records were also
collated.
Disability and quality of life were self reported by study participants using
postal questionnaires at one year. They were contained within the end of
study booklet. Where participants’ responses were unclear, the study nurse
contacted the individual by telephone or personal visit to corroborate the
data.
Institutionalisation data were available from practice registers when not
available directly from participants. Those who changed practice as a result
of changing address were traced through the primary care trusts.
Mortality was ascertained from primary care records and cross-referenced
against hospital records.
3.7 Sample size
Previous falls prevention studies had a baseline falls rate of 1/year to
3/year per participant9 30-36. A systematic review of falls interventions8
identified 22 studies which reported falls outcomes using proportions with
one or more falls, and 27 studies which reported rates of falling. In many
of the papers reported there seems to be inconsistency between the
analysis and sample size calculation. For example, the PROFET study36 was
powered to detect a reduction in fall rate from 2/year to 1.4 per year, with
a sample size of 352; however the analysis was a logistic regression of at
least one fall. A paper by Robertson31 used proportions for sample size
calculations, but negative binomial models for analysis of falls rates.
In the absence of any clear, definitive guidance we powered the study for a
reduction in rates of falling. After we had agreed this approach, the
Prevention of Falls Network Europe published their paper on reporting falls,
suggesting fall data should be summarised as the number of falls, number
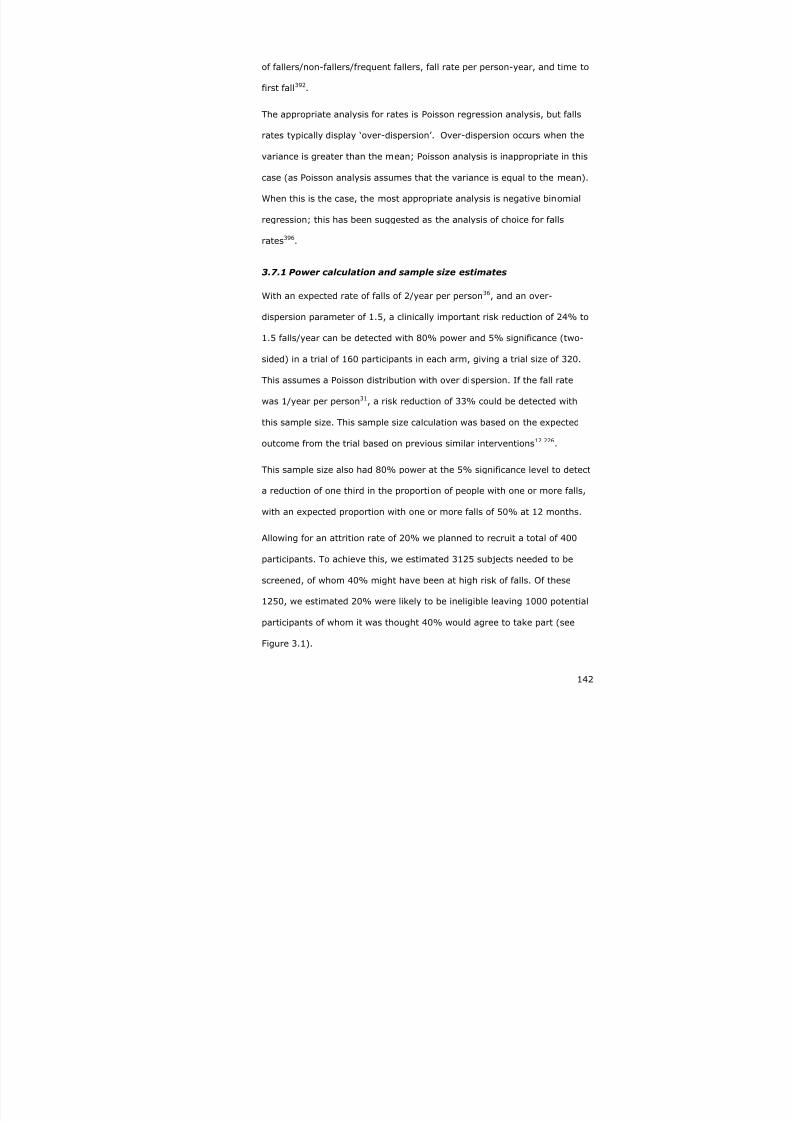
7/22/2019 Preventing Falls in Older People 2008
http://slidepdf.com/reader/full/preventing-falls-in-older-people-2008 142/240
142
of fallers/non-fallers/frequent fallers, fall rate per person-year, and time to
first fall392.
The appropriate analysis for rates is Poisson regression analysis, but falls
rates typically display ‘over-dispersion’. Over-dispersion occurs when the
variance is greater than the mean; Poisson analysis is inappropriate in this
case (as Poisson analysis assumes that the variance is equal to the mean).
When this is the case, the most appropriate analysis is negative binomial
regression; this has been suggested as the analysis of choice for falls
rates396.
3.7.1 Power calculation and sample size estimates
With an expected rate of falls of 2/year per person36, and an over-
dispersion parameter of 1.5, a clinically important risk reduction of 24% to
1.5 falls/year can be detected with 80% power and 5% significance (two-
sided) in a trial of 160 participants in each arm, giving a trial size of 320.
This assumes a Poisson distribution with over dispersion. If the fall rate
was 1/year per person31, a risk reduction of 33% could be detected with
this sample size. This sample size calculation was based on the expected
outcome from the trial based on previous similar interventions12 226.
This sample size also had 80% power at the 5% significance level to detect
a reduction of one third in the proportion of people with one or more falls,
with an expected proportion with one or more falls of 50% at 12 months.
Allowing for an attrition rate of 20% we planned to recruit a total of 400
participants. To achieve this, we estimated 3125 subjects needed to be
screened, of whom 40% might have been at high risk of falls. Of these
1250, we estimated 20% were likely to be ineligible leaving 1000 potential
participants of whom it was thought 40% would agree to take part (see
Figure 3.1).

7/22/2019 Preventing Falls in Older People 2008
http://slidepdf.com/reader/full/preventing-falls-in-older-people-2008 143/240
143
The most appropriate power calculation asks ‘what is the minimum
clinically significant difference that we want to be able to detect?’ Having
opted for a 24% risk reduction, this trial was at risk of missing a risk
reduction less than 24% because of a type II error. For example, we could
have missed a 15% risk reduction, which would have remained clinically
significant. A selection of sample size calculations are shown below; these
do not account for the over-dispersion parameter, so are not precise, but
do give an indication of the order of magnitude that the sample size would
need to be in various scenarios.

7/22/2019 Preventing Falls in Older People 2008
http://slidepdf.com/reader/full/preventing-falls-in-older-people-2008 144/240
144
Table 3.3 Sample sizes for different IRRs (alpha=0.05, beta=0.2)
Estimated rate incontrol group (fallsper person-year)
Estimated rate inintervention group (fallsper person-year)
Incidence
rate ratio
N per
group
Total N
2 1.8 0.9 745 14902 1.53 0.85 322 644
2 1.224 0.8 176 353
2 0.918 0.75 110 220
1.8 1.62 0.9 828 1655
1.8 1.53 0.85 358 716
1.8 1.44 0.8 196 392
1.8 1.35 0.75 122 244
1.6 1.44 0.9 931 18621.6 1.36 0.85 403 806
1.6 1.28 0.8 220 440
1.6 1.2 0.75 137 274
The shaded lines in Table 3.3 indicate the effect size that could be missed
with a sample size of 320 at various baseline falls rates. A 10-20% effect
size could have been missed as a result of a type II error.
3.8 Study design
The prospective study design is shown in Figure 3.1.

7/22/2019 Preventing Falls in Older People 2008
http://slidepdf.com/reader/full/preventing-falls-in-older-people-2008 145/240
145
Figure 3.1 Prospective plan of the study
N=1250
Excluded or decline (somebaseline data available)
N = 600
Eligible
Telephone call
Consent posted
with baseline datacollection
Stratification bycentre. N = 400
Control
N = 200
Intervention
N = 200
Follow up data, n = 360
Monthly falls diaries
1 year follow up data – QoL, ADLs,service utilisation
20%ineligible
(Estimate)
40% accept
Screeningquestionnaire
N= 3125
40% at high risk of falls Follow up monthly (brief diary & end ofstudy booklet) for ‘low risk’ or excludedwho have returned the questionnaire
20% dropout rate
Low risk; agree to enterscreening cohort

7/22/2019 Preventing Falls in Older People 2008
http://slidepdf.com/reader/full/preventing-falls-in-older-people-2008 146/240
146
3.9 Randomisation and stratification
Stratification was used in this trial to facilitate balanced groups of
participants. Participants were stratified by centre (Nottingham versus
Derby) only. The block size was of a random size to maximise allocation
concealment. The randomised list was produced by the study statistician
(CC) and Trent Institute for Health Services Research; none of the other
members of the study group had access to the randomisation list. Initially,
randomisation was carried out by telephone, and then moved to a web
based system (maintained by the Nottingham Clinical Trials Support Unit –
CTSU), using the same schedule.
3.10 Blinding
As discussed in section 3.2.3.2, it was not possible to blind participants to
their allocation group, nor the day hospital staff, due to the nature of the
intervention. It may have been possible to confer some degree of blinding
in this trial by randomising one group to the evidence based intervention
(strength and balance training, home hazards assessment and medical
review), and the other group to a sham treatment delivered in the day
hospital which did not contain these ‘ingredients’. However the ethics of
offering such a control are unclear. All analysis was carried out by blinded
assessors.
3.11 Research governance and ethical considerations
Ethical Approval was sought and granted by Nottingham 2 Ethics
Committee (reference 04/Q2404/93). The principles of research
governance were followed397. Under the then new research governance
framework, all studies required a formal sponsor. Nottingham City Hospital
agreed to sponsor this study, in collaboration with other participating
centres. A study agreement was prepared by the research and

7/22/2019 Preventing Falls in Older People 2008
http://slidepdf.com/reader/full/preventing-falls-in-older-people-2008 147/240
147
development department at Nottingham City Hospital, detailing shared
governance and indemnity arrangements between the main study centres.
In order to comply with research governance guidance, participants were
first contacted by their general practitioner with a letter inviting them to
complete the screening questionnaire and return to the investigators if they
were interested in participating in the study. The invitation pack included
the screening questionnaire and a patient information leaflet. It was made
clear in the documentation that by returning the screening questionnaire,
the participants were under no obligation to take part in the study.
The process for obtaining informed consent is described in section 3.4.3. All
participants were provided with the contact details and information about
the study. It was explained that they were free to withdraw from the study
at anytime without giving a reason and that their normal medical care
would not be affected. Participants were also reassured that all information
would be treated as confidential and stored securely.
All information obtained from participants was coded with a subject number
to ensure confidentiality. Identifiable personal details and consent forms
were kept in a locked filing cabinet. All computer records and data sets
were password protected.
3.11.1 International Standard Randomised Control Number
The growth in prospective registration of randomised controlled trials has
accentuated the need to distinguish between different trials. Trials are
usually referred to by a series of grant numbers, protocol numbers, trial
names and acronyms which can make it difficult to determine whether
reports, publications or entries in trial registers refer to the same trial or
not. To provide an accurate reflection of the research activity in a particular
area it is important that each trial is counted only once and that

7/22/2019 Preventing Falls in Older People 2008
http://slidepdf.com/reader/full/preventing-falls-in-older-people-2008 148/240
148
unintended duplication between registers is avoided. The International
Standard Randomised Control Number (ISRCTN) is a randomly generated,
8-digit number, prefixed by the code ISRCTN that uniquely identifies each
trial in the ISRCTN Register.
The ISRCTN should be quoted in all publications relating to the trial, in
order to:
• clearly identify the trial and prevent mistaken identity
• help to detect duplication in current registers of trials, and to avoid
trial double-counting when assessing a field of research activity
• enable tracking of the trial from inception to completion, and
beyond.
The ISRCTN for this trial, registered with controlled-trials.com
(http://www.controlled-trials.com/isrctn/) is ISRCTN46584556.
The trial protocol was submitted to Trials, an on-line journal
(http://www.trialsjournal.com/content/7/1/5), in January 2006, prior to
any of the analyses being performed. This was done to avoid the possibility
of retrospective data analysis, i.e. searching for significant outcomes once
initial analysis had been undertaken (‘fishing expeditions’).
3.12 Process monitoring
A variety of processes were employed to monitor the interventions
delivered to participants attending the day hospital, discussed below.
3.12.1 Behavioural mapping
Behavioural mapping is a technique for observing and describing
'environmental influences upon behaviour'398. Behavioural mapping is
suitable for the observation of the physiotherapy and occupational therapy
activity since the use of a carefully designed chart is 'quick and easy'398.

7/22/2019 Preventing Falls in Older People 2008
http://slidepdf.com/reader/full/preventing-falls-in-older-people-2008 149/240
149
This technique has been used in a number of studies on stroke
rehabilitation399-401 to determine the amount of time spent in therapy and
in other tasks. The results of these studies showed that potentially more
time could be spent in therapeutic activities399. In an observational study of
15 stroke patients402, only 13% of the working day was spent in therapy.
In the comparison of stroke patient's' time use in an intensive rehabilitation
unit between a Swiss and Belgian setting400 it was found that 45% and
28% of the day were spent in therapy in Switzerland and Belgium
respectively.
A single observer (Ruth Creamer, 4th year medical student, dissertation
project) carried out a behavioural mapping exercise in one of the day
hospitals for this study.
3.12.2 Adherence to programme
The number of day hospital visits was obtained by a count of ‘day hospital
logs’ which were completed for each attendance, by the day hospital staff.
The logs asked about the amount of input according to discipline, and was
only available for those in the intervention group (see 4.3).
3.13 Data handling
An Access database with password protection was used to store all data.
For the purposes of analysis, data were transferred to Intercooled Stata
version 9 using Stat Transfer (2001). Original documentation was stored in
locked filing cabinets, with identifying information being stored separately.
3.13.1 Data cleaning
There are two main threats to the integrity of data, random error and
systematic error403. Certain data checks can help identify such errors.
Logical checks can identify ‘non-sensical values’ – such as dates of birth in
the future. Data double entry of a randomly selected proportion of the data
7/22/2019 Preventing Falls in Older People 2008
http://slidepdf.com/reader/full/preventing-falls-in-older-people-2008 150/240
150
can also help to identify errors. Random errors are more difficult to detect,
but in theory should be evenly distributed between the two arms in a
randomised trial and therefore not result in bias. However, if the random
error rate is high, it may reduce the power of the study.
In order to try and avoid systematic error in data recording, we checked
random samples of the initial data entry for each person using the
database. In addition, we carried out audits of random samples of data
entry.
Initial data entry accuracy was maximised through the use of the Access
database. Using ‘forms’ with embedded coding to control the data entry
reduced the possibility of errors, though miscoding errors were still
possible. Throughout the database, standard responses were used
whenever possible. Data accuracy was assessed at different stages
throughout the project.
For categorical data, the entries were examined to check that there were
no implausible values. For continuous variables, range checks were carried
out for plausibility. Wherever there were discrepancies, data were checked
against the original records and where these were unclear a consensus was
attained between two of the study team. Where it was not possible to
verify data, entries were coded as missing.
For calculated values, logical checks were performed to assess robustness.
3.13.2 Handling missing data
Missing values are a problem in randomised controlled trials because the
sample size can be reduced and if more people drop out from one group
than the other, bias may be introduced. There are a variety of accepted
methods for handling missing data404.

7/22/2019 Preventing Falls in Older People 2008
http://slidepdf.com/reader/full/preventing-falls-in-older-people-2008 151/240
151
Missing values in data are due to different reasons. Participants may not
have responded because they withdrew consent or they may have died,
moved away and it may be impossible to trace them or they may be too ill
at the time of the assessment. Even when questionnaires are returned
individual items may have been missed. To reduce missing values at the
study design stage the following actions were taken:
• the diaries were kept as short as possible and the layout and
wording were checked for ease of use before the study started by
day hospital attendees
• each question was checked for a wide enough range of response
options
• assessments were administered by post, but the study nurse was
available to make telephone contact or visit at home those people
who needed help
•
the study nurse was available to telephone participants who
returned the questionnaire with incomplete or inaccurately filled in
questions
• copies of the diaries and instructions on completion were stored on
the study website.
These measures should have reduced the amount of missing data, but
some loss is inevitable. As stated previously, Stata handles missing data by
a process of ‘listwise deletion’ or ‘complete cases only’, that is to say only
using complete datasets for regression commands. However, this is
inappropriate for many outcomes as it risks introducing bias. In view of the
missing data, we carried out Complete Case Analysis and imputed missing
data.

7/22/2019 Preventing Falls in Older People 2008
http://slidepdf.com/reader/full/preventing-falls-in-older-people-2008 152/240
152
Multiple imputation (MI) was used to estimate values for non-responders at
each time interval. MI is a Monte Carlo simulation technique where each
missing data case is replaced by a set of plausible estimates, which are
drawn from the predictive distribution of the missing data given the
observed data. In contrast to the more naïve approaches, such as mean
substitution or last value carried forward, the technique of MI has the
advantage that it includes a random component to reflect the fact that
imputed values are estimated rather than treating the imputed values as if
they are known with certainty405. As such, MI is likely to produce more
accurate estimates of the standard errors (SE) and variances of the mean
utility values at each time-point than other methods of imputation. Rubin’s
rules are used to combine results from multiple imputed datasets to obtain
the estimates. A priori this was our preferred approach for handling missing
data because of non-response.
3.14 Data analysis
3.14.1 General considerations
Statistical significance was tested at the 5% level; two-sided tests were
used. Response bias was ascertained by comparing the proportion of
completed diaries returned in the intervention group to the proportion
returned in the control group (chi-squared test) and by comparing the
baseline characteristics of the responders compared to the non-responders.
All primary and secondary outcomes analyses included stratum as a fixed
covariate, and the adjusted analyses included all of the baseline variables
(age, gender and all eight screening items) as fixed covariates, as
discussed in section 3.2.3.1.
7/22/2019 Preventing Falls in Older People 2008
http://slidepdf.com/reader/full/preventing-falls-in-older-people-2008 153/240
153
3.14.1.1 Assessing population distributions
Visual inspection of a histogram displaying the data is possibly the best
method for assessing normality of a distribution. But it is possible to test
that a population fits the normal distribution using a Shapiro-Wilks test,
comparing observed observations against those that would be expected if
the population fitted a normal distribution. Where there is marked
deviation, then assumptions about the normal distribution are not valid. In
this case, it may be possible to transform the data; for example if the data
is positively skewed, a logarithmic transformation may normalise the data
(by reducing the magnitude of the variance). Many other transformations
are possible in order to make the data fit a normal distribution (see
Kirkwood, Medical Statistics, 2nd edition, 13.3). Stata offers a gladder
function which produces a composite pictorial representation of the various
possible transformations. The gladder function was used to determine the
‘normality’ of data, supplemented by formal tests, such as the Shapiro-
Wilks test where necessary.
3.14.2 Intention to treat analysis
Intention to treat analysis is the recommended type of analysis for
randomised controlled trials335 404 406. Participants were followed up as part
of the group to which they were first assigned at randomisation, regardless
of whether the participant continued in the trial, complied with the
intervention or died.
Intention to treat analysis guards against any attempts to influence the
results of the study by excluding aberrant or extreme outcomes. For
example older, physically impaired people who are more likely to die are
also more likely to have falls. If a greater number of people died from one
group then it may be possible that these people were also the ones who
found it difficult to attend the day hospital falls prevention programme

7/22/2019 Preventing Falls in Older People 2008
http://slidepdf.com/reader/full/preventing-falls-in-older-people-2008 154/240
154
during the time leading up to their death and this would affect the
outcomes. Intention to treat analysis addresses this problem by including
values for all people. The disadvantage of intention to treat analysis is that
it has the tendency to reduce the treatment effects (as not all individuals in
the intervention groups will have received the intervention). The converse
applies – participants randomised to the control arm should be analysed as
controls, even if they subsequently went on to attend the day hospital, for
example because they fell and were referred on by their general
practitioner. This too will tend to reduce the estimate of the treatment
effect.
Per-protocol analysis is carried out according to the intervention actually
received by participants. This is sometimes appropriate, for example in
drug trials, where it is important to know about adverse affects related to
the drug being tested.
3.14.3 Primary outcome: rate of falling
For falls incidence rates Poisson regression was used, or if there was over
dispersion, then negative binomial regression was preferred, as discussed
in section 3.7.
3.14.3.1 Model checking
Statistical models are useful as they provide estimates of an effect which
may be generalisable. However for the results of a model to be valid,
certain assumptions are made about the data. In order to test these
assumptions, various checks were carried out when using various
regression models, to ensure that the model assumptions had not been
violated (Table 3.4).
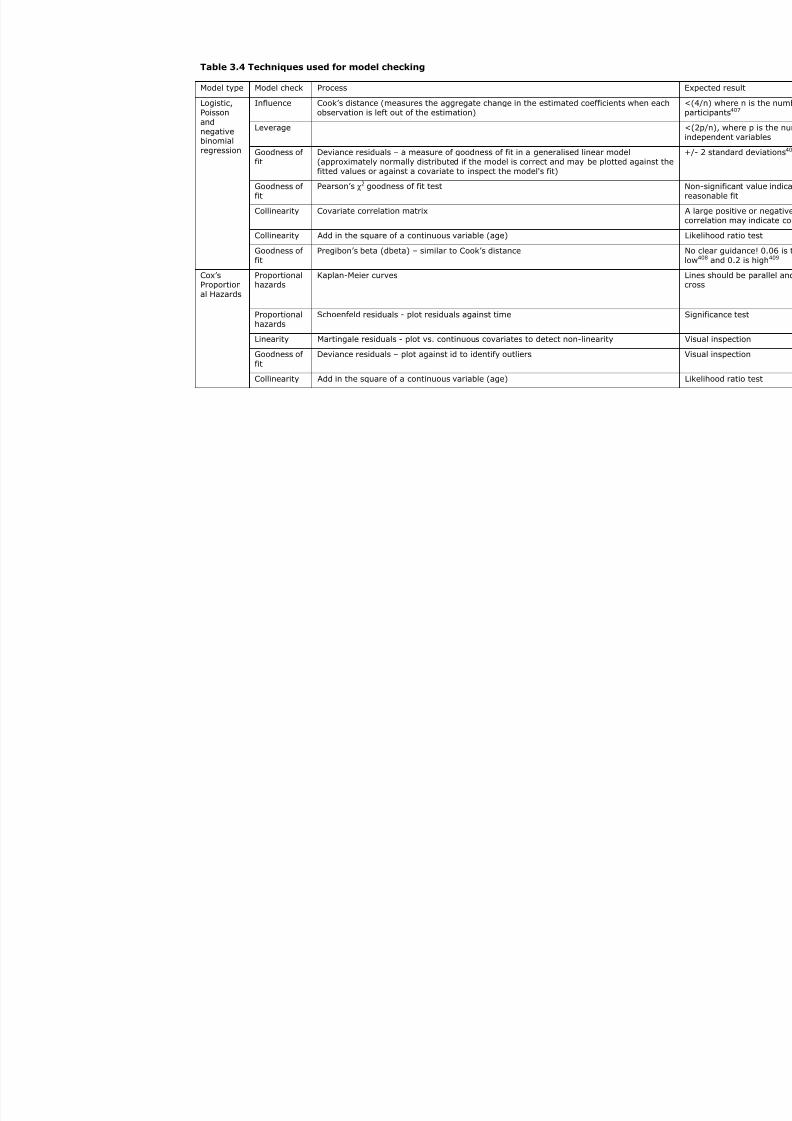
7/22/2019 Preventing Falls in Older People 2008
http://slidepdf.com/reader/full/preventing-falls-in-older-people-2008 155/240
Table 3.4 Techniques used for model checking
Model type Model check Process
Influence Cook’s distance (measures the aggregate change in the estimated coefficients when eobservation is left out of the estimation)
Leverage
Goodness offit
Deviance residuals – a measure of goodness of fit in a generalised linear model(approximately normally distributed if the model is correct and may be plotted againsfitted values or against a covariate to inspect the model's fit)
Goodness offit
Pearson’s χ2 goodness of fit test
Collinearity Covariate correlation matrix
Collinearity Add in the square of a continuous variable (age)
Logistic,Poissonandnegativebinomialregression
Goodness offit
Pregibon’s beta (dbeta) – similar to Cook’s distance
Proportionalhazards
Kaplan-Meier curves
Proportionalhazards
Schoenfeld residuals - plot residuals against time
Linearity Martingale residuals - plot vs. continuous covariates to detect non-linearity
Goodness of
fit
Deviance residuals – plot against id to identify outliers
Cox’sProportional Hazards
Collinearity Add in the square of a continuous variable (age)

7/22/2019 Preventing Falls in Older People 2008
http://slidepdf.com/reader/full/preventing-falls-in-older-people-2008 156/240
156
3.14.4 Secondary analyses
The pre-planned secondary analyses comparing treatment arms are
detailed below.
3.14.4.1 The proportion of participants with one or more falls
For the number of participants with one or more fall, odds ratios and 95%
confidence intervals were estimated using logistic regression, using
stratum as a fixed covariate and an adjusted analysis using the baseline
parameters (age, gender, screening risk factors).
3.14.4.2 Time to first fall
The time to the first fall was estimated using survival analysis (Kaplan-
Meier curves) and comparisons made between groups using Cox
proportional hazards regression with stratum as a fixed covariate and an
adjusted analysis using the baseline parameters (age, gender, screening
risk factors).
3.14.4.3 The proportion of people with injurious falls
For injurious falls, odds ratios and 95% confidence intervals were
estimated using logistic regression, using stratum as a fixed covariate and
an adjusted analysis using the baseline parameters (age, gender, screening
risk factors).
3.14.4.4 The proportion of people institutionalised at 12 months
For institutionalisation, odds ratios and 95% confidence intervals were
estimated using logistic regression, using stratum as a fixed covariate and
an adjusted analysis using the baseline parameters (age, gender, screening
risk factors).
7/22/2019 Preventing Falls in Older People 2008
http://slidepdf.com/reader/full/preventing-falls-in-older-people-2008 157/240
157
3.14.4.5 Impact on disability, quality of life, fear of falls, and use of health
services
These outcomes are all continuous variables (e.g. disability measured on
the Barthel scale from 0-20) and were described using means (if normally
distributed) or medians (if not normally distributed). Where assumptions
for undertaking linear regression were not met, data was transformed and
analysed using linear regression, or dichotomised at the median and
analysed using logistic regression.
3.14.4.6 Falls-related mortality
For mortality, odds ratios and 95% confidence intervals were estimated
using logistic regression, using stratum as a fixed covariate and an
adjusted analysis using the baseline parameters (age, gender, screening
risk factors).
3.14.4.7 Pre-specified sub-group analyses
Subgroup analysis were carried out using age (70–85, 85+) and falls
history in the last year (0–1, ≥2). The statistical significance of differences
between subgroups was tested using tests for interaction in the regression
models.
Not pre-specified, but nevertheless of interest, a per-protocol analysis and
a per day hospital analysis was conducted using the same approach.
7/22/2019 Preventing Falls in Older People 2008
http://slidepdf.com/reader/full/preventing-falls-in-older-people-2008 158/240
158
3.15 Results
3.15.1 Data Preparation
3.15.1.1 Error rates in data entry
A random sample of 10% of screening forms and diaries was double
entered to check for accuracy. The error rate was 33/7073 (0.47%, 95%
CI 0.46-0.48%),) for baseline data items. For falls diaries the error rate
was 21/2173 (0.97%, 95% CI 0.96-0.98%), and for the functional
outcomes 12/4900 (0.24%, 95% CI 0.23-0.25%),). All errors were
corrected in the Access database.
The error rate for falls records was less than 1% - which means that any
difference between the two groups of 1% or less may be due to data entry
error, but this level of difference is unlikely to be clinically important.
3.15.1.2 Logical checks
The randomisation list was obtained from the Clinical Trials Support Unit
(CTSU), this contained several data items: stratum (Derby=0,
Nottingham=1), unique identifier (corresponding to Access database
unique identifier), participants’ initials, randomisation date, person
requesting randomisation, randomisation number, and allocation (1 or 0).
364 participants were randomised according to the database, which
corresponded to the number in the randomisation list when linked in an
Access query, with no discrepancies. The randomisation list and internal
database record of allocation were identical. A variety of other cross checks
were carried out as detailed in appendix 4.4.
GP and hospital records were checked for evidence of any attendance at a
Falls Prevention Programme (FPP). An isolated referral to physiotherapy,
hospital doctor or occupational therapist was not coded as FPP unless

7/22/2019 Preventing Falls in Older People 2008
http://slidepdf.com/reader/full/preventing-falls-in-older-people-2008 159/240
159
explicitly stated as falls prevention therapy and more than one professional
involved; a referral to the intermediate care team referral was considered
as a FPP.
3.15.2 Recruitment
Recruitment into the randomised controlled trial was challenging; the
original estimates suggested 3125 individuals would need to be screened to
achieve the desired sample size; in fact, over 6000 individuals were
screened. Of those not excluded by their general practice, 2846/5312
(54%) provided some information, with 52% of those responding classified
as being at high risk of future fall. The overall recruitment rate into the RCT
was 364/6133 (6%) (Figure 3.2). Of those not excluded during recruitment
who were at high risk, 364/1481 (25%) agreed to participate in the RCT;
181 in the control arm and 183 in the intervention arm. One individual in
the intervention arm was excluded after randomisation, as they were
subsequently discovered to have attended a day hospital falls prevention
programme in the year prior to randomisation.

7/22/2019 Preventing Falls in Older People 2008
http://slidepdf.com/reader/full/preventing-falls-in-older-people-2008 160/240
160
Figure 3.2 Overall study recruitment
*Reasons for exclusion included residence in a care home (2) or recent
attendance at a falls programme (10).
≥70registered
with GP6133
Excludedby GP821
5312 eligible
No reply2466
Baseline data2846
1481 highrisk
1360 lowrisk
5 unable toclassify, notcontactable
DeclinedRCT1105
Excludedby
studynurse 12*
Declined1192
Screeningcohort168
RCT364
No furtherinvolvement
938
Agreed toscreening
cohort167
Screeningcohort
n=335
High risk167
Low risk168
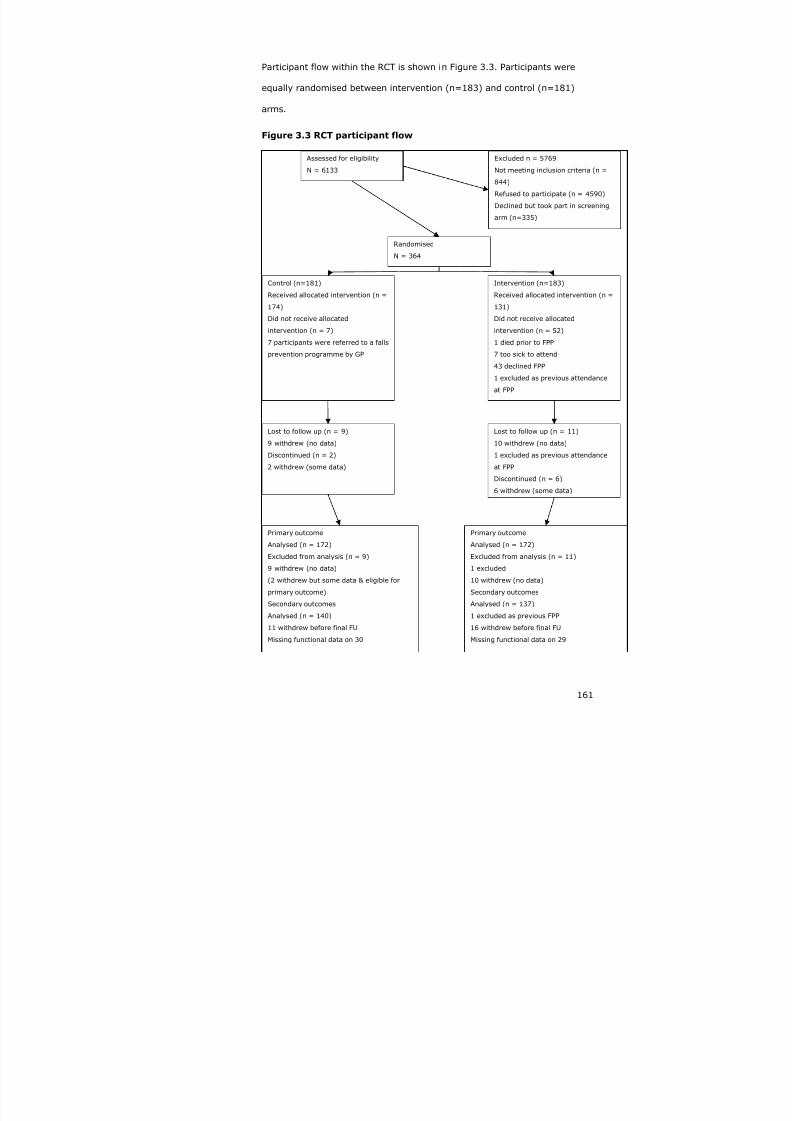
7/22/2019 Preventing Falls in Older People 2008
http://slidepdf.com/reader/full/preventing-falls-in-older-people-2008 161/240
161
Participant flow within the RCT is shown in Figure 3.3. Participants were
equally randomised between intervention (n=183) and control (n=181)
arms.
Figure 3.3 RCT participant flow
Assessed for eligibility
N = 6133
Excluded n = 5769
Not meeting inclusion criteria (n =
844)
Refused to participate (n = 4590)
Declined but took part in screening
arm (n=335)
Randomised
N = 364
Control (n=181)
Received allocated intervention (n =
174)
Did not receive allocated
intervention (n = 7)
7 participants were referred to a falls
prevention programme by GP
Intervention (n=183)
Received allocated intervention (n =
131)
Did not receive allocated
intervention (n = 52)
1 died prior to FPP
7 too sick to attend
43 declined FPP
1 excluded as previous attendance
at FPP
Lost to follow up (n = 9)
9 withdrew (no data)
Discontinued (n = 2)
2 withdrew (some data)
Primary outcome
Analysed (n = 172)
Excluded from analysis (n = 9)
9 withdrew (no data)
(2 withdrew but some data & eligible for
primary outcome)
Secondary outcomes
Analysed (n = 140)
11 withdrew before final FU
Missing functional data on 30
Primary outcome
Analysed (n = 172)
Excluded from analysis (n = 11)
1 excluded
10 withdrew (no data)
Secondary outcomes
Analysed (n = 137)
1 excluded as previous FPP
16 withdrew before final FU
Missing functional data on 29
Lost to follow up (n = 11)
10 withdrew (no data)
1 excluded as previous attendance
at FPP
Discontinued (n = 6)
6 withdrew (some data)

7/22/2019 Preventing Falls in Older People 2008
http://slidepdf.com/reader/full/preventing-falls-in-older-people-2008 162/240
162
Loss to follow up was similar in both arms of the trial: 11/183 (6%) in the
intervention arm, compared to 9/183 (5%) in the control arm. In both
arms losses to follow up were explained by withdrawals, because
individuals felt the trial was too burdensome (intervention – 9, control - 8)
or because of ill-health (intervention – 1, control - 1), with one person in
the intervention arm being excluded after randomisation as they were
found to have already attended a falls prevention programme in the
previous year. These individuals did not provide any follow up data
regarding falls or functional outcomes, though their home circumstances
and mortality status at 12 months were known. Losses due to death within
the follow up period were the same in both arms (control - 9/181 (5%),
intervention - 9/183 (5%)). More participants discontinued the study in the
intervention arm: 6/183 (3%) versus 2/181 (1%) in the control arm.
Again, this was because of the burden imposed by the trial or because of
ill-health; however, those that discontinued the trial did provide some
follow up data on falls and so are included in the primary outcome analysis.
3.15.3 Randomisation
Participants were equally randomised between the two allocation arms and
within each of the strata (Table 3.5), although there were five errors in
coding stratum, for example individuals resident in Derby stratum were
assigned to Nottingham stratum.
Table 3.5 Allocation by stratum
Randomisation stratum
Randomisationgroup
Derby Nottingham Total
Control 61 120 181
Intervention 62 121 183
Totals 123 241 364

7/22/2019 Preventing Falls in Older People 2008
http://slidepdf.com/reader/full/preventing-falls-in-older-people-2008 163/240
163
3.15.4 Baseline data
Table 3.6 shows the baseline characteristics of all participants, and then
split by allocation. The population recruited to the RCT are similar to those
who declined to participate in any aspect of the study in terms of age and
gender (Table 2.7), but are at higher falls risk overall – as intended. There
was no missing baseline data in those recruited into the RCT.
There are relatively small, but potentially important differences in baseline
characteristics comparing the control group to the intervention group, with
the intervention group having a slightly ‘sicker’ profile, although the risk
score (sum of the individual risk factors), was the same in both groups. All
of the baseline covariates highlighted in bold were included in the adjusted
analysis. Stratum was a fixed covariate throughout.
As specified in the protocol and discussed in section 3.2.3.1, we carried out
analyses adjusted for the baseline imbalances – in subsequent sections,
adjusted analyses refers to adjusting for age, gender and the screening
items, crude analysis refers to the inclusion of stratum only as a fixed
covariate.

7/22/2019 Preventing Falls in Older People 2008
http://slidepdf.com/reader/full/preventing-falls-in-older-people-2008 164/240
Table 3.6 Baseline characteristics
Characteristic All
N=364
Con
N=
Centre/stratum Nottingham 241 (66%) 120
Derby 123 (34%) 61
Age (years) Mean (SD) 78.7 (5.6) 78.
Median (IQR) 77.8 (74.2-82.8) 77.
Range 70-101 70-
Female Frequency (%) 218 (60%) 112
At least one fall in previous 12 months Frequency (%) 210 (58%) 102
Taking more than 4 medications Frequency (%) 192 (53%) 89
History of stroke Frequency (%) 53 (15%) 20
Parkinson’s disease Frequency (%) 6 (2%) 2 (
Inability to stand from a chair without using arms to pushup
Frequency (%) 240 (66%) 115
Symptoms of dizziness on standing Frequency (%) 218 (60%) 115
Use of a mobility aid Frequency (%) 182 (50%) 86
Housebound/not housebound (mobility impairment) Frequency (%) 83 (23%) 39
Mini-mental state examination
(median (IQR)
Not available
Risk score (sum of screening risk factors) Median (IQR) 3 (2-4) 3 (2

7/22/2019 Preventing Falls in Older People 2008
http://slidepdf.com/reader/full/preventing-falls-in-older-people-2008 165/240
165
3.16 Describing the intervention
3.16.1 Behavioural mapping
The behavioural mapping exercise was carried out at one site only (QMC),
as unfortunately additional staffing and funding could not be obtained to
complete the process in the other sites.
The results of the behavioural mapping study have been reported
elsewhere410, but are summarised here in brief.
‘23 patients (median age 81.5, 37.5% male) were observed over a total of
35 patient-days at QMC day hospital. 68% of time was spent in rest, 10%
in physiotherapy, 2% in occupational therapy. 49% of patient time was
spent alone, 33% with other patients; the remainder of time with health
care professionals. 13% of time was spent in therapy, which was mainly
relevant to falls prevention.
The proportion of time spent in therapy in a day hospital is small, but
consistent with previous mapping studies. We have developed a useful tool
to describe activity in the day hospital, but further validation work is
required.’
3.16.2 Day hospital attendances and logs
Four percent (7/181) of the controls group actually attended a day hospital
falls prevention programme (FPP), referred by their GP as part of usual
care; 131/183 (72%) of the intervention group attended.
The median number of recorded attendances at the FPP was 2 (0-8) in the
intervention group. There was significant variation between day hospitals –
QMC 2 (0-10), NCHT 6 (1-8) and DRI 1 (0-4), p=0.025 (Figure 3.4).
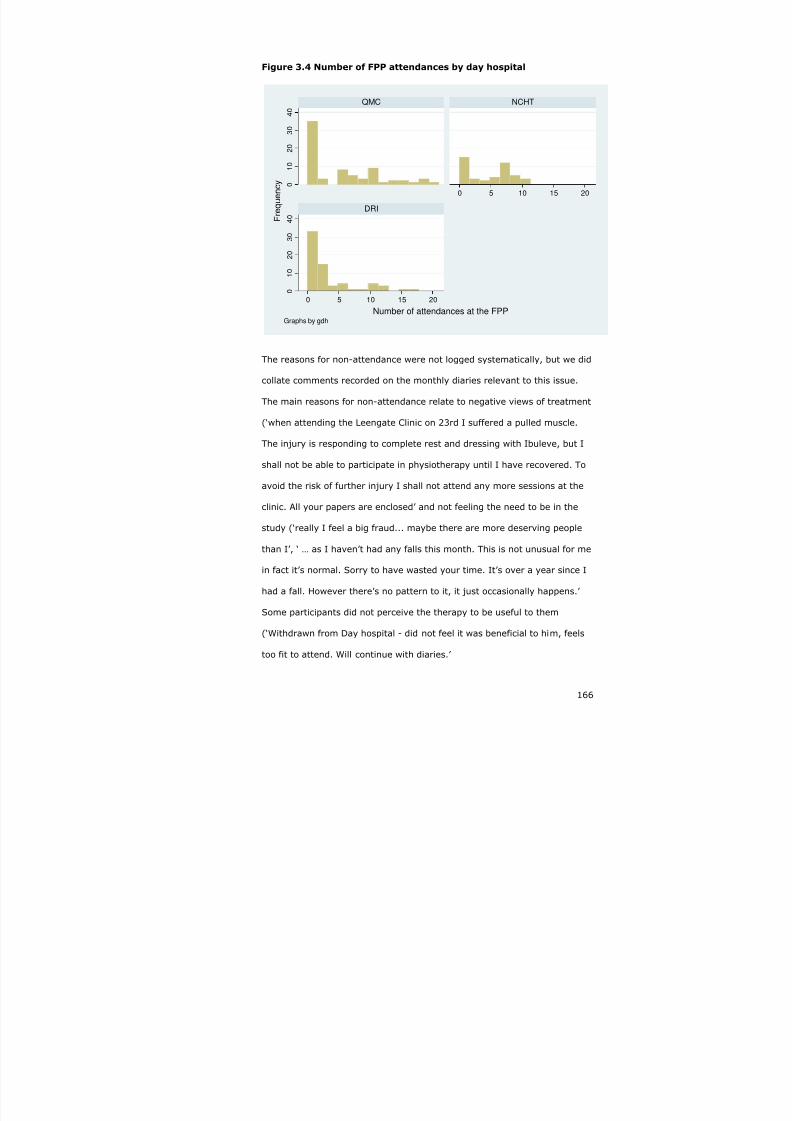
7/22/2019 Preventing Falls in Older People 2008
http://slidepdf.com/reader/full/preventing-falls-in-older-people-2008 166/240
166
Figure 3.4 Number of FPP attendances by day hospital
0
1 0
2 0
3 0
4 0
0
1 0
2
0
3 0
4 0
0 5 10 15 20
0 5 10 15 20
QMC NCHT
DRI
F r e q u e n c y
Number of attendances at the FPPGraphs by gdh
The reasons for non-attendance were not logged systematically, but we did
collate comments recorded on the monthly diaries relevant to this issue.
The main reasons for non-attendance relate to negative views of treatment
(‘when attending the Leengate Clinic on 23rd I suffered a pulled muscle.
The injury is responding to complete rest and dressing with Ibuleve, but I
shall not be able to participate in physiotherapy until I have recovered. To
avoid the risk of further injury I shall not attend any more sessions at the
clinic. All your papers are enclosed’ and not feeling the need to be in the
study (‘really I feel a big fraud... maybe there are more deserving people
than I’, ‘ … as I haven’t had any falls this month. This is not unusual for me
in fact it’s normal. Sorry to have wasted your time. It’s over a year since I
had a fall. However there’s no pattern to it, it just occasionally happens.’
Some participants did not perceive the therapy to be useful to them
(‘Withdrawn from Day hospital - did not feel it was beneficial to him, feels
too fit to attend. Will continue with diaries.’

7/22/2019 Preventing Falls in Older People 2008
http://slidepdf.com/reader/full/preventing-falls-in-older-people-2008 167/240
167
The contribution of individual disciplines to each individuals care in the falls
prevention programme was obtained from the day hospital logs. These
were completed voluntarily by the day hospital staff, with limited accuracy
(no formal training or test of reliability), and often with substantial
amounts of missing data (up to one-third missing). It is not possible to be
sure if the missing data indicates not seen, or just missing. Nevertheless,
the day hospital logs provide some insight into the processes taking place
in the different units, as detailed in Table 3.7. Clearly, these data only
apply to those individuals who actually did attend the day hospital.
The data in Table 2.7 indicate that there are important differences between
the three falls prevention programmes, suggesting that the interventions
being delivered are not uniform across the three units.

7/22/2019 Preventing Falls in Older People 2008
http://slidepdf.com/reader/full/preventing-falls-in-older-people-2008 168/240
Table 3.7 Characteristics of each day hospital falls prevention programme
QMC
Median (IQR)
NCHT
Median (IQR)
DRI
Median
Attendance rate
(turned up at least once)45/74 (61%) 38/45 (84%) 48/67 (
Number of medical reviews per participant 8 (5-11) 7 (2-8) 2 (1-6)
Nature of medical assessmentJunior staff overseen
by consultant
Junior staff
overseen byconsultant
All patiassesseby consvaryingthereaf
Number of occupational therapy reviews 8 (4.5-11) 7 (1.75-8) 2 (1-5.
Duration of occupational therapy input (minutes) 45 (30-7) 92.5 (77.5-122.5) 60 (48
Number of physiotherapy reviews 8 (5-11) 7 (2-8) 2 (1-5.
Duration of physiotherapy reviews (minutes) 255 (131.25-367.5) 310 (230-435) 65 (60-
Falls incidence rate
(per person-year)1.77 (1.44-2.14) 1.83 (1.42-2.32) 1.56 (1

7/22/2019 Preventing Falls in Older People 2008
http://slidepdf.com/reader/full/preventing-falls-in-older-people-2008 169/240
169
3.16.3 Describing the primary outcome
Falls were ascertained through the monthly diaries, 172 participants in
each group completed at least some falls diaries and so were eligible for
primary outcome analysis. In total 3749 monthly falls diaries were
returned, 1908 in the control group and 1841 in the intervention group.
The median number of diaries returned was 12 (IQR 12-12) in both groups.
There was no significant difference between the two arms in the median
number of diaries returned (Mann-Whitney p-value 0.61).
Table 3.8 Diary returns by allocation group
Control(n=181)
Intervention(n=183)
Number of diaries returned 1908 1841
Median (IQR) number of diaries returned 12 (12-12) 12 (12-12)
Number returning 12 diaries 138 (76%) 136 (74%)
Number returning 11 diaries 8 (4%) 3 (2%)
Number returning 10 diaries 3 (2%) 4 (2%)
Number returning 9 diaries 3 (2%) 4 (2%)
Number returning 8 diaries 2 (1%) 1 (1%)
Number returning 7 diaries 4 (2%) 6 (3%)
Number returning 6 diaries 7 (4%) 2 (1%)
Number returning 5 diaries 2 (1%) 1 (1%)
Number returning 4 diaries 1 (1%) 2 (1%)
Number returning 3 diaries 1 (1%) 3 (2%)
Number returning 2 diaries 1 (1%) 6 (3%)
Number returning 1 diaries 2 (1%) 4 (2%)
Number returning 0 diaries 9 (5%) 11 (6%)
In total, 677 falls were reported over 304.55 person-years; the overall falls
rate was 2.2 (95% CI 2.1-2.4) falls per person-year. The proportion of
non-fallers and recurrent fallers is shown in Table 3.9.
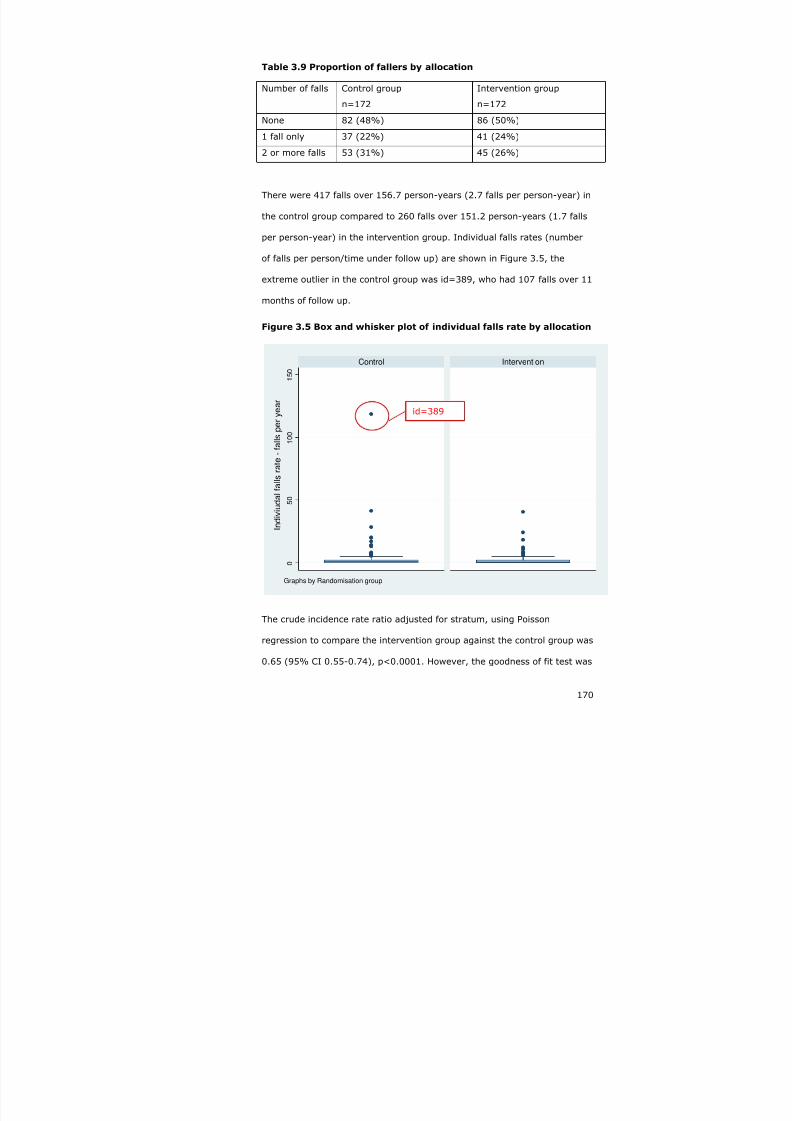
7/22/2019 Preventing Falls in Older People 2008
http://slidepdf.com/reader/full/preventing-falls-in-older-people-2008 170/240
170
Table 3.9 Proportion of fallers by allocation
Number of falls Control group
n=172
Intervention group
n=172
None 82 (48%) 86 (50%)
1 fall only 37 (22%) 41 (24%)
2 or more falls 53 (31%) 45 (26%)
There were 417 falls over 156.7 person-years (2.7 falls per person-year) in
the control group compared to 260 falls over 151.2 person-years (1.7 falls
per person-year) in the intervention group. Individual falls rates (number
of falls per person/time under follow up) are shown in Figure 3.5, the
extreme outlier in the control group was id=389, who had 107 falls over 11
months of follow up.
Figure 3.5 Box and whisker plot of individual falls rate by allocation
0
5 0
1 0 0
1 5 0
Control Intervention
I n d i v
i u d a l f a l l s r a t e - f a l l s p e r y e a r
Graphs by Randomisation group
The crude incidence rate ratio adjusted for stratum, using Poisson
regression to compare the intervention group against the control group was
0.65 (95% CI 0.55-0.74), p<0.0001. However, the goodness of fit test was
id=389

7/22/2019 Preventing Falls in Older People 2008
http://slidepdf.com/reader/full/preventing-falls-in-older-people-2008 171/240
7/22/2019 Preventing Falls in Older People 2008
http://slidepdf.com/reader/full/preventing-falls-in-older-people-2008 172/240
172
A sensitivity analysis was carried out excluding id 389; other investigators
have excluded extreme outliers when analysing fall rates411. The rate of
falls in the control group excluding id 389 was 2.0 compared to 2.7 falls
per person-year when id 389 was included. The overall falls rate fell from
2.2 (95% CI 2.1-2.4) including id 389, to 1.9 (95% CI 1.8-2.1) without id
389. The resultant incidence rate ratio (IRR) comparing control and
intervention groups was 0.86 (95% CI 0.59-1.25), p=0.424. This time the
Generalised Linear Model (GLM) diagnostics showed a better fit (Cook’s
<0.2, leverage <0.15 and dbeta <2.5) for all participants, and although
these values are still relatively high, no individual stood out other than id
389. Introducing age-squared showed no evidence of non-linearity,
likelihood ratio test p=0.987.
The negative binomial regression to be the most appropriate analysis for
the data, and excluding id 389 appears reasonable – the extreme rate of
falls in this individual are best shown in Figure 3.6. All analyses concerning
rates described below exclude id 389.
3.16.4 Adjusted analysis
Given that adjusting for baseline imbalances had been pre-specified in the
study protocol412 and all of the baseline covariates are prognostically
important for falls (see 3.2.3.1), an adjusted analysis was carried out using
all of the baseline covariates. The adjusted analysis included all of the
screening items, age and gender, as well as stratum.
Using the adjusted negative binomial regression model, the IRR was 0.73
(95% CI 0.51-1.03), p=0.071. The regression diagnostics did not suggest
that the assumptions for the model had been violated (Cook’s <0.14, and
leverage <0.24). Introducing ‘age squared’ as a parameter gave a
likelihood ratio test of p=0.681, indicating no evidence of a non-linear
relationship with age, which was therefore retained as a (centred)

7/22/2019 Preventing Falls in Older People 2008
http://slidepdf.com/reader/full/preventing-falls-in-older-people-2008 173/240
173
continuous variable. Table 3.10 summarises the key analyses for the
primary outcome.
Table 3.10 Summary of the primary outcome analyses
Unadjusted Adjusted
Results with participant id=389 retained
Poisson regression 0.65 (95% CI 0.55-
0.74), p<0.0001
Negative binomial
regression
0.69 (95% CI 0.46-
1.02), p<0.001
Results with participant id=389 excluded
Poisson regression 0.86 (95% CI 0.73-
1.01), p=0.075
Negative binomial
regression
0.86 (95% CI 0.73-
1.01), p=0.075
0.73 (95% CI 0.51-
1.03), p=0.071
3.16.5 Sub-group analyses
Two sub-group analyses were pre-specified, by age category (70-84, 85+)
and by previous fall status and two additional unplanned subgroup
analyses were performed (gender and stratum) - Table 3.11. These
analyses look for a differential effect within each parameter – for example,
examining if the effect of the intervention is different depending on
whether or not the individual has had a previous fall. If there was evidence
of a differential effect, indicated by a large or small incidence rate ratio for
the interaction parameter (effect in previous fallers divided by effect in
those without previous fall), and a significant p-value result in the
7/22/2019 Preventing Falls in Older People 2008
http://slidepdf.com/reader/full/preventing-falls-in-older-people-2008 174/240
174
likelihood ratio test for the interaction, then it would have been appropriate
to report the results by sub-groups.
Table 3.11 Sub-group analyses
Sub-group analysis Incidence rate ratio for theinteraction (95% CI)
Likelihood ratiotest p-value
Age category*allocation
(70-84 vs. 85+)
1.3 (0.5-3.4) 0.572
Previous fall*allocation
(previous fall vs. no previous fall)
0.7 (0.4-1.5) 0.384
Gender*allocation
(male vs. female)
0.8 (0.4-1.6) 0.574
Stratum*allocation
(Derby vs., Nottingham)
1.7 (0.8-3.5) 0.144
None of these analyses show significant evidence of a differential effect
according sub-group.
3.16.5.1 Per-protocol analysis (post-hoc)
Attendance at, and engagement with a FPP, whether delivered by primary
care or in the day hospital, was arbitrarily designated as more than one
attendance at the day hospital FPP or evidence from primary care records
of multidisciplinary input into falls management. Irrespective of RCT
allocation, 134/344 (39%) individuals attended some form of FPP. The rate
of falls in those attending a FPP was 2.1 (95% CI 1.9-2.4) fall per person-
year, compared to 2.3 (95% CI 2.1-2.5) in those not attending a FPP. The
incidence rate ratio for falls by attendance at a FPP was 0.39 (95% CI
0.11-1.40), which is a potentially clinically important effect size, but the
likelihood ratio test was p=0.134, so it is not statistically significant.
3.16.6 Secondary analyses
The pre-specified and post hoc secondary analyses are presented in Table
3.12. With respect to the model checking for these analyses, Parkinson’s

7/22/2019 Preventing Falls in Older People 2008
http://slidepdf.com/reader/full/preventing-falls-in-older-people-2008 175/240
175
disease exerted significant leverage, but a sensitivity analysis excluding
those with high leverage values, did not substantially alter the result. For
uncommon events, such as death during follow up and admission to a care
home, the model was a poor fit for those who had the event, but otherwise
robust. The Cox proportional hazards model tests showed crossover over
time and some collinearity with baseline characteristics, making the model
unreliable; this was not a pre-specified analysis.
Table 3.12 Secondary outcome analyses
Outcome Descriptive data Crude analysis Adjustedanalysis
Control Intervention Effect size(95% CI),significance
Effect size(95% CI), p-value
Proportion ofpeople falling over12 months (OR)
73/138(53%)
69/136(51%)
0.90
(0.56-1.46)
p=0.672
0.91
(0.54-1.53)
p=0.725
The proportion ofparticipants withtwo or more falls
(OR)
38/138(28%)
38/136(28%)
1.01
(0.59-1.72)
p=0.969
0.98
(0.51-1.76)
p=0.933The proportion ofpeople with self-reported injuriousfalls (OR)
55/138(40%)
56/136(41%)
1.05
(0.64-1.70)
p=0.856
1.08
(0.64-1.82)
p=0.778
The proportion ofpeopleinstitutionalised at12 months (OR)
1/170
(<1%)
3/166
(<1%)
3.1
(0.3-30.2)
P=0.328
4.8
(0.3-73.1)
P=0.260
Mortality at 12months (OR) 9/181(5%)
9/182(5%)
1.0(0.4-2.6)
P=0.994
0.8(0.3-2.4)
P=0.705
Mortality rates inperson –years(IRR)
(post-hoc)
0.05
(95% CI0.03-0.10)
0.05
(95% CI0.03-0.10)
0.89
(0.34-2.30)
p=0.804
0.7
(0.3-2.0)
p=0.543

7/22/2019 Preventing Falls in Older People 2008
http://slidepdf.com/reader/full/preventing-falls-in-older-people-2008 176/240
176
None of the secondary outcomes described in Table 3.12 showed any
strong evidence of a differential effect in a per protocol analysis based on
attendance at a fall prevention programme.
3.16.6.1 Proportion of people with medically verified injurious falls
Primary care recorded falls data were abstracted from primary care
records, injuries are coded according to the Severity of Injury Scale, and
are shown in Table 3.13. Data are only available for those individuals who
have a consultation with their GP documented.
Table 3.13 Verified severity of injury during GP fall consultation
Abbreviated injury rating Controls n=22 Intervention n=18
No injury 9 (41%) 6 (33%)
Minor (abrasion, contusion) 10 (45%) 9 (50%)
Moderate (laceration, tissue tear,haematoma, impaired mobility due toinjury, fear of subsequent fall and fallinjury)
2 (9%) 3 (17%)
Serious (fracture, multiple fracture,
subdural haematoma, head injury)
1 (5%) 0 (0%)
Total 22 18
Pearson chi squared test for trend (3 degrees of freedom) p=0.690.
There was no significant difference between the two groups when primary
care verified injurious fall was dichotomised (no injury vs. injury) in the
crude analysis (OR 1.4 (95% CI 0.4-5.3), p=0.601), or in the adjusted
analysis (OR 2.6 (95%CI 0.3-22.1), p=0.387).
Secondary care recorded falls data were abstracted from secondary care
records, and injuries were coded according to the Severity of Injury Score.
Again, data are only available for those individuals who have a documented
fall-related hospital attendance.
24/135 (18%) in the intervention group had a verified ED attendance
compared to 24/137 (18%) in the control group; the figures for falls-

7/22/2019 Preventing Falls in Older People 2008
http://slidepdf.com/reader/full/preventing-falls-in-older-people-2008 177/240
177
related ED attendances were 13/24 (55%) for both groups – 11 of which
were associated with an injury in both (Table 3.14).
Table 3.14 Verified severity of injury at ED attendance
Controls n=24 Intervention n=24
None 13 (54%) 13 (54%)
Minor 4 (17%) 5 (21%)
Moderate 3 (13%) 5 (21%)
Serious 4 (17%) 1 (4%)
Pearson chi squared test for trend (3 degrees of freedom) p=0.492.
Nor were there any significant differences in the ED visits with an injurious
fall when ED verified injurious falls were dichotomised (no injury vs.
injury): in the crude analysis the odds ratio was 1.0 (95% CI 0.3-3.1),
p=0.991, and in the adjusted analysis the odds ratio was 1.3 (95% CI 0.2-
8.0), p=0.760.
3.16.6.2 Time to first fall
The median time to first fall in days was 271 in the control group,
compared to 292 in the intervention group. The crude hazard ratio was 0.9
(95% CI 0.7-1.3), p=0.625; the adjusted hazard ratio was 0.9 (95% CI
0.7-1.3), p=0.622 (Figure 3.7).

7/22/2019 Preventing Falls in Older People 2008
http://slidepdf.com/reader/full/preventing-falls-in-older-people-2008 178/240
178
Figure 3.7 Time to first fall by allocation - unadjusted analysis
0 . 0
0
0 . 2
5
0 . 5
0
0 . 7
5
1 . 0
0
0 100 200 300 400analysis time
allocation = Control allocation = Intervention
Kaplan-Meier survival estimates, by allocation
3.16.6.3 Second fall outcomes (not pre-specified)
38/73 (52%) of controls who had one fall had at least one more fall versus
38/69 (55%) of those in the intervention group had a second fall, crude
odds ratio 1.1 (95% CI 0.6-2.2), p=0.717, adjusted odds ratio 0.9 (95%
CI 0.4-2.0), p=0.826.
The median time to second fall after the first fall was 55 days in the control
group compared to 87 days in the intervention group (Figure 3.8). The
crude hazard ratio for time to second fall was 0.9 (95% CI 0.5-1.2),
p=0.248. The adjusted hazard ratio was 0.7 (95% CI 0.5-1.1), p=0.103.

7/22/2019 Preventing Falls in Older People 2008
http://slidepdf.com/reader/full/preventing-falls-in-older-people-2008 179/240
179
Figure 3.8 Time to second fall – unadjusted analysis
0 . 0 0
0 . 2
5
0 . 5
0
0 . 7
5
1 . 0
0
0 100 200 300 400analysis time
allocation = Control allocation = Intervention
Kaplan-Meier survival estimates, by allocation
3.16.6.4 Impact on disability, quality of life and fear of falls
There data missing on functional outcomes for 38 controls and 46 in the
intervention group. In view of the missing data, a multiple imputation
model was run including all of the baseline covariates. 10 datasets were
created using the multiple imputation command (ICE) in Stata, with
missing data being generated with a random component, but which
incorporates the known baseline parameters.
Personal ADLs were measured using the Barthel score, with a possible
range of scores from 0 (extremely dependant) to 20 (independent). The
Barthel scores were negatively skewed and no transformations rendered
the score near normal. The Barthel scores were dichotomised at the
median (19/20). The median (IQR) scores for both groups were identical –
19 (17-20). The results for the original and imputed datasets are detailed
in Table 3.15.
7/22/2019 Preventing Falls in Older People 2008
http://slidepdf.com/reader/full/preventing-falls-in-older-people-2008 180/240
180
Extended activities of daily living (outdoor mobility, domestic tasks, social
interaction etc) were measured using the Nottingham Extended Activities of
Daily Living score, with a possible range of 0 (severely restricted) to 66
(independent). Again the distribution was very skewed, so the results were
dichotomised at the group median (56 out of 66). Table 3.15 shows the
adjusted and imputed estimates.
Fear of falling was assessed using the Falls Efficacy Scale, this is a ten item
scale asking about the level of fear of falling in a variety of daily activities;
each item is graded from 1-10, with ten indicating the most fear (least
confidence) and the maximum score possible is 100. The FES data was
similarly skewed and so was dichotomised at the group median (17/100) –
see Table 3.15.
Quality of life was measured using the five item EuroQoL, scored 1, 2 or 3
with higher values indicting worse quality of life. Skewed data again
demanded non-parametric analysis around the group median of 8 (6-9) –
see Table 3.15.
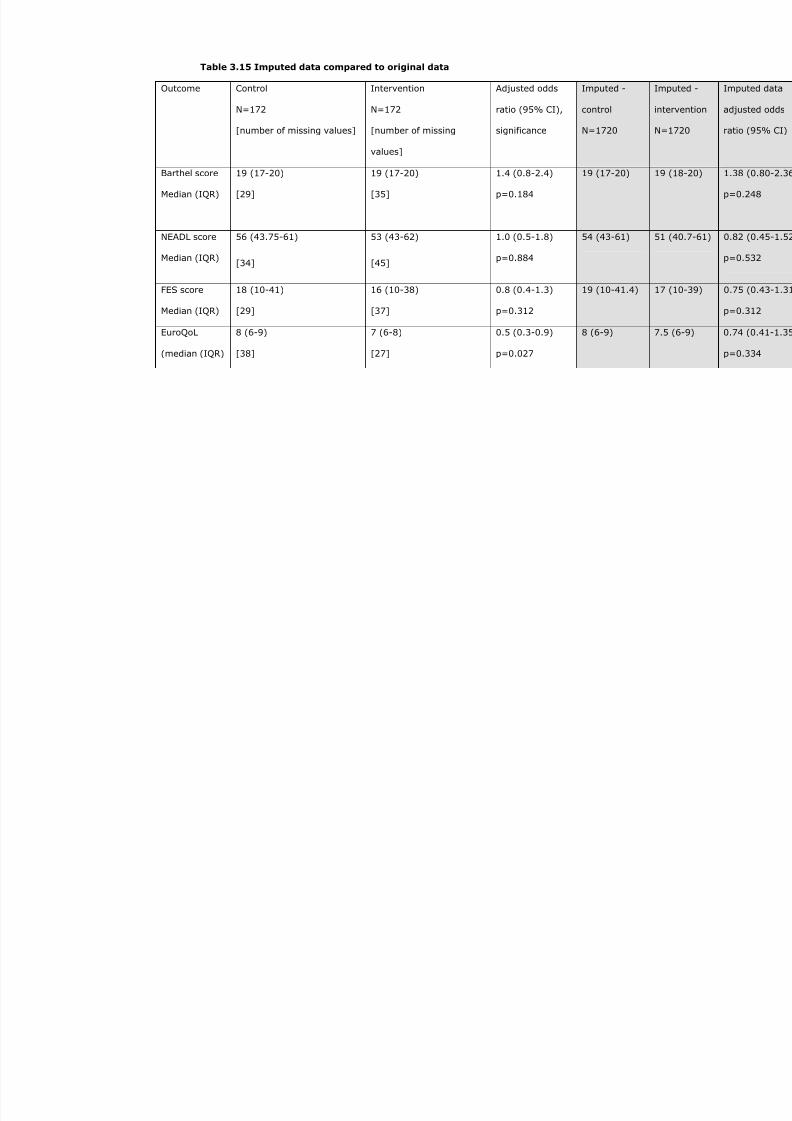
7/22/2019 Preventing Falls in Older People 2008
http://slidepdf.com/reader/full/preventing-falls-in-older-people-2008 181/240
Table 3.15 Imputed data compared to original data
Outcome Control
N=172
[number of missing values]
Intervention
N=172
[number of missing
values]
Adjusted odds
ratio (95% CI),
significance
Imputed -
control
N=1720
Barthel score
Median (IQR)
19 (17-20)
[29]
19 (17-20)
[35]
1.4 (0.8-2.4)
p=0.184
19 (17-20)
NEADL score
Median (IQR)
56 (43.75-61)
[34]
53 (43-62)
[45]
1.0 (0.5-1.8)
p=0.884
54 (43-61)
FES score
Median (IQR)
18 (10-41)
[29]
16 (10-38)
[37]
0.8 (0.4-1.3)
p=0.312
19 (10-41.4)
EuroQoL
(median (IQR)
8 (6-9)
[38]
7 (6-8)
[27]
0.5 (0.3-0.9)
p=0.027
8 (6-9)
7/22/2019 Preventing Falls in Older People 2008
http://slidepdf.com/reader/full/preventing-falls-in-older-people-2008 182/240
182
These original data show no significant differences between the two arms
of the RCT in terms of Barthel, NEADL and FES scores, but a slightly benefit
in the EuroQoL score (OR 0.3-0.9). However, the advantage in terms of
quality of life was not seen in the sensitivity analysis based on the imputed
dataset.
3.16.6.5 Health service resource use
Participants were asked to record any visits to their general practitioner
(GP) in their monthly diary returns, along with the duration of the visit.
These reports were not constrained to falls alone, but reflected all care
needs. As with many of the secondary outcomes, the distribution was
heavily skewed and could not be adequately transformed into a normal
approximation, and data were dichotomised about the group median (see
Table 3.16).
We also collected verified GP attendances from primary care records. The
self reported visits and verified GP visits were only moderately well
correlated (r=0.62); an analysis of variance revealed r2 to be 0.66,
adjusted r2 0.62, p<0.0001. This is perhaps best shown in Figure 3.9, a
Bland-Altman plot of the difference of paired variables versus their
average; the mean difference was -1.34 visits (95% CI -1.86 to -0.82),
suggesting that GP records underestimate the true burden of falls.
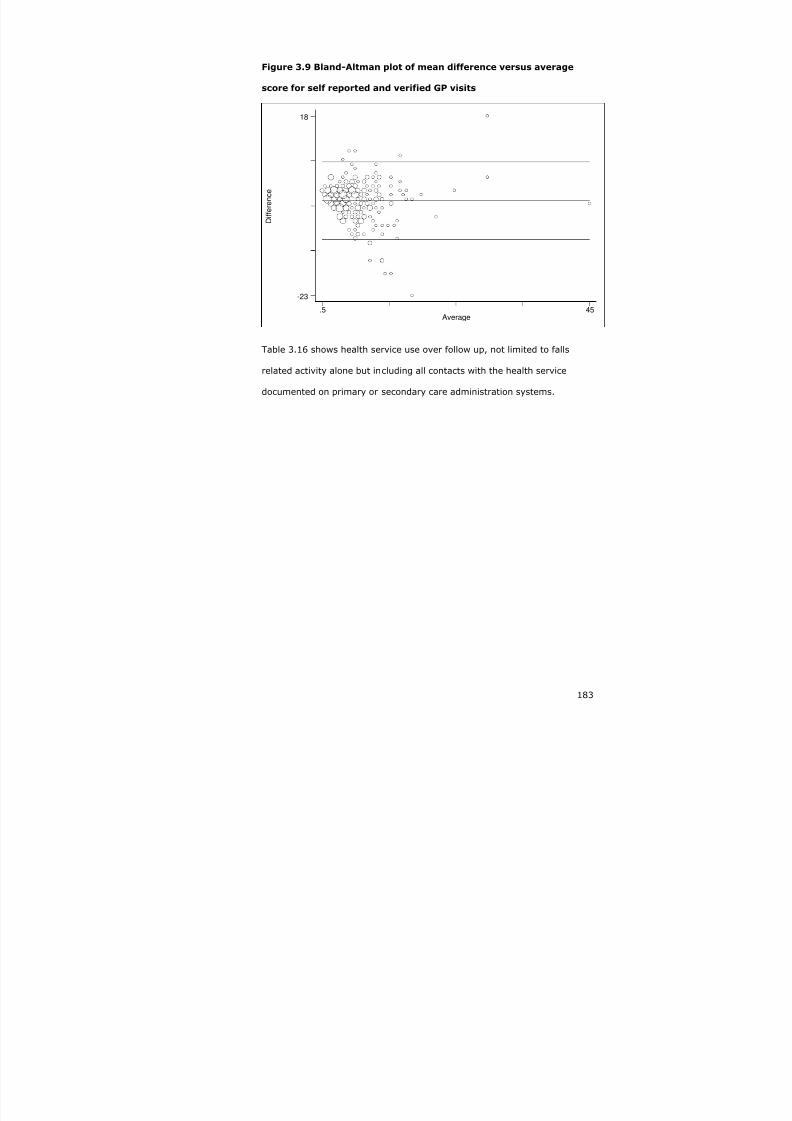
7/22/2019 Preventing Falls in Older People 2008
http://slidepdf.com/reader/full/preventing-falls-in-older-people-2008 183/240
183
Figure 3.9 Bland-Altman plot of mean difference versus average
score for self reported and verified GP visits
D i f f e r e n c e
Average.5 45
-23
18
Table 3.16 shows health service use over follow up, not limited to falls
related activity alone but including all contacts with the health service
documented on primary or secondary care administration systems.

7/22/2019 Preventing Falls in Older People 2008
http://slidepdf.com/reader/full/preventing-falls-in-older-people-2008 184/240
Table 3.16 Health service resource use
Medians (Interquartile range) Number (%) above t
median
Outcome
All Control Intervention Control Interv
Self-reported visits to the GPover 12 months n=238
5
(3-8)
5 (3-8) 5 (3-7) 72/151
(48%)
63/13
(47%
Verified GP attendances over 12
months n=270
5
(3-9)
6
(3-8)
5 (3-9) 69/137
(50%)
60/13
(45%
Verified non-ED hospital visitsover 12 months or death n=334*
0
(0-0), range 0-5
0(0-0)
0(0-0)
36/169
(21%)
39/16
(24%
Verified ED visit over 12 monthsor death n=334
Number not recorded 32/169
(19%)
40/16
(24%
Verified falls-related hospitalvisit** over 12 months or deathn=75
Number not recorded 6/36
(17%)
7/39
(18%
Verified fracture over 12 monthsfollow-up or until death n=364
0
(0-0), range 0-1
0(0-0)
0(0-1)
3/181
(2%)
6/183
(3%)
*Excludes visit to the day hospital as part of the falls prevention programme
**The correlation between self-reported with verified ED visits was poor (r=0.10) – verified visits only r
7/22/2019 Preventing Falls in Older People 2008
http://slidepdf.com/reader/full/preventing-falls-in-older-people-2008 185/240
185
The self-reported cumulative duration of visits to the GP was 56 (IQR 30-
100) minutes for controls and 55 (IQR 30-90) minutes for those in the
intervention group, with no significant differences between the groups
(Mann-Whitney p=0.644).
Self reported visits to the district nurse (DN) were captured using the
monthly diaries – either visits to the surgery or home visits, with a median
of 4 (IQR 2-7) visits over one year, irrespective of allocation, and no
significant differences between the groups even after adjusting for baseline
imbalances – adjusted odds ratio (splitting at the median) 0.7 (95% CI
0.4-1.2), p=0.211.
The cumulative duration of DN visits was similar between the groups:
median 35 minutes (IQR 15-85) in the controls versus 30 minutes (IQR 15-
70) in the intervention group (Mann-Whitney p=0.690). The crude odds
ratio (splitting at the median) was 1.0 (95% CI 0.6-1.0), p=0.958, and the
adjusted odds ratio 0.9 (95% CI 0.5-1.6), p=0.832.
3.16.6.6 Social services resource use
Self reported social services resource use was collected from the monthly
diaries. The data for this domain was poorly completed, with replies from
around 15% of RCT participants. 9/25 (36%) individuals in the intervention
group stated that they received meals on wheels, compared to 11/30
(37%) in the control group. Pearson’s chi (1 d.f) p=0.959; adjusted odds
ratio 0.5 (95% CI 0.1-2.4), p=0.406.
Participants were asked if they received any regular support in performing
their daily activities; this was the case for 41 in the intervention group as
opposed to 46 in the control group, but missing responses make the
denominator uncertain and render the data unhelpful. Similarly, 60 in the
control group as opposed to 66 in the intervention group had made some

7/22/2019 Preventing Falls in Older People 2008
http://slidepdf.com/reader/full/preventing-falls-in-older-people-2008 186/240
186
form of home adaptation; the median number of adaptations in the control
group was 1 (IQR 1-2) compared to 2 (IQR 1-3) in the intervention group,
(Mann-Whitney p=0.319). Finally, 96 in the intervention group compared
to 98 in the intervention group had purchased some form of assistive
technology, at a median total cost of £14 and £10.75 respectively, Mann-
Whitney p=0.690.
3.17 Summary of the findings from the randomised controlled trial
Three hundred and sixty-four community-dwelling older people at high risk
of falling were randomised into a pragmatic, multicentre trial evaluating
falls prevention programmes in three different day hospital in the East
Midlands. Twenty five percent of those eligible consented to participate,
representing 6% of the population aged 70+ registered with participating
general practices.
One hundred and eighty-one were allocated to the control group and 183
to the intervention, of whom seven and 131 respectively attended a falls
prevention programme. Losses to follow up were similar in both groups
(5%), less than originally anticipated. Complete follow up data was
available for 138/181 (76%) in the control group and 136/183 (74%) in
the intervention group. There were slight imbalances in baseline
characteristics between the two groups, and subsequent analyses were
adjusted for prognostically important baseline variables. Most (92%) of
those attending the day hospital were cognitively intact.
The primary outcome of the trial was the rate of falls; the unadjusted
incidence rate ratio using negative binomial regression was 0.64 (0.43-
0.95), p=0.025, in favour of the intervention.
Regression diagnostics identified a significant outlier in the data, whether
by deviance residuals, Cook’s distance, leverage or dbeta values; the
7/22/2019 Preventing Falls in Older People 2008
http://slidepdf.com/reader/full/preventing-falls-in-older-people-2008 187/240
187
individual had an extreme number of falls (107 over 12 months). A
sensitivity analysis excluding this individual showed a much better fit for
the negative binomial regression model, but the benefit in favour of the
intervention was reduced – IRR 0.86 (0.59-1.25), p=0.424. An adjusted
analysis including the baseline variables known to affect falls outcomes and
excluding the outlier gave an adjusted IRR of 0.73 (0.51-1.03), p=0.071,
and this is the most appropriate summary measure of effect to describe
this trial result.
A variety of sub-group analyses (age, gender, previous fall status, stratum
or per protocol) failed to demonstrate a significant difference in the effect
of the intervention by any particular sub-group.
There were no significant differences between the groups using the
intention to treat analysis in terms of the proportion of fallers, recurrent
fallers, medically verified falls, injurious falls, time to first fall or time to
second fall. There was a suggestion of benefit in delaying the time to a
second fall (55 days control vs. 87 days intervention), associated with a
clinically important reduction in the hazards ratio of 0.7 (95% CI 0.5-1.1)
in the adjusted model, but this was not statistically significant (p=0.103).
In a wide array of secondary outcomes, there were no significant
differences between the groups, including institutionalisation, mortality,
basic or extended activities of daily living, and fear of falling. Although
there was evidence of benefit using the EuroQoL (odds ratio 0.5 (0.3-0.9),
p=0.027), this was not demonstrated in a sensitivity analysis using an
imputed dataset to compensate for missing data – adjusted odds ratio 0.7
(0.41-1.35), p=0.334.
There were no significant differences between the groups in terms of health
and social care resource use – self reported and validated GP visits, self-
reported visits to the district nurse, self–reported and validated hospital

7/22/2019 Preventing Falls in Older People 2008
http://slidepdf.com/reader/full/preventing-falls-in-older-people-2008 188/240
188
attendances, or self-reported use or purchase of meals on wheels, home
adaptations or other assistive technology.
3.18 Discussion
Although the initial analysis appears to show a statistically significant and
clinically important trial result, the appropriate analysis shows no
conclusive evidence of benefit. The findings are consistent with a 49%
reduction in the rate of falls, or a 3% increase – adjusted IRR 0.73 (0.51-
1.03), p=0.071. The best estimate is for a 27% reduction in the rate of
falls. Such a reduction is clinically important, but the probability of finding
this level of effect when the null hypothesis is in fact true (that there is no
difference between those randomised to the intervention and those in the
control group) is 7/100 (p=0.07).
There are several possible explanations as to why this trial that pointed at
a clinically important reduction in the rate of falls should have been unable
to do so with a high level of confidence – inadequate power and chance,
bias, insensitive outcomes, reverse causation or an inadequate
intervention.
3.18.1 Inadequate power and chance
The p-value relating to the null hypothesis – that there was no difference
between the two groups in this trial was 0.07; it is conventional to infer the
presence of genuine differences between groups to require this probability
to be either less than 5% or 1% in order to reject the null hypothesis of no
difference. The trial was planned to detect a clinically important risk
reduction of 24% assuming a baseline fall rate of 2 per person-year, 320
person-years of follow up and 80% power. The assumptions for the sample
size calculations were reasonably accurate as the study recruited 304
person-years and fall rates were 2.2 (control) and 1.9 (intervention). The

7/22/2019 Preventing Falls in Older People 2008
http://slidepdf.com/reader/full/preventing-falls-in-older-people-2008 189/240
189
slight disparity in the person-years of follow up calculated in the original
power calculation and that seen in the trial (320 vs. 304 person-years),
may well account for the lack of power to reject the null hypothesis. This
study was designed using 80% power, and although this is commonly used
in trial planning, it means that there was a one in five chance of dismissing
a real effect of a 24% reduction in the rate of falls if one existed (type II
error).
Two other recent falls prevention trials have shown no evidence of benefit,
because of a lack of power. Hendriks et al 230 studied a high risk population
attending the emergency department with a fall. They powered their trial
to show a 20% difference in the proportion of fallers (52% versus 32%,
alpha 0.05, beta 90%) with 164 participants in each arm. 258 participants
were eligible for the primary outcome (proportion of falls at one year), and
the odds ratio was 0.86 (0.50-1.49), p=0.59. They concluded that the
intervention was ineffective, but in fact could have missed even a 30%
reduction in falls, again because of a type II error.
Elley et al 229 carried out a RCT to look at the effectiveness of a nurse
specialist coordinating a falls prevention programme for high risk
community dwelling older people. They also powered their trial to show a
20% difference on the proportion of fallers (52% versus 32%, alpha 0.05,
beta 90%) with 105 participants in each arm. 312 participants were eligible
for the primary outcome (rate of falls over one year), and the incidence
rate ratio was 0.96 (0.70-1.34), using Poisson analysis. They concluded
that the intervention was ineffective, but in fact could have missed a
clinically important 15% reduction in falls rates because of a type II error.
The population attributable fraction (=p(RR-1) / [p(RR-1)+1], see section
2.4.2) reflects the attributable risk multiplied by the proportion of the
population exposed (35% prevalence measured prospectively in the
7/22/2019 Preventing Falls in Older People 2008
http://slidepdf.com/reader/full/preventing-falls-in-older-people-2008 190/240
190
screening cohort): 0.35*(0.73-1)/[0.35*(0.73-1)+1]=10%. This suggests
that 10% of all falls in people aged 70 or older could be prevented using
the modified FRAT to identify people at risk and providing a multifactorial
falls prevention programme if the estimate of effect seen in this study is
correct. This compares to an estimated 9% reduction in serious fall-related
injuries anticipated at the population level in the US55 and Austrialia272 and
could have considerable public health impact. In 2005–06, the acute care
of 68,416 patients with hip fracture in England cost the NHS an estimated
£781 million413. Assuming that 80% of hip fractures are related to falls
(probably an underestimate), then a 10% reduction in the number of falls
could result in 5473 fewer hip fractures per annum (10%x80%x68416).
This represents 5473 individuals who would avoid a fracture, up to 82095
(5473 x15) hospital bed days saved, or a £62 million saving
(£781M*5473/68416). Whilst the cost of this would need to be balanced
against the cost of a falls prevention programme, it illustrates the potential
impact of a 10% reduction in falls, and how important the 27% estimated
reduction in falls seen in this trial could be.
3.18.2 Bias
Participants were aware of their allocation, and thus differential reporting
cannot be excluded as a cause of bias. For example, those in receipt of falls
services might be more likely to recall and hence notify falls, whereas
those receiving less input might be less likely to recall falls; this might have
attenuated the effect. But a series of validated analyses (medically verified
falls, hospital admissions etc) also failed to show any difference between
the groups in terms of their reporting of these outcomes, which makes
reporting bias unlikely.
There were imbalances in baseline covariates which may have been a
source of bias, with the intervention group being slightly sicker than the

7/22/2019 Preventing Falls in Older People 2008
http://slidepdf.com/reader/full/preventing-falls-in-older-people-2008 191/240
191
control group, but adjusted analyses did not substantially alter the crude
outcomes.
Monthly diary data were entered by a research nurse blinded to the
allocation, but it is not possible to exclude some form of manipulation or
tampering which may have systematically affected the results. However,
the double entry checks did not reveal any obvious evidence of systematic
bias, with error rates of less than 1% recorded.
Design bias might have been a possibility – the usual care group could
have accessed falls prevention programmes, thus attenuating the effect of
systematically implementing a falls prevention programme; however, given
that only 7/181 in the control group accessed any form of falls prevention
programme, this is unlikely, though may have slightly reduced the
intervention effect.
It is possible that those screened into the study were in some way
fundamentally different from people who would otherwise have been
referred routinely to a falls prevention programme, either because of
differing falls rates, or because of their characteristics (Table 2.7) – such as
willingness to participate. Certainly the age and gender of those in the
screening arm and the RCT were similar to those that declined to
participate in the trial, though clearly their falls risk factor profile was
different, as could have been their motivation to attend. Those at high risk
agreeing to participate in the RCT may be different in some unknown way
compared to those at high risk who only agreed to participate in the
screening cohort. As discussed in section 2.8.2, this may have led to an
overall higher risk group in the RCT compared to the screening cohort.

7/22/2019 Preventing Falls in Older People 2008
http://slidepdf.com/reader/full/preventing-falls-in-older-people-2008 192/240
192
3.18.3 Confounding
The use of a randomised controlled trial design should have prevented
unknown confounding factors from exerting a significant effect upon the
trial outcome, but it is possible that some confounding occurred which has
not been measured, and so cannot be accounted for.
3.18.4 Insensitive outcomes
The outcomes used in this trial (falls, functional outcomes, fear of falling
and quality of life) have been used in a wide variety of similar trials and
have been able to demonstrate a difference between groups, whether this
be in self reported falls, fear of falling or function. Insensitive outcomes are
not a good explanation for the lack of effect seen in this trial.
3.18.5 Reverse causation
A possible explanation is reverse causation – namely that the intervention
increased falls, possibly mediated through an increase in activity. Against
this is the absence of any difference between the two groups in terms of
functional outcomes, in particular mobility related outcomes in both the
Barthel and mobility sub-section of the NEADL make this theory
implausible. Additionally, both groups reported similar scores for fear of
falling.
3.18.6 Inadequate intervention
That the intervention tested was insufficiently potent to affect falls related
outcomes in this population is a further possible explanation. Although the
post-hoc sub-group analysis limited to those who attended the falls
prevention programme showed a large effect size – incidence rate ratio
0.39 (95% CI 0.11-1.40), p=0.149 this was not statistically significant
(likelihood ratio test p=0.185). Adherence to the allocated intervention was
limited, with only 37% of those allocated to the intervention attending six

7/22/2019 Preventing Falls in Older People 2008
http://slidepdf.com/reader/full/preventing-falls-in-older-people-2008 193/240
193
or more sessions of the falls prevention programme. Previous trials
showing an effect from falls prevention programmes had adherence rates,
measured by compliance with follow-up, of around 80% (section 1.5.1).
This suggests that lack of adherence to the evidence based intervention in
this trial may be an explanatory factor in the failure to demonstrate an
effect from the intervention. Reasons for non-attendance included time and
travel arrangements, and participants not perceiving themselves to benefit
from the falls prevention programme.
When individuals attended the FPP more than one visit, on the whole they
received appropriate interventions (~60 minutes occupational therapy,
~300 minutes physiotherapy and a series of medical reviews), though the
‘dose’ of these interventions was probably sub-optimal. More recent
evidence suggests that at least 50 hours of exercise are required to see
clinically important reductions in falls rates414 which may be best achieved
by community-based peer-led exercise programmes415. The inadequate
intervention in this study compared to what has previously been described
in ‘positive’ studies may well have contributed to the lack of effect.
The absence of a clearly defined, uniform intervention in the three day
hospitals is a weakness of this study, but it still remains a valid
examination of falls prevention programmes as commonly configured in
England and Wales, as discussed further in 3.18.9.
Appendix 4.6 details a meta-analysis comparing efficacy (explanatory)
trials to effectiveness (pragmatic) falls prevention trials. Whilst imperfect in
terms of methodology, the meta-analysis lends support to the theory that
there is a discrepancy between efficacy trials and their delivery in clinical
practice (trials of effectiveness).

7/22/2019 Preventing Falls in Older People 2008
http://slidepdf.com/reader/full/preventing-falls-in-older-people-2008 194/240
194
3.18.7 Summary
This trial in isolation does not demonstrate beyond reasonable doubt that a
multifactorial falls prevention programme delivered in day hospitals to
predominantly cognitively intact older people living in the primary care
setting identified as being at high risk of falls using a postal screening
questionnaire, is beneficial. A smaller, yet clinically important benefit
cannot be excluded, but would need a larger, adequately powered trial: a
clinically meaningful 15% reduction in falls would need a trial with 644
participants with alpha set at 0.05 and 1-beta at 0.80. Likely explanations
for the lack of effect include inadequate power, cross over in the control
arm, poor compliance and a sub-optimal intervention in the intervention
arm.
The totality of evidence from other trials suggests that falls prevention
interventions, sufficiently intensive and properly delivered, can reduce falls
rates10 12 217 224 225. The results from this trial are consistent with the results
from other published trials, as shown in the meta-analysis in appendix 4.6,
although there was significant heterogeneity (fixed effect estimate I2
statistic 69%, p<0.0001). The best estimate of effect size in this trial
(27%) is similar to that seen in other trials, although in the particular
circumstances of this trial the findings are compatible with there being no
difference, and so the null hypothesis cannot be confidently rejected.
3.18.8 External validity
The bulk of the published evidence would have led one to expect this trial
to have shown a benefit; most RCTs, meta-analyses and systematic
reviews have all pointed to the benefits of a structured falls prevention
programme in high risk populations10 12 217 224 225, although not specifically
in a day hospital setting. More recent evidence has focussed on more
pragmatic interventions229, which have found no evidence of benefit, with

7/22/2019 Preventing Falls in Older People 2008
http://slidepdf.com/reader/full/preventing-falls-in-older-people-2008 195/240
195
the authors highlighting the issue of compliance being one of the main
detractors. The findings of this trial are compatible with the evidence
presented in the meta-analysis by Gates et al 226; which found that fall
prevention services may reduce falls by up to 20%, but the findings were
also compatible with a slight increase in falls (0.91 (95% confidence
interval 0.82 to 1.02).
3.18.9 Generalisability
The falls rates seen in this study were broadly in keeping with what might
be expected in England; 2 per person-year in a high risk population
compared to 1.1-1.8 falls per person-year28 29 in all community dwelling
older people. Falls clinics, broadly equivalent to the day hospital based falls
prevention programme evaluated in this RCT, are commonplace across
England and Wales416. It has been estimated that there are 298 falls clinics
throughout England and Wales (SDO report, 2007416), 96% of which are
based in community hospitals or acute hospitals. Most of these falls clinics
(228/231, 99%) offer a multifactorial intervention similar to that described
in this RCT. This suggests that the results of this RCT are generalisable to
falls services throughout England and Wales.
3.18.10 Implications
This is the only RCT to date examining falls prevention services as
commonly configured in England and Wales; the results of this trial in
isolation do not conclusively support falls prevention services delivered in a
day hospital setting to a screened population of older people identified as
being at high risk of a future fall. A clinically meaningful reduction in falls
cannot be excluded as a type II error may account for the findings. This
trial also highlights the issue of compliance, with only 37% of those
randomised to the intervention receiving six or more sessions of falls
prevention therapy. It also highlights the importance of adhering to the

7/22/2019 Preventing Falls in Older People 2008
http://slidepdf.com/reader/full/preventing-falls-in-older-people-2008 196/240
196
evidence based ‘recipe’ for falls prevention – had a more intensive
intervention been provided then this trial may have been more conclusive.
The introduction of the screening element is an important difference
compared to usual falls prevention programmes, which tend to be more
reactive, and so patients attending are more self-selecting – and so
adherence may be better. This is supported by differential recruitment into
the RCT rather than the screening arm of individuals with a previous fall.
There are important implications for falls services – if they are to achieve
the reductions in falls seen in efficacy trials, services should strive to
reproduce the evidence based interventions in practice. This will involve
findings innovative methods to encourage participants to continue
attendance for the full programme of strength and balance training, and
‘marketing’ the programmes in such a way that participants will not be
dissuaded from attending. The work from Yardley et al 218 and Horne et al 417
is informative in this regard, demonstrating the importance of emphasising
the positive aspects of falls prevention services (healthy ageing, improving
quality of life), as opposed to the negative (you will continue to fall if you
don’t come).
Some authors have suggested that clinical trials in areas where there is a
high pre-trial probability of finding a positive outcome might be stopped
early, before the conventional limits of significance have been achieved in
order not to violate the principle of individual as opposed to collective
equipoise418. In the context of this trial, it can therefore be argued that it
could have been stopped early (before convention statistical significance
was reached), but no provision for this was made in the study protocol.
That these trial findings are in keeping with previous similar trials as shown
in the meta-analysis provides further reassurance that there is benefit from

7/22/2019 Preventing Falls in Older People 2008
http://slidepdf.com/reader/full/preventing-falls-in-older-people-2008 197/240
197
a falls prevention programme provided to populations at high risk of falls
more generally (RR 0.86, 95% CI 0.76-0.98))10.
The argument for interpreting this trial supports the efficacy of falls
prevention interventions is supported by the meta-analysis data, Bayes
theorem and Stein’s paradox419. Bayes theorem would interpret the trial in
the context of the a priori findings (most falls prevention trials are
positive), and so perhaps have a lower threshold for declaring a positive
effect. Stein’s theory expands on the regression towards the mean theory,
namely that the best estimate of ‘truth’ is the combination of estimates.
Using these paradigms, one could argue that the most plausible
interpretation in the general context of high risk populations for this trial is
that there was a 27% reduction in falls in favour of the intervention. But
nevertheless, with regards to the specific research question this trial set
out to answer, the findings do not support the role of falls prevention
services delivered in the day hospital to a screened population.
There are also implications for the research agenda. One area which needs
to be addressed in more detail is around encouraging participation,
compliance and adherence. This is a programme of qualitative work,
looking at how individuals deemed to be risk of future falls perceive
themselves, what sorts of interventions they will find acceptable, where the
interventions should be located and how the interventions can be sustained
in the longer term? It also needs to address health professionals’
perceptions of patient risk and the rigour with which evidence based
interventions are applied. The implication is that although there are
multiple RCTs of falls preventions, that some of the critical developmental
work, as described in the MRC framework for developing complex
interventions335, at least concerning day hospital delivered programmes,
has not been fully elucidated. Once the falls prevention programme has

7/22/2019 Preventing Falls in Older People 2008
http://slidepdf.com/reader/full/preventing-falls-in-older-people-2008 198/240
198
been refined, and piloted for acceptability, there may then be a role for a
larger, adequately powered RCT addressing the effectiveness and cost-
effectiveness of falls prevention programmes in a screened population. It is
important to assess the feasibility and biological plausibility of interventions
before proceeding to interpret RCTs or even meta-analyses420.
3.18.11 Overall evidence
The primary aim of this study was to determine if screening for individuals
at high risk of falls and offering a day hospital based falls prevention
programmes to those at high risk was beneficial.
Wilson & Jungner’s285 screening criteria provide a suitable framework to
revisit this question in light of the evidence presented:
• The condition should be an important public health problem
Falls are a common problem for older people, with 24% of people aged
over 65 years falling at least once every year. Falls are the leading cause of
trauma in older people and a prime cause of fracture; they are also a
major cause of mortality in older people. Falls have a similar impact on
hospital services to other major conditions such as stroke and myocardial
infarction (section 1.7).
• There should be an accepted treatment
Multifactorial interventions delivered to previous fallers and others at high
risk have been effective in reducing falls rates by around 25%. Whilst this
trial is in keeping with the evidence that falls prevention programme are
effective, it was unable to show any effect from such a programme
delivered in a day hospital to a high risk population.
• Facilities for diagnosis and treatment should be available/ there
should be a suitable test

7/22/2019 Preventing Falls in Older People 2008
http://slidepdf.com/reader/full/preventing-falls-in-older-people-2008 199/240
199
We have validated a modified version of the FRAT which has reasonable
predictive properties: sensitivity 78.7% and specificity 57.5%. The positive
predictive value of 50% indicates that for every two people identified as
being at high risk, one would go onto to have a fall in the following year.
The 83% negative predictive value means that of those screened as being
at low risk, approximately one in six will go on to have a fall.
• There should be a recognisable latent or early asymptomatic
stage/The natural history of the condition should be understood
There is a latent period in which individuals are at risk of falls, but have not
fallen, as discussed in section 1.4. Of the 364 identified as being at high
risk and include din the trial, 42 had not previously fallen, and there was
no evidence of benefit in those who had fallen over those who had not prior
to randomisation.
• The test should be acceptable to the population
The modified FRAT was reasonably acceptable to community dwelling older
people – 54% completed and returned the form.
• There should be an agreed policy on whom to treat as patients
The identification of high risk individual is encouraged by NICE, though a
formal screening programme has not been recommended
• The cost of case-finding should be economically balanced in relation
to the possible expenditure as a whole
This is a crucial component of this work, and analysis is in progress
• Case-finding should be a continuing process
The modified FRAT is easy to apply in primary care and could be relatively
easily incorporated into routine practice, supported by incentive strategies.

7/22/2019 Preventing Falls in Older People 2008
http://slidepdf.com/reader/full/preventing-falls-in-older-people-2008 200/240
200
Current practice of referring people who are at high risk of falls or who
have already fallen for a multifactorial falls prevention programme is
patchy – in this study only 7/181 (4%) of those in the control arm. Having
considered the screening criteria above, there now appears reasonable
justification to suggest a more proactive approach to preventing falls in
older people.
3.18.12 Recommendations
Further work on the acceptability and implementation of multifactorial falls
prevention interventions is required; once suitable approaches have been
found, a further adequately powered RCT may be considered to determine
the effectiveness and cost-effectiveness of a systematic screening
programme to identify older people at risk of falls, and offer a multifactorial
intervention. However, considering the totality of the evidence presented in
this thesis, it is not unreasonable to focus additional research efforts on
implementation and acceptability alone rather than adding to the evidence
base for falls prevention programmes, which would be costly and difficult to
justify.
Although this trial in isolation does not provide sufficient evidence to health
care commissioners to recommend screening and intervention for falls, in
combination with the totality of the evidence it would not be unreasonable
to do so. But before embarking on widespread screening, the likely cost of
such a programme needs to be estimated. At the very least a more
rigorous approach to case-finding should be encouraged.

7/22/2019 Preventing Falls in Older People 2008
http://slidepdf.com/reader/full/preventing-falls-in-older-people-2008 201/240
201
4 APPENDICES
4.1 Literature review – search methods
Databases searched: Ovid MEDLINE(R) 1996 to June Week 4 2008;
EMBASE 1996 to 2008 Week 27; titles were scanned for relevance, then
abstracts and full papers examined if relevant. Key references from full
papers were hand searched.
4.1.1 Search terms for falls prevalence and incidence
MEDLINE EMBASE
1 Accidental Falls/ (Falling/ in EMBASE) 6818 8574
2 Prevalence/ 87841 121789
3 Incidence/ 84490 84983
4 2 or 3 164246 196330
5 Aged/ 812946 690869
6 1 and 4 and 5 458 569
7limit 6 to (English language and humans and (clinicaltrial, all or "review"))
78 47
8 Retained 17 1
4.1.2 Search terms for falls and admission to long term care
# Searches MEDLINE EMBASE
1 Accidental Falls/ (Falling/ in EMBASE) 6831 8592
2 institutionalization/ or long-term care/ 8436 40205
3 Aged/ 813955 691890
4 1 and 2 and 3 80 141
5 from 4 keep … 13 8
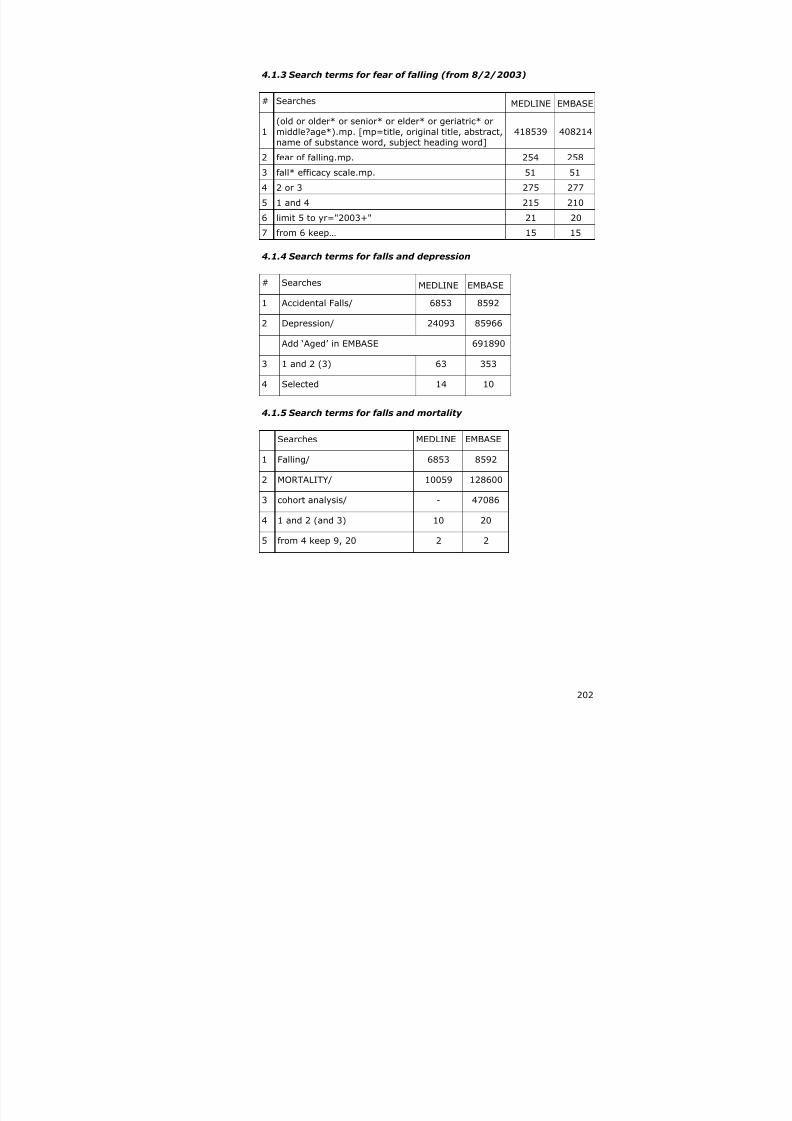
7/22/2019 Preventing Falls in Older People 2008
http://slidepdf.com/reader/full/preventing-falls-in-older-people-2008 202/240
202
4.1.3 Search terms for fear of falling (from 8/2/2003)
# Searches MEDLINE EMBASE
1
(old or older* or senior* or elder* or geriatric* or
middle?age*).mp. [mp=title, original title, abstract,name of substance word, subject heading word]
418539 408214
2 fear of falling.mp. 254 258
3 fall* efficacy scale.mp. 51 51
4 2 or 3 275 277
5 1 and 4 215 210
6 limit 5 to yr="2003+" 21 20
7 from 6 keep… 15 15
4.1.4 Search terms for falls and depression
# Searches MEDLINE EMBASE
1 Accidental Falls/ 6853 8592
2 Depression/ 24093 85966
Add ‘Aged’ in EMBASE 691890
3 1 and 2 (3) 63 353
4 Selected 14 10
4.1.5 Search terms for falls and mortality
Searches MEDLINE EMBASE
1 Falling/ 6853 8592
2 MORTALITY/ 10059 128600
3 cohort analysis/ - 47086
4 1 and 2 (and 3) 10 20
5 from 4 keep 9, 20 2 2
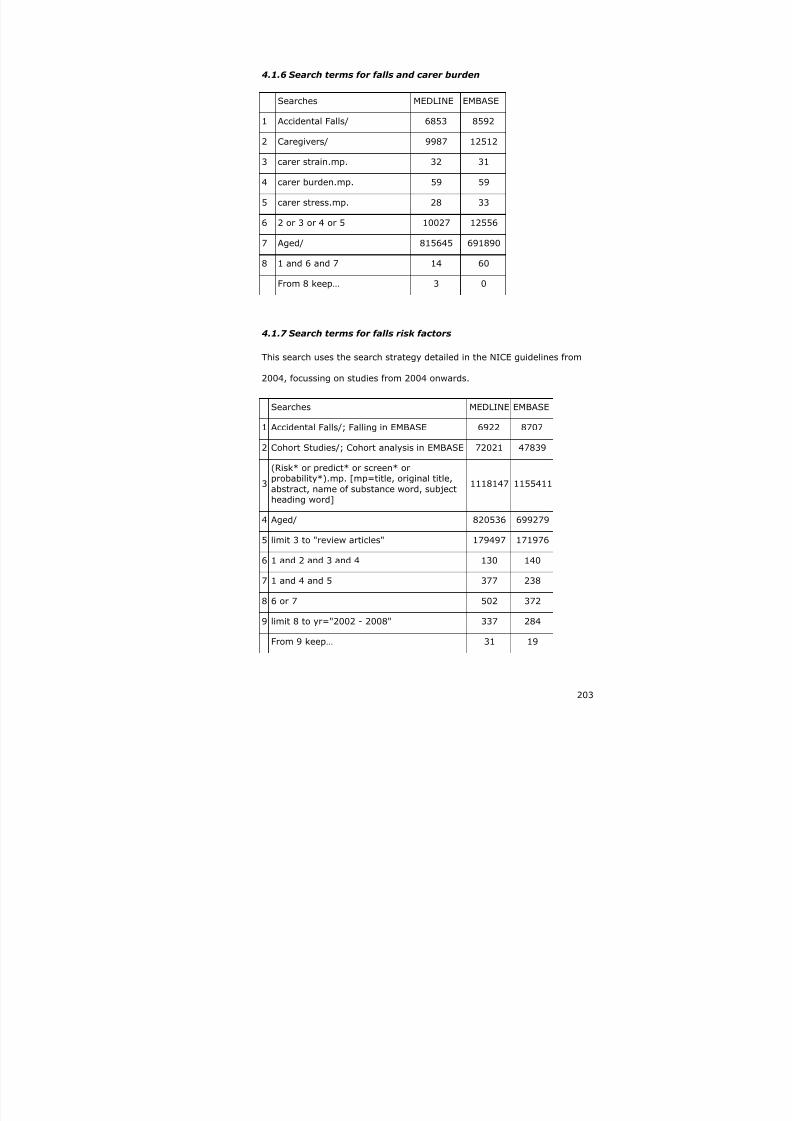
7/22/2019 Preventing Falls in Older People 2008
http://slidepdf.com/reader/full/preventing-falls-in-older-people-2008 203/240
203
4.1.6 Search terms for falls and carer burden
Searches MEDLINE EMBASE
1 Accidental Falls/ 6853 8592
2 Caregivers/ 9987 12512
3 carer strain.mp. 32 31
4 carer burden.mp. 59 59
5 carer stress.mp. 28 33
6 2 or 3 or 4 or 5 10027 12556
7 Aged/ 815645 691890
8 1 and 6 and 7 14 60
From 8 keep… 3 0
4.1.7 Search terms for falls risk factors
This search uses the search strategy detailed in the NICE guidelines from
2004, focussing on studies from 2004 onwards.
Searches MEDLINE EMBASE
1 Accidental Falls/; Falling in EMBASE 6922 8707
2 Cohort Studies/; Cohort analysis in EMBASE 72021 47839
3
(Risk* or predict* or screen* orprobability*).mp. [mp=title, original title,abstract, name of substance word, subjectheading word]
1118147 1155411
4 Aged/ 820536 699279
5 limit 3 to "review articles" 179497 171976
6 1 and 2 and 3 and 4 130 140
7 1 and 4 and 5 377 238
8 6 or 7 502 372
9 limit 8 to yr="2002 - 2008" 337 284
From 9 keep… 31 19

7/22/2019 Preventing Falls in Older People 2008
http://slidepdf.com/reader/full/preventing-falls-in-older-people-2008 204/240
204
4.1.8 Search terms for falls risk assessment tools
This is a sensitive rather than specific search; retained studies were those
that included evidence based falls risk factors combined in a screening tool,
with prospective follow up and results reported as
sensitivity/specificity/area under the curve.
Searches MEDLINE EMBASE1 Risk Assessment/ 82404 152694
2 *Recurrence Risk/ - 284
3 PREDICTION/ 66580 115940
4 "prediction and forecasting"/ - 1244
5 *Falls Risk Assessment Tool/ 9 1
6 Risk Factor/ 257700 194062
7 1 or 2 or 3 or 4 or 5 or 6 377516 409941
8 Prospective Study/ 166603 68568
9 Cohort Analysis/ 72413 47839
10 Follow Up/ - 233211
11 8 or 10 or 9 - 318638
12 Human/ 4610101 3814687
13 Aged/ 823705 699279
14 *Falling/ 6953 2309
15 11 and 7 and 13 and 12 and 14 32 183
16 From 15 keep 3 37
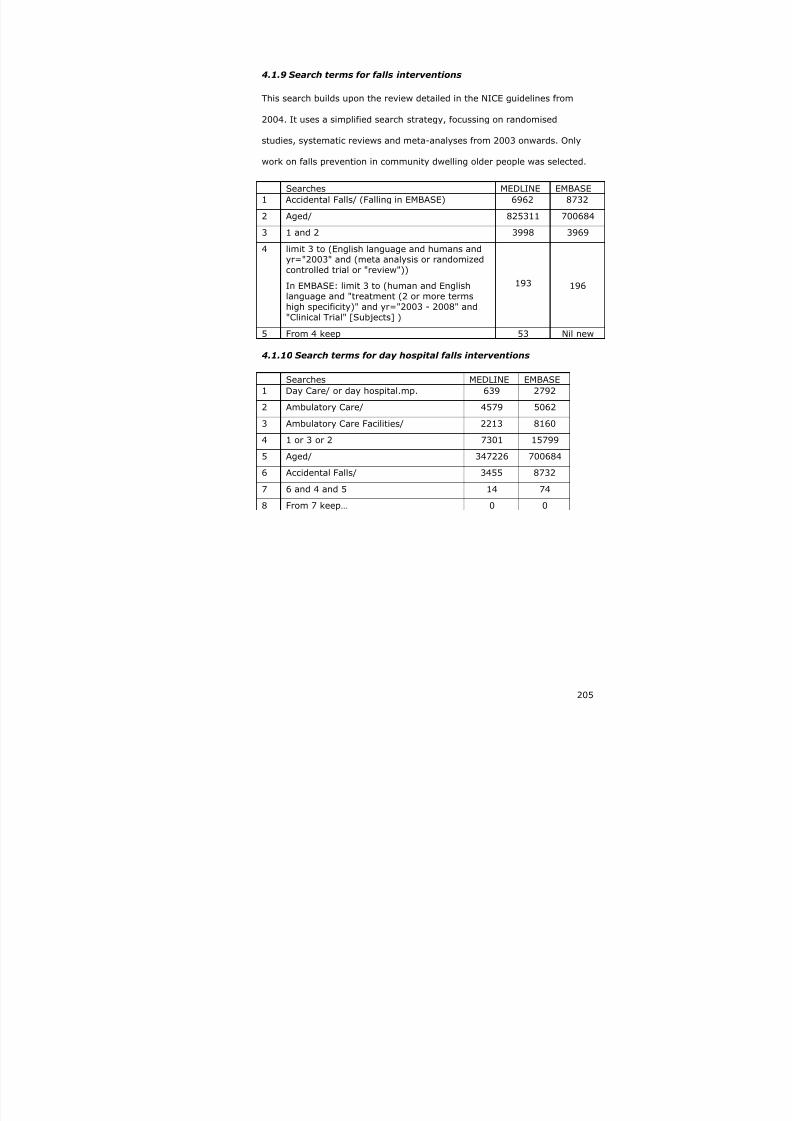
7/22/2019 Preventing Falls in Older People 2008
http://slidepdf.com/reader/full/preventing-falls-in-older-people-2008 205/240
205
4.1.9 Search terms for falls interventions
This search builds upon the review detailed in the NICE guidelines from
2004. It uses a simplified search strategy, focussing on randomised
studies, systematic reviews and meta-analyses from 2003 onwards. Only
work on falls prevention in community dwelling older people was selected.
Searches MEDLINE EMBASE1 Accidental Falls/ (Falling in EMBASE) 6962 8732
2 Aged/ 825311 700684
3 1 and 2 3998 3969
4 limit 3 to (English language and humans and
yr="2003" and (meta analysis or randomizedcontrolled trial or "review"))
In EMBASE: limit 3 to (human and Englishlanguage and "treatment (2 or more termshigh specificity)" and yr="2003 - 2008" and"Clinical Trial" [Subjects] )
193 196
5 From 4 keep 53 Nil new
4.1.10 Search terms for day hospital falls interventions
Searches MEDLINE EMBASE
1 Day Care/ or day hospital.mp. 639 2792
2 Ambulatory Care/ 4579 5062
3 Ambulatory Care Facilities/ 2213 8160
4 1 or 3 or 2 7301 15799
5 Aged/ 347226 700684
6 Accidental Falls/ 3455 8732
7 6 and 4 and 5 14 74
8 From 7 keep… 0 0

7/22/2019 Preventing Falls in Older People 2008
http://slidepdf.com/reader/full/preventing-falls-in-older-people-2008 206/240
206
4.2 Screening questionnaire

7/22/2019 Preventing Falls in Older People 2008
http://slidepdf.com/reader/full/preventing-falls-in-older-people-2008 207/240
207
4.3 Sample day hospital log

7/22/2019 Preventing Falls in Older People 2008
http://slidepdf.com/reader/full/preventing-falls-in-older-people-2008 208/240
4-208
4.4 Data checking
The variables in Table 4.1 were examined for missing or extreme or
implausible results, and any errors corrected. All discrepancies were
corrected in the Access database where appropriate.
Table 4.1 Data cross checks
Item 1 Item 2 NotesDate of consent Date randomisedStratum Postcode/town 5 errors; allocation by
stratum was imbalanced with4 individuals who shouldhave been in the Nottinghamstratum according topostcodes being allocated tothe Derby stratum and one inthe reverse direction
Allocation Exclusions id 2191 attended DH but onlyfound out after randomisationso excluded from the analysis
Cross check DH logs GP recordsHospital records
Date of entry Date of care homeadmissionDate of deathDate final diary
Withdrawn & no diaries –date of exit = date diary 1sent +1 day
Deaths Hospital recordsAE recordsGP records
Fall Date of fallFall numberInjuryFall detailFall1 vs fall2 dates
Missing dates equallydistributed between groups;the mid-point date for thediary month corresponding tothat fall was assigned.

7/22/2019 Preventing Falls in Older People 2008
http://slidepdf.com/reader/full/preventing-falls-in-older-people-2008 209/240

7/22/2019 Preventing Falls in Older People 2008
http://slidepdf.com/reader/full/preventing-falls-in-older-people-2008 210/240

7/22/2019 Preventing Falls in Older People 2008
http://slidepdf.com/reader/full/preventing-falls-in-older-people-2008 211/240
211
4.6 Meta-analysis of falls prevention trials
A limited meta-analysis was carried out to determine the relative benefit if
efficacy trials as compared to effectiveness trials. Trials were drawn from
the most recent meta-analyses from Campbell12 and Gates226 as well as
including trials published since 2003 logged in Medline.
Search terms included: randomised controlled trial, accidental falls, aged,
limited to English language & humans
Inclusion criteria were: falls over 12 months reported as primary outcome,
community dwelling population (including retirement villages), uni or
multifactorial intervention, sample size more than 100 in each arm,
number of events in control and intervention groups or measure of relative
risk with confidence intervals reported.
Each paper was assessed to determine if it was an efficacy/explanatory
trial or an effectiveness/pragmatic trial. In this context,
pragmatic/effectiveness trials were defined as evaluations of established
clinical services, and explanatory/efficacy trials as trials of clearly defined
protocol driven interventions. However, few trials report sufficient detail to
enable complete clarity in distinguishing the two. This means that the
distinction is somewhat subjective; this could have been improved by
having a second reviewer classifying each trial, with discussion where there
was disagreement. Summary data from the selected trials is shown in
Table 4.2.

7/22/2019 Preventing Falls in Older People 2008
http://slidepdf.com/reader/full/preventing-falls-in-older-people-2008 212/240
Table 4.2 Summary data: RCTs of falls prevention interventions 1994-2008
Author/year Classification n Intervention Relative risk 95% CIs
Campbell 2005 Efficacy 391 Multifactorial 0.59 0.42 0.83
Bischoff-Ferrari 2006 Efficacy 445 Unifactorial 0.77 0.51 1.15
Cumming 2007 Efficacy 616 Unifactorial 1.57 1.2 2.05
Lord 2003 Efficacy 551 Unifactorial 0.78 0.62 0.99
Wolf 2003 Efficacy 291 Unifactorial 0.75 0.52 1.08
Cumming 1999 Efficacy 530 Unifactorial 0.64 0.5 0.83
Stevens 2001 Efficacy 1737 Unifactorial 1.02 0.83 1.27
Campbell 1997 Efficacy 233 Multifactorial 0.6 0.47 0.78
Clemson 2004 Efficacy 310 Multifactorial 0.69 0.5 0.96
Davison 2005 Efficacy 313 Multifactorial 0.64 0.46 0.9
Freiberger 2007 Efficacy 217 Multifactorial 0.77 0.6 0.97
Lord 2005 Efficacy 597 Multifactorial 0.9 0.69 1.17Shumway-Cook 2007 Efficacy 453 Multifactorial 0.75 0.52 1.09
Tinetti 1994 Efficacy 301 Multifactorial 0.69 0.52 0.9
Robertson 2001 Efficacy 240 Multifactorial 0.54 0.32 0.9
Conroy 2008 Pragmatic 344 Multifactorial 0.73 0.51 1.03
Elley 2008 Pragmatic 312 Multifactorial 0.96 0.7 1.34
Mahoney 2007 Pragmatic 349 Multifactorial 0.81 0.57 1.17

7/22/2019 Preventing Falls in Older People 2008
http://slidepdf.com/reader/full/preventing-falls-in-older-people-2008 213/240
213
The meta-analysis using the fixed-effect estimate had an I2 statistic of
69.1%, p<0.0001 indicating significant heterogeneity between the studies.
Accordingly, a random-effects meta-analysis was carried out (Figure 4.5).
Figure 4.5 Meta-analysis of falls prevention studies using a
random-effects model
NOTE: Weights are from random effects analysis
Overall (I-squared = 50.8%, p = 0.007)
Mahoney 2007
Clemson 2004
Wolf 2003
ID
Stevens 2001
Lord 2003
Cumming 2007
Campbell 2005
Conroy 2008
Tinetti 1994
Davison 2005
Cumming 1999
Campbell 1997
Lord 2005
Robertson 2001
Shumway-Cook 2007
Bischoff-Ferrari 2006
Study
Freiberger 2007
Elley 2008
0.76 (0.68, 0.83)
0.81 (0.57, 1.17)
0.69 (0.50, 0.96)
0.75 (0.52, 1.08)
ES (95% CI)
1.02 (0.83, 1.27)
0.78 (0.62, 0.99)
1.57 (1.20, 2.05)
0.59 (0.42, 0.83)
0.73 (0.51, 1.03)
0.69 (0.52, 0.90)
0.64 (0.46, 0.90)
0.64 (0.50, 0.83)
0.60 (0.47, 0.78)
0.90 (0.69, 1.17)
0.54 (0.32, 0.90)
0.75 (0.52, 1.09)
0.77 (0.51, 1.15)
0.77 (0.60, 0.97)
0.96 (0.70, 1.34)
100.00
4.29
5.79
4.67
Weight
6.05
7.02
2.63
6.45
5.09
6.88
6.05
7.63
7.95
5.54
4.48
4.57
3.95
%
7.02
3.95
0-2.05 0 2.05
This meta-analysis, including data from our trial indicates a combined
relative risk reduction of 0.76 (0.68-0.83) in favour of falls prevention
strategies delivered to high risk individuals.
A further meta-analysis was carried out separating pragmatic from
explanatory trials (Figure 4.6). This shows a similar relative risk reduction
of 0.76 (0.68-0.83) for the explanatory trials, but a reduced effect in
pragmatic trials – effect size 0.82 (0.65-0.99).
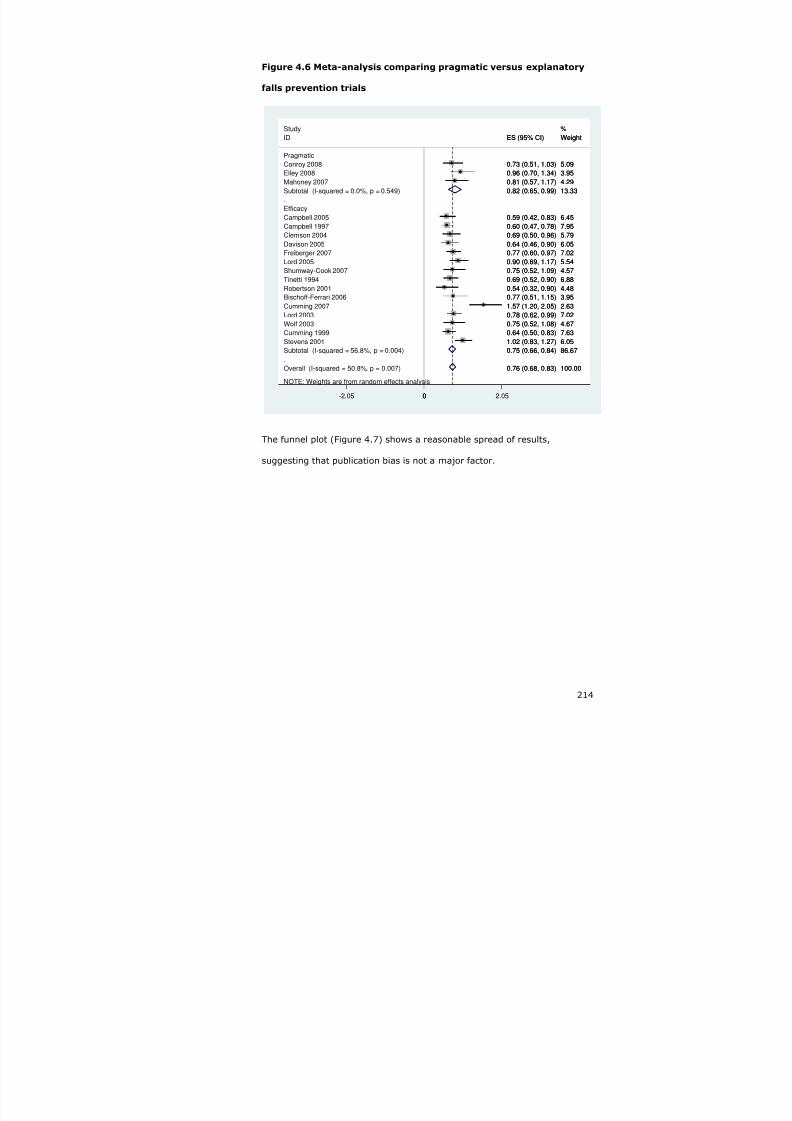
7/22/2019 Preventing Falls in Older People 2008
http://slidepdf.com/reader/full/preventing-falls-in-older-people-2008 214/240
214
Figure 4.6 Meta-analysis comparing pragmatic versus explanatory
falls prevention trials
NOTE: Weights are from random effects analysis
.
.
Overall (I-squared = 50.8%, p = 0.007)
Elley 2008
Davison 2005
Stevens 2001
Subtotal (I-squared = 0.0%, p = 0.549)
Lord 2003
Conroy 2008
Study
Lord 2005
Wolf 2003
Bischoff-Ferrari 2006
Efficacy
Robertson 2001
Campbell 1997
Cumming 1999
Clemson 2004
Shumway-Cook 2007
Subtotal (I-squared = 56.8%, p = 0.004)
Campbell 2005
Mahoney 2007
Tinetti 1994
ID
Cumming 2007
Pragmatic
Freiberger 2007
0.76 (0.68, 0.83)
0.96 (0.70, 1.34)
0.64 (0.46, 0.90)
1.02 (0.83, 1.27)
0.82 (0.65, 0.99)
0.78 (0.62, 0.99)
0.73 (0.51, 1.03)
0.90 (0.69, 1.17)
0.75 (0.52, 1.08)
0.77 (0.51, 1.15)
0.54 (0.32, 0.90)
0.60 (0.47, 0.78)
0.64 (0.50, 0.83)
0.69 (0.50, 0.96)
0.75 (0.52, 1.09)
0.75 (0.66, 0.84)
0.59 (0.42, 0.83)
0.81 (0.57, 1.17)
0.69 (0.52, 0.90)
ES (95% CI)
1.57 (1.20, 2.05)
0.77 (0.60, 0.97)
100.00
3.95
6.05
6.05
13.33
7.02
5.09
%
5.54
4.67
3.95
4.48
7.95
7.63
5.79
4.57
86.67
6.45
4.29
6.88
Weight
2.63
7.02
0-2.05 0 2.05
The funnel plot (Figure 4.7) shows a reasonable spread of results,
suggesting that publication bias is not a major factor.

7/22/2019 Preventing Falls in Older People 2008
http://slidepdf.com/reader/full/preventing-falls-in-older-people-2008 215/240
215
Figure 4.7 Funnel plot of all trials examined in the meta-analysis of
falls prevention studies
0
. 0 5
. 1
. 1 5
. 2
. 2 5
s . e . o f r r
-1 -.5 0 .5rr
Funnel plot with pseudo 95% confidence limits
Whilst imperfect in terms of methodology, these findings lend support to
the theory that there is a discrepancy between efficacy trials and their
delivery in clinical practice (trials of effectiveness).

7/22/2019 Preventing Falls in Older People 2008
http://slidepdf.com/reader/full/preventing-falls-in-older-people-2008 216/240
216
4.7 Publications and presentations arising
4.7.1 Publications
Tahir Masud, Carol Coupland, Avril Drummond, John Gladman, Rowan
Harwood, Denise Kendrick, Pradeep Kumar, Rob Morris, Tracey Sach,
Rachael Taylor, Jane Youde, Simon Conroy. Multifactorial day hospital
intervention to reduce falls in high risk older people in primary care: a
multi-centre randomised controlled trial [ISRCTN46584556]. Trials 2006,
7:5.
Simon Conroy, Tahir Masud, Carol Coupland, Avril Drummond, John
Gladman, Rowan Harwood, Denise Kendrick, Pradeep Kumar, Rob Morris,
Tracey Sach, Rachael Taylor, Jane Youde. Early results of a falls screening
tool. J Nutr Health Ageing 2005;9(5):381.
Simon Conroy, Tahir Masud, Carol Coupland, Avril Drummond, John
Gladman, Rowan Harwood, Denise Kendrick, Pradeep Kumar, Rob Morris,
Tracey Sach, Rachael Taylor, Jane Youde. Screening for falls in the
community setting. J Nutr Health Ageing 2005;9(5):381.
4.7.2 Presentations
Nottinghamshire, Derbyshire & Lincolnshire Research Alliance grantholder’s
conference 2006.
Research into Ageing grantholder's conference Birmingham 2005
British Geriatrics Society Falls Conference Manchester 2005
East Midlands Falls Conference 2005 & 2008

7/22/2019 Preventing Falls in Older People 2008
http://slidepdf.com/reader/full/preventing-falls-in-older-people-2008 217/240
217
5 REFERENCES
1. Isaacs B. The giants of geriatrics: the challenge of geriatric medicine.Oxford: Oxford University Press, 1992.
2. Department of Health. National service framework for older people:
Department of Health, London 2001.3. Ensrud KE, Ewing SK, Taylor BC, et al. Frailty and risk of falls, fracture,
and mortality in older women: the study of osteoporotic fractures. Journals of Gerontology Series A-Biological Sciences & MedicalSciences 2007;62(7):744-51.
4. Abellan Van Kan A, Rolland Y, Bergman H, et al. The I.A.N.A Task Forceon frailty assessment of older people in clinical practice. Journal ofNutrition, Health & Aging 2008;12(1):29-37.
5. Scuffham P, Chaplin S, Legood R. Incidence and costs of unintentionalfalls in older people in the United Kingdom. Journal of Epidemiology& Community Health 2003;57(9):740-4.
6. Gillespie L. Preventing falls in elderly people. BMJ 2004;328(35):653-
654.7. Bazian Ltd. Fall prevention programmes in older people. Evidence-BasedHealthcare and Public health. London, 2005:343.
8. Chang JT, Morton SC, Rubenstein LZ, et al. Interventions for theprevention of falls in older adults: systematic review and meta-analysis of randomised clinical trials. BMJ 2004;328(7441):680-.
9. Gillespie LD, Gillespie WJ, Robertson MC, et al. Interventions forpreventing falls in elderly people.[see comment][update ofCochrane Database Syst Rev. 2001;(3):CD000340; PMID:11686957]. Cochrane Database of Systematic Reviews 2003(4):CD000340.
10. National Institute of Clinical Excellence. Falls: the assessment andprevention of falls in older people: NICE, 2004.
11. Skelton D, Todd C. What are the main risk factors for falls amongstolder people and what are the most effective interventions toprevent these falls? How should falls interventions to prevent fallsbe implemented? In: Network HE, editor: World HelathOrganization, 2004.
12. Campbell AJ, Robertson MC. Rethinking individual and community fallprevention strategies: a meta-regression comparing single andmultifactorial interventions. Age & Ageing 2007;36(6):656-62.
13. Feder G, Cryer C, Donovan S, et al. Guidelines for the prevention offalls in people over 65. The Guidelines' Development Group.[seecomment]. BMJ 2000;321(7267):1007-11.
14. Tinetti ME, Speechley M, Ginter SF. Risk factors for falls among elderly
persons living in the community. New England Journal of Medicine 1988;319(26):1701-7.
15. Blake A, Morgan K, Bendall M, et al. Falls by elderly people at home:prevalence and associated factors. Age Ageing 1988;17(122):365-372.
16. O'Loughlin JL, Robitaille Y, Boivin JF, et al. Incidence of and risk factorsfor falls and injurious falls among the community-dwelling elderly.
American Journal of Epidemiology 1993;137(3):342-54.17. Clough-Gorr KM, Erpen T, Gillmann G, et al. Multidimensional Geriatric
Assessment: Back to the Future Preclinical Disability as a RiskFactor for Falls in Community-Dwelling Older Adults. J Gerontol A
Biol Sci Med Sci 2008;63(3):314-320.

7/22/2019 Preventing Falls in Older People 2008
http://slidepdf.com/reader/full/preventing-falls-in-older-people-2008 218/240
218
18. Sayer AA, Syddall HE, Martin HJ, et al. Falls, Sarcopenia, and Growth inEarly Life: Findings from the Hertfordshire Cohort Study. Am. J.Epidemiol. 2006;164(7):665-671.
19. Tiedemann A, Shimada H, Sherrington C, et al. The comparative abilityof eight functional mobility tests for predicting falls in community-dwelling older people. Age Ageing 2008;37(4):430-435.
20. Chan BKS, Marshall LM, Winters KM, et al. Incident Fall Risk andPhysical Activity and Physical Performance among Older Men: TheOsteoporotic Fractures in Men Study. Am. J. Epidemiol. 2007;165(6):696-703.
21. Ganz DA, Bao Y, Shekelle PG, et al. Will my patient fall? JAMA 2007;297(1):77-86.
22. Li W, Keegan THM, Sternfeld B, et al. Outdoor Falls Among Middle-Agedand Older Adults: A Neglected Public Health Problem. Am J Public
Health 2006;96(7):1192-1200.23. Craig R, Mindell J. Chronic diseases: the health of older people. Health
Survey for England 2005 : The Information Centre, 2007.24. Wijlhuizen GJ, du Bois P, van Dommelen P, et al. Effect evaluation of a
multifactor community intervention to reduce falls among olderpersons. International Journal of Injury Control & Safety Promotion 2007;14(1):25-33.
25. Snijder MB, van Schoor NM, Pluijm SMF, et al. Vitamin D Status inRelation to One-Year Risk of Recurrent Falling in Older Men andWomen. J Clin Endocrinol Metab 2006;91(8):2980-2985.
26. Cummings SR, Nevitt MC, Kidd S. Forgetting falls. The limited accuracyof recall of falls in the elderly. Journal of the American GeriatricsSociety 1988;36(7):613-6.
27. Van Bemmel T, Vandenbroucke JP, Westendorp RGJ, et al. In anobservational study elderly patients had an increased risk of fallingdue to home hazards.
28. Shumway-Cook A, Silver IF, LeMier M, et al. Effectiveness of aCommunity-Based Multifactorial Intervention on Falls and Fall RiskFactors in Community-Living Older Adults: A Randomized,Controlled Trial. J Gerontol A Biol Sci Med Sci 2007;62(12):1420-1427.
29. Campbell AJ, Robertson MC, La Grow SJ, et al. Randomised controlledtrial of prevention of falls in people aged > or =75 with severevisual impairment: the VIP trial. BMJ 2005;331(7520):817.
30. Tinetti M, Williams C. The effect of falls and fall injuries on functioningin community-dwelling older persons. J Gerontol A Biol Sci Med Sci 1998(53A):M112-M119.
31. Robertson MC, Devlin N, Gardner MM, et al. Effectiveness andeconomic evaluation of a nurse delivered home exercise programmeto prevent falls. 1: Randomised controlled trial. BMJ 2001;322(96):697-.
32. Robertson MC ea. Effectiveness and economic evaluation of a nursedelivered home exercise programme to prevent falls. Controlled trialin multiple centres. BMJ 2001(322):701.
33. Clemson L, Cumming RG, Kendig H, et al. The Effectiveness of aCommunity-Based Program for Reducing the Incidence of Falls inthe Elderly: A Randomized Trial. J Am Geriatr Soc 2004;52(47):1487-1494.
34. Prudham D, Evans J. Factors associated with falls in the elderly: acommunity study. Age Ageing 1981(10):141-6.
35. Weatherall M. Multifactorial risk assessment and management
programmes effectively prevent falls in the elderly. Evidence-BasedHealthcare and Public health 2004;8(5):270-272.

7/22/2019 Preventing Falls in Older People 2008
http://slidepdf.com/reader/full/preventing-falls-in-older-people-2008 219/240
219
36. Close JCT et al. Prevention of falls in the elderly trial (PROFET): arandomised controlled trial. Lancet 1999(353):93-7.
37. Gribbin J, Lewis S, Hubbard R, et al. The burden of falls amongst olderpeople in primary care in the United Kingdom. In press.
38. Stone KL, Ewing SK, Lui L-Y, et al. Self-reported sleep and nap habitsand risk of falls and fractures in older women: the study of
osteoporotic fractures. Journal of the American Geriatrics Society 2006;54(8):1177-83.
39. Volpato S, Leveille SG, Blaum C, et al. Risk Factors for Falls in OlderDisabled Women With Diabetes: The Women's Health and AgingStudy. J Gerontol A Biol Sci Med Sci 2005;60(12):1539-1545.
40. Kallin K, Gustafson Y, Sandman P-O, et al. Factors Associated WithFalls Among Older, Cognitively Impaired People in Geriatric CareSettings: A Population-Based Study. Am. J. Geriatr. Psychiatry 2005;13(6):501-509.
41. Izumi K, Makimoto K, Kato M, et al. Prospective study of fall riskassessment among institutionalized elderly in Japan. Nurs Health
Sci 2002;4(4):141-7.
42. Bouwen A, De Lepeleire J, Buntinx F. Rate of accidental falls ininstitutionalised older people with and without cognitive impairmenthalved as a result of a staff-oriented intervention. Age & Ageing 2008;37(3):306-10.
43. Rosendahl E, Gustafson Y, Nordin E, et al. A randomized controlled trialof fall prevention by a high-intensity functional exercise program forolder people living in residential care facilities. Aging-Clinical &
Experimental Research 2008;20(1):67-75.44. Ray WA, Taylor JA, Brown AK, et al. Prevention of fall-related injuries
in long-term care: a randomized controlled trial of staff education. Archives of Internal Medicine 2005;165(19):2293-8.
45. Sakamoto K, Nakamura T, Hagino H, et al. Effects of unipedal standing
balance exercise on the prevention of falls and hip fracture amongclinically defined high-risk elderly individuals: a randomizedcontrolled trial. Journal of Orthopaedic Science 2006;11(5):467-72.
46. Kerse N, Butler M, Robinson E, et al. Fall prevention in residential care:a cluster, randomized, controlled trial. Journal of the American
Geriatrics Society 2004;52(4):524-31.47. Jensen J, Nyberg L, Gustafson Y, et al. Fall and injury prevention in
residential care--effects in residents with higher and lower levels ofcognition. Journal of the American Geriatrics Society 2003;51(5):627-35.
48. Nowalk MP, Prendergast JM, Bayles CM, et al. A randomized trial ofexercise programs among older individuals living in two long-termcare facilities: the FallsFREE program. Journal of the American
Geriatrics Society 2001;49(7):859-65.49. Thapa PB, Gideon P, Brockman KG, et al. Clinical and biomechanical
measures of balance as fall predictors in ambulatory nursing homeresidents. Journals of Gerontology Series A-Biological Sciences &Medical Sciences 1996;51(5):M239-46.
50. Lamoreux EL, Chong E, Wang JJ, et al. Visual Impairment, Causes ofVision Loss, and Falls: The Singapore Malay Eye Study. Invest.
Ophthalmol. Vis. Sci. 2008;49(2):528-533.51. Assantachai P, Praditsuwan R, Chatthanawaree W, et al. Risk factors
for falls in the Thai elderly in an urban community. Journal of theMedical Association of Thailand 2003;86(2):124-30.
52. Johnson SJ. Frequency and Nature of Falls among Older Women in
India. Asia Pac J Public Health 2006;18(1):56-61.

7/22/2019 Preventing Falls in Older People 2008
http://slidepdf.com/reader/full/preventing-falls-in-older-people-2008 220/240
220
53. Halil M, Ulger Z, Cankurtaran M, et al. Falls and the elderly: Is thereany difference in the developing world?: A cross-sectional studyfrom Turkey. Archives of Gerontology and Geriatrics 2006;43(3):351-359.
54. Faulkner KA, Cauley JA, Zmuda JM, et al. Ethnic differences in thefrequency and circumstances of falling in older community-dwelling
women. Journal of the American Geriatrics Society 53(10)(pp 1774-1779), 2005 Date of Publication: Oct 2005 .
55. Tinetti ME, Baker DI, King M, et al. Effect of Dissemination of Evidencein Reducing Injuries from Falls. N Engl J Med 2008;359(3):252-261.
56. Birks YF, Porthouse J, Addie C, et al. Randomized controlled trial of hipprotectors among women living in the community. OsteoporosisInternational 2004;15(9):701-6.
57. Assantachai P, Chatthanawaree W, Thamlikitkul V, et al. Strategy toprevent falls in the Thai elderly: a controlled study integrated healthresearch program for the Thai elderly. Journal of the Medical
Association of Thailand 2002;85(2):215-22.58. Steinberg M, Cartwright C, Peel N, et al. A sustainable programme to
prevent falls and near falls in community dwelling older people:results of a randomised trial. Journal of Epidemiology & CommunityHealth 2000;54(3):227-32.
59. Izumi K, Makimoto K, Kato M, et al. Prospective study of fall riskassessment among institutionalized elderly in Japan.
60. Hill KD, Moore KJ, Dorevitch MI, et al. Effectiveness of falls clinics: anevaluation of outcomes and client adherence to recommendedinterventions. Journal of the American Geriatrics Society 2008;56(4):600-8.
61. Nyberg L, Gustafson Y, Janson A, et al. Incidence of falls in threedifferent types of geriatric care. A Swedish prospective study.Scandinavian Journal of Social Medicine 1997;25(1):8-13.
62. Sjosten NM, Salonoja M, Piirtola M, et al. A multifactorial fall preventionprogramme in home-dwelling elderly people: a randomized-controlled trial. Public Health 2007;121(4):308-18.
63. Tinetti ME, Richman D, Powell L. Falls efficacy as a measure of fear offalling. Journal of Gerontology 1990;45(6):P239-43.
64. Bandura A. Self-efficacy: toward a unifying theory of behavioralchange.[see comment]. Psychological Review 1977;84(2):191-215.
65. Murphy SL, Dubin JA, Gill TM. The development of fear of falling amongcommunity-living older women: predisposing factors andsubsequent fall events. Journals of Gerontology Series A-BiologicalSciences & Medical Sciences 2003;58(10):M943-7.
66. Klein BEK, Moss SE, Klein R, et al. Associations of visual function withphysical outcomes and limitations 5 years later in an olderpopulation: the Beaver Dam eye study. Ophthalmology 2003;110(4):644-50.
67. Whitehead C, Miller M, Crotty M. Falls in community-dwelling olderpersons followinig hip fracture: impact on self-efficacy, balance andhandicap. Clinical Rehabilitation 2003;17(8):899-906.
68. Hatch J, Gill-Body KM, Portney LG. Determinants of balance confidencein community-dwelling elderly people. Physical Therapy 2003;83(12):1072-9.
69. Hellstrom K, Lindmark B, Wahlberg B, et al. Self-efficacy in relation toimpairments and activities of daily living disability in elderly patientswith stroke: a prospective investigation. Journal of RehabilitationMedicine 2003;35(5):202-7.
70. Li F, Fisher KJ, Harmer P, et al. Fear of falling in elderly persons:association with falls, functional ability, and quality of life. Journals

7/22/2019 Preventing Falls in Older People 2008
http://slidepdf.com/reader/full/preventing-falls-in-older-people-2008 221/240
221
of Gerontology Series B-Psychological Sciences & Social Sciences 2003;58(5):P283-90.
71. Kim H, Hu X, Yoshida H, et al. [Functional status of community-dwelling frail elderly in the Japanese long-term care insurancesystem]. Nippon Koshu Eisei Zasshi - Japanese Journal of PublicHealth 2003;50(5):446-55.
72. Becker C, Gebhard F, Fleischer S, et al. [Prediction of mortality,mobility and admission to long-term care after hip fractures].Unfallchirurg 2003;106(1):32-8.
73. Muche R, Eichner B, Gebhard F, et al. Risk factors and modelling therisk of mortality and socio-functional limitations for elderly peoplewith hip fractures. [German]. European Journal of Geriatrics 5(4)(pp187-194), 2003 Date of Publication: 2003.
74. Becker C, Gebhard F, Fleischer S, et al. Prediction of mortality, mobilityand admission to long-term care after hip fractures. [German].Unfallchirurg 106(1)(pp 32-38), 2003 Date of Publication: 01 Jan2003.
75. Scheffer AC, Schuurmans MJ, van Dijk N, et al. Fear of falling:
measurement strategy, prevalence, risk factors and consequencesamong older persons. Age & Ageing 2008;37(1):19-24.
76. Brouwer BJ, Walker C, Rydahl SJ, et al. Reducing fear of falling inseniors through education and activity programs: a randomizedtrial. Journal of the American Geriatrics Society 2003;51(6):829-34.
77. Barnett A, Smith B, Lord SR, et al. Community-based group exerciseimproves balance and reduces falls in at-risk older people: arandomised controlled trial. Age & Ageing 2003;32(4):407-14.
78. Wolf SL, Sattin RW, Kutner M, et al. Intense tai chi exercise trainingand fall occurrences in older, transitionally frail adults: arandomized, controlled trial. Journal of the American GeriatricsSociety 2003;51(12):1693-701.
79. Turcu A, Toubin S, Mourey F, et al. Falls and depression in olderpeople. Gerontology 2004;50(5):303-8.80. Jorgensen L, Engstad T, Jacobsen BK. Higher incidence of falls in long-
term stroke survivors than in population controls: depressivesymptoms predict falls after stroke. Stroke 2002;33(2):542-7.
81. Bergland A, Jarnlo G-B, Laake K. Predictors of falls in the elderly bylocation. Aging-Clinical & Experimental Research 2003;15(1):43-50.
82. Gostynski M, Ajdacic-Gross V, Gutzwiller F, et al. Epidemiologicalanalysis of falls among the elderly in Zurich and Geneva. [German].Schweizerische Medizinische Wochenschrift 129(7)(pp 270-275),1999 Date of Publication: 20 Feb 1999.
83. Kose N, Cuvalci S, Ekici G, et al. The risk factors of fall and theircorrelation with balance, depression, cognitive impairment andmobility skills in elderly nursing home residents. Saudi Medical
Journal 26(6)(pp 978-981), 2005 Date of Publication: Jun 2005 .84. Lawlor DA, Patel R, Ebrahim S. Association between falls in elderly
women and chronic diseases and drug use: Cross sectional study.British Medical Journal 327(7417)(pp 712-715), 2003 Date ofPublication: 27 Sep 2003.
85. Scaf-Klomp W, Sanderman R, Ormel J, et al. Depression in older peopleafter fall-related injuries: A prospective study. Age and Ageing32(1)(pp 88-94), 2003 Date of Publication: Jan 2003.
86. Biderman A, Cwikel J, Fried AV, et al. Depression and falls amongcommunity dwelling elderly people: A search for common riskfactors. Journal of Epidemiology and Community Health 56(8)(pp
631-636), 2002 Date of Publication: 2002.

7/22/2019 Preventing Falls in Older People 2008
http://slidepdf.com/reader/full/preventing-falls-in-older-people-2008 222/240
222
87. Whooley MA, Kip KE, Cauley JA, et al. Depression, falls, and risk offracture in older women. Study of Osteoporotic Fractures ResearchGroup. Archives of Internal Medicine 1999;159(5):484-90.
88. Stel VS, Smit JH, Pluijm SMF, et al. Consequences of falling in oldermen and women and risk factors for health service use andfunctional decline. Age & Ageing 2004;33(1):58-65.
89. van Haastregt JCM, Zijlstra GAR, van Rossum E, et al. Feelings ofanxiety and symptoms of depression in community-living olderpersons who avoid activity for fear of falling. American Journal ofGeriatric Psychiatry 2008;16(3):186-93.
90. Chou KL, Yeung FKC, Wong ECH. Fear of falling and depressivesymptoms in Chinese elderly living in nursing homes: fall efficacyand activity level as mediator or moderator? Aging & Mental Health 2005;9(3):255-61.
91. Deshpande N, Metter EJ, Bandinelli S, et al. Psychological, physical,and sensory correlates of fear of falling and consequent activityrestriction in the elderly: the InCHIANTI study. American Journal of
Physical Medicine & Rehabilitation 2008;87(5):354-62.
92. Shin KR, Shin SJ, Kim JS, et al. [The effects of fall prevention programon knowledge, self-efficacy, and preventive activity related to fall,and depression of low-income elderly women]. Daehan GanhoHaghoeji 2005;35(1):104-12.
93. Means KM, O'Sullivan PS, Rodell DE. Psychosocial effects of an exerciseprogram in older persons who fall. Journal of RehabilitationResearch & Development 2003;40(1):49-58.
94. Vaapio S, Salminen M, Vahlberg T, et al. Effects of risk-basedmultifactorial fall prevention on health-related quality of life amongthe community-dwelling aged: A randomized controlled trial. Healthand Quality of Life Outcomes 5, 2007 Article Number: 20 Date ofPublication: 26 Apr 2007 .
95. Kerse N, Falloon K, Moyes SA, et al. DeLLITE Depression in late life: Anintervention trial of exercise. Design and recruitment of arandomised controlled trial. BMC Geriatrics 8, 2008 Article Number:12 Date of Publication: 2008.
96. Sjosten N, Vaapio S, Kivela SL. The effects of fall prevention trials ondepressive symptoms and fear of falling among the aged: asystematic review. Aging & Mental Health 2008;12(1):30-46.
97. Sjosten NM, Vahlberg TJ, Kivela SL. The effects of multifactorial fallprevention on depressive symptoms among the aged at increasedrisk of falling. International Journal of Geriatric Psychiatry 23(5)(pp504-510), 2008 Date of Publication: May 2008.
98. Leipzig R, Cumming R, Tinetti M. Drugs and falls in older people: asystematic review and meta-analysis: II. Cardiac and analgesicdrugs. J Am Geriatr Soc 1999;47(1):40-50.
99. Thapa PB, Gideon P, Cost TW, et al. Antidepressants and the risk offalls among nursing home residents.[see comment]. New England
Journal of Medicine 1998;339(13):875-82.100. Weiner DK, Hanlon JT, Studenski SA. Effects of central nervous
system polypharmacy on falls liability in community-dwellingelderly. Gerontology 44(4)(pp 217-221), 1998 Date of Publication:
1998.101. Richards JB, Papaioannou A, Adachi JD, et al. Effect of selective
serotonin reuptake inhibitors on the risk of fracture. Archives ofInternal Medicine 2007;167(2):188-94.
102. Arfken CL, Lach HW, Birge SJ, et al. The prevalence and correlates of
fear of falling in elderly persons living in the community. American Journal of Public Health 1994;84(4):565-70.
7/22/2019 Preventing Falls in Older People 2008
http://slidepdf.com/reader/full/preventing-falls-in-older-people-2008 223/240
223
103. Ensrud KE, Blackwell T, Mangione CM, et al. Central nervous systemactive medications and risk for fractures in older women. Archives ofInternal Medicine 163(8)(pp 949-957), 2003 Date of Publication: 28
May 2003.104. Kallin K, Gustafson Y, Sandman PO, et al. Drugs and falls in older
people in geriatric care settings. Aging - Clinical and Experimental
Research 16(4)(pp 270-276), 2004 Date of Publication: Aug 2004.105. Liu B. Relationship between antidepressants and the risk of falls.
Geriatrics and Aging 6(7)(pp 45-47), 2003 Date of Publication: Jul2003.
106. Joo JH, Lenze EJ, Mulsant BH, et al. Risk factor for falls duringtreatment of late-life depression. Journal of Clinical Psychiatry63(10)(pp 936-941), 2002 Date of Publication: 01 Oct 2002.
107. Nevitt MC CS, Kidd S et al,. Risk factors for recurrent nonsyncopalfalls. A prospective study. JAMA 1989(261):2663-2668.
108. Baker S, Harvey A. Fall injuries in the elderly. Clin Geriatr Med 1985(1):502-12.
109. Kannus P, Sievanen H, Palvanen M, et al. Prevention of falls and
consequent injuries in elderly people. The Lancet ;366(9500):1885.110. Ghodsi S, Roudsari B, Abdollahi M, et al. Fall-related injuries in the
elderly in Tehran. Injury, Int. J. Care Injured 2003(34 ):809-814.111. Sattin RW. Falls among older persons: a public health perspective.
Annu Rev Public Health 1992(13):489-508.112. Health Education Authority. Older people - older people and accidents.
In: HEA, editor. fact sheet 2. London, 1999.113. Lilley JM, Arie T, Chilvers CED. Accidents involving Older People: A
Review of the Literature. Age Ageing 1995;24(4):346-365.114. Kannus P, Parkkari J, Koskinen S, et al. Fall-induced injuries and
deaths among older adults. JAMA 1999;281:1899-1985.115. Kannus P, Parkkari J, Niemi S, et al. Fall-Induced Deaths Among
Elderly People. Am J Public Health 2005;95(3):422-424.116. Anonomyous. First Interim Technical Implementation Report:European Network for Safety among Elderly (EUNESE) 2005.
117. Stevens JA, Dellinger AM. Motor vehicle and fall related deaths amongolder Americans 1990-98: sex, race, and ethnic disparities. Injury
Prevention 2002;8(4):272-5.118. Murphy SL. Deaths: final data for 1998. Natl Vital Stat Rep 2000
48(11):1-105.119. Cripps R, Jarman J. Falls by the Elderly in Australia: Trends and Data
for 1998. Canberra: Australian Institute of Health and Welfare,2001.
120. Luukinen H, Koski K, Jokelainen J. Temporal changes in the frequencyof falling accidents among the elderly during the 1990s: Apopulation-based study. Public Health 2006;120(5):418-420.
121. Haines TP, Bennell KL, Osborne RH, et al. Effectiveness of targetedfalls prevention programme in subacute hospital setting:randomised controlled trial.[see comment]. BMJ 2004;328(7441):676.
122. Vassallo M, Sharma JC, Briggs RSJ, et al. Characteristics of earlyfallers on elderly patient rehabilitation wards. Age Ageing 2003;32(3):338-342.
123. Morse K. Preventing inpatient falls. London: Sage Publications, 1996.124. Rizzo JA, Friedkin R, Williams CS, et al. Health care utilization and
costs in a Medicare population by fall status. Medical Care 1998;36(8):1174-88.
125. The NHS Information Centre. Healthcare Resource Group search. In:Health Do, editor. Hospital Episode Statistics, 2008.

7/22/2019 Preventing Falls in Older People 2008
http://slidepdf.com/reader/full/preventing-falls-in-older-people-2008 224/240
224
126. Kuzuya M, Masuda Y, Hirakawa Y, et al. Falls of the elderly areassociated with burden of caregivers in the community.International Journal of Geriatric Psychiatry 2006;21(8):740-5.
127. Schrag A, Hovris A, Morley D, et al. Caregiver-burden in Parkinson'sdisease is closely associated with psychiatric symptoms, falls, anddisability. Parkinsonism & Related Disorders 2006;12(1):35-41.
128. Davey C, Wiles R, Ashburn A, et al. Falling in Parkinson's disease: theimpact on informal caregivers. Disability & Rehabilitation 2004;26(23):1360-6.
129. Kiel DP, O'Sullivan P, Teno JM, et al. Health care utilization andfunctional status in the aged following a fall. Medical Care 1991;29(3):221-8.
130. Seematter-Bagnoud L, Wietlisbach V, Yersin B, et al. Healthcareutilization of elderly persons hospitalized after a noninjurious fall ina Swiss academic medical center. Journal of the American GeriatricsSociety 2006;54(6):891-7.
131. Donald IP, Bulpitt CJ. The prognosis of falls in elderly people living athome. Age & Ageing 1999;28(2):121-5.
132. Tinetti ME, Williams CS. Falls, Injuries Due to Falls, and the Risk ofAdmission to a Nursing Home. N Engl J Med 1997;337(18):1279-1284.
133. Anpalahan M, Gibson S. Geriatric syndromes as predictors of adverseoutcomes of hospitalization. Internal Medicine Journal 2008;38(1):16-23.
134. Saari P, Heikkinen E, Sakari-Rantala R, et al. Fall-related injuriesamong initially 75- and 80-year old people during a 10-year follow-up. Archives of Gerontology and Geriatrics 2007;45(2):207-215.
135. Nurmia I, Lüthje P, Kataja J. Long-term survival after falls among theelderly in institutional care. Arch. Gerontol. Geriatr 2004(38 ):1-10.
136. Simpson AHRW, Lamb S, Roberts PJ, et al. Does the type of flooring
affect the risk of hip fracture? Age Ageing 2004;33(3):242-246.137. Meta-analysis in context. In: Egger M, Davey Smith G, Altman DG,editors. Reviews in Health Care. London: British Medical JournalBooks, 2001.
138. Pajala S, Era P, Koskenvuo M, et al. Genetic factors and susceptibilityto falls in older women. Journal of the American Geriatrics Society54(4)(pp 613-618), 2006 Date of Publication: Apr 2006.
139. Dukas LC, Schacht E, Mazor Ze, et al. A new significant andindependent risk factor for falls in elderly men and women: a lowcreatinine clearance of less than 65 ml/min. OsteoporosisInternational 2005;16(3):332-8.
140. Kerse N, Parag V, Feigin VL, et al. Falls after stroke: results from theAuckland Regional Community Stroke (ARCOS) Study, 2002 to2003. Stroke 2008;39(6):1890-3.
141. Lee JE, Stokic DS. Risk factors for falls during inpatient rehabilitation. American Journal of Physical Medicine & Rehabilitation;87(5):341-50; quiz 351.
142. Van Dijk P, Meulenberg O, Van De Sande H, et al. Falls in dementiapatients. Gerontologist 1993(33):200-204.
143. Tinetti M, Doucette J, Claus E, et al. Risk factors for serious injuryduring falls by older persons in the community. J Am Geriatr Soc 1995(43):1214-1221.
144. Shaw FE, Bond J, Richardson DA, et al. Multifactorial interventionafter a fall in older people with cognitive impairment and dementiapresenting to the accident and emergency department: randomised
controlled trial. BMJ 2003;326(66):73-.
7/22/2019 Preventing Falls in Older People 2008
http://slidepdf.com/reader/full/preventing-falls-in-older-people-2008 225/240
225
145. Piirtola M, Era P. Force platform measurements as predictors of fallsamong older people - a review. Gerontology 2006;52(1):1-16.
146. Pluijm S, Smit J, Tromp E, et al. A risk profile for identifyingcommunity-dwelling elderly with a high risk of recurrent falling:results of a 3-year prospective study. Osteoporosis International 2006:1.
147. Delbaere K, Van den Noortgate N, Bourgois J, et al. The PhysicalPerformance Test as a predictor of frequent fallers: a prospectivecommunity-based cohort study. Clinical Rehabilitation 2006;20(1):83-90.
148. Stalenhoef PA, Diederiks JPM, Knottnerus JA, et al. A risk model forthe prediction of recurrent falls in community-dwelling elderly: aprospective cohort study. Journal of Clinical Epidemiology 2002;55(11):1088-94.
149. Clark DO, Callahan CM, Counsell SR. Reliability and validity of asteadiness score. Journal of the American Geriatrics Society 2005;53(9):1582-6.
150. Morris R, Harwood RH, Baker R, et al. A comparison of different
balance tests in the prediction of falls in older women with vertebralfractures: a cohort study. Age & Ageing 2007;36(1):78-83.
151. Lord SR, Menz HB, Sherrington C. Home environment risk factors forfalls in older people and the efficacy of home modifications. Age &
Ageing 2006;35 Suppl 2:ii55-ii59.152. Fletcher PC, Hirdes JP. Risk factors for falling among community-
based seniors using home care services.[see comment]. Journals of
Gerontology Series A-Biological Sciences & Medical Sciences 2002;57(8):M504-10.
153. Otaka Y. Muscle and bone health as a risk factor of fall among theelderly. Sarcopenia and falls in older people. Clinical Calcium 2008;18(6):761-6.
154. Capon A, Di Lallo D, Mastromattei A, et al. Incidence and risk factorsfor accidental falls among general practice elderly patients in Latina,Central Italy. Epidemiologia e Prevenzione 2007;31(4):204-11.
155. Papaioannou A, Parkinson W, Cook R, et al. Prediction of falls using arisk assessment tool in the acute care setting. BMC Medicine 2004;2:1.
156. Fink HA, Kuskowski MA, Orwoll ES, et al. Association betweenParkinson's disease and low bone density and falls in older men: theosteoporotic fractures in men study.[see comment]. Journal of the
American Geriatrics Society 2005;53(9):1559-64.157. Delbaere K, Crombez G, Vanderstraeten G, et al. Fear-related
avoidance of activities, falls and physical frailty. A prospectivecommunity-based cohort study. Age & Ageing 2004;33(4):368-73.
158. Nandy S, Parsons S, Cryer C, et al. Development and preliminaryexamination of the predictive validity of the Falls Risk AssessmentTool (FRAT) for use in primary care. J Public Health 2004;26(15):138-143.
159. Ensrud KE, Ewing SK, Taylor BC, et al. Comparison of 2 frailty indexesfor prediction of falls, disability, fractures, and death in olderwomen. Archives of Internal Medicine 2008;168(4):382-9.
160. Shaw FE. Falls in cognitive impairment and dementia. Clinics inGeriatric Medicine 2002;18(2):159-73.
161. van Doorn C, Gruber-Baldini AL, Zimmerman S, et al. Dementia as arisk factor for falls and fall injuries among nursing home residents.
Journal of the American Geriatrics Society 2003;51(9):1213-8.

7/22/2019 Preventing Falls in Older People 2008
http://slidepdf.com/reader/full/preventing-falls-in-older-people-2008 226/240
226
162. van Schoor NM, Deville WL, Bouter LM, et al. Acceptance andcompliance with external hip protectors: a systematic review of theliterature. Osteoporosis International 2002;13(12):917-24.
163. Reyes-Ortiz CA, Al Snih S, Loera J, et al. Risk factors for falling inolder Mexican Americans. Ethnicity & Disease 2004;14(3):417-22.
164. Perracini MR, Ramos LR. [Fall-related factors in a cohort of elderly
community residents]. Revista de Saude Publica 2002;36(6):709-16.
165. Shumway-Cook A, Ciol MA, Gruber W, et al. Incidence of and riskfactors for falls following hip fracture in community-dwelling olderadults. Physical Therapy 85(7)(pp 648-655), 2005 Date ofPublication: Jul 2005 .
166. Fosnight SM, Zafirau WJ, Hazelett SE. Vitamin D supplementation toprevent falls in the elderly: evidence and practical considerations.Pharmacotherapy 2008;28(2):225-34.
167. Faulkner KA, Cauley JA, Zmuda JM, et al. Higher 1,25-dihydroxyvitamin D3 concentrations associated with lower fall ratesin older community-dwelling women. Osteoporosis International
2006;17(9):1318-28.168. Bischoff-Ferrari HA, Dawson-Hughes B, Willett WC, et al. Effect of
Vitamin D on Falls: A Meta-analysis. JAMA 2004;291(16):1999-2006.
169. Latham NK, Anderson CS, Reid IR. Effects of vitamin Dsupplementation on strength, physical performance, and falls inolder persons: a systematic review. Journal of the American
Geriatrics Society 2003;51(9):1219-26.170. Orwoll E, Lambert LC, Marshall LM, et al. Endogenous testosterone
levels, physical performance, and fall risk in older men. Archives ofInternal Medicine 2006;166(19):2124-31.
171. Szulc P, Claustrat B, Marchand F, et al. Increased Risk of Falls and
Increased Bone Resorption in Elderly Men with Partial AndrogenDeficiency: The MINOS Study. Journal of Clinical Endocrinology and
Metabolism 88(11)(pp 5240-5247), 2003 Date of Publication: Nov2003.
172. Duh MS, Mody SH, Lefebvre P, et al. Anaemia and the risk of injuriousfalls in a community-dwelling elderly population. Drugs & Aging 2008;25(4):325-34.
173. Penninx BWJH, Pluijm SMF, Lips P, et al. Late-life anemia is associatedwith increased risk of recurrent falls. Journal of the American
Geriatrics Society 53(12)(pp 2106-2111), 2005 Date of Publication:Dec 2005 .
174. Schwartz AV, Hillier TA, Sellmeyer DE, et al. Older women withdiabetes have a higher risk of falls: a prospective study. Diabetes
Care 2002;25(10):1749-54.175. Allain H, Bentue-Ferrer D, Polard E, et al. Postural instability and
consequent falls and hip fractures associated with use of hypnoticsin the elderly: a comparative review. Drugs & Aging 2005;22(9):749-65.
176. Hartikainen S, Lonnroos E, Louhivuori K. Medication as a risk factorfor falls: critical systematic review. Journals of Gerontology Series
A-Biological Sciences & Medical Sciences 2007;62(10):1172-81.177. Landi F, Onder G, Cesari M, et al. Psychotropic medications and risk
for falls among community-dwelling frail older people: anobservational study. Journals of Gerontology Series A-BiologicalSciences & Medical Sciences 2005;60(5):622-6.
7/22/2019 Preventing Falls in Older People 2008
http://slidepdf.com/reader/full/preventing-falls-in-older-people-2008 227/240
227
178. Schwartz AV, Vittinghoff E, Sellmeyer DE, et al. Diabetes-relatedcomplications, glycemic control, and falls in older adults. DiabetesCare 2008;31(3):391-6.
179. Coleman AL, Cummings SR, Yu F, et al. Binocular visual-field lossincreases the risk of future falls in older white women. Journal ofthe American Geriatrics Society 2007;55(3):357-64.
180. Lord SR. Visual risk factors for falls in older people. Age & Ageing 2006;35 Suppl 2:ii42-ii45.
181. Lord SR, Dayhew J, Howland A. Multifocal glasses impair edge-contrast sensitivity and depth perception and increase the risk offalls in older people. Journal of the American Geriatrics Society 2002;50(11):1760-6.
182. Szabo SM, Janssen PA, Khan K, et al. Older women with age-relatedmacular degeneration have a greater risk of falls: a physiologicalprofile assessment study. Journal of the American Geriatrics Society 2008;56(5):800-7.
183. McCarty CA, Fu CL, Taylor HR. Predictors of falls in the Melbournevisual impairment project. Australian & New Zealand Journal of
Public Health 2002;26(2):116-9.184. Oliver D, Britton M, Seed P, et al. Development and evaluation of
evidence based risk assessment tool (STRATIFY) to predict whichelderly inpatients will fall: case-control and cohort studies. BMJ 1997;315(112):1049-1053.
185. Wade D, Collin C. The Barthel ADL index: a standard measure ofphysical disability? Int Dis Studies 1988;10:64-67.
186. Wijnia JW, Ooms ME, van Balen R. Validity of the STRATIFY risk scoreof falls in nursing homes. Preventive Medicine 2006;42(2):154-7.
187. Salameh F, Cassuto N, Oliven A. A simplified fall-risk assessment toolfor patients hospitalized on medical wards. Israel Medical
Association Journal 10(2)(pp 125-129), 2008 Date of Publication:
Feb 2008.188. Vassallo M, Poynter L, Sharma JC, et al. Fall risk-assessment toolscompared with clinical judgment: An evaluation in a rehabilitationward. Age and Ageing 37(3)(pp 277-281), 2008 Date of Publication:2008.
189. Downton JH. Falls in the Elderly . London: Edward Arnold, 1993.190. Oliver D. Assessing the risk of falls in hospitals: time for a
rethink?[comment]. Canadian Journal of Nursing Research 2006;38(2):89-94; discussion 95-6.
191. Cumming RG, Sherrington C, Lord SR, et al. Cluster randomised trialof a targeted multifactorial intervention to prevent falls among olderpeople in hospital. BMJ 2008:bmj.39499.546030.BE.
192. Smith J, Forster A, Young J. Use of the 'STRATIFY' falls riskassessment in patients recovering from acute stroke. Age and
Ageing 2006;35(2):138-143.193. Ashburn A, Hyndman D, Pickering R, et al. Predicting people with
stroke at risk of falls. Age and Ageing 2008;37(3):270-276.194. Mackintosh SF, Hill KD, Dodd KJ, et al. Balance score and a history of
falls in hospital predict recurrent falls in the 6 months followingstroke rehabilitation. Archives of Physical Medicine & Rehabilitation 2006;87(12):1583-9.
195. Hyndman D, Ashburn A. Stops walking when talking as a predictor offalls in people with stroke living in the community.[see comment].
Journal of Neurology, Neurosurgery & Psychiatry 2004;75(7):994-7.196. Beauchet O, Dubost V, Allali G, et al. 'Faster counting while walking'
as a predictor of falls in older adults. Age & Ageing 2007;36(4):418-23.

7/22/2019 Preventing Falls in Older People 2008
http://slidepdf.com/reader/full/preventing-falls-in-older-people-2008 228/240
228
197. Close J, Ellis M, Hooper R, et al. Prevention of falls in the elderly trial(PROFET): a randomised controlled trial.[see comment]. Lancet 1999;353(9147):93-7.
198. Close JCT et al. Predictors of falls in a high risk population - resultsfrom the prevention of falls in the elderly trial (PROFET). Emer Med
J 2003;20(5):421-425.
199. Lundin-Olsson L, Jensen J, Nyberg L, et al. Predicting falls inresidential care by a risk assessment tool, staff judgement, andhistory of falls. Aging Clin Exp Res 2003;15(1):51-9.
200. Chen JS, March LM, Schwarz J, et al. A multivariate regression modelpredicted falls in residents living in intermediate hostel care. Journalof Clinical Epidemiology 58(5)(pp 503-508), 2005 Date ofPublication: May 2005 .
201. Tromp AM, Pluijm SMF, Smit JH, et al. Fall-risk screening test: Aprospective study on predictors for falls in community-dwellingelderly. Journal of Clinical Epidemiology 2001;54(93):837-844.
202. Stalenhoef PA, Diederiks JPM, Knottnerus JA, et al. The constructionof a patient record-based risk model for recurrent falls among
elderly people living in the community. Fam. Pract. 2000;17(6):490-496.
203. Stel VS, Pluijm SM, Deeg DJ, et al. A classification tree for predictingrecurrent falling in community-dwelling older persons. J Am GeriatrSoc 2003;51(10):1356-64.
204. Hale WA, Delaney MJ, Cable T. Accuracy of patient recall and chartdocumentation of falls. Journal of the American Board of Family
Practice 1993;6(3):239-42.205. Hilden J, Glasziou P. Regret graphs, diagnostic uncertainty and
Youden's index. Statistics in Medicine 1996;15:969-986.206. Tinetti ME. Performance-orientated assessment of mobility problems
in elderly patients. J Am Geriatr Soc 1986(34):119-26.
207. Lord S, Sherrington C, Menz H. Falls in older people: risk factors andstrategies for prevention.: Cambridge University Press, 2000.208. Podsiadlo D, Richardson S. The timed up and go: a test of basic
functional mobility for frail elder persons. Journal of the AmericanGeriatrics Society 1991(39):142-148.
209. Nordin E, Lindelof N, Rosendahl E, et al. Prognostic validity of theTimed Up-and-Go test, a modified Get-Up-and-Go test, staff's global
judgement and fall history in evaluating fall risk in residential carefacilities. Age and Ageing 37(4)(pp 442-448), 2008 Date of
Publication: 2008.210. VanSwearingen JM, Paschal KA, Bonino P, et al. Assessing recurrent
fall risk of community-dwelling, frail older veterans using specifictests of mobility and the physical performance test of function.
Journals of Gerontology Series A-Biological Sciences & MedicalSciences 1998;53(6):M457-64.
211. Lajoie Y, Gallagher SP. Predicting falls within the elderly community:comparison of postural sway, reaction time, the Berg balance scaleand the Activities-specific Balance Confidence (ABC) scale forcomparing fallers and non-fallers. Archives of Gerontology &Geriatrics 2004;38(1):11-26.
212. Laessoe U, Hoeck HC, Simonsen O, et al. Fall risk in an active elderlypopulation--can it be assessed? Journal of Negative Results inBiomedicine 2007;6:2.
213. Steel K, Jonsson PV, Dupasquier JN, et al. Systems of care for frailolder persons. InterRAI. Transactions of the American Clinical &
Climatological Association 1999;110:30-5; discussion 35-7.

7/22/2019 Preventing Falls in Older People 2008
http://slidepdf.com/reader/full/preventing-falls-in-older-people-2008 229/240
229
214. Kanis JA, Johnell O, Oden A, et al. FRAX™ and the assessment offracture probability in men and women from the UK. Osteoporos Int 2008(19):385-3972.
215. Lord SR, Menz HB, Tiedemann A. A Physiological Profile Approach toFalls Risk Assessment and Prevention. PHYS THER 2003;83(3):237-252.
216. Gillespie LD RM, Gillespie WJ, Lamb S, Gates S, Cumming RG, RoweBH,. Interventions for preventing falls in older people living in thecommunity: John Wiley & Sons, Ltd, 2008.
217. Moreland J, Richardson J, Chan DH, et al. Evidence-based guidelinesfor the secondary prevention of falls in older adults. Gerontology 2003;49(2):93-116.
218. Yardley L, Todd C. Encouraging positive attitudes to falls prevention inlater life. London: Help the Aged, 2005.
219. Bunn F, Dickinson A, Barnett-Page E, et al. A systematic review ofolder people's perceptions of facilitators and barriers to participationin falls-prevention interventions. Ageing and Society 2008(28):449-472.
220. Woo J, Hong A, Lau E, et al. A randomised controlled trial of Tai Chiand resistance exercise on bone health, muscle strength andbalance in community-living elderly people. Age & Ageing 2007;36(3):262-8.
221. Li F, Harmer P, Fisher KJ, et al. Tai Chi: improving functional balanceand predicting subsequent falls in older persons. Medicine & Sciencein Sports & Exercise 2004;36(12):2046-52.
222. Li F, Harmer P, Fisher KJ, et al. Tai Chi and fall reductions in olderadults: a randomized controlled trial. Journals of Gerontology Series
A-Biological Sciences & Medical Sciences 2005;60(2):187-94.223. Voukelatos A, Cumming RG, Lord SR, et al. A randomized, controlled
trial of tai chi for the prevention of falls: the Central Sydney tai chi
trial. Journal of the American Geriatrics Society 2007;55(8):1185-91.224. Clemson L, Cumming RG, Kendig H, et al. The effectiveness of a
community-based program for reducing the incidence of falls in theelderly: a randomized trial. Journal of the American Geriatrics
Society 2004;52(9):1487-94.225. Weatherall M. Prevention of falls and fall-related fractures in
community-dwelling older adults: a meta-analysis of estimates ofeffectiveness based on recent guidelines. Internal Medicine Journal 2004;34(3):102-8.
226. Gates S, Fisher JD, Cooke MW, et al. Multifactorial assessment andtargeted intervention for preventing falls and injuries among olderpeople in community and emergency care settings: systematicreview and meta-analysis. BMJ 2008;336(7636):130-133.
227. Helms PJ. Real World pragmatic clinical trials: What are they and whatdo they tell us? Pediatric Allergy and Immunology 2002;13:4-9.
228. Alford L. On differences between explanatory and pragmatic clinicaltrials. New Zealand Journal of Physiotherapy 2006;35(1):12-16.
229. Elley C, Robertson M, Garrett S, et al. Effectiveness of a falls-and-fracture nurse coordinator to reduce falls: a randomized, controlledtrial of at-risk older adults. J Am Geriatr Soc 2008;56(8):1383-9.
230. Hendriks M, Bleijlevens M, van Haastregt J, et al. Lack of effectivenessof a multidisciplinary fall-prevention program in elderly people atrisk: a randomized, controlled trial. J Am Geriatr Soc 2008;56(8):1390-7.
231. Lord SR, Castell S, Corcoran J, et al. The effect of group exercise onphysical functioning and falls in frail older people living in retirement

7/22/2019 Preventing Falls in Older People 2008
http://slidepdf.com/reader/full/preventing-falls-in-older-people-2008 230/240
230
villages: a randomized, controlled trial. Journal of the AmericanGeriatrics Society 2003;51(12):1685-92.
232. Suzuki T, Kim H, Yoshida H, et al. Randomized controlled trial ofexercise intervention for the prevention of falls in community-dwelling elderly Japanese women. Journal of Bone & MineralMetabolism 2004;22(6):602-11.
233. Weerdesteyn V, Rijken H, Geurts ACH, et al. A five-week exerciseprogram can reduce falls and improve obstacle avoidance in theelderly. Gerontology 2006;52(3):131-41.
234. Morgan RO, Virnig BA, Duque M, et al. Low-intensity exercise andreduction of the risk for falls among at-risk elders. Journals ofGerontology Series A-Biological Sciences & Medical Sciences 2004;59(10):1062-7.
235. Nikolaus T, Bach M. Preventing falls in community-dwelling frail olderpeople using a home intervention team (HIT): results from therandomized Falls-HIT trial. Journal of the American GeriatricsSociety 2003;51(3):300-5.
236. Latham NK, Anderson CS, Lee A, et al. A randomized, controlled trial
of quadriceps resistance exercise and vitamin D in frail older people:the Frailty Interventions Trial in Elderly Subjects (FITNESS).[seecomment]. Journal of the American Geriatrics Society 2003;51(3):291-9.
237. Shaw FE, Bond J, Richardson DA, et al. Multifactorial interventionafter a fall in older people with cognitive impairment and dementiapresenting to the accident and emergency department: randomisedcontrolled trial.[see comment][erratum appears in BMJ. 2003 Mar29;326(7391):699]. BMJ 2003;326(7380):73.
238. Ashburn A, Fazakarley L, Ballinger C, et al. A randomised controlledtrial of a home based exercise programme to reduce the risk offalling among people with Parkinson's disease.[see comment].
Journal of Neurology, Neurosurgery & Psychiatry 2007;78(7):678-84.239. Campbell AJ, Robertson MC, La Grow SJ, et al. Randomised controlled
trial of prevention of falls in people aged >=75 with severe visualimpairment: the VIP trial. BMJ 2005;331(7520):817-.
240. Harwood RH, Foss AJE, Osborn F, et al. Falls and health status inelderly women following first eye cataract surgery: a randomisedcontrolled trial. British Journal of Ophthalmology 2005;89(1):53-9.
241. Foss AJE, Harwood RH, Osborn F, et al. Falls and health status inelderly women following second eye cataract surgery: a randomisedcontrolled trial. Age & Ageing 2006;35(1):66-71.
242. Cumming RG, Ivers R, Clemson L, et al. Improving vision to preventfalls in frail older people: a randomized trial. Journal of the
American Geriatrics Society 2007;55(2):175-81.243. Steadman J, Donaldson N, Kalra L. A randomized controlled trial of an
enhanced balance training program to improve mobility and reducefalls in elderly patients. Journal of the American Geriatrics Society 2003;51(6):847-52.
244. Ballard JE, McFarland C, Wallace LS, et al. The effect of 15 weeks ofexercise on balance, leg strength, and reduction in falls in 40women aged 65 to 89 years. Journal of the American MedicalWomens Association 2004;59(4):255-61.
245. Helbostad JL, Sletvold O, Moe-Nilssen R. Effects of home exercisesand group training on functional abilities in home-dwelling olderpersons with mobility and balance problems. A randomized study.
Aging-Clinical & Experimental Research 2004;16(2):113-21.

7/22/2019 Preventing Falls in Older People 2008
http://slidepdf.com/reader/full/preventing-falls-in-older-people-2008 231/240
231
246. Lord SR, Tiedemann A, Chapman K, et al. The effect of anindividualized fall prevention program on fall risk and falls in olderpeople: a randomized, controlled trial. Journal of the American
Geriatrics Society 2005;53(8):1296-304.247. Liu-Ambrose T, Khan KM, Eng JJ, et al. Balance confidence improves
with resistance or agility training. Increase is not correlated with
objective changes in fall risk and physical abilities. Gerontology 2004;50(6):373-82.
248. Means KM, Rodell DE, O'Sullivan PS. Balance, mobility, and fallsamong community-dwelling elderly persons: effects of arehabilitation exercise program. American Journal of PhysicalMedicine & Rehabilitation 2005;84(4):238-50.
249. Freiberger E, Menz HB, Abu-Omar K, et al. Preventing falls inphysically active community-dwelling older people: a comparison oftwo intervention techniques. Gerontology 2007;53(5):298-305.
250. Bischoff HA, Stahelin HB, Dick W, et al. Effects of vitamin D andcalcium supplementation on falls: a randomized controlled trial.[seecomment]. Journal of Bone & Mineral Research 2003;18(2):343-51.
251. Dukas L, Bischoff HA, Lindpaintner LS, et al. Alfacalcidol reduces thenumber of fallers in a community-dwelling elderly population with aminimum calcium intake of more than 500 mg daily. Journal of the
American Geriatrics Society 2004;52(2):230-6.252. Barr RJ, Stewart A, Torgerson DJ, et al. Screening elderly women for
risk of future fractures--participation rates and impact on incidenceof falls and fractures. Calcified Tissue International 2005;76(4):243-8.
253. Jackson C, Gaugris S, Sen SS, et al. The effect of cholecalciferol(vitamin D3) on the risk of fall and fracture: a meta-analysis. Qjm 2007;100(4):185-92.
254. Prince R, Austin N, Devine A, et al. Effects of ergocalciferol added to
calcium on the risk of falls in elderly high-risk women. Archives ofInternal Medicine 2008;168(1):103-8.255. Dukas L, Schacht E, Mazor Ze, et al. Treatment with alfacalcidol in
elderly people significantly decreases the high risk of falls associatedwith a low creatinine clearance of <65 ml/min. Osteoporosis
International 2005;16(2):198-203.256. Bischoff-Ferrari HA, Orav EJ, Dawson-Hughes B. Effect of
cholecalciferol plus calcium on falling in ambulatory older men andwomen: a 3-year randomized controlled trial. Archives of Internal
Medicine 2006;166(4):424-30.257. Gallagher JC, Rapuri PB, Smith LM. An age-related decrease in
creatinine clearance is associated with an increase in number of fallsin untreated women but not in women receiving calcitriol treatment.
Journal of Clinical Endocrinology & Metabolism 2007;92(1):51-8.258. Bischoff-Ferrari HA, Dawson-Hughes B, Willett WC, et al. Effect of
Vitamin D on falls: a meta-analysis.[see comment]. JAMA 2004;291(16):1999-2006.
259. Haumschild MJ, Karfonta TL, Haumschild MS, et al. Clinical andeconomic outcomes of a fall-focused pharmaceutical interventionprogram. American Journal of Health-System Pharmacy 2003;60(10):1029-32.
260. Huang T-T, Acton GJ. Effectiveness of home visit falls preventionstrategy for Taiwanese community-dwelling elders: randomizedtrial. Public Health Nursing 2004;21(3):247-56.
261. Zermansky AG, Alldred DP, Petty DR, et al. Clinical medication review
by a pharmacist of elderly people living in care homes--randomisedcontrolled trial.[see comment]. Age & Ageing 2006;35(6):586-91.

7/22/2019 Preventing Falls in Older People 2008
http://slidepdf.com/reader/full/preventing-falls-in-older-people-2008 232/240
232
262. Pit SW, Byles JE, Henry DA, et al. A Quality Use of Medicines programfor general practitioners and older people: a cluster randomisedcontrolled trial. Medical Journal of Australia 2007;187(1):23-30.
263. Weber V, White A, McIlvried R. An electronic medical record (EMR)-based intervention to reduce polypharmacy and falls in anambulatory rural elderly population. Journal of General Internal
Medicine 2008;23(4):399-404.264. McClure R, Turner C, Peel N, et al. Population-based interventions for
the prevention of fall-related injuries in older people. CochraneDatabase of Systematic Reviews 2005(1):CD004441.
265. Poulstrup A, Jeune B. Prevention of fall injuries requiring hospitaltreatment among community-dwelling elderly. European Journal ofPublic Health 2000(10):45-50.
266. Ytterstad B. The Harstad injury prevention study: community basedprevention of fall-fractures in the elderly evaluated by means of ahospital based injury recording system in Norway. Journal ofEpidemiology & Community Health 1996;50(5):551-8.
267. Poulstrup A, Jeune B. Prevention of fall injuries requiring hospital
treatment among community-dwelling elderly. European Journal ofPublic Health 2000(10):45-50.
268. Kempton A, Van Beurden E, Sladden T, et al. Older people can stay ontheir feet: final results of a community-based falls preventionprogramme. Health Promotion International 2000(15):27-33.
269. Svanstrom L, Ader M, Schelp L, et al. Preventing femoral fracturesamong elderly: the community safety approach. Safety Science 1996(21):239-46.
270. Lindqvist K, Timpka T, Schelp L. Evaluation of an inter-organizationalprevention program against injuries among the elderly in a WHOSafe Community. Public Health 2001(115):308-16.
271. Lin MR, Hwang HF, Wang YW, et al. Community-based Tai Chi and its
effect on injurious falls, balance, gait, and fear of falling in olderpeople. Physical Therapy 2006(86):1189-201.272. Day L, Finch C, Segal L. Reducing Injuries from Falls. N Engl J Med
2008;359(15):1626-.273. Wells GA, Cranney A, Peterson J, et al. Alendronate for the primary
and secondary prevention of osteoporotic fractures inpostmenopausal women. Cochrane library : John Wiley & Sons, Ltd,2008.
274. Woolf AD, Akesson K. Preventing fractures in elderly people. BMJ 2003;327(57):89-95.
275. Cumming RG, Thomas M, Szonyi G, et al. Home visits by anoccupational therapist for assessment and modification ofenvironmental hazards: a randomized trial of falls prevention.[seecomment]. Journal of the American Geriatrics Society 1999;47(12):1397-402.
276. Stevens M, Holman CD, Bennett N. Preventing falls in older people:impact of an intervention to reduce environmental hazards in thehome. Journal of the American Geriatrics Society 2001;49(11):1442-7.
277. Robertson MC, Devlin N, Gardner MM, et al. Effectiveness andeconomic evaluation of a nurse delivered home exercise programmeto prevent falls. 1: Randomised controlled trial.[see comment]. BMJ 2001;322(7288):697-701.
278. Forster A, Young J, Langhorne P. Systematic review of day hospitalcare for elderly people. BMJ 1999;318(7187):837-841.
279. Council of Europe. Screening as a Tool of Preventive Medicine (Oct.10, 1994). In: Ministers Co, editor, 1994.

7/22/2019 Preventing Falls in Older People 2008
http://slidepdf.com/reader/full/preventing-falls-in-older-people-2008 233/240
233
280. UK National Screening Committee. Second report of the UK nationalscreening committee, 2005.
281. Last J. A dictionary of epidemiology . Fourth ed. Oxford: OxfordUniversity Press, 2001.
282. West J, Hippisley-Cox J, Coupland CAC, et al. Do rates of hospitaladmission for falls and hip fracture in elderly people vary by socio-
economic status? Public Health 2004;118(8):576.283. Parker MJ, Gillespie WJ, Gillespie LD. Effectiveness of hip protectors
for preventing hip fractures in elderly people: systematic review.BMJ 2006:bmj.38753.375324.7C.
284. Gladman J, Radford K, Walker M. Letter to the editor. ClinicalRehabilitation 2006;20(7):635-636.
285. Wilson J, Jungner G, editors. Principals and practice of screening.Geneva, 1968.
286. Ryynanen OP, Kivela SL, Honkanen R, et al. Incidence of fallinginjuries leading to medical treatment in the elderly. Public Health 1991;105(5):373-86.
287. Scuffham P, Chaplin S, Legood R. Incidence and costs of unintentional
falls in older people in the United Kingdom. J Epidemiol CommunityHealth 2003;57(67):740-744.
288. Gillespie L, Robertson M, Gillespie W, et al. Interventions forpreventing falls in older people living in the community: John Wiley& Sons, Ltd, 2008.
289. Krauss MJ, Evanoff B, Hitcho E, et al. A Case-control Study of Patient,Medication, and Care-related Risk Factors for Inpatient Falls. J Gen
Intern Med 2005;20(2):116-122.290. Hitcho EB, Krauss MJ, Birge S, et al. Characteristics and
Circumstances of Falls in a Hospital Setting. A Prospective Analysis. J Gen Intern Med 2004;19(29):732-739.
291. Graafmans WC, Ooms ME, Hofstee HM, et al. Falls in the elderly: a
prospective study of risk factors and risk profiles. Am J Epidemiol 1996(143):1129-36.292. Koepsell TD, Wolf ME, Buchner DM, et al. Footwear Style and Risk of
Falls in Older Adults. J Am Geriatr Soc 2004;52(25):1495-1501.293. Stalenhoef PA, Crebolder HFJM, Knottnerus JA, et al. Incidence, risk
factors and consequences of falls among elderly subjects living inthe community: A criteria-based analysis. Eur J Public Health 1997;7(3):328-334.
294. Moreland JD, Richardson JA, Goldsmith CH, et al. Muscle Weaknessand Falls in Older Adults: A Systematic Review and Meta-Analysis. J
Am Geriatr Soc 2004;52(16):1121-1129.295. Nevitt M, Cummings S, Kidd S. Risk factors for recurrent nonsyncopal
falls. A prospective study. JAMA 1989(261):2663-2668.296. Tinetti M, Inouye S, Gill T, et al. Shared risk factors for falls,
incontinence, and functional dependence. Unifying the approach togeriatric syndromes. JAMA 1995(273):1348-53.
297. Kerse N, Butler M, Robinson E, et al. Fall Prevention in ResidentialCare: A Cluster, Randomized, Controlled Trial. J Am Geriatr Soc 2004;52(26):524-531.
298. Day L, Fildes B, Gordon I, et al. Randomised factorial trial of fallsprevention among older people living in their own homes. BMJ 2002;325(89):128-.
299. Latham NK, Anderson CS, Lee A, et al. A Randomized, Controlled Trialof Quadriceps Resistance Exercise and Vitamin D in Frail OlderPeople: The Frailty Interventions Trial in Elderly Subjects
(FITNESS). J Am Geriatr Soc 2003;51(73):291-299.

7/22/2019 Preventing Falls in Older People 2008
http://slidepdf.com/reader/full/preventing-falls-in-older-people-2008 234/240
234
300. American Geriatrics Society BGS, and American Academy ofOrthopaedic Surgeons Panel on Falls Prevention. Guideline for thePrevention of Falls in Older Persons. JAGS 2001(49):664-672.
301. Beaglehole R, Bonita R, Kjellstrom T. Basic Epidemiology . 1st ed.Geneva: World Health Organisation, 1993.
302. Altman DG. Practical Statistics for Medical Research. First ed. Boca
Raton London New York Washington DC: CHapman & Hall/CRC,1999.
303. Streiner D, Norman G. Health measurement scales. Third ed. Oxford:Oxford University Press, 2003.
304. Hasson F, Keeney S, McKenna H. Research guidelines for the Delphisurvey technique. Journal of Advanced Nursing 2000;32(4):1008-1015.
305. Leape L, Brook R. Group judgements of appropriateness: the effect ofpanel composition. Quality Assur Health Care 1992:151-159.
306. Coulter I, Shekelle P. Impact of varying panel membership on ratingsof appropriateness in consensus panels: a comparison of a multi-and single disciplinary panel. Health Serv Res 1995:577-91.
307. Delbecq A, Van deVen A. A group process model for problemidentification and program planning. Journal of Applied behaviouralscience 1975;7:466-91.
308. Cronbach LJ. Coefficient alpha and the internal structure of tests.Psychometrika 1951(16):297-334.
309. Streiner D, Norman G. Health Measurement Scales, A Practical Guideto Their Development and Use. 2nd Edn. ed. Oxford: OxfordUniversity Press, 1995.
310. Yesavage J, Brink T, Rose T, et al. Development and validation of ageriatric depression screening scale: a prelimnery report. J Psy Res 1983(17):37-49.
311. Bush TL, Miller SR, Golden AL, et al. Self-report and medical record
report agreement of selected medical conditions in the elderly. American Journal Of Public Health 1989;79(11):1554.312. Midthjell K, Holmen J, Bjorndal A, et al. Is questionnaire information
valid in the study of a chronic disease such as diabetes? The Nord-Trondelag Diabetes Study. J Epidemiol Commun Health 1992;46(5):537.
313. Kriegsman DMW, Penninx BWJH, Van Eijk JTM, et al. Self-reports andgeneral practitioner information on the presence of chronic diseasesin community dwelling elderly : A study on the accuracy of patients'self-reports and on determinants of inaccuracy. Journal of ClinicalEpidemiology 1996;49(12):1407.
314. Tretli S, Lund-Larsen PG, Foss OP. Reliability of questionnaireinformation on cardiovascular disease and diabetes: Cardiovasculardisease study in Finnmark county. J. EPIDEMIOL. COMMUN. HEALTH 1982;36(4):269.
315. Colditz GA, Martin P, Stampfer MJ, et al. Validation of questionnaireinformation on risk factors and disease outcomes in a prospectivecohort study of women. American Journal Of Epidemiology 1986;123(5):894.
316. Wallace C, Reiber GE, LeMaster J, et al. Incidence of falls, risk factorsfor falls, and fall-related fractures in individuals with diabetes and aprior foot ulcer. Diabetes Care 2002;25(11):1983-6.
317. Parry SW, Steen N, Galloway SR, et al. Falls and confidence relatedquality of life outcome measures in an older British cohort.Postgraduate Medical Journal 2001;77(904):103-8.
318. McColl E TR. The use and design of questionnaires. First ed. London:Royal COllege of General Practitioners, 2000.
7/22/2019 Preventing Falls in Older People 2008
http://slidepdf.com/reader/full/preventing-falls-in-older-people-2008 235/240
235
319. Colon-Emeric CS, Pieper CF, Artz MB. Can historical and functionalrisk factors be used to predict fractures in community-dwelling olderadults? development and validation of a clinical tool. Osteoporos Int 2002;13(12):955-61.
320. Sackett DL. Bias in analytic research. J Chron Dis 1979(32):51-63.321. Schwartz N, Strack F, Hippler H, et al. The impact of administration
mode on response effects in survey measurement. Appl CognitPsychol 1991(5):193-212.
322. Siemiatycki J. A comparison of mail, telephone, and home interviewstrategies for household health surveys. Am J Public Health 1979(69):238-45.
323. Foster K. Evaluating Non-response on Household Surveys. In:Statistics OfN, editor. Government Statistical Service MethodologySeries No. 8. London, 1998.
324. Parker C, Dewey M. Assessing research outcomes by postalquestionnaire with telephone follow-up. Int. J. Epidemiol. 2000;29(6):1065-1069.
325. Ory MG, Schechtman KB, Miller JP, et al. Frailty and injuries in later
life: the FICSIT trials. Journal of the American Geriatrics Society 1993;41(3):283-96.
326. Legters K, Verbus NB, Kitchen S, et al. Fear of falling, balanceconfidence and health-related quality of life in individuals withpostpolio syndrome. Physiotherapy Theory & Practice 2006;22(3):127-35.
327. Michalowska M, Fiszer U, Krygowska-Wajs A, et al. Falls in Parkinson'sdisease. Causes and impact on patients' quality of life. FunctionalNeurology 2005;20(4):163-8.
328. Suzuki M, Ohyama N, Yamada K, et al. The relationship between fearof falling, activities of daily living and quality of life among elderlyindividuals. Nursing & Health Sciences 2002;4(4):155-61.
329. Salkeld G, Cumming RG, O'Neill E, et al. The cost effectiveness of ahome hazard reduction program to reduce falls among olderpersons. Australian & New Zealand Journal of Public Health 2000;24(3):265-71.
330. Yardley L, Smith H. A prospective study of the relationship betweenfeared consequences of falling and avoidance of activity incommunity-living older people. The Gerontologist 2002(42):17-23.
331. Ruthig JC, Chipperfield JG, Newall NE, et al. Detrimental Effects ofFalling on Health and Well-being in Later Life: The Mediating Rolesof Perceived Control and Optimism. J Health Psychol 2007;12(2):231-248.
332. Stuck AE, Siu AL, Wieland GD, et al. Comprehensive geriatricassessment: a meta-analysis of controlled trials. The Lancet 1993;342(8878):1032-1036.
333. Stuck AE, Egger M, Hammer A, et al. Home Visits to Prevent NursingHome Admission and Functional Decline in Elderly People:Systematic Review and Meta-regression Analysis. JAMA 2002;287(8):1022-1028.
334. Rubenstein LZ, Stuck AE, Siu AL, et al. Impacts of geriatric evaluationand management programs on defined outcomes: overview of theevidence. Journal of the American Geriatrics Society 1991;39(9 Pt2):8S-16S; discussion 17S-18S.
335. Medical Research Council. A framework for the devleopment andevaluation of randomised control trials for complex interventions toimprove health. London: MRC, 2000.

7/22/2019 Preventing Falls in Older People 2008
http://slidepdf.com/reader/full/preventing-falls-in-older-people-2008 236/240
236
336. Craig P, Dieppe P, Macintyre S, et al. Developing and evaluatingcomplex interventions: the new Medical Research Council guidance.BMJ 2008;337(sep29_1):a1655-.
337. 10 questions to help you make sense of randomised controlled trials.In: Public Health Resource Unit, editor. Critical Appraisal SkillsProgramme (CASP) making sense of evidence. England, 2006.
338. Guyatt G, Sackett D, Cook D. Users' guides to the medical literature.II. How to use an article about therapy or prevention. A. Are theresults of the study valid? JAMA 1993;270(1):2598-2601.
339. Ellenberg JH. Selection bias in observational and experimentalstudies. Stat Med 1994(13):557-67.
340. Sibbald B, Roland M. Understanding controlled trials: Why arerandomised controlled trials important? BMJ 1998;316(7126):201-.
341. Altman DG. Better reporting of randomised controlled trials: theCONSORT statement. BMJ 1996;313(7057):570-571.
342. Roberts C, Torgerson DJ. Understanding controlled trials: Baselineimbalance in randomised controlled trials. BMJ 1999;319(7203):185-.
343. Trowman R, Dumville JC, Torgerson DJ, et al. The impact of trialbaseline imbalances should be considered in systematic reviews: amethodological case study. Journal of Clinical Epidemiology 2007;60(12):1229-1233.
344. Senn SJ. Covariate imbalance and random allocation in clinical trials.Stat Med 1989(8):467-475.
345. The European Agency for the Evaluation of Medicinal Products -Evaluation of Medicines for Human Use. Points to consider onadjustment for basleine covariates. In: Products CfPM, editor.London, 2003.
346. Pocock S, Assmann S, Enos L, et al. Subgroup analysis, covariateadjustment and baseline comparisons in clinical trial reporting:
current practice and problems. Statist. Med 2002;21:2917-2930.347. Hauck W, Anderson S, Marcus S. Should We Adjust for Covariates inNonlinear Regression Analyses of Randomized Trials? Controlled ClinTrials 1998(19):249-256.
348. Hernandez A, Steyerberg E, Dik J, et al. Covariate adjustment inrandomized controlled trials with dichotomous outcomes increasesstatistical power and reduces sample size requirements. Journal ofClinical Epidemiology 2004;57 454-460.
349. Britton A, McKee M, Black N, et al. Choosing between randomised andnon-randomised studies: a systematic review. Health Technol
Assessment 1998;2(13).350. Hrobjartsson A, Gotzsche PC. Is the Placebo Powerless?- An Analysis
of Clinical Trials Comparing Placebo with No Treatment. N Engl J
Med 2001;344(21):1594-1602.351. Kaptchuk TJ, Stason WB, Davis RB, et al. Sham device v inert pill:
randomised controlled trial of two placebo treatments. BMJ 2006;332(7538):391-397.
352. Ernst E, Resch KL. Concept of true and perceived placebo effects. BMJ 1995;311(7004):551-553.
353. Torgerson DJ, Roberts C. Understanding controlled trials:Randomisation methods: concealment. BMJ 1999;319(7206):375-376.
354. Schulz K, Chalmers I, Hayes R, et al. Empirical evidence of bias:dimensions of methodological quality associated with estimates ofeffects in controlled trials. JAMA 1995(273):408-412.
355. Bailey R, Nelson P. Hadamard randomization: a valid restriction ofrandom permuted blocks. Biometrical Journal 2003;45(5):554-560.

7/22/2019 Preventing Falls in Older People 2008
http://slidepdf.com/reader/full/preventing-falls-in-older-people-2008 237/240
237
356. Treasure T, MacRae KD. Minimisation: the platinum standard fortrials? BMJ 1998;317(7155):362-363.
357. Zelen M. A new design for randomized clinical trials. N Engl J Med 1979;300(22):1242-1245.
358. Torgerson DJ, Roland M. Understanding controlled trials: What isZelen's design? BMJ 1998;316(7131):606-.
359. Robinson E, Kerr C, Stevens A, et al. Lay public’s understanding ofequipoise and randomisation in randomised controlled trials. HealthTechnology Assessment 2005;9(8).
360. Sackett D, Haynes R, Guyatt G, et al. Clincial epidemiology: a basic
science for clinical medicine. Second ed. Boston/Toronto/London:Little, Brown and Company, 1991.
361. Simes RJ. Publication bias: the case for an international registry ofclinical trials. J Clin Oncol 1986;4(10):1529-41.
362. Dickersin K. The existence of publication bias and risk factors for itsoccurrence. JAMA 1990;263(10):1385-9.
363. Easterbrook P, Berlin J, Gopalan R, et al. Publication bias in clinicalresearch. Lancet 1991;337(8746):867-72.
364. Sterne J, Gavaghan D, Egger M. Publication and related bias in meta-analysis: power of statistical tests and prevalence in the literature. JClin Epidemiol 2000;53(11):1119-29.
365. Sutton A, Song F, Gilbody S, et al. Modelling publication bias in meta-analysis: a review. Statistical Methods in Medical Research 2000;9(5):421-45.
366. Stern J, Simes R. Publication bias: evidence of delayed publication ina cohort study of clinical research projects. BMJ 1997;315(7109):640-5.
367. Matthews JNS, Altman DG. Statistics Notes: Interaction 2: compareeffect sizes not P values. BMJ 1996;313(7060):808-.
368. MRC. Cluster randomised trials: Methodological and ethical
considerations. In: Council MR, editor. MRC clinical trials series. London: Medical Research Council, 2002.369. Torgerson DJ. Contamination in trials: is cluster randomisation the
answer? BMJ 2001;322(7282):355-357.370. Moher D, Schulz K, Altman D. Revised recommendations for
improving the quality of reports of parallel group randomized trials,in CONSORT Group., 2001:1191-1194.
371. Prince M, Macdonald A, Sham P. The development and initialvalidation of a telephone-administered cognitive test battery(TACT). Int J Methods Psych Res 1999(8):49-57.
372. Heart Protection Study Collaborative Group. MRC/BHF HeartProtection Study of cholesterol lowering with simvastatin in 20 536high-risk individuals: a randomised placebo controlled trial. The
Lancet 2002;360(9326):7.373. Alzheimer's Association. Research Consent for Cognitively Impaired
Adults: Recommendations for Institutional Review Boards andInvestigators. . Alzheimer Disease & Associated Disorders 2004;18(3):171-175.
374. Beauchamp T, Childress J. Principles of Biomedical Ethics. New York:Oxford University Press, 1979:56.
375. Entwistle VA, Carter SM, Trevena L, et al. Communicating aboutscreening. BMJ 2008;337(sep22_1):a1591-.
376. Krska J, Kennedy E, Milne S. Frequency of counselling on prescriptionmedicines in community pharmacy. Int J Pharm Pract 1995;3:178-185.
7/22/2019 Preventing Falls in Older People 2008
http://slidepdf.com/reader/full/preventing-falls-in-older-people-2008 238/240
238
377. King M, Nazareth I, Lampe F, et al. Impact of Participant andPhysician Intervention Preferences on Randomized Trials: ASystematic Review. JAMA 2005;293(9):1089-1099.
378. Whipple RH ea. Relationship of knee and ankle weakness to falls innursing home residents. J Am Geriatr Soc 1987(35):13-20.
379. Koch M. An impairment and disability assessment and treatment
protocol. Physical Therapy 1994(74):286-94.380. Tideiksaar R. Preventing falls; home hazard checklists to help older
patients protect themselves. Geriatrics 1986(41):26-8.381. Wade D.T. Measurement in neurological rehabilitation: Oxford Medical
Publications, 1992.382. Gladman J. Some solutions to randomised controlled trials in
rehabilitation research. Clinical Rehabilitation 1991(5):9-13.383. Cuzick J. Primary endpoints for randomised trials of cancer therapy.
The Lancet ;371(9631):2156-2158.384. Ferrucci L, Guralnik J, Studenski S, et al. Designing Randomized,
Controlled Trials Aimed at Preventing or Delaying Functional Declineand Disability in Frail, Older Persons: A Consensus Report. Journal
of the American Geriatrics Society 2004;52(4):625-634.385. Fleming SA, Blake H, Gladman JRF, et al. A randomised controlled
trial of a care home rehabilitation service to reduce long-terminstitutionalisation for elderly people. Age Ageing 2004;33(4):384-390.
386. Cunliffe AL, Gladman JRF, Husbands SL, et al. Sooner and healthier: arandomised controlled trial and interview study of an earlydischarge rehabilitation service for older people. Age Ageing 2004;33(3):246-252.
387. Parry SW, Steen IN, Baptist M, et al. Amnesia for Loss ofConsciousness in Carotid Sinus Syndrome: Implications forPresentation With Falls. Journal of the American College of
Cardiology 2005;45(11):1840.388. Campbell A, Reinken J, Allan B, et al. Falls in old age: a study offrequency and related clinical factors. Age Ageing 1981;10(4):264-70.
389. Robbins AS, Rubenstein LZ, Josephson KR, et al. Predictors of fallsamong elderly people. Results of two population-based studies.
Archives of Internal Medicine 1989;149(7):1628-33.390. Tinetti M, Williams C. Falls, injuries due to falls, and the risk of
admission to a nursing home. N Engl J Med 1997(337):1279-1284.391. Registered Nurses Association of Ontario. Prevention of fall injuries in
the older adult. Nursing Best Practice Guideline. Toronto, 2002392. Lamb SE, Jorstad-Stein EC, Hauer K, et al. Development of a
Common Outcome Data Set for Fall Injury Prevention Trials: ThePrevention of Falls Network Europe Consensus. Journal of the
American Geriatrics Society 2005;53(9):1618-1622.393. Parry SW, Steen N, Galloway SR, et al. Falls and confidence related
quality of life outcome measures in an older British cohort. PostgradMed J 2001;77(97):103-108.
394. Dolan P. Modelling valuations for EuroQol health states. Med Care 1997;35(11):1095-1108.
395. Tinetti ME, Baker DI, McAvay G, et al. A Multifactorial Intervention toReduce the Risk of Falling among Elderly People Living in theCommunity. N Engl J Med 1994;331(118):821-827.
396. Robertson MC, Campbell AJ, Herbison P. Statistical analysis of efficacyin falls prevention trials. Journals of Gerontology Series A-Biological
Sciences & Medical Sciences 2005;60(4):530-4.

7/22/2019 Preventing Falls in Older People 2008
http://slidepdf.com/reader/full/preventing-falls-in-older-people-2008 239/240
239
397. Department of Health. Research Governance Framework for Healthand Social Care. In: London DoH, editor, 2001.
398. Ittleston W, Proshanky H, Rivlin L. Environmental Pyschology: Man
and his physical setting. New York: Holt, Rhinehart & Winston,1970.
399. Lincoln N, Gamlen R, Thomason H. Behavioural Mapping of patients
on a stroke unit. International disability studies 1989(11):149-154.400. De Weerdt W, Selz B, Nuyens G, et al. Time use of stroke patients in
an intensive rehabilitation unit: a comparison between a Belgianand a Swiss setting. Disability and Rehabiltiation 2000;22(4):181-186.
401. Bernhardt J, Dewey H, Thrift A, et al. Inactive and Alone PhysicalActivity Within the First 14 Days of Acute Stroke Unit Care. . Stroke 2004(35):1005-1009.
402. Tinson DJ. How stroke patients spend their days: An observationalstudy of the treatment regime offered to patients in hospital withmovement disorders following stroke. Int Disabil Studies 1989(11):45-49.
403. Roberts B, Anthony M, Madigan E, et al. Data management: cleaningand checking. Nursing research 1997(46):350-352.
404. Hollis S, Campbell F. What is meant by intention to treat analysis?Survey of published randomised controlled trials. BMJ 1999(319):670-674.
405. Fox-Wasylyshyn SM, El-Masri MM. Handling missing data in self-reportmeasures. Research in Nursing & Health 2005;28(6):488-95.
406. Roland M, Dusheiko M, Gravelle H, et al. Follow up of people aged 65and over with a history of emergency admissions: analysis ofroutine admission data. BMJ 2005;330(7486):289-292.
407. Armitage P, Berry G. Statistical Methods in Medical Research. 3rdEdition ed: Blackwell, 2001.
408. Long MV. Stata Journal 1997(101).409. Long & Freese. Stata Journal 2003(128).410. Creamer R, Drummond A, Standen P, et al. Assessing The Content Of
Therapy In A Falls Prevention Programme Using BehaviouralMapping. J Nutr Health Ageing 2006;10(4):333.
411. Liu-Ambrose T, Donaldson B, Ahamed Y, et al. Otago Home-BasedStrength and Balance Retraining Improves Executive Functioning inOlder Fallers: A Randomized Controlled Trial. Journal of the
American Geriatrics Society 2008;56(10):1821-1830.412. Masud T, Coupland C, Drummond A, et al. Multifactorial day hospital
intervention to reduce falls in high risk older people in primary care:a multi-centre randomised controlled trial [ISRCTN46584556]. Trials 2006;7(1):5.
413. Lawrence T, White C, Wenn R. The current hospital costs of treatinghip fractures. Injury 2005(36):88-91.
414. Sherrington C, Whitney J, Lord S, et al. Effective Exercise for thePrevention of Falls: A Systematic Review and Meta-Analysis. Journalof the American Geriatrics Society 2008;56(12):2234-2243.
415. Layne JE, Sampson SE, Mallio CJ, et al. Successful Dissemination of aCommunity-Based Strength Training Program for Older Adults byPeer and Professional Leaders: The People Exercising Program.
Journal of the American Geriatrics Society 2008;56(12):2323-2329.416. Lamb S, Gates S, Fisher J, et al. Scoping Exercise on Fallers’ Clinics:
National Co-ordinating Centre for NHS Service Delivery andOrganisation R & D (NCCSDO), 2007.

7/22/2019 Preventing Falls in Older People 2008
http://slidepdf.com/reader/full/preventing-falls-in-older-people-2008 240/240
417. Horne M, Speed S, Skelton D, et al. What do community-dwellingCaucasian and South Asian 60-70 year olds think about exercise forfall prevention? Age Ageing 2009;38(1):68-73.
418. Lilford RJ. Equipoise and the ethics of randomisation. J R Soc Med 1995;88:552-559.
419. Efron B, Morris C. Stein's paradox in statistics. Scientific American
1977;236(5):119-127.420. Woods KL. Commentary: Biostatistics, biological mechanisms and
Bayes: lessons from the magnesium trials. Int. J. Epidemiol. 2002;31(1):105-106.