preventable? or not? - virginia tech · crash avoidance systems, ... • cellular download to...
TRANSCRIPT

Preventable? or Not?
WelcomeGoal = Give you some knowledge tools on an emerging science
technologies into the transportation industry.
Tommy Pollard CDS, CDT
This presentation is not meant to promote any particular manufacturer or product.
It is to help educate you on available technologies and help you determine what may be best for your operation.
It includes material from my own experience and is not meant for the promotion of any particular manufacturer or product.
Vehicle Based Safety Systems should not be considered as replacement of management practices. Instead, they should support your safety processes.
Your strategy should include ;Solid hiring practices.Sound driver policies and operational processes.Technologies that support your operational needs.
A well balanced venue of all three, (Hiring, Safety Processes and Technologies),is needed to control and maintain driving risk.
nc
Pollard, Perdue 1
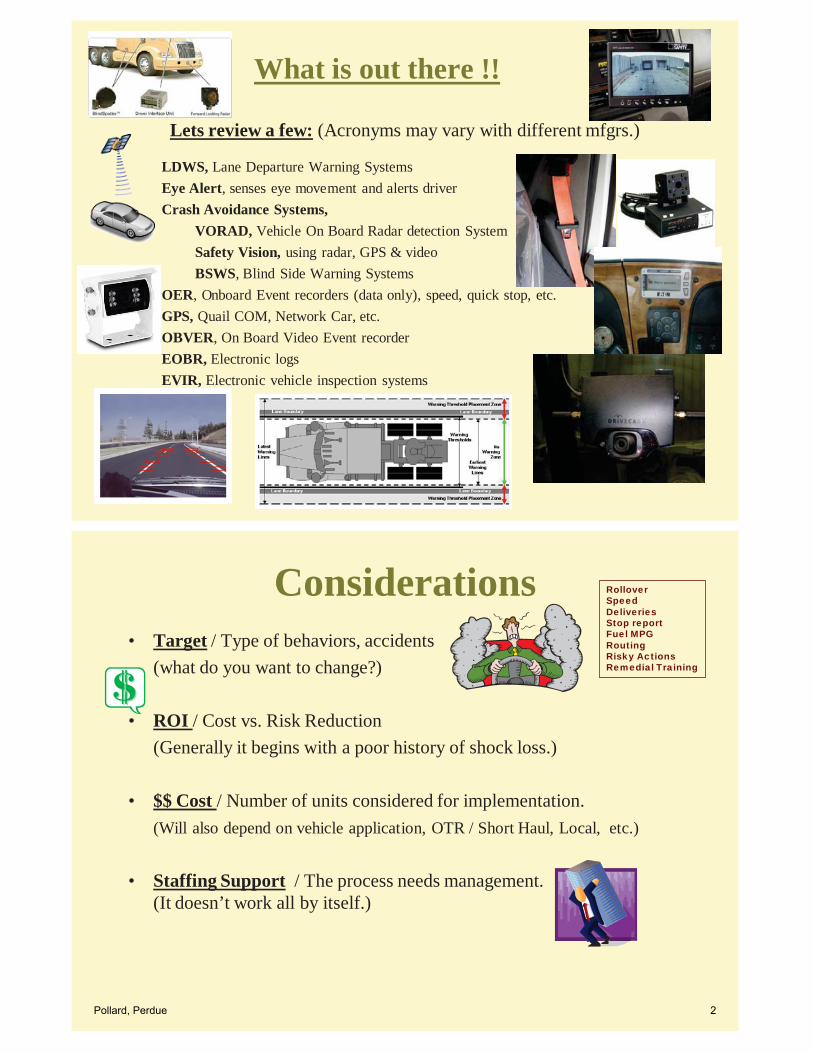
What is out there !!
Lets review a few: (Acronyms may vary with different mfgrs.)
LDWS, Lane Departure Warning SystemsEye Alert, senses eye movement and alerts driverCrash Avoidance Systems,
VORAD, Vehicle On Board Radar detection SystemSafety Vision, using radar, GPS & videoBSWS, Blind Side Warning Systems
OER, Onboard Event recorders (data only), speed, quick stop, etc.GPS, Quail COM, Network Car, etc.OBVER, On Board Video Event recorderEOBR, Electronic logsEVIR, Electronic vehicle inspection systems
Considerations• Target / Type of behaviors, accidents
(what do you want to change?)
• ROI / Cost vs. Risk Reduction (Generally it begins with a poor history of shock loss.)
• $$ Cost / Number of units considered for implementation. (Will also depend on vehicle application, OTR / Short Haul, Local, etc.)
• Staffing Support / The process needs management. (It doesn’t work all by itself.)
RolloverSpeedDeliveriesStop reportFuel MPGRoutingRisky ActionsRemedial Training
Pollard, Perdue 2
Perception can lead to success or work against you.Things that could work against you “If not managed correctly”:
– Driver Perception (management credibility)
– Mishandling of information (confidentiality)
– Risk of having discoverable information (during litigation)
– Due Diligence (having knowledge or should have knowledge of driving behaviors and not taking corrective action)
Things that will work for you:– Driver / Management Bridging, The camera brings facts that clear up any speculation and gets
you coaching to preventability versus debating what happened. The system develops two way accountability for managers and drivers alike. It includes monitoring of assets, camera issues, timeliness of coaching and coaching effectiveness. Consistency of application will promote good behavior, (defensive driving).
– Conscious driving decisions, Drivers become more conscious with the technology and remain more focused on the task of driving. When an event happens, “Active Coaching” is underway.
– Knowledge, No matter the reason for coaching you will be engaging your drivers with education like never before. What you see are “Leading Indicators” and when understood and properly addressed, frequency will be reduced.
– In house Statistics, (provides event notification and escalation and reports for user up to senior management).
– Image Your company is perceived as promoting public safety, “Creating the Visual Standard”).
Driver resistance to technology is inevitable. Management commitment, fairness & consistency of application are the keys.
Involve your legal staff. You can’t hide from discovery. Your safety processes will be more defendable than if you did nothing.
Now that you employ technology, how are you using it? Technology by itself does not change behavior. It requires management involvement.
Technology that works for you!!!Consider these points;
• Very little “IT” footprint (Web based, cellular downloads)
• Real Time “Proactive” intervention,– Instant Driver feedback (Driver checks the camera after an event, “Real Time Coaching” is underway.)
• Real Time Driver Behavior Management– Drivers improve because they know coaching will happen.
• Timely coaching / discipline– With naturalistic Data !
• Minimal intrusion to driver
• Event Reporting– Management Oversight (Top to Bottom Accountability, Dashboard, Escalation )
– Supervisor alerts for monitoring driver behaviors. (Email notifications to management)– Group & Driver reports can identify training opportunities drivers & company.(Behavior Analysis)
– Statistical Data / Trends (Reports using “Leading Indicators”)
• Crash Data– Concise Causation
Pollard, Perdue 3

The Camera “Capture & Event Review Process”
• Camera captures event.– Recognizes erratic motion (fore, aft, lateral & shock)– We cannot view in real time. The camera records only (8) seconds before & (4) seconds after.
• Cellular download to “Drive Cam” for review. • Managed Services (“Drive Cam”)
– Reviews events for notification, (Face to Face Coaching, FYI Notify, Resolve)
• Coach (Manager)– Retrieves & reviews the event with driver
What do the lights mean?
Pollard, Perdue 4

Last Updated: January 25, 2013
Tommy Pollard, CDS, CDT
Truck Mounted Event Recorder Pilot Project Report
ROIImplementation of 37 on-board driver camera systems (Windshield Mounted
Cameras) within the Farms Division (roughly 10%) of the division and has been in place since August 2007.
Our goal was to leverage the Vehicle Mounted Camera Technology and Defensive Driving Strategies (DDC), together in order to reduce risky driving behaviors while
developing a culture of safe driving habits through effective coaching.
Fewer accidents occurred because driving behaviors were addressed. Our frequency was reduced by 60%.
Frequency reduction = (3) years prior average 15.3 incidents / year, (vs.) (3) year post implementation 6.3 incidents / year.
A Return on Investment (ROI) of 406% for (post installation) two fiscal years.
The pilot site had been averaging $420,716 in accident costs for the three prior fiscal years. Since implementation, vehicle accident costs have been reduced to an average of $59,671 per year.
Pollard, Perdue 5

12
17 17
3
9
7$331,449.17
$348,901.00
$581,797.12
$8,286.81
$111,055.00$65,000.00
$0.00
$100,000.00
$200,000.00
$300,000.00
$400,000.00
$500,000.00
$600,000.00
$700,000.00
0
2
4
6
8
10
12
14
16
18
Total Accident Total Cost
Truck Mounted Camera Pilot Project Total Accident & Total Cost Before / After Implementation
Post Implementation
For (37) cameras covering Short Haul Operations, (Feed & Livestock tractor trailer.) Includes all commercial vehicle accidents for periods measured (excluding animal strikes & Off Hwy non-serious incidents)Cost are estimated, based on available maintenance records & Insurance data sources (paid & accrued)Does not include W/C dollars
Project Implementation cost 1st year = $36,000
Subsequent years = $35,320
History
FY09 Largest losses1) V09-112 Feed mill Roll Over = $89,000 (P)2) V09-322 Feed mill = $4500 (P) 3) V09-161 Live Haul = $14,500 (P)4) V09-189 Struck Guardrail (P)5) Two Bulk Feed Boom incidents (P)6) Three (NP) Struck by #2 - Exonerated
Through FY09
FY10 losses1) (6) (NP) incidents2) (1) (P) Roll Over (Fatigue)
Adding Value• In the past;
– We spent over 80% of our energy trying to reach agreement on what happened, and less than 20% on preventing re-occurrence.
– The camera inverts this equation. We now see what happened very quickly and spend most all of our time on preventing re-occurrence.
• Now;– By paralleling the “Truck Camera ” process with Defensive Driving
education, we eliminate the barrier between the Transportation Supervisor and driver.
– Coaching, using defensive driving strategies, now levels the playing field.
– Coaches and drivers now use the common language of DDC. This keeps the manager and driver on equal footing during coaching and discipline and the DDC strategies are developed professionally thus keeping the personal beliefs at bay.
• Managed Services;– Provide a professional analysis of the video clip so we don’t have
to. This means that managers do not have to determine what happened, they just need buy into the process and coach according to the written assessment. Again, this reduces the friction when coaching for effectiveness.
Pollard, Perdue 6

Pilot Results, Scored Events TrendEach scored event equals an inappropriate behavior by the driver and
in turn the driver is coached / disciplined based on severity and or frequency
Started with “Go Live” Aug 20th, Hardware adjustments. Go live with SOP & coaching Feb. 08
37 Cameras, about 50 Drivers
Coaching / Consequences, changes behavior.When you engage drivers with consequences their behavior will change.Be fair and consistent and they will trust you and your processes.Don’t make it discipline only, coach using a “Defensive Driving” strategy.
Pilot Results, Risky Actions
“Risky Actions” include all events marked for coachingand all scored events.
Effective and consistent coaching leads to control.Aug 07 to Feb 08 we conducted regular monthly awareness training only. Feb 08 we began “Driver Consequences”.Finally we focused on timeliness and consistency of coaching.
Pollard, Perdue 7

0
50
100
150
200
250
Sep 07 to Aug 08 Sep 08 to Aug 09 Sep 09 to Aug 10Seatbelts 158 30 31
Cell Phone 223 31 15
158
30 31
223
31 15
Num
ber o
f vio
lati
ons
History Seatbelt & Cell Phone Compliance
Increase consequences when behavior change levels off.
After the initial change where most drivers are taking ownership you will need to step up!
To achieve the “Zero Goal” you cannot loose focus.
There are only (2) things that will flat-line progress here;1. The coaching is not adequate.2. The driver is resistant to the requested change.
Remedy by:1. Make sure that your managers have bought into the process. They
need to be “Coaching”, not pushing back. 2. Have a plan for progressive consequences when drivers are not
willing to change behavior.
“Camera Project” Pilot Results, Driving FundamentalsObservations Aug 2007 – Feb 2009
Total Events Scored = 425Risky Fundamental Behaviors = 135 / 31%
Top (3) Target Areas of Focus
Action:•Revised Driver Policy •Keep “Truck Camera” process•Engage driver with “PIP”•Defensive Driving education
Pollard, Perdue 8

Near Miss Run off Roadway
9%
Near Collision Avoidable
40%
Near Collision Unavoidable
3%
Collission Avoidable18%
Collision Unavoidable7%
Collission Animal Strike23%
Pilot Data, Near Collision/ Collision (542 Scored events)
(57 / 10% resulted in a Near Miss or Collision)
SustainabilityBehavior Leading Indicators
Traffic ViolationsCell phone
Following Too CloseNot Looking Far Ahead
79% Improvement from 2008 to 2011
11% Increase from 2008 to 2011
75% Improvement from 2008 to 2011
28% Improvement from 2008 to 2011
18Pollard, Perdue 9

Industry Performance – Improvement BenchmarksCompany-by-Company Comparison on Scored Event Frequency
Performance by Risk and 6-Mo Improvement(size of bubble represents deployment size)
1.43/mo1.92/mo
Increasing Safe Driving (Score Freq)
Least Improvement
Incr
easi
ng Im
prov
emen
t (pe
r mon
th)
Most Improvement
Lowest RiskHighest Risk
“Safest, Greatest Improvement”
1.19 Events/ Mo / Vehicle
+8.96% / Moimprovement
Industry Avg.
“Riskiest, Least Improvement”
0.94/mo
“Riskiest, Greatest Improvement”
“Safest,Least Improvement”
+17.5%
+0.5%
+34.5%
-16.5%
0.45 /moOur Company+1.55% /Mo and 0.26 e/m/v
19
Overview of Program PerformanceRisk Reduction Results
52% improvement in frequency and 32%
improvement in severity from 2008 to
2011
74% improvement in frequency and 64%
improvement in severity from the first and last three months
of the program
52% improvement in frequency and 32% improvement in severity from
the 2008 through 2011
Historic Performance
20Pollard, Perdue 10

1716
1112
10
4
2
FY07 FY08 FY09 FY10 FY11 FY12 FY13
Total Rollover 72 - (FY07 - FY13 YTD 3rd QTR)Total Rollover
Total CompanyAvg. 52 MM DOT miles / year
Avg. 740 Diesel tractors
Reality!!
What you don’t see, can hurt you!!At the end of the day, you will see things that your drivers would never confess on their own.
You will even see some things that are worthy of recognition to your drivers.
When a accident happens, you will gain closure much quicker, reducing business interruption time.
If you see it before the accident, it is a leading indicator,
do something about it and you may prevent the accident. When you do it pays dividends on all levels.
Questions??
Pollard, Perdue 11