prevalence of occupation associated with increased
TRANSCRIPT
PrevalenceofOccupationAssociatedwithIncreasedMobilityDuring
COVID-19Pandemic
EnbalShacham1
SteveScroggins1
MatthewEllis1
AbstractObjective:Identifyinggeographic-levelprevalenceofoccupationsassociatedwithmobilityduringlocalstay-at-homepandemicmandate.Methods:Aspatio-temporalecologicalframeworkwasappliedtodeterminecensus-tractsthathadsignificantlyhigherratesofoccupationslikelytobedeemedessential:food-service,businessandfinance,healthcaresupport,andmaintenance.Real-timemobilitydatawasusedtodeterminetheaveragedailypercentofresidentsnotleavingtheirplaceofresidence.Spatialregressionmodelswereconstructedforeachoccupationproportionamongcensus-tractswithinalargeurbanarea.Results:Afteradjustingfordemographics,resultsindicatecensus-tractswithhigherproportionoffood-serviceworkers,healthcaresupportemployees,andofficeadministrationstaffarelikelytohaveincreasedmobility.Conclusions:IncreasedmobilityamongcommunitiesislikelytoexacerbateCOVID-19mitigationefforts.Thisincreaseinmobilitywasalsofoundassociatedwithspecificdemographicssuggestingitmaybeoccurringamongunderservedandvulnerablepopulations.WefindthatprevalenceofessentialemploymentpresentsitselfasacandidatefordrivinginequityinmorbidityandmortalityofCOVID-19.
JELCodes:I14,I18Keywords:COVID-19;communitymobility;occupation;spatio-temporalanalysisWorkingPaper20-02WethankShruthiSreenivasaMurthyfordatamanagementandcloudcomputingsupport.
1. SaintLouisUniversity,CollegeforPublicHealthandSocialJustice,DepartmentofBehavioralScienceandHealthEducationandSt.LouisUniversity,GeospatialInstitute,
3545LafayetteAve.,St.Louis,MO63104,U.S.

Any opinions expressed here are those of the author(s) and not those of the center. Research disseminated by SCAER may include views on policy, but the center itself takes no policy positions.

2
Three-question Summary:
1) Employees and workers deemed essential during the COVID-19 pandemic are likely
to endure additional risk of infection due to community exposure. While preliminary
reports are still quantifying this risk, we set out to examine if prevalence of specific
occupations could be used to evaluate overall community-level risk based on stay-at-
home mandate adherence.
2) Study results suggest that that not only are certain occupation geo-spatially associated
with movement outside the home but are also associated with demographic
characteristics likely to contribute to inequity of COVID-19 morbidity.
3) Often, nuanced inequities are lost in the larger data samples, being able to identify
possible inequities from other sources such as prevalence of occupation among
communities, remains an important and applicable alternative.
Introduction
Inequity in incidence of morbidity and mortality related to the novel coronavirus (COVID-19)
has become apparent across U.S. communities. Racial and ethnic minorities are experiencing
higher rates of mortality, more rural areas are facing shortages in healthcare resources, and
individuals living in poverty continue to present at hospitals in more advanced stages of COVID-
19; decreasing the likelihood of positive outcomes.[1-3] Additionally, communities are
confronting numerous economic and social challenges brought on by the pandemic; reflected by
the nearly 40 million jobs lost, and only a small proportion regained, since the start of the
pandemic in the U.S.[4, 5] However, for individuals in frontline employment, or essential
occupations, who leave the home for work, inequity and risk of COVID-19 is not yet fully
3
understood. As U.S. mortality reaches over 200,000 as of October 2020, there is a need to
identify risk more effectively among vulnerable populations.[6]
Throughout the U.S., state and local governments have implemented mitigation mandates to
slow the spread of COVID-19.[7] Commonly and with varying degrees of efficacy, these efforts
include face-covering requirements, limitations on business capacities, changes to hours of
business operations, social-distancing, and recommendations to stay at home.[8] By the nature of
viral transmission, staying home remains the most effective COVID-19 prevention method,
though it also remains the most challenging for some. Among U.S. states, 42 have published
guidelines and mandates of what may constitute an essential worker; an individual employed in
an occupation required to be present at a work, largely unable to stay at home. The U.S.
Department of Homeland Security defines an essential worker as someone with a range of
responsibilities whose continued work is critical to infrastructure operations.[9] Historically, an
essential worker has become synonymous with emergency personal: health workers, law
enforcement, and those in safety occupations. However, recent research, has shown essential
workforce during the COVID-19 pandemic is likely to include transportation workers,
employees of restaurants and grocery stores, educators, among other seemingly unrelated
occupations.[10] Among these newly-defined essential workers, the burden of community
mobility and increased chance of COVID-19 exposure remains unclear both individually and
ecologically.
Historically, there has been little understood about the impact that community mobility has had
on the health of an individual. Previous location-anchored research focused on home or work
address, yet the movement throughout an individual’s daily lives offers insights, in this case
particularly to potential COVID-19 exposure. The purpose of this study was to determine the

4
association among prevalence of occupations and work-related mobility framed within the
current COVID-19 pandemic.
Materials and Methods
This study employed an ecological design with observations at the census-tract level among two
densely populated urban Midwest counties (n=305). The study period consisted of all days from
March 16, 2020 to May 17, 2020; coinciding with seven days before a stay-at-home mandate for
all 1.3 million approximate residents within census-tracts and fifty-six days during the stay at
home mandate.
Two secondary data sources were utilized for this study. The 2018 5-year American Community
Survey (ACS) was used to determine proportion of workers, aged 16 and older, in occupations of
interest among each census-tract. These occupations included: 1) healthcare support, 2) food
preparation and service, 3) building, ground maintenance 4) management, business, and finance,
and 5) office administration support.[11] The ACS was also used to acquire socio-demographic
variable per-census-tract that were likely to be associated with adverse health outcome; (1)
proportion racial/ethnic minority, (2) proportion earning wages below the federal poverty level,
(3) average number of people per household, (4) population density per-square mile, and (5)
proportion of residents aged >64.
Mobility among census-tracts was estimated using aggregated and anonymized data and acquired
as part of a COVID-19 research consortium managed by SafeGraph, LTD, a data management
firm. This data was collected using mobile smart device pings collected throughout the day and
used to estimate geo-global position. This large dataset contains an estimated 5-10% of the U.S.
population. Residency of devices, used to establish proportion of sample leaving home, was

5
calculated by determining the location the device during overnight hours of the day over the
course of six weeks.[12] Additionally, this data has been leveraged for similar studies and
surveillance, used by state and national organizations.[13]
Descriptive statistics were calculated for all variables. A series of Getis-Ord Gi* cluster analysis
were applied among census-tracts for each occupation category to determine locations where
they were significantly higher or lower.
Each occupational category was used as a primary predictor in a series of multivariate spatial
regression models predicting the average proportion of census-tract residents adhering to the
stay-at-home order. Each model was adjusted for socio-demographics described a priori as well
as the average proportion of census-tract residents staying home seven days before the stay-at-
home order as a baseline measurement of mobility. Each model was first constructed under
ordinary-least square regression assumptions and a diagnostic cascade was used to detect if
spatial dependence was present. Preliminary results indicated that adjusting for this dependency
was necessary, thus spatial-lag models were determined to be the best fit.
Both descriptive and inferential analyses were completed using R 4.0 and GeoDa 1.14.[14, 15]
Significance was determined at α of 0.05 and spatially detected using a pseudo p-value
permutation. Spatial weights were applied using a queen contiguity matrix.
Results
As shown in Table 1, prior to the stay-at-home policy, a daily average of 34.75% +4.92 of the
sample did not leave home. During the eight weeks of the stay-at-home policy, a daily average of
41.59% +5.51 did not leave home. Average proportions of census-tract residents employed in the
occupations of interest included: 15.86% +8.06 working in management, business, and finance,

6
12.37%+4.91 working in office administration support; 6.44% +4.24 working in food
preparation and service; 4.25% +4.65 working in healthcare support; and 4.13% +3.68 working
in building, ground maintenance.
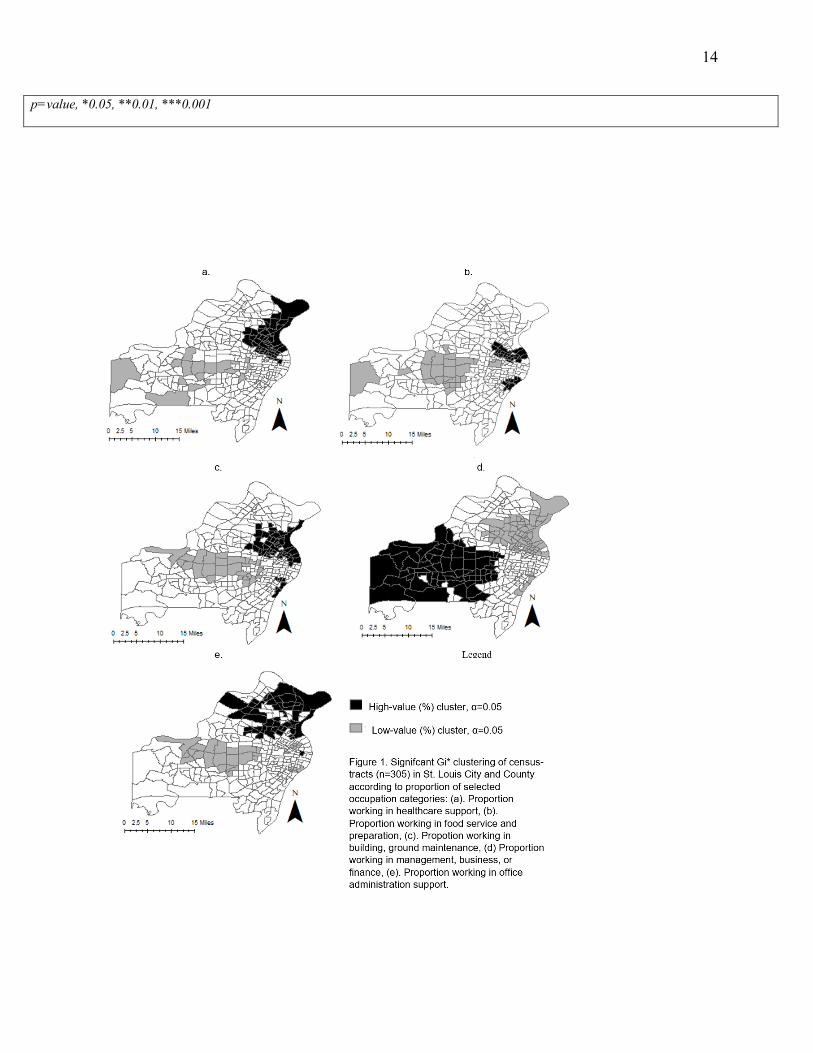
Figure 1 details significant geographical clusters (p<0.05) where each occupation category was
higher or lower than dispersion would expect. Among the 305 census-tracts, 50 (16.39%) were
identified as having significantly higher proportion of healthcare support workers (Fig 1a); 33
(10.81%) as having significantly higher proportion food service and preparation workers (Fig
1b); 57 (18.68%) as having significantly higher building, ground maintenance workers (Fig 1c);
66 (21.64%) as having significantly higher proportion of business, management, and finance
workers (Fig 1d); and 46 (15.08%) identified as clusters with higher proportion of office
administration workers (Fig 1e).
Table 2 details five spatial regression models, each adjusted for spatial lag, predicting proportion
of residents staying home during stay-at-home policy implementation and adjusted for socio-
demographics. Model 1 reveals that for every 10% increase in healthcare support workers, the
proportion staying home decreases by 1% per-census-tracts (β =-0.1, p=0.020). Similarly, every
10% increase in food service and preparation workers results in a 1% decrease in persons staying
home (model 2, β=-0.01, p=0.019) Model 5 shows the effects of office administrative workers
per census-tract; a 16% increase results in a 1% decrease in persons staying home (β=0.06,
p=0.042). Model 4 displays an opposite pattern; for every 12% increase in proportion of workers
in management, business, or finance occupations the proportion of persons staying home
increased by 1% (β=0.08, p=0.002). The occupation category of building, ground maintenance
was found not to be a significant spatial predicator of COVID-19 mitigation compliance when
adjusting for tract characteristics (model 3).
7
Within regression models, several of the socio-demographic characteristics were determined to
be significant predictors of populations staying home. Consistent across all models, as proportion
of older adults and population density increased, proportion of census-tract residents staying
home also increased. As proportion of those earning income below the poverty level increased,
the proportion of tract residents staying home decreased significantly in each model. Average
household size and proportion racial/ethnic minorities per-census-tract were also identified as
significant model predictors, although inconsistently throughout models.
Discussion
This study was able to identify relationships among prevalence of occupations and patterns of
community mobility that have the potential increase risk for COVID-19 exposure among
residents and communities. Areas where census-tract residents were proportionally less likely to
remain at home were also likely to have more individuals employed in the fields of healthcare
support, food preparation and service, and office administration support. In addition, our study
results point to higher proportions of vulnerable populations sharing similar mobility patterns.
These types of occupations identified within this study often require fewer credentials, pay
substantially less, offer minimal flexibility, and are more likely to be among the limited
employment opportunities available to racial and ethnic minorities and residents of low-income
communities.[16, 17]
These findings highlight the accelerated impact of inequity related to COVID-19. While
employment typically serves as a protective factor in many health outcomes, this pandemic has
shown that types of employment and the varying context of essential employment change,
leaving already vulnerable employees at increased risk for adverse health outcomes. Current
literature supports this framework, finding that pandemic essential employment sites require

8
ensuring proper protective equipment, sanitization, and safety protocols, yet, in many cases, are
unavailable due the challenges in understanding the transmission and supply chain demands.[18]
Community mobility, in this case, provided insights to where and when individuals were home
and work during a stay-at-home order. These methods and results highlight the utility of these
types of data and how they can provide insights to patterns of behavior and health outcomes
throughout communities. Other studies have more widely begun to use these methods and have
great opportunity to the growth of our science about how neighborhoods impact our health.
{Painter, 2020 #2595}
The pandemic has provided an opportunity for employers, employees, and the public to re-
consider such positions now deemed “essential workers.” This will hopefully pave the way for
acknowledging and addressing economic inequities that existed prior to the pandemic, but have
gained greater visibility, not only in terms of employee safety, but employee value and risk.
Efforts such as raising the federal minimum wage and improving the accessibility of healthcare
coverage should now be included in conversations highlighting lessons learned from the current
pandemic.

9
Acknowledgements
This work was supported by the Sinquefield Center for Applied Economic Research and the
Geospatial Institute at Saint Louis University.
References
1. Patel JA, Nielsen FBH, Badiani AA, Assi S, Unadkat VA, Patel B et al. Poverty, inequality
and COVID-19: the forgotten vulnerable. Public Health. 2020;183:110-1.
doi:10.1016/j.puhe.2020.05.006.
2. Millett GA, Jones AT, Benkeser D, Baral S, Mercer L, Beyrer C et al. Assessing differential
impacts of COVID-19 on black communities. Annals of Epidemiology. 2020;47:37-44.
doi:https://doi.org/10.1016/j.annepidem.2020.05.003.
10
3. Peters DJ. Community Susceptibility and Resiliency to COVID-19 Across the Rural-Urban
Continuum in the United States. The Journal of Rural Health. 2020;36(3):446-56.
doi:10.1111/jrh.12477.
4. U.S. Department of Labor. COVID-19 and the American Workforce. In: Wage and Hour
Division. Washington D.C., U.S. 2020. https://www.dol.gov/agencies/whd/pandemic.
5. U.S. Bureau of Labor Statistics. Montly Labor Review. 2020. https://www.bls.gov/opub/mlr/.
6. National Center for Immunization and Respiratory Disease. Coronavirus Disease 19 U.S.
Cases. Centers for Disease Control and Prevention. 2020.
https://www.cdc.gov/coronavirus/2019-ncov/cases-updates/cases-in-us.html.
7. Mervosh S, Lu, D., Swayes, V., Lee, J., Gamio, L., and Popovich, N. . See How All 50 States
Are Reopening. The New York Times. 2020.
https://www.nytimes.com/interactive/2020/us/states-reopen-map-coronavirus.html.
8. National Center for Immunization and Respiratory Diseases. Implementation of Mitigation
Strategies for Communities with Local COVID-19 Transmission. Centers for Disease Control
and Prevention. 2020. Implementation of Mitigation Strategies for Communities with Local
COVID-19 Transmission.
9. U.S. Department of Homeland Security. Advisory Memorandum On Ensuring Essential
Critical Infastructure Workers Ability to Work During the COVID-19 Responce. 2020.
10. The L. The plight of essential workers during the COVID-19 pandemic. Lancet.
2020;395(10237):1587-. doi:10.1016/S0140-6736(20)31200-9.
11. 2018 5-year American Community Service [database on the Internet]2019. Available from:
https://www.census.gov/programs-surveys/acs/news/data-releases.2018.html. Accessed: June 10,
2020

11
12. SAFEGRAPH. Safegraph Data Documentation. 2020.
https://docs.safegraph.com/docs/places-manual.
13. SAFEGRAPH. SafeGraph Provides CDC and 1000+ Organizations With Data to Fight the
COVID-19 Crisis. 2020. https://www.safegraph.com/blog/safegraph-provides-cdc-fed-and-1000-
organizations-with-data-to-fight-the-covid-19-crisis.
14. Anselin LS, I. and Kho, Y. GeoDa 1.14. Chicago, IL, USA2019.
15. R Core Team. R: A language and environment for statistical computing. Vienna, Austria: R
Foundation for Statistical Computing; 2020.
16. Bertola G, Blau FD, Kahn LM. Labor market institutions and demographic employment
patterns. Journal of Population Economics. 2007;20(4):833-67. doi:10.1007/s00148-007-0137-8.
17. Cooper D. Workers of color are far more likely to be paid poverty-level wages than white
workers. Economic Policy Institute. 2018.
18. Mehrotra P, Malani P, Yadav P, editors. Personal Protective Equipment Shortages During
COVID-19—Supply Chain–Related Causes and Mitigation Strategies. JAMA Health Forum;
2020: American Medical Association.

12
Table 1. Characteristics of Census-tracts within City of St. Louis and St. Louis County (n=305)
Mean % (SD)
Stay-at-Home Policy Adherence
Daily % not leaving home before policya
34.75 (4.92)
Daily % not leaving home during policyb
41.59 (5.51)
Non-white population 44.47 (33.42)
Employed but income below federal poverty level 13.99 (11.11)
Residents within household 2.36 (0.34)
Population density (mi2) 4,317.36 (2,766.66)
Older adults, aged >65 15.70 (5.83)
Occupation
Healthcare support 4.25 (4.65)
Food preparation and service 6.44 (4.24)
Building, ground maintenance 4.13 (3.68)
Management, business, and finance 15.86 (8.06)
Office administration support
12.37 (4.91)
a. Calculated from daily observations from March 16, 2020 to March 22, 2020
b. Calculated from daily observations from March 23, 2020 to May 17, 2020

13
Table 2. Spatial Regression Models Predicting Proportion Residents Adhering to Stay-at-Home Policy Implementation
1 2 3 4 5
β Std. E β Std. E β Std. E β Std. E β Std. E
Proportion healthcare
support -0.1* 0.04
Proportion food
preparation and service -0.1* 0.04
Proportion building,
grounds, and maintenance -0.4 0.05
Proportion management,
business, and finance 0.08** 0.03
Proportion office
administration support -0.06* 0.03
Daily average proportion
staying home before
policy 0.62*** 0.04 0.63*** 0.04 0.63*** 0.04 0.63*** 0.04 0.62*** 0.04
Proportion racial/ethnic
minority -0.01 0.01 -0.02** 0.01 -0.02** 0.01 -0.01 0.01 -0.02* 0.01
Proportion income earned
below poverty -0.07*** 0.02 -0.06* 0.02 -0.08** 0.02 -0.06** 0.02 -0.08*** 0.02
Average household size 1.04* 0.5 0.91 0.5 0.89 0.50 0.9 0.49 0.74 0.49
Population density (mi2) <0.01*** <0.01 <0.01*** <0.01 <0.01*** <0.01 <0.01*** <0.01 <0.01*** <0.01
Proportion of older adults
aged >64 years 0.12*** 0.03 0.11*** 0.03 0.11*** 0.03 0.10*** 0.03 0.10*** 0.003
Intercept 8.35*** 2.65 8.00*** 2.63 8.32** 2.64 6.87** 2.70 9.3*** 2.65
ρ (lag coefficient) 0.22*** 0.06 0.22*** 0.06 0.22*** 0.06 0.21*** 0.06 0.22*** 0.06
Residuals Moran’s I test -0.01 -0.01 -0.02 -0.01 -0.01
14
p=value, *0.05, **0.01, ***0.001