pressing the right buttons
TRANSCRIPT

Pressing theRight Buttons
Calculator Use in Schools and inJunior Cycle Mathematics
Summary Report on Phase II of the Study of the Effects of Calculator Use
on Mathematics in Schools and in the Certificate Examinations
Paul Surgenor, Elizabeth Oldham, Seán Close, Gerry Shiel,
Thérèse Dooley and Michael O’Leary
Education Department, St Patrick’s College, Dublin
School of Education, Trinity College, Dublin
Educational Research Centre, St Patrick’s College, Dublin
B15927 Cover 9/4/07 1:26 PM Page 1

Pressing theRight Buttons
Calculator Use in Schools and inJunior Cycle Mathematics
Summary Report on Phase II of the Study of the Effects of Calculator
Use on Mathematics in Schools and in the Certificate Examinations
Paul Surgenor, Elizabeth Oldham, Seán Close, Gerry Shiel,
Thérèse Dooley and Michael O’Leary
Education Department, St Patrick’s College, DublinSchool of Education, Trinity College, Dublin
Educational Research Centre, St Patrick’s College, Dublin
B15927 Buttons Inside_D1 10/9/07 6:01 PM Page i

Copyright © 2007, St. Patrick’s College
Cataloguing-in-Publication Data
Surgenor, PaulPressing the right buttons: calculator use in schools and Junior Cycle mathematics /Paul Surgenor…[et al.].
vi, 48 p., tables, 30 cm.Includes bibliographical references
1. Junior Certificate Mathematics Examination–Ireland. 2. Mathematics–Study and teaching (Secondary)–Ireland.3. Mathematical ability–Testing.4. Pocket calculators.
I Title2007510.712 dc/22
Designed by TOTAL PD
Published by St. Patrick’s College Electronic version available at http://www.erc.ie
ISBN: 1 872327 63 X
The study on which this report is based was funded by theResearch Committee of the Department of Education and Science
B15927 Buttons Inside_D1 10/9/07 6:01 PM Page ii

Contents
Preface v
1 What is the background to the study? 1
2 What does the research literature say about calculators in
mathematics? 6
3 How were the calculator tests and questionnaires developed? 9
4 How was the study implemented? 12
5 How did students perform on the calculator tests? 15
6 What were students’ attitudes to calculators? 22
7 What were teachers’ attitudes to calculators? 25
8 How did students’ performance on the calculator tests and
the Junior Certificate mathematics examination compare? 29
9 What can we learn from the study? 34
References 37
Appendices 39
Appendix A: Sample parallel items for each calculator test 39
Appendix B: Glossary 44
Appendix C: Calculator Activities 46
iii
B15927 Buttons Inside_D1 10/9/07 6:01 PM Page iii

PrefaceThe study of the effects of calculator use in schools and in the Certificate Examinationsarose in the context of the introduction of calculators in the revised Junior Certificatemathematics syllabus (implemented in September 2000, with first examination in June2003), and the decision to allow the use of calculators in the Junior Certificatemathematics examination from June 2003 onwards.
The effects of calculator usage on mathematics achievement were studied in two phases –before and after the formal introduction of calculators into the Junior Cycle mathematicssyllabus (DES/NCCA, 2000). Phase I (Close, Oldham, Shiel, Dooley, Hackett, & O’Leary,2004) involved administering three calculator tests to a nationally-representative sampleof Third-year students who had studied the pre-2000 Junior Certificate mathematicssyllabus, and who did not have access to a calculator when attempting the JuniorCertificate mathematics examination in June 2002. Phase II (Close, Oldham, Surgenor,Shiel, Dooley, & O’Leary, 2007) involved administering the same tests to a similarsample of students who had worked under the revised Junior Certificate mathematicssyllabus and related teacher guidelines (DES/NCCA, 2002), and who had access to acalculator when sitting the Junior Certificate mathematics examination in June 2005.
This is the summary report of the Phase II study.
Principal Objectives of the Phase II Study
In Phase II of the study, the principal objectives included:
• comparing the performances of the 2001 and 2004 Third-year cohorts on three tests of mathematics achievement
• examining the effects of calculator access versus non-access during the 2004 testing on student performance
• examining attitudes to, and extent of, calculator usage by students and their teachers in Third-year mathematics classes in 2004
• obtaining information on school policies on calculator use• examining relationships between the performance of the 2004 students on the
calculator tests administered in late 2004 and their performance on the 2005 Junior Certificate mathematics examination.
v
B15927 Buttons Inside_D1 10/9/07 6:01 PM Page v

vi
Acknowledgements
The research team wishes to thank the many teachers and students who participated inthe different elements of the 2004 study.
Thanks are also due to Thomas Kellaghan, Director of the Educational Research Centre;the Department of Education and Science officials who liaised between the research teamand the Department Research and Development Committee; the School of Education,Trinity College; the Department of Education, St Patrick’s College; staff members at theEducational Research Centre (including David Millar for providing advice on sampling,John Coyle for providing data management support, and Mary Rohan and Hilary Walshefor providing administrative support); and students from St. Patrick’s College whoassisted with the scoring of tests and questionnaires.
Pressing the Right Buttons: Calculator Use in Schools and in Junior Cycle Mathematics
B15927 Buttons Inside_D1 10/9/07 6:01 PM Page vi

What is the background tothe study?In this section, an overview is given of the policy and practice with regard to calculatoruse in Irish mathematics education over the past four decades. The origin and structureof the Calculators in Mathematics Study are then described, and key results from Phase Iof the study are presented. Issues relevant to Phase II of the study are identified.
Calculators in Irish Mathematics Education: the Historical Context
The current mathematics curricula in Irish primary and second level schools haveevolved from the significantly changed courses that were initiated around forty years ago:in the mid-1960s (the period noted for ‘modern mathematics’) for second level curricula,and in 1971 for primary level when the ‘new’ curriculum was introduced. For neitherdevelopment was the use of calculators an issue. Much the same can be said for therevisions of the modern second-level courses implemented in the mid-seventies.
However, at this time the debate about calculator use in mathematics education was wellestablished elsewhere. By the end of the decade it had developed in Ireland, at least withrespect to second level schooling. In 1980, the Irish Mathematics Teachers’ Associationdeclared itself in favour of unrestricted calculator use in the state examinations – aposition it has held ever since.
During the 1980s, arguments for calculator use typically emphasised their power inobviating tedious computation when this was not the main focus of attention (forexample, when dealing with percentages, area or volume) and in preparing students forlife beyond school. Arguments against more often addressed financial, social or practicalissues: for example, who would provide the machines used in state examinations (theDepartment or the students) and what would happen if a calculator malfunctioned in theexamination. Such pragmatic issues dominated the debate. The use of calculators aslearning tools rather than as computational devices was not generally addressed.
A further revision of the Intermediate Certificate courses began in 1982. When therevised courses were introduced in 1987, four-figure tables still featured, and noreference was made to calculators; moreover, the ban on calculator use in theIntermediate Certificate mathematics examination remained in force. In 1989 thesecourses were re-designated as Junior Certificate courses without any change in thesyllabus or examinations.
1
1
What is the background to the study?
B15927 Buttons Inside_D1 10/9/07 6:01 PM Page 1

2
Introduction of Calculators to Irish Mathematics Education
The first official appearance of calculators in Irish mathematics education occurred whennon-programmable electronic calculators were permitted in the Leaving Certificateexamination from 1986. The transition took place without any change in syllabuscontent or in the style of the examination questions. Thus, numbers were still chosen tofacilitate paper-and-pencil computations, so that the advantage to students who chose touse calculators was minimised. In practice, however, use of a scientific calculator becamethe norm.
Explicit introduction of the calculator into the Leaving Certificate mathematics syllabuscame in 1990 with the inception of the Ordinary Alternative syllabus. Parts of the coursewere built around calculator use, and the examination contained an optional questionthat tested computational skills with a calculator. The revised Higher and Ordinary levelsyllabuses introduced in 1992 refer to calculator use, but the correspondingexaminations were still designed in such a way as to facilitate paper-and-pencilcomputation. By 1995, however, when the Ordinary Alternative course was re-designated (with only minor changes) as a Foundation Level course, it had becomeobvious that the practical difficulties with regard to calculator use in examinations wereminimal, and that the ‘calculator option’ question was much more popular than itstraditional alternative. The latter was dropped. Thus, finally, a calculator was effectively‘required’ – in the same way that pen or pencil, ruler and geometrical instruments were‘required’, rather than just permitted – in a state examination in mathematics.
In the 1990s, a major revision of the Primary Curriculum was undertaken, and therevised curriculum was phased in from 2000. Its mathematics element incorporatedcalculator use from Fourth Class upwards; typical objectives state that the childrenshould be able to perform [various operations and computations] ‘without and with acalculator’. Students arriving in second-level schools after the revised curriculum wasimplemented would therefore be expected to be accustomed to, and competent at,calculator use.
The position for the Junior Certificate was thus becoming anomalous. In any case,reviews of the courses by the National Council for Curriculum and Assessment (NCCA)Mathematics Course Committee in the early 1990s had identified the absence ofcalculators from the syllabus and examinations as one of the chief negative aspects.Moreover, not only had practical objections to calculator use weakened, but a practicalargument in favour had arisen: it was becoming increasingly hard to monitor illicit use ofa tiny calculator, for example incorporated in a wrist-watch, during the examinations.This tended to counterbalance a genuinely educational argument that the JuniorCertificate mathematics examination should test basic numeracy, and that at least onesection of the examination should be done without calculators.
With the body of research broadly in favour of calculator use well established (see mainreport), the decision was taken to introduce calculators into the curriculum ‘forappropriate use’. A revised Junior Certificate mathematics syllabus was introduced in
Pressing the Right Buttons: Calculator Use in Schools and in Junior Cycle Mathematics
B15927 Buttons Inside_D1 10/9/07 6:01 PM Page 2

What is the background to the study?
2000 for first examination in 2003. The types of calculators sanctioned for use in thestate examinations are four-function and scientific (non-programmable) machines,though there is no embargo on the use of graphics calculators as teaching and learningtools.
The Effect of Calculator Use on Mathematics Study
The introduction of calculators into the mathematics curriculum provided opportunitiesfor developments in teaching and learning, and for improvements in mathematicsperformance. However, it also raised concerns about the maintenance of computationalskills for which calculator use is not appropriate.
In addressing these concerns, the Calculator Study took place in two phases. Phase Iexamined the final cohort studying the pre-2000 Junior Certificate mathematics syllabus(and undertaking the Junior Certificate mathematics examination without access tocalculators), and Phase II examined the third cohort of students taking the revised JuniorCertificate syllabus (hence familiar with, and permitted to use, calculators in theexamination). Each phase involved the administration of mathematics tests andquestionnaires to nationally-representative samples of Third year students.
Three tests were developed to test different aspects of students’ mathematical skills in thepresence or absence of a calculator. These were: a Calculator Inappropriate test (takenwithout access to a calculator by all students in the sample, and containing items thatstudents should be able to do without a calculator); a Calculator Optional test (taken byhalf the sample with access to a calculator and by the other half without such access, andcontaining items that students should be able to do with or without a calculator); and aCalculator Appropriate test (taken by all students with access to a calculator, andcontaining items that would normally require a calculator). Questionnaires for studentsand teachers were also developed.
The test results from Phase I of the study provided base-line data on the performance ofstudents who had followed the pre-2000 Junior Certificate mathematics syllabus. Resultsfrom the Calculator Optional test revealed that students with calculator access scoredsignificantly higher than students without such access. Attitudes of teachers and studentsto calculator use were generally positive. While many teachers did not allow calculatoruse in their classes at the time, most were in favour of calculator use in the examinations.
As well as providing baseline data, the findings from Phase I shaped the researchobjectives for Phase II of the study as listed in the preface.
3
B15927 Buttons Inside_D1 10/9/07 6:01 PM Page 3

4
Comparing Phase I and Phase II Studies
In comparing results from Phase I and Phase II of the study, several factors must be takeninto account.
First to be considered are changes directly related to the revised syllabus and itsimplementation. Revisions were not restricted to calculator usage. The tests in the studyfocused on areas for which the introduction of the calculator appeared to constitute theonly significant change; however, other alterations may have affected teachers’ approachto the syllabus or students’ learning, and hence student performance in general.Moreover, a perception that the Higher course in particular had been ‘shortened’ seemsto have led to some reduction in the time allocated to Junior Cycle mathematics in someschools.
A second factor relates to the time elapsing between the two phases of the study. Phase IIexamined students from the third cohort following the revised syllabus, and hencetesting for Phase II was carried out three years after that for Phase I. This had theintended outcome of allowing teachers to become familiar with the revised syllabus, andteachers and students to do likewise with regard to the style of the Junior Certificateexaminations. It therefore provided a truer reflection of the implemented syllabus thanwould have been the case if the first cohort had been examined. An inevitableconsequence of the passage of time, however, is that any underlying demographic,cultural, or other trends affecting student performance may have had a stronger effect onthe 2004 cohort than on those preceding it.
An additional point of interest with regard to the lapse in time is that the proportion ofthe candidates for the Junior Certificate mathematics examination who opt for theHigher course has grown. For the two examination cohorts sampled for the study, theproportions were 39% in 2002 and 42% in 2005 (Figure 1.1). This is part of a welcometrend but raises some difficulties, especially for level-specific comparisons between thecohorts.
A third factor is that when the revised syllabus was designed, scientific calculators ingeneral did not have ‘fraction keys’. Such keys have become increasingly usual duringthe intervening period, but the full extent of teachers’ and students’ familiarity with, andwillingness to use, them is not known. The issue highlights the importance of estimationskills in the presence of technology. It also illustrates the fact that any study involvingtechnology is likely to have to cope with rapid changes in the power of that technology.
Pressing the Right Buttons: Calculator Use in Schools and in Junior Cycle Mathematics
B15927 Buttons Inside_D1 10/9/07 6:01 PM Page 4

Figure 1.1: Percentages of Students Taking Each Junior Certificate Examination Level for
Mathematics, by Year1
* 2001 cohort (Phase I) took the Junior Certificate Examination in 2002
** 2004 cohort (Phase II) took the Junior Certificate Examination in 2005
5
What is the background to the study?
1 (Source – State Examination Commission; http://www.examinations.ie)
60
50
40
30
20
10
0
2001 2002* 2003 2004 2005**
Foundation
Ordinary
Higher
B15927 Buttons Inside_D1 10/9/07 6:01 PM Page 5

6
Pressing the Right Buttons: Calculator Use in Schools and in Junior Cycle Mathematics
What does the researchliterature say aboutcalculators inmathematics?The literature review in the report of Phase I of the project established that students’basic skills were not adversely affected by calculator usage during mathematics lessons,and that, in some cases, instruction in effective calculator usage resulted in gains inachievement in computation and problem solving. The literature emphasised that anincreased focus on mental arithmetic and estimation in classes is necessary wherecalculators are routinely available during mathematics instruction. This chapter of thereport updates the Phase I review.
Calculator Usage
Calculators are now widely available in the homes of primary and second-level studentsin Ireland (Shiel, Surgenor, Close & Millar, 2006; Close et al., 2004). The frequency ofthe usage of the scientific calculator among secondary students has increased, owing tothe fact that it is now part of the Junior Certificate mathematics syllabus andexamination. On the other hand, the uptake of calculators in primary-level mathematicsclasses in Ireland, although showing improvement since 1999, is disappointing. In the2004 National Assessment of Mathematics Achievement (NAMA 2004) (Shiel et al.,2006) it was found that one-third of pupils in Fourth class ‘hardly ever’ or ‘never’ usedthem. It is possible that the inclusion of calculator appropriate items in primarymathematics tests will promote the integration of the calculator in senior primarymathematics lessons.
The purposes for which the calculator is used in mathematics instruction also warrantattention. It had been hoped that calculator usage in mathematics classes would promotegrowth in problem-solving and investigative work and a decreased emphasis on paperand pen calculations. In NAMA 2004, it emerged that in Fourth classes where there isfrequent access by pupils to the calculator (daily or weekly), it is most often used forchecking answers and routine computations. In the TIMSS (2003) internationalassessment (Mullis, Martin, Gonzalez & Chrostowski, 2004), it was reported that thecalculator is used most often by Eighth grade students for the solution of complexproblems, routine computations and checking of answers and least often for theexploration of number concepts. The failure to exploit the device to its full potential may
2
B15927 Buttons Inside_D1 10/9/07 6:01 PM Page 6

7
reinforce negative attitudes towards it on the part of teachers. This could account for anoticeable decline across countries in ‘frequent’ calculator usage among Eighth gradestudents as reported in TIMSS 1999 (Mullis, Martin, Gonzalez, Gregory, Garden,O’Connor, Chrostowski, & Smith, 2000). Professional development courses have beenfound to have a positive effect on teachers’ beliefs about the potential of the calculator asa tool for exploration of mathematics (Schmidt, 1999). This suggests such coursesshould be made available to both primary and secondary teachers.
Calculators and Achievement
The most frequently cited report regarding the effect of the non-graphing calculators onmathematical achievement is that of Hembree and Dessart (1986, 1992). Theyconducted meta-analyses of 79 studies over a 15 year period. One finding of their studywas that, on tests of problem-solving where access to calculator was permitted, therewere positive effects for students of all ability levels. The results of Phase I of this projectsupport the finding that calculator availability during assessment is a key factor inproducing better results. However, access to a calculator during assessment can impedeperformance if students are not familiar with its use (Hopkins, 1992) or if they have nothad prior experience in using it in mathematics tests (Bridgeman, Harvey & Brasswell,1995).
The beneficial effects of the calculator are not confined to its availability in tests ofmathematical achievement. In the final report of Phase I of the current project, referencewas made to several studies that showed the advantages conferred by the calculator tostudents who were exposed to it during mathematics instruction (e.g., ARK (Hedrén,1985), CAN (Shuard, 1992) and CPM (Groves & Stacey, 1998)). In these studies, projectchildren demonstrated a better ability to solve word problems and a superiorunderstanding of topics such as place-value in large numbers and decimal numbers.They also performed as well or better on tests of basic skills than those who did not haveexposure to the calculator. Research on the use of graphics calculators in secondary-levelmathematics shows that these tools are likely to improve understanding of function andgraph concepts, problem-solving skills, and readiness for the study of calculus. However,access to a calculator is just one factor among several associated with mathematicalperformance. This was illustrated in TIMSS 2003 where the frequency of calculator usagediffers across the eight top scoring countries as shown in Table 2.1. The average scalescore of Hong Kong and that of Chinese Taipei, for example, differ by a mere one point,yet the countries have dissimilar patterns of calculator usage.
What does the research literature say about calculators in mathematics?
B15927 Buttons Inside_D1 10/9/07 6:01 PM Page 7

8
Pressing the Right Buttons: Calculator Use in Schools and in Junior Cycle Mathematics
Table 2.1: Calculator Usage in High-Scoring Countries in TIMSS (2003)
The calculator, therefore, is not a panacea that cures all mathematical ills but, usedappropriately, it is one of several factors that contribute to mathematical achievement andto the flexible mathematical thinking that is required in today’s society.
Key Points
• While the frequency of calculator use in homes and second-level schools is increasing, uptake in the Senior classes at primary level is still low.
• In Ireland and elsewhere, calculators have been used most often for checking answers and doing routine operations.
• Failure to exploit the calculator to its full potential may reinforce negative attitudes towards it on the part of teachers.
Country
Singapore 100 605
Rep. of Korea 65 589
Hong Kong 98 586
Chinese Taipei 66 585
Japan 63 570
Belgium (Flemish) 97 537
Netherlands 100 536
Hungary 81 529
% of Students Whose TeachersReported That Calculators Are
Permitted
Average Scale Score
B15927 Buttons Inside_D1 10/9/07 6:01 PM Page 8

9
How were the calculatortests and questionnairesdeveloped?This chapter provides information on the rationale for, and content of, the calculatortests, and teacher and student questionnaires that were developed.
Calculator Tests
The process of designing suitable items to assess calculator issues, curricular issues, andassessment issues, and assembling them into tests is described in detail in the mainPhase I and Phase II reports. In short, the final design for the test specified threemeasures: a Calculator Inappropriate test (in which calculators were not available to anystudents); a Calculator Optional test (in which calculators were available to half of thecohort and not available to the other half); and a Calculator Appropriate test (of whichthere were two forms, Booklet 1 and Booklet 2, both of which permitted calculatoraccess) (Figure 2.1).
Figure 2.1: Summary of Tests Developed
The requirements to test mental and written arithmetic, understanding of number, anddata analysis, shaped the mathematical topics and skills tested.
Test items fell into one of two categories: those which assessed ‘knowledge ofmathematical facts, procedures and concepts’, and those which assessed ‘knowledge of
3
Calculator Optional TestNo Calculator Available –
One-half of Students
Calculator Optional TestCalculator Available –One-half of Students
Calculator Inappropriate TestNo Calculator Available –
All Students
Calculator Appropriate TestCalculator Available –
All Students
How were the calculator tests and questionnaires developed?
B15927 Buttons Inside_D1 10/9/07 6:01 PM Page 9

10
Pressing the Right Buttons: Calculator Use in Schools and in Junior Cycle Mathematics
applications to real-life contexts’. Tests included both multiple-choice and shortconstructed-response items, and displayed an overall ‘gradient of difficulty’, that is theCalculator Inappropriate test was intended to be easier than the Calculator Optional test,which, in turn, was intended to be easier than the Calculator Appropriate test. Minorchanges were made to the tests in 2004 to amend or remove items that functionedpoorly in Phase I.
Test items focused chiefly on assessing the Junior Certificate syllabus content area ofApplied Arithmetic & Measure (because of its relevance for the use of real-life data),followed by Number Systems and Statistics (as these are the most calculator sensitivetopics accessible to all Third-year students), and Algebra (focusing on the solution ofsimple equations) (Table 3.1).
A selection of sample items from the three tests is provided in Appendix A.
Questionnaires
Teacher and Student Questionnaires were written for Phase I and developed further forPhase II. These were designed to investigate variables that might be associated withstudent performance on the tests, and to provide both background data on participatingstudents and their teachers and information on school policies on calculators andarithmetic skills.
The teacher questionnaire sought to ascertain teachers’ attitudes towards calculator usageby students in a variety of contexts, including the home, the classroom and theCertificate examinations. For Phase I, the questionnaire also sought information aboutthe relative emphasis that teachers placed on various aspects of school mathematics. ForPhase II – carried out when calculator use was allowed in the Junior Certificatemathematics examinations – the questions on this topic were replaced by questionsseeking information in two areas: school or teacher policy with regard to numeracyissues, including calculator use; and teachers’ experience of aspects, benefits andproblems of calculator usage.
Table 3.1: Number of Items on Each Calculator Test, by Mathematics Content Area
Number of Items
Number
13
12
7
App. Arithmetic &Measure
10
15
15
Algebra
1
4
0
Statistics
1
2
8
Total
25
33
30
Test
Calculator Inappropriate
Calculator Optional
Calculator Appropriate
B15927 Buttons Inside_D1 10/9/07 6:01 PM Page 10

11
The student questionnaire sought information on students’ calculator usage at home andat school in a range of subjects, including mathematics, and asked about students’attitudes to mathematics in general and towards calculator usage in particular. In PhaseII, additional questions were asked in order to investigate students’ experience ofcalculator use in the revised curriculum.
Key Points
• Three tests were developed: a Calculator Inappropriate test, a Calculator Optional test, and a Calculator Appropriate test.
• Items were either multiple-choice or constructed-response.• The main areas assessed were Number and Applied Arithmetic & Measure.• Teacher and student questionnaires were also developed.
How were the calculator tests and questionnaires developed?
B15927 Buttons Inside_D1 10/9/07 6:01 PM Page 11

12
Pressing the Right Buttons: Calculator Use in Schools and in Junior Cycle Mathematics
4
Stratum
Secondary (large)
Secondary (small)
Vocational (large)
Vocational (small)
Comm/Comp
Total
Defined Population Achieved Sample
Schools
n %
Students
n %
Schools
n %
Students
n %
45.1
15.9
14.0
10.7
14.4
100
270
95
84
64
86
599
27410
4275
8229
2776
9463
52153
52.6
8.2
15.8
5.3
18.1
100
32
7
17
4
13
73
43.8
9.6
23.3
5.5
17.8
100
671
115
329
75
269
1459
46.0
7.9
22.5
5.1
18.4
100
How was the studyimplemented? This chapter describes implementation of the Phase II study, including the sample ofschools and students involved, the scaling procedures, and the approaches taken toanalyse the data.
The Sample of Schools and Students
Phase II was implemented in November 2004 – the same time of the year as the Phase Imain study – to enhance the validity of comparisons drawn between the 2001 and 2004samples.
The target population consisted of Third-year students in schools on the Department ofEducation and Science’s post-primary schools database for the 2003-04 school year. Asin 2001, students in special schools, or in full-time special (resource) classes in ordinaryschools, were excluded.
Schools were stratified by type (Secondary, Vocational, Community/ Comprehensive) andsize (large or small) (Table 4.1). Within each stratum, schools were sorted by thepercentage of female students in Third year and by school size. Schools were thenselected using probability proportional to size systematic sampling. The numbers andpercentages of students and schools in the defined and the achieved samples arepresented in Table 4.1. One class in each participating school was selected at randomfrom a list of Third-year classes. The school response rate was 66% (73 schools afterreplacement).
Table 4.1: Numbers and Percentages of Schools and Students in the Defined Population
and Achieved Sample, by Stratum – Phase II
Large = (61+ students enrolled in Third year); Small = (30-60 students in Third year)
B15927 Buttons Inside_D1 10/9/07 6:01 PM Page 12

13
In all, 1459 Third-year students completed the calculator tests, and 1448 of thesestudents also completed the Student Questionnaire. Of the 73 teachers whose classesparticipated in the study, 71 completed the Teacher Questionnaire. Weights werecomputed to compensate for the unequal distribution of students in different strata inthe sample (see the main report for full details of the weighting process).
Comparison of the 2001 and 2004 Samples
Every effort was made to ensure that the Phase II sample was both representative of thepopulation of Third-year students in Ireland and also broadly equivalent with the Phase Isample. Across the two phases, the achieved samples are broadly similar, though therewere proportionately fewer large Secondary schools/students, and proportionately morelarge Vocational schools/students in the Phase II sample, relative to the Phase I sample.The proportions of male and female students in Phase I and Phase II were broadlysimilar, with 43% and 45% of the Phase I and Phase II samples male, and 53% and 54%female (data on gender were missing for some students in both years).
Implementation in Schools
Participating schools appointed co-ordinators to liaise with the Educational ResearchCentre and oversee the administration of the testing.
In all cases, the 30-minute Calculator Inappropriate test was administered first. Studentsdid not have access to a calculator for this test. After a short break, students wereadministered the 40-minute Calculator Optional test. The calculator and non-calculatorversions of the test (only the directions with respect to calculator usage were different)were distributed to alternate students. After another short break, the 25-minuteCalculator Appropriate test was administered, the two forms being randomly distributedwithin classes. Following another short break, the Student Questionnaire wasadministered. Teachers were encouraged to complete the Teacher Questionnaire at thesame time as students were working on their questionnaire.
Scaling the Calculator Tests
Scaling of the calculator tests using Item Response Theory (IRT) meant that it waspossible to implement some minor changes to the tests without invalidating comparisonacross the two phases. The performance of students in 2004 was placed on the samescales that were developed in 2001, allowing for valid comparisons of achievement overtime. More details of the scaling procedure can be found in Chapter 4 of the Main PhaseII report.
How was the study implemented?
B15927 Buttons Inside_D1 10/9/07 6:01 PM Page 13

14
Pressing the Right Buttons: Calculator Use in Schools and in Junior Cycle Mathematics
Analysis of the Data
In general, mean raw scores, scale scores, percent correct scores, scores associated withselected percentile ranks, and percentages of students reported are weighted populationestimates that take into account the unequal representation of students from differentschools and school types in the sample. They were obtained by applying weights tostudents’ scores during analysis. Mean and percentage scores in this report are oftenaccompanied by a standard error. A standard error is a measure of the extent to which anestimate derived from a sample (for example, a mean score) is likely to differ from thetrue (unknown) score in the population. Using these standard errors, it is possible toestimate whether differences (for example, between scores in Phase I and Phase II) occurdue to chance, or whether the differences are ‘real’ (or statistically significant). Ifdifferences are identified as being statistically significant, we can say that we are 95%confident that the differences are real, and not simply due to chance (see Appendix B).
Key Points
• The achieved samples for Phase I (2001) and Phase II (2004) samples were broadly equivalent.
• In both phases, about 45% of students were males and approximately three-fifthsof students intended to sit the Junior Certificate mathematics examination at Higher level.
• 73 schools took part in the Phase II study. These were drawn from the Secondary, Vocational, and Community/Comprehensive sectors, and included schools of various size.
• The performance of students in 2004 was placed on the same scales that were developed in 2001, allowing for valid comparisons of achievement over time.
B15927 Buttons Inside_D1 10/9/07 6:01 PM Page 14

15
How did students performon the calculator tests?In this chapter, the performance of students on the calculator tests in 2001 and 2004 iscompared. First, overall performance is considered. Then performance in mathematicscontent areas assessed is examined. The chapter concludes with analyses of rough workrecorded by students in 2004 on their test booklets.
Overall Performance on the Calculator Tests in 2001 and 2004
Scale scores on the 2001 and 2004 tests can be compared directly, because scores areplaced on the same underlying scale using Item Response Theory. Comparison of rawscores and percent correct scores involved the items common to both the 2001 and 2004tests.
The mean score on the Calculator Inappropriate test in 2004 (a scale score of 243) waslower than in 2001 (250) (Figure 5.1). However, the difference is not statisticallysignificant. A similar finding emerged for the Calculator Optional test (no calculatoravailable condition). Students achieved a mean score of 227 in 2004, compared with 236in 2000, and again the difference is not statistically significant. Taken together, theseresults point to a non-siginficant drop in basic computational skills since 2001.
Students did better in 2004 than in 2001 on the two tests for which a calculator wasavailable. The mean score on the Calculator Optional test (calculator available condition)in 2004 was 272. This was greater than the mean score of 266 in 2001. However, thedifference is not large enough to reach statistical significance.
5
How did students perform on the calculator tests?
B15927 Buttons Inside_D1 10/9/07 6:01 PM Page 15

16
Pressing the Right Buttons: Calculator Use in Schools and in Junior Cycle Mathematics
Figure 5.1: Mean Scale Scores for the Calculator Inappropriate, Calculator Optional, and
Calculator Appropriate Tests, 2001 and 2004
* Denotes a significant difference in performance between 2001 and 2004
Students taking the Calculator Appropriate test in 2004 achieved a higher mean score(263) that students taking the same test in 2001 (250).The difference was statisticallysignificant. Students scoring at the 10th, 50th and 75th percentiles (but not the 90th) onthis test in 2004 achieved significantly higher scores than their counterparts in 2001.Hence, experience with use of the calculator seems to have benefited lower- achievingand average students to a greater extent that higher-achieving students.
While it is encouraging that performance on the Calculator Appropriate test in 2004 wasbetter than 2001, it must be acknowledged that mean percent correct scores on this testwere lower than on the other tests in both years. In 2004, the mean percent score on theCalculator Appropriate test was 41%, while in 2001, it was 35%. In contrast, the meanpercent correct score for the Calculator Inappropriate test in 2004 was 57%, while in2001, it was 60%. Hence, despite calculator availability, students do relatively less wellon the types of complex, real-life problem-solving items on the Calculator Appropriatetest, for which access to a calculator is viewed as being helpful.
Performance on Mathematics Content Areas in 2001 and 2004
Each item on the calculator tests was categorised according to the mathematics contentarea of the syllabus it addressed – Number Systems, Applied Arithmetic & Measure,Algebra, or Statistics. The overall results by content area for 2001 and 2004 when thethree tests are combined are presented in Table 5.1.
280
270
260
250
240
230
220
210
200
Inappropriate Optional Optional Appropriate*
(Access) (No Access)
2001
2004
B15927 Buttons Inside_D1 10/9/07 6:01 PM Page 16

17
Content Area
Number Systems*
Applied Arithmetic & Measure**
Algebra***
Statistics****
2001 2004
%
60.6
46.4
46.2
50.1
SE
1.79
1.87
2.92
2.11
%
60.8
45.7
48.3
49.8
SE
1.20
2.00
1.67
2.04
Table 5.1: Mean Percent Correct Scores, by Mathematics Content Areas
* 32 items; ** 41 items; *** 5 items; ****9 items
The lack of statistically significant changes in percent correct scores on each content area(on the three calculator tests combined) suggests that the overall mathematical skills ofstudents have not significantly changed on any of the major content areas over the three-year period of the study. When the results for each calculator test are analysed separately,however, several significant differences are discernible.
On the Calculator Optional test, the 2004 group who had access to calculators didsignificantly better than the 2001 group with access to calculators, on both NumberSystems and Algebra, and slightly better (though not significantly so) on AppliedArithmetic & Measure and Statistics. This finding indicates that students were able to usecalculators with somewhat greater effect on calculator optional tasks in these areas in2004 than in 2001. On the other hand students without access to a calculator for thistest did significantly less well on Number Systems in 2004 than in 2001.
As indicated above, in both 2001 and 2004, items on the Calculator Appropriate testwere more difficult for students than items on the other tests. Items which caused mostdifficultly were in the area of Applied Arithmetic & Measure, though there was asignificant increase in percent correct scores on this content area between 2001 and2004.
Performance on Individual Items
An item-by-item comparison within each calculator test identified items on which overallstudent performance significantly increased or decreased between 2001 and 2004. Onthe Calculator Inappropriate test, students in 2004 did significantly better on five of theseven items on which there was a significant difference. Items from the test for which thelargest increase and decrease were recorded are presented in Figure 5.2.
How did students perform on the calculator tests?
B15927 Buttons Inside_D1 10/9/07 6:01 PM Page 17

18
Pressing the Right Buttons: Calculator Use in Schools and in Junior Cycle Mathematics
Figure 5.2: Items on the Calculator Inappropriate Test on which There Was a Significant
Increase or Decrease in Percent Correct Scores between 2001 and 2004
SED = Standard Error of the Difference
On the Calculator Optional test, when students had access to calculators, overallperformance was higher in 2004 than in 2001, but not significantly so. However, whenitems were considered separately, there was a significant increase in performance on 13of them. Descriptions of two of these items are presented in Figure 5.3.
Figure 5.3: Sample Items on the Calculator Optional Test (Calculator Available) on which
There Was a Significant Increase in Percent Correct Scores Between 2001 and 2004
SED = Standard Error of the Difference
Increase
0.4956 corrected to 2 places of decimals is:
Difference = 10.0% SED = 2.5 95% CI = -14.9 to -5.1
The length of a rectangle is 6 cm, and its perimeter is 16 cm. What is the area of the
rectangle in square centimetres?
Difference = 11.0% SED = 5.1 95% CI = -21.2 to -0.8
Decrease
The Smith family uses about 6000 litres of water per week. Approximately how many
litres of water do they use per year?
Difference = -8.0% SED = 1.1 95% CI = 5.7 to 10.3
If x = 0.3, find the value of 5x.
Difference = -8.0% SED = 3.1 95% CI = 1.8 to 14.2
Increase
Find the value of x if 3(2x – 8) = 39
Diff = 28.0% SED = 4.7 95% CI = -37.4 to -18.7
Evaluate: 1 + (0.3)2
√0.25
Diff = 37.0% SED = 3.0 95% CI = -43.1 to -30.9
B15927 Buttons Inside_D1 10/9/07 6:01 PM Page 18

19
On the Calculator Optional test, when students had no access to calculators, students in2004 recorded significant increases in percent correct scores on 9 of the 14 items and asignificant drop on 5. Descriptors for the items on which the largest increases anddecreases in performance were noted are presented in Figure 5.4.
Figure 5.4: Sample Items on the Calculator Optional Test (No Calculator Access) on which
There was a Significant Increase or Decrease in Percent
Correct Scores between 2001 and 2004
SED = Standard Error of the Difference
On the Calculator Appropriate test, on which there were 27 common items, students in2004 performed significantly better than students in 2001 on 18 items, and significantlyless well on one. Descriptions of selected items, including the item for which there was asignificant decrease, are presented in Figure 5.5.
How did students perform on the calculator tests?
Increase
Find the value of 3.8 + (3.2 x 6)
Difference = 15.0% SED = 3.6 95% CI = -22.3 to -7.7
In a sale the price of a piece of furniture was reduced by 10%. The sale price was
€1215. What was the price before the sale?
Difference = 16.0% SED = 5.7 95% CI = -27.5 to -4.5
Decrease
Multiply: 9.2 x 2.5
Difference = -20.0% SED = 1.4 95% CI = 17.3 to 22.7
Divide: .04 / 2.456
Difference = -11.0% SED = 2.8 95% CI = 5.4 to 16.6
B15927 Buttons Inside_D1 10/9/07 6:01 PM Page 19

20
Pressing the Right Buttons: Calculator Use in Schools and in Junior Cycle Mathematics
Figure 5.5: Sample Items on the Calculator Appropriate Test (No Calculator Access) on
which There was a Significant Increase or Decrease in
Percent Correct Scores between 2001 and 2004
Investigation of Students’ Rough Work
An analysis of the calculations recorded in the ‘Rough Work column’ of each testprovides some insight as to how the students responded the test questions.
In 2001 the investigation of students’ work was undertaken using a small, representativeselection of the scripts. These students were more likely to show their work when theydid not have access to a calculator than when they had access. On the CalculatorAppropriate test, few students recorded any work in the rough work column. For itemson the Calculator Inappropriate test requiring estimation, students tended to find exactanswers using pen and paper or, in multi-choice format, to state that the correct answerwas not given.
In 2004 all scripts were analysed in terms of rough work usage. The mean number andpercent of rough work records per student per test is presented in Table 5.2. Predictably,the highest proportion of rough work was found for students who took the CalculatorOptional test without access to calculators. Where calculators were available, there was asubstantial reduction in the amount of rough work shown. Correlations between volumeof rough work and mean scale scores on the calculator tests are all positive andsignificant. Hence, students who produced more rough work generally did better on thecalculator tests than students who produced less rough work. The strongest correlationwas for the Calculator Optional test (no access to calculator) (0.51), and weakest for theCalculator Inappropriate test (0.36), in which many of the items were designed to bedone mentally.
Increase
Fill in the missing operations (+, -, x, ÷):
27 (36 11) = 675
Difference = 30.0% SED = 1.2 95% CI = -32.5 to -27.5
Find √524 and give your answer correct to two decimal places.
Difference = 30.0% SED = 3.2 95% CI = -36.4 to -23.6
Decrease
Two successive electricity meter readings were 84 015 and 85 228. All units are charged
at 7.14 cent per unit. Calculate the bill for the period, including VAT at 10%.
Difference = -6.0% SED = 1.2 95% CI = 3.6 to 8.4
B15927 Buttons Inside_D1 10/9/07 6:01 PM Page 20

21
Test
Inappropriate
Optional (Calc)
Optional (No Calc)
Appropriate (Bk 1)
Appropriate (Bk 2)
No. of Items
25
33
33
15
15
Mean no of RWrecords/student
8.1
9.7
18.2
3.9
4.3
Mean % of RWrecords/student
32.2
30.3
56.9
26.1
28.3
Table 5.2: Extent of Rough Work Usage by Students on the Calculator Tests (2004)
Key Points
• In 2004, students performed less well on the tests for which they did not have calculator access than in 2001. However, differences in performance on the Calculator Inappropriate and Calculator Optional tests (without calculator access) were not statistically significant. This can be interpreted as indicating thatthe integration of calculators into the Junior Certificate mathematics classes has not, as feared, had a detrimental effect on students’ basic mathematics skills.
• In 2004, students performed better on the tests for which they had access to a calculator than in 2001. The improvement was statistically significant on the Calculator Appropriate test, but not on the Calculator Optional (with calculator access) test. The improved performance on the Calculator Appropriate test suggests that students’ ability to make use of the calculator in solving problems improved over the three years.
• Access to a calculator for the Calculator Optional test provided a clear advantage,compared with no calculator access.
• Incidence of rough work was highest on the Calculator Optional test (with no calculator access), and substantially lower on the Calculator Optional (with calculator access), the Calculator Inappropriate, and the Calculator Appropriate tests.
• Students who produced more rough work performed better on the calculator tests than students who produced less rough work.
How did students perform on the calculator tests?
B15927 Buttons Inside_D1 10/9/07 6:01 PM Page 21

22
Pressing the Right Buttons: Calculator Use in Schools and in Junior Cycle Mathematics
What were students’attitudes to calculators?This chapter examines associations between student variables and performance on thecalculator tests. First, associations among gender, socioeconomic status, and performanceare described; then students’ access to, and use of, calculators are considered; finally,students’ attitudes to mathematics and to calculator use are examined. Responses for2004 are based on the 1448 students who completed the Student Questionnaire.
Gender and Socioeconomic Status
As in 2001, there were no statistically significant gender differences in performance onany of the calculator tests. However, there were some non-significant differences. Femalestudents were marginally ahead of males on just one test in 2001 (Calculator Optional),but were marginally ahead on two in 2004 (the Calculator Optional and CalculatorAppropriate tests).
Based on the occupation of their parents, each student was identified as belonging to theupper, middle, or lower socioeconomic group (SEG). In both 2001 and 2004, studentsin the upper SEG achieved mean scores that are significantly higher than those ofstudents in the lower SEG on all three calculator tests. In 2004, but not in 2001,students in the middle SEG significantly outperformed their counterparts in the lowerSEG on all three tests.
Students’ Access to and Use of Calculators
In 2004, almost all students reported that they owned, or had access to, a calculator atschool and at home. Scientific calculators were most popular, and less than 1% ofstudents used, or had access to, a graphics calculator.
Students were asked about the frequency of calculator use in four subjects: Mathematics,business studies, science, and technology. While 81% of students used a calculator ‘often’in mathematics and 62% did so with the same frequency in business studies, less than3% reported using a calculator ‘often’ in science, and three-quarters ‘never’ used one intechnology.
When asked about calculator usage at primary school, 72% of students reported thatthey never used a calculator in their primary mathematics classes, while 3% reportedusing it ‘often’. With regard to the frequency of calculator usage in different areas ofmathematics at post-primary level, just over 10% of students reported that they never
6
B15927 Buttons Inside_D1 10/9/07 6:01 PM Page 22

23
used a calculator in their First year mathematics classes, though by Second year, thisfigure had dropped to 5%. The frequency of calculator use in Third year in eachmathematics area is displayed in Table 6.1. On average, students who reported using acalculator ‘a lot’ in a particular area tended to achieve higher scores on the Calculatortests than students who did not.
Comparisons with 2001, not surprisingly, show increased calculator usage inmathematics classes, from fewer than 1% using a calculator ‘often’ in 2001, to over 80%in 2004. Calculator use in business studies classes remained about the same, while therewas a slight increase in use in both science (0.6%) and technology (5.2%) classes.
* These areas, rather than the content areas referred to in the syllabus, were used in the student questionnaire
Students’ Attitudes to Mathematics
Students responded to a series of attitudinal questions relating to mathematics andcalculators. Females had more positive attitudes towards mathematics than had males,while males had a significantly stronger belief about the usefulness of mathematics.
The easiest areas of mathematics, according to students, were Graphs followed byFractions, Decimals & Percentages, Statistics, and Algebra, while the most difficult areaswere Geometry and Trigonometry. Interestingly, when these are compared with the areasteachers identified as easy or difficult to teach (see Chapter 7), Functions & Graphs, andNumber Systems were identified as easiest to teach, while Geometry and Trigonometrywere considered more difficult.
Area*
Fractions, Decimals & Percentages
Length, Area, Volume & Time
Algebra
Statistics
Geometry
Trigonometry
Graphs
n
1409
1402
1407
1394
1361
1332
1398
A lot
52.0
54.2
25.0
30.6
23.1
42.3
13.9
Never
5.4
4.9
25.5
12.7
24.0
14.8
36.0
To someextent
42.6
40.9
49.6
56.8
53.0
42.9
50.2
Table 6.1: Percentages of Students Indicating Various Levels of Calculator Usage in
Different Mathematics Content Areas (2004)
What is the background to the study?
B15927 Buttons Inside_D1 10/9/07 6:01 PM Page 23

24
Pressing the Right Buttons: Calculator Use in Schools and in Junior Cycle Mathematics
Students’ Attitudes to Calculators
The proportions of students who ‘agreed’ or ‘strongly agreed’ that a calculator can helpwith performance and that its use should be allowed for class and homework increasedfrom two-thirds in 2001, to over 90% in 2004. Similar proportions in 2004 believed thatcalculators were not only for students with difficulties in mathematics, and that acalculator should not replace the need for pen and paper calculations.
Student attitudes to calculator use in mathematics and other subjects were mixed.Students who supported the availability of calculators across subjects includingmathematics tended to perform better on the Calculator Appropriate test than those whodid not. On the other hand, students who were more negatively disposed to calculatorusage, and felt it could make them lazy at school mathematics tended to do less well oneach of the calculator tests than students who did not hold such views. Aspects ofcalculator use that students enjoyed most were the ease and speed of computation andthe convenience for basic operations, algebra, and fractions. The main perceiveddisadvantages of calculator use were the greater potential for making mistakes, difficultyin using the calculator, and a fear that calculators ‘do not engage the brain’. Theproportion of students who believed a calculator could make them lazy at schoolmathematics decreased from 55% in 2001 to 41% in 2004.
Key Points
• In 2004, females outperformed males on the Calculator Optional and Calculator Appropriate tests, though differences were not statistically significant.
• Students from higher socioeconomic backgrounds performed significantly higheron all three calculator tests than students from lower socioeconomic backgrounds in both 2001 and 2004.
• Almost three-quarters of students in 2004 reported that they had never used a calculator in their mathematics classes at primary level, though the vast majority of these would have completed primary school before the implementation of the 1999 Primary School Curriculum.
• There was a large increase in calculator usage in mathematics classes, from fewerthan 1% using a calculator ‘often’ in 2001, to over 80% using one ‘often’ in 2004.
• Between 2001 and 2004, there was a substantial increase in the proportion of students who believed a calculator could help mathematics performance and thatit should be used in class and at home.
• Students in the 2004 study enjoyed the ease and speed of computations when using a calculator, though some expressed concern over the potential for error.
• Students reported Functions & Graphs, and Number Systems as the easiest aspects of Mathematics, and Geometry and Trigonometry as the most difficult aspects.
B15927 Buttons Inside_D1 10/9/07 6:01 PM Page 24

25
What were teachers’attitudes to calculators?A Teacher Questionnaire was administered in both 2001 and 2004. This chapterexamines teachers’ attitudes towards the use of calculators in Junior Cycle mathematicsclasses and in the Junior Certificate mathematics examination.
Background of Teachers
There was no significant difference between 2001 and 2004 in the proportion ofstudents taught by male and female teachers (marginally more students were taught byfemale rather than male teachers in 2004). There was, however, an increase in teachers’level of experience, with more students in 2004 (32%) taught by teachers with morethan 25 years experience, than in 2001 (19%). The majority of students in 2004 (almosttwo-thirds) were taught by teachers who regarded any negative effect of the JuniorCertificate mathematics examination on students’ progress in mathematics as minimal.
While teachers in 2004 reported Algebra and Statistics as the most enjoyable contentareas to teach, most also perceived Algebra to be one of the areas that students have mostdifficultly with (along with Trigonometry and Geometry).
School Policy on Calculators
Just over one-fifth (22%) of students in the 2004 study were taught by teachers who saidthat their school had a policy on calculators, and approximately a quarter of these werein schools in which the policy was described as official. In the minority of schools inwhich policies were in place, they had been agreed among mathematics teachers (70% ofstudents); they required that calculator use be taught in First year (57%); and theyforbade the use of mobile phones as calculators (89%).
Use of Calculators in Junior Cycle Mathematics Classes
Although many teachers of students in the 2001 study did not permit calculator use forhome or class work at that time, almost three-quarters were in favour of calculator usewhere relevant. By 2004, when students were permitted to use calculators in the JuniorCertificate mathematics examination, most pupils (almost 90%) were taught by teacherswho were in favour of calculator use for mathematics class work and homework.
7
What were teachers’ attitudes to calculators?
B15927 Buttons Inside_D1 10/9/07 6:01 PM Page 25
26
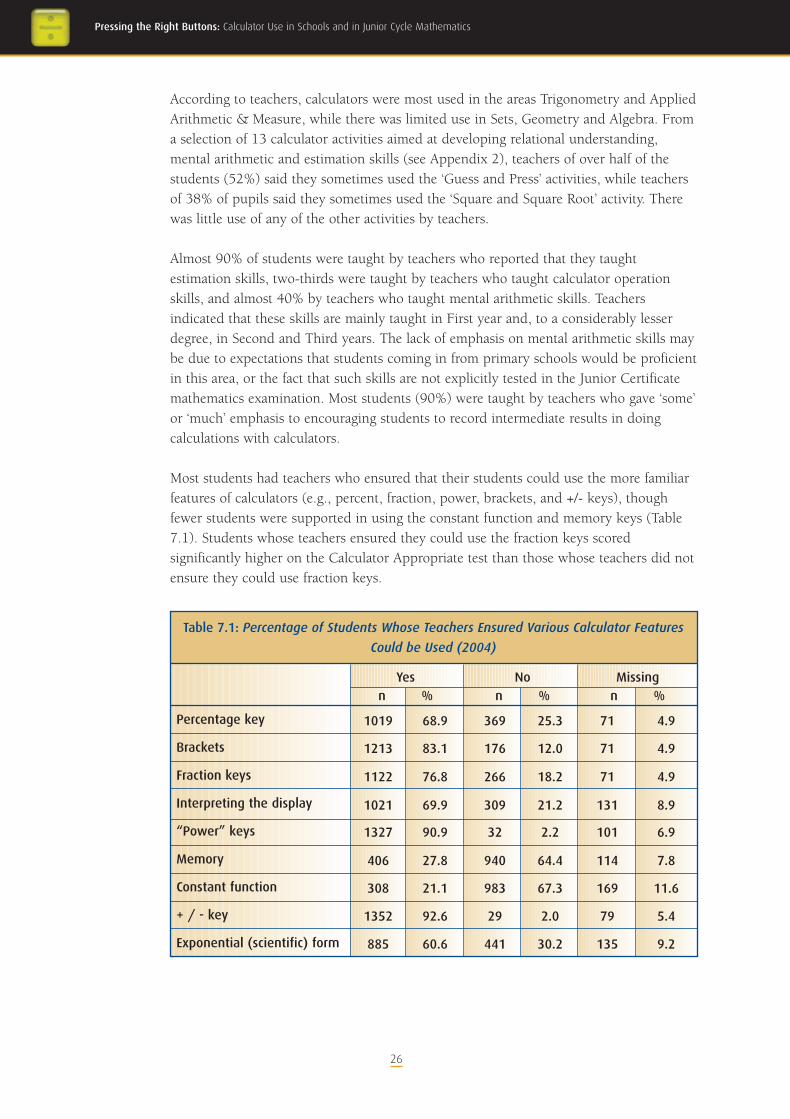
According to teachers, calculators were most used in the areas Trigonometry and AppliedArithmetic & Measure, while there was limited use in Sets, Geometry and Algebra. Froma selection of 13 calculator activities aimed at developing relational understanding,mental arithmetic and estimation skills (see Appendix 2), teachers of over half of thestudents (52%) said they sometimes used the ‘Guess and Press’ activities, while teachersof 38% of pupils said they sometimes used the ‘Square and Square Root’ activity. Therewas little use of any of the other activities by teachers.
Almost 90% of students were taught by teachers who reported that they taughtestimation skills, two-thirds were taught by teachers who taught calculator operationskills, and almost 40% by teachers who taught mental arithmetic skills. Teachersindicated that these skills are mainly taught in First year and, to a considerably lesserdegree, in Second and Third years. The lack of emphasis on mental arithmetic skills maybe due to expectations that students coming in from primary schools would be proficientin this area, or the fact that such skills are not explicitly tested in the Junior Certificatemathematics examination. Most students (90%) were taught by teachers who gave ‘some’or ‘much’ emphasis to encouraging students to record intermediate results in doingcalculations with calculators.
Most students had teachers who ensured that their students could use the more familiarfeatures of calculators (e.g., percent, fraction, power, brackets, and +/- keys), thoughfewer students were supported in using the constant function and memory keys (Table7.1). Students whose teachers ensured they could use the fraction keys scoredsignificantly higher on the Calculator Appropriate test than those whose teachers did notensure they could use fraction keys.
Pressing the Right Buttons: Calculator Use in Schools and in Junior Cycle Mathematics
Percentage key
Brackets
Fraction keys
Interpreting the display
“Power” keys
Memory
Constant function
+ / - key
Exponential (scientific) form
Yes
n %
No
n %
Missing
n %
68.9
83.1
76.8
69.9
90.9
27.8
21.1
92.6
60.6
1019
1213
1122
1021
1327
406
308
1352
885
369
176
266
309
32
940
983
29
441
25.3
12.0
18.2
21.2
2.2
64.4
67.3
2.0
30.2
71
71
71
131
101
114
169
79
135
4.9
4.9
4.9
8.9
6.9
7.8
11.6
5.4
9.2
Table 7.1: Percentage of Students Whose Teachers Ensured Various Calculator Features
Could be Used (2004)
B15927 Buttons Inside_D1 10/9/07 6:01 PM Page 26

The percentage of students taught by teachers who allowed the use of calculators at alltimes increased from 38 in First year to 78 in Third year. Most students in the 2004study were taught by teachers who indicated that they encouraged or required the use ofsome sort of method to check the answers students obtained with their calculators.
Just over half of students (56%) were taught by teachers who stated that the availabilityof calculators in class had affected their teaching methods. The areas where theyconsidered their teaching methods to have been affected most included Statistics,Trigonometry, Sets, and Applied Arithmetic & Measure. Specific comments by teachersincluded references to students’ ability to check answers, quicker and more accuratecalculations, benefits of the calculator to weaker students, and more time available forteaching methods.
Perceived Advantages and Disadvantages of Calculator Access inJunior Certificate Mathematics
More than four-fifths of students were taught by teachers who indicated that a calculatorwas beneficial in improving accuracy in students’ work, and in increasing their ability tomove through topics. However, almost 50% of the students were taught by teachers whosaw no benefit in calculator access for the clarification of concepts and procedures.When the teachers were asked to specify particular benefits, responses fell under themain categories of saving time, greater ease of teaching some topics, and giving students(especially weaker students) confidence and independence.
Ninety percent of the students were taught by teachers who said they had little or noproblem in teaching students how to use the calculator within each topic. When askedto specify drawbacks of calculators, responses referred to loss or breakage of calculators,use of incorrect mode, inappropriate use of or over-reliance on calculators, and a declinein various aspect of numeracy (mental arithmetic, estimation, concepts, tables,computational skills).
Graphics calculators and computer algebra systems (CAS) were rarely used at JuniorCycle level in Ireland. Indeed, only 5% of students were taught by teachers who said thatthe school had a set of graphics calculators. Eight percent of students were taught byteachers who said their schools had at least one CAS calculator.
Almost two-thirds of students were taught by teachers who said they made different useof calculators with lower-achieving students than with other students. The students ofthese teachers scored significantly higher on the Calculator Appropriate test than did thestudents of teachers who said they did not make different use of calculators.
27
What were teachers’ attitudes to calculators?
B15927 Buttons Inside_D1 10/9/07 6:01 PM Page 27

28
Teachers’ General Comments
Teachers were invited to add further comments at the end of the questionnaire. Most ofthe comments can be clustered into the following groups:
• General attitudes to calculator use, both positive and negative.• Recognition of specific advantages of calculator use (less drudgery, support for
lower-performing students, benefits for particular topics) and disadvantages (loss of mental arithmetic and computational skills).
• Attribution of blame for difficulties to primary schools.• Recognition that calculators are a feature of everyday life.• Policy issues (for example, with respect to non-use of calculators in First year,
and provision for ‘calculator free’ days).
Key Points
• About 22% of students in the 2004 study were taught by teachers who said that their school had a policy on calculators, and approximately a quarter of these had an ‘official’ policy.
• Most students (86%) were taught by teachers who were supportive of calculator use for mathematics class work and homework.
• The teaching of estimation, calculation, and mental arithmetic skills occurs largely in First year.
• Just over half of students were taught by teachers who stated that the availability of calculators in class had affected their teaching methods, particularly the areas of Statistics, Trigonometry, Sets, and Applied Arithmetic & Measure.
• According to teachers, the benefits of calculator use included saving time, greaterease of teaching some topics, and increasing confidence and independence among students, especially the weaker ones.
• Disadvantages of calculator use included practical management issues, inappropriate use of or over-reliance on the calculator, difficulty in usingcalculators effectively, and a possible decline in some aspects of numeracy.
Pressing the Right Buttons: Calculator Use in Schools and in Junior Cycle Mathematics
B15927 Buttons Inside_D1 10/9/07 6:01 PM Page 28

How did students’performance on thecalculator tests and theJunior Certificatemathematics examinationcompare?The relationship between the performance of students on the calculator tests (taken inNovember 2004) and their performance on the Junior Certificate mathematicsexamination (taken in June 2005) is considered in this chapter.
Performance of Students on the Calculator Tests and the 2005Junior Certificate Mathematics Examination
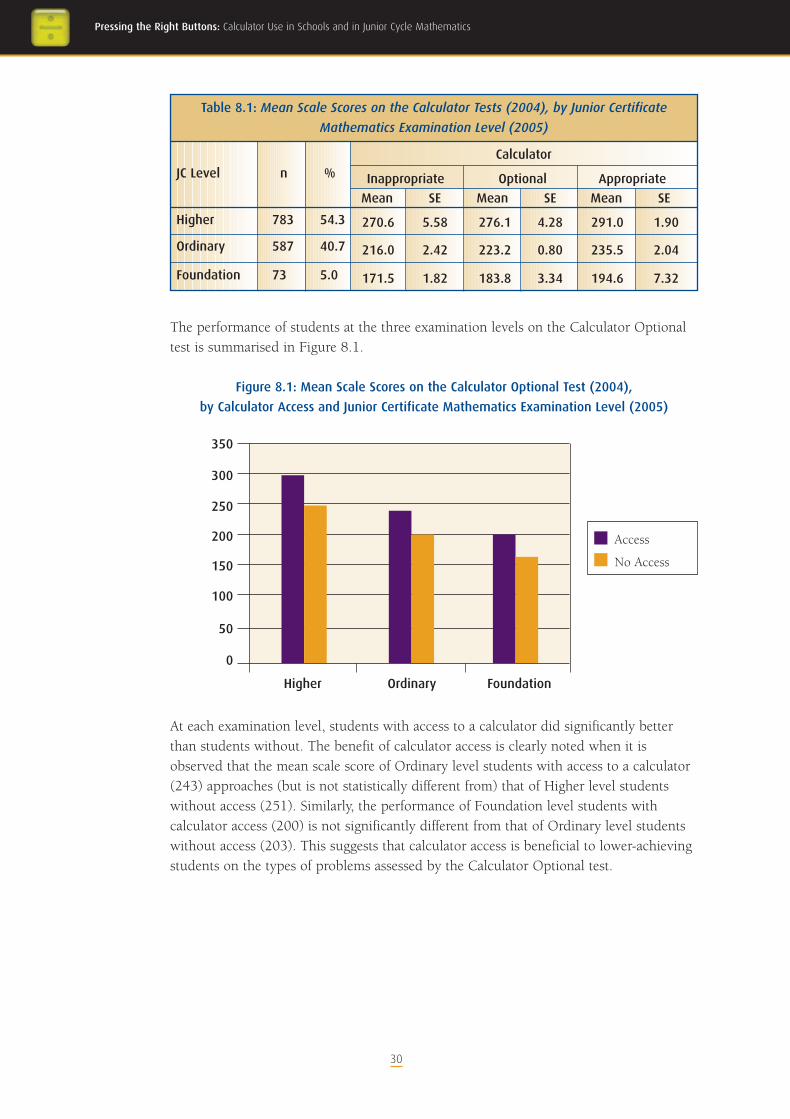
Students’ 2005 Junior Certificate results were matched to their calculator test results. Ofthose matched, over half (54%) sat the Higher level, 41% sat the Ordinary level, and 5%sat the Foundation level paper. The mean scores on the Calculator Inappropriate andCalculator Appropriate tests of students taking the Higher level mathematics examinationwere 271 and 291 respectively (Table 8.1). These were significantly higher than thecorresponding mean scores of students taking Ordinary level (216 and 236) andFoundation level (172 and 195).
29
How did students’ performance on the calculator test and theJunior Certificate mathematics examination compare?
8
B15927 Buttons Inside_D1 10/9/07 6:01 PM Page 29
30
JC Level n %
Higher 783 54.3
Ordinary 587 40.7
Foundation 73 5.0
Inappropriate
Mean SE Mean SE Mean SE
Optional Appropriate
5.58
2.42
1.82
270.6
216.0
171.5
276.1
223.2
183.8
4.28
0.80
3.34
291.0
235.5
194.6
1.90
2.04
7.32
Calculator
350
300
250
200
150
100
50
0
Higher Ordinary Foundation
Access
No Access
Table 8.1: Mean Scale Scores on the Calculator Tests (2004), by Junior Certificate
Mathematics Examination Level (2005)
The performance of students at the three examination levels on the Calculator Optionaltest is summarised in Figure 8.1.
Figure 8.1: Mean Scale Scores on the Calculator Optional Test (2004),
by Calculator Access and Junior Certificate Mathematics Examination Level (2005)
At each examination level, students with access to a calculator did significantly betterthan students without. The benefit of calculator access is clearly noted when it isobserved that the mean scale score of Ordinary level students with access to a calculator(243) approaches (but is not statistically different from) that of Higher level studentswithout access (251). Similarly, the performance of Foundation level students withcalculator access (200) is not significantly different from that of Ordinary level studentswithout access (203). This suggests that calculator access is beneficial to lower-achievingstudents on the types of problems assessed by the Calculator Optional test.
Pressing the Right Buttons: Calculator Use in Schools and in Junior Cycle Mathematics
B15927 Buttons Inside_D1 10/9/07 6:01 PM Page 30

Correlations between Calculator Test Performance and 2005Junior Certificate Grades in Mathematics
Correlations between students’ performance on the calculator tests in November 2004and their grades in their 2005 Junior Certificate mathematics examination2 are strong,positive, and statistically significant (in the range of 0.4 to 0.5) for Higher and Ordinarylevels, but lower for the Foundation level (0.0 to 0.3). The stronger correlations forHigher and Ordinary suggest that the calculator tests better capture the range ofachievement among students at these levels.
Setting aside the level of the Junior Certificate mathematics examination taken, thecorrelation between scaled Junior Certificate mathematics grade and performance on theCalculator Inappropriate test is 0.70, while for the Calculator Appropriate test it is 0.69.For the Calculator Optional test, the correlation is stronger when students had access toa calculator (0.8) than when they did not (0.7), though this is not the case for 2001.Taken together, the correlations reported here support the validity of the calculator testsas suitable instruments for assessing aspects of the taught Junior Certificate mathematicscourse.
Performance on Junior Certificate Mathematics (2001 to 2005)
This section looks at performance on the Junior Certificate mathematics examination inthe two years preceding first examination of the revised syllabus (2001, 2002), and inthe first three years succeeding it. In considering the data presented in Figure 8.2, itshould be noted that changes in grade distributions may arise for a variety of reasonsother than calculator availability, including variation in the proportion of students takingeach examination level, the intrinsic difficulty of the questions, and the nature of thescoring schemes. The proportion of students achieving A to C grades at higher levelincreased at first examination of the revised syllabus in 2003, but, by 2005, had revertedto the 2001 level. At Ordinary level, more students achieved grades A to C in 2003 and2004 and unlike Higher level the proportion achieving A to C in 2005 exceeded that for2002. It is also noticeable that the proportion of students achieving grade E or lower atFoundation level, while comparatively low in 2003 and 2004, increased in 2005. Thismay, however, reflect a shift of students from Foundation to Ordinary level, with somevery low achievers representing a greater proportion of Foundation level students in2005 than in earlier years.
31
2 Numerical values were assigned to students’ grades, ranging from 1 (Grade F at Foundation level) to 12(Grade A at Higher level)
How did students’ performance on the calculator testsJunior Certificate Mathematics examination compare?
B15927 Buttons Inside_D1 10/9/07 6:01 PM Page 31

32
Figure 8.2: Performance on the Junior Certificate Mathematics Examination,
by Level (2001 to 2005)3
Pressing the Right Buttons: Calculator Use in Schools and in Junior Cycle Mathematics
3 (Source – State Examination Commission; http://www.examinations.ie)
100
80
60
40
20
0
Perc
enta
ge
2001 2002 2003 2004 2005
Higher Level
A-C
D
E-NG
100
80
60
40
20
0
Perc
enta
ge
2001 2002 2003 2004 2005
Ordinary
A-C
D
E-NG
100
80
60
40
20
0
Perc
enta
ge
2001 2002 2003 2004 2005
Foundation Level
A-C
D
E-NG
B15927 Buttons Inside_D1 10/9/07 6:01 PM Page 32

Key Points
• Students taking Higher level mathematics in 2005 achieved significantly higher scores than Ordinary or Foundation level students on each of the three calculator tests.
• For students taking each examination level, mean scale scores were significantly higher on the Calculator Optional test when students had access to a calculator than when they did not.
• The mean scale score of Ordinary level students with access to a calculator on the Calculator Optional test was not significantly different from that of Higher level students without access.
• Similarly, there was no difference in the performance of Ordinary level students with no calculator access and Foundation level students with access on the same test. These findings indicate calculator access can narrow the gap between students of differing ability levels on the types of problems assessed by the Calculator Optional test.
• In general, the proportion of students achieving an ‘A to C’ grade increased following implementation of the revised syllabus (first examined in 2003). The greatest improvement was noted for Ordinary level students.
33
How did students’ performance on the calculator testsJunior Certificate Mathematics examination compare?
B15927 Buttons Inside_D1 10/9/07 6:01 PM Page 33

34
Pressing the Right Buttons: Calculator Use in Schools and in Junior Cycle Mathematics
What can we learn fromthe study?The main goal of Phase I of the study, implemented in 2001, was to assess Junior Cyclestudents’ performance on key areas of numeracy in the mathematics curriculum in placeat the time when calculators played no part in the curriculum or Junior Certificatemathematics examination. Phase II of the study was carried out in 2004, followingimplementation of a curriculum in which calculator usage was actively promoted, toobtain data in the same key areas, and to compare with the data from Phase I.
As was the case in 2001, average percent correct scores in 2004 on the CalculatorInappropriate test are significantly higher than on the Calculator Optional test. Averagescores on both these tests are significantly higher than scores on the CalculatorAppropriate test, supoorting the validity of the study design and the stability of the tests.
In both 2001 and 2004, students with access to a calculator did significantly better onthe Calculator Optional test than students who did not have access.
With regard to the effects of the calcultor on mathematics achievement over time, theperformance of students in 2004 who did not have access to a calculator on theCalculator Optional test was lower than in 2001, though not to a significant extent.When students did have calculator access, however, their performance in 2004 on theCalculator Optional and Calculator Appropriate tests was significantly higher than in2001.
Where Junior Certificate mathematics examination level is concerned, the benefit ofcalculator access is evident. On the Calculator Optional test, the mean scale score ofOrdinary-level students who had access to a calculator approached, and was notsignificantly different from, the mean score of Higher level students without access to acalculator.
The non-significant decrease in performance on the Calculator Inappropriate andCalculator Option tests, when students do not have calculator access, should bemonitored over time, but should not be cause for concern unless this trend is shown tocontinue. There are many factors besides calculator availability which should be takeninto consideration. Firstly, changes in the syllabus were not limited to those involvingcalculator usage. For example, efforts were made to change teachers’ instructional andassessment processes through the provision of inservice. The potential for cultural anddemographic changes in the three years between each phase and marginal differences inthe achieved samples may also be associated with these changes. The attitudes of bothteachers and students to calculators could be another important factor. In 2004, almosthalf of students were taught by teachers who stated that the availability of calculators inclass had not affected their teaching methods, and a similar proportion saw no benefit in
9
B15927 Buttons Inside_D1 10/9/07 6:01 PM Page 34

35
calculator access for the explanation of concepts and procedures, suggesting thatpedagogy may not have developed in line with the implementation of the revisedsyllabus.
Recommendations based on the findings of the two phases of this study are as follows:
1. Given the small, though non-significant, fall in performance on the Calculator Inappropriate test between 2001 and 2004, it is recommended that the calculator tests be administered again in the near future to determine if there is any further change in performance on the key numeracy skills assessed by the test.
2. Given the relatively poor performance of students on the Calculator Appropriate test in 2001 and 2004 and the findings of the PISA 2003 mathematics assessment, it is recommended that more attention be given to realistic problem-solving in the Junior Cycle mathematics curriculum and examinations.
3. Arising from the analysis of students’ rough work across the three tests, it is recommended that students be taught more about how, when, and when not to use calculators in mathematics, and when (and when not) to support calculator work with rough paper-and-pencil calculations.
4. Post-primary schools should be encouraged, where appropriate, to reassess the typeand extent of use of calculators in First year and Second year, based on the evidenceof this study and in the light of calcultors being permitted in the primary schoolmathematics curriculum for Fourth, Fifth and Sixth Classes.
5. Given the finding that students taught how to use specific calculator keys (such as fraction keys) performed better than students not taught their use, students should be taught how to make intelligent use of basic calculator keys and to exploit the power provided by more sophisticated functions such as fraction and memory keys.
6. Based on the Teacher Questionnaire findings, more attention should be given in publications and teacher professional development initiatives to uses of calculators for developing understanding of specific concepts and procedures, estimation skills, and use of real-life problems and data, and not simply for checking answers.
7. Given the finding in this study on the benefits of the use of calculators to teach lowerachievers in mathematics, efforts should made through classroom studies and other means, to develop best practice for use of calculators with low-achievers.
8. Given their usefulness for teaching algebra and functions and their lack of use by teachers in this study, consideration should be given to encouraging greater use of graphics calculators in the Junior Cycle mathematics curriculum.
9. Given the lack of a formal policy on calculators in many post-primary schools, allsuch schools should be encouraged to develop a policy.
What can we learn from the study?
B15927 Buttons Inside_D1 10/9/07 6:01 PM Page 35

36
Pressing the Right Buttons: Calculator Use in Schools and in Junior Cycle Mathematics
10. The results of this and other relevant studies should be made available to primary school teachers to inform their views about the effects of calculators on student mathematical development, and the implications of calculator availability for teaching estimation and other numeracy skills.
11. A study should be carried out in the near future to assess primary teachers’ views on,and extent of, calculator use in senior primary classes.
B15927 Buttons Inside_D1 10/9/07 6:01 PM Page 36

37
ReferencesBeaton, A.E., Mullis, V.S., Martin, M.O., Gonzalez, E.J., Kelly, D.L., & Smith, T. A.(1996). Mathematics achievement in middle schools: IEA’s Third International Mathematics and
Science Study. Chestnut Hill, MA: TIMSS International Study Centre, Boston College.
Bridgeman, B., Harvey, A., & Braswell, J. (1995). Effects of calculator use on scores on atest of mathematical reasoning. Journal of Educational Measurement, 32(4), 323 - 340.
Close, S., Oldham, E., Shiel, G., Dooley, T., Hackett, D., & O'Leary, M. (2004). The
effects of calculator use on mathematics in schools and in certificate examinations; Final report
on Phase 1. Dublin: St. Patrick's College
Close, S., Oldham, E., Surgenor, P., Shiel, G., Dooley, T., & O'Leary, M. (2007). The
effects of calculator use on mathematics in schools and in certificate examinations; Final report
on Phase II. Dublin: St. Patrick's College
DES/NCCA. (Department of Education and Science/National Council for Curriculumand Assessment) (1999). Curriculum for primary schools – Mathematics content. Dublin:Stationery Office
DES/NCCA. (Department of Education and Science/National Council for Curriculumand Assessment) (2000). Junior Certificate mathematics syllabus: Higher, Ordinary and
Foundation level. Dublin: Stationery Office.
DES/NCCA. (Department of Education and Science/National Council for Curriculumand Assessment) (2001). Calculators: Guidelines for second level schools. Dublin: StationeryOffice.
DES/NCCA. (Department of Education and Science/National Council for Curriculumand Assessment) (2002). Mathematics – Junior Certificate: Guidelines for teachers. Dublin:Stationery Office.
Dunham, P. H. (2000). Hand-held calculators in mathematics education: A researchperspective. In E. D. Laughbaum (Ed.), Hand-held technology in mathematics and science
education: A collection of papers (pp. 39 - 47). Columbus, OH: The Ohio State University.
Groves, S. & Stacey, K. (1998). Calculators in primary mathematics: exploring numberbefore teaching algorithms. In L.J. Morrow & M.J. Kenney (Eds.), The teaching and
learning of algorithms in school mathematics: 1998 yearbook (pp. 120-129). Reston, Virginia:National Council of Teachers of Mathematics.
References
B15927 Buttons Inside_D1 10/9/07 6:01 PM Page 37

38
Hembree, R. and Dessart, J.D. (1986). Effects of hand held calculators in precollegemathematics education: A meta-analysis. Journal for Research in Mathematics Education,17(2), 83-99.
Hembree, R. and Dessart, J.D. (1992). Research on calculators in mathematics education.In J.T. Fey and C.R. Hirsch (Eds.), Calculators in mathematics education: 1992 yearbook
(pp. 23-32). Reston, Virginia: National Council of Teachers of Mathematics.
Hedrén, R. (1985). The hand-held calculator at the intermediate level. Educational Studies
in Mathematics 16, 163-179.
Hopkins, M.H. (1992). The use of calculators in assessment of mathematicsachievement. In J.T. Fey and C.R. Hirsch (Eds.), Calculators in mathematics education:
1992 yearbook (pp. 158-166). Reston, Virginia: National Council of Teachers ofMathematics.
Mullis, V.S., Martin, M.O., Gonzalez, E.J., Gregory, K.D., Garden, R.A., O’Connor, M.,Chrostowski, S.J., & Smith, T.A. (2000). TIMSS international mathematics report: Findings
from the IEA’s Repeat of the Third International Mathematics and Science Study at the eighth
grade. Chestnut Hill, MA: TIMSS International Study Centre.
Mullis, I. V. S., Martin, M. O., Gonzalez, E. J., & Chrostowski, S. J. (2004). Findings from
IEA's Trends in International Mathematics and Science Study at forth and eighth Grades.Chestnut Hill, MA: TIMSS and PIRLS International Study Center.
NCCA. (National Council for Curriculum and Assessment). (2005). Primary curriculum
review: Phase 1. Dublin: Author.
Ruthven, K. (1995). Pupils’ views of number work and calculators. Educational Research,37(3), 229-237.
Schmidt, M.E. (1999). Middle grade teachers’ beliefs about calculator use: Pre-projectand two years later. Focus on Learning Problems in Mathematics, 21(1), 18-34.
Shiel, G., Surgenor, P., Close, S., & Millar, D. (2006). The 2004 National Assessment of
Mathematics Achievement. Dublin: Educational Research Centre.
Shuard, H. (1992). CAN: Calculator use in the primary grades in England and Wales. InJ.T. Fey & C.R. Hirsch (Eds.), Calculators in mathematics education: 1992 yearbook (pp.33-45). Reston, Virginia: National Council of Teachers of Mathematics.
Pressing the Right Buttons: Calculator Use in Schools and in Junior Cycle Mathematics
B15927 Buttons Inside_D1 10/9/07 6:01 PM Page 38
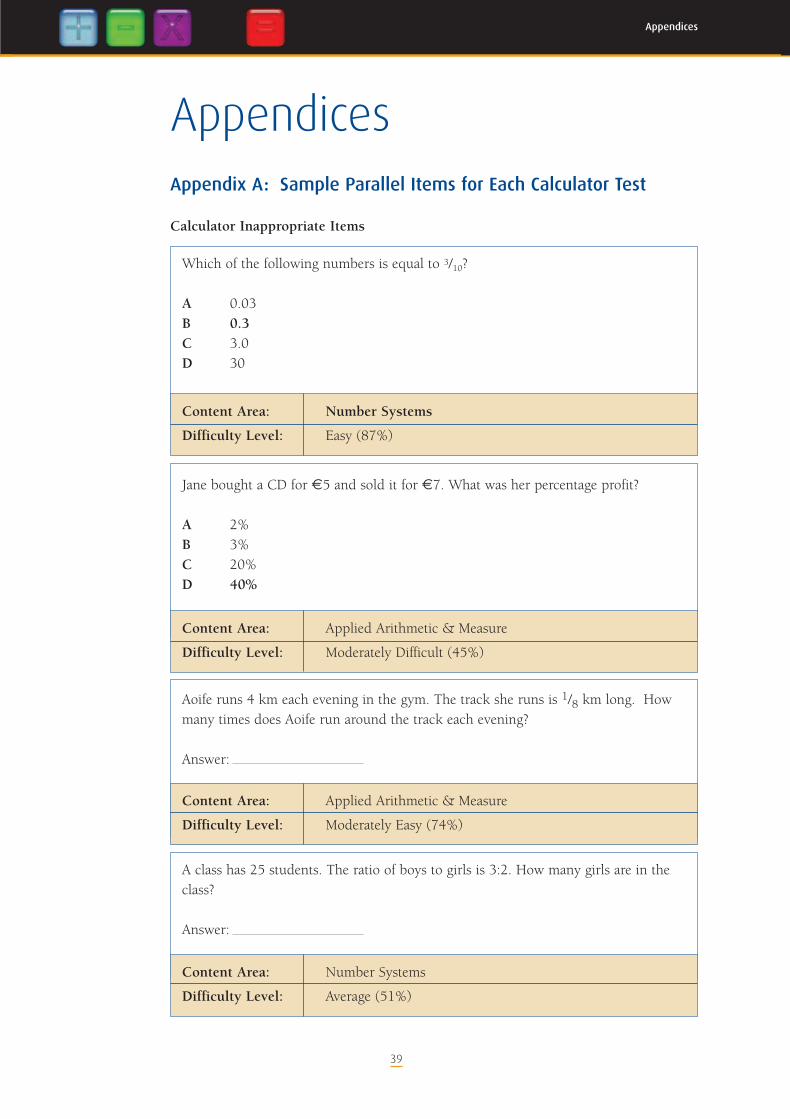
39
Appendices
AppendicesAppendix A: Sample Parallel Items for Each Calculator Test
Calculator Inappropriate Items
Which of the following numbers is equal to 3/10?
A 0.03B 0.3C 3.0D 30
Content Area: Number Systems
Difficulty Level: Easy (87%)
Jane bought a CD for €5 and sold it for €7. What was her percentage profit?
A 2%B 3%C 20%D 40%
Content Area: Applied Arithmetic & Measure
Difficulty Level: Moderately Difficult (45%)
Aoife runs 4 km each evening in the gym. The track she runs is 1/8 km long. Howmany times does Aoife run around the track each evening?
Answer:
Content Area: Applied Arithmetic & Measure
Difficulty Level: Moderately Easy (74%)
A class has 25 students. The ratio of boys to girls is 3:2. How many girls are in theclass?
Answer:
Content Area: Number Systems
Difficulty Level: Average (51%)
B15927 Buttons Inside_D1 10/9/07 6:01 PM Page 39

40
Calculator Optional Items
Pressing the Right Buttons: Calculator Use in Schools and in Junior Cycle Mathematics
A pack of 120 identical cards is 3 cm thick. How thick is one card?
A 0.0025 cmB 0.025 cmC 0.25 cmD 0.4 cm
Content Area: Applied Arithmetic & Measure
Difficulty Level:
With Calculator Average (65%)
Without Calculator Moderately Difficult (40%)
Overall Average (53%)
Multiply: 6.4 x 2.5
Answer:
Content Area: Applied Arithmetic & Measure
Difficulty Level:
Calculator Easy (94%)
Without Calculator Average (64%
Overall Moderately Easy (79%)
B15927 Buttons Inside_D1 10/9/07 6:01 PM Page 40

41
Appendices
Ronan plays a CD on his computer CD player. The time taken for each song is givenin the table. How much time did the 5 songs take altogether?
Answer:
Content Area: Applied Arithmetic & Measure
Difficulty Level:
With Calculator Difficult (34%)
Without Calculator Moderately Difficult (45%)
Overall Moderately Difficult (40%)
If a = 3 and b = 1/4 , find the value of 5a + 20b
Answer:
Content Area: Algebra
Difficulty Level:
With Calculator Average (64%)
Without Calculator Average (60%)
Overall Average (62%)
Song Time Taken
I need your love 3 minutes 15 seconds
You got me babe 2 minutes 55 seconds
Loving heart 4 minutes 5 seconds
My baby left me 3 minutes 22 seconds
Mama told me 3 minutes 18 seconds
B15927 Buttons Inside_D1 10/9/07 6:01 PM Page 41

42
Pressing the Right Buttons: Calculator Use in Schools and in Junior Cycle Mathematics
Calculator Inappropriate Items
Evaluate:
(9.8)3 – (29.2)2
0.0025
Answer:
Content Area: Number Systems
Difficulty Level: Difficult (26%)
How many 700 millilitre bottles of port can be filled from a 350 litre barrel?
Answer:
Content Area: Applied Arithmetic & Measure
Difficulty Level: Difficult (28%)
The bar chart shows time (in minutes) spent on homework in Maths and English by
a group of 5 students. What is the mean number of minutes spent on Maths
homework by the 5 students?
Answer:
Content Area: Statistics
Difficulty Level: Average (61%)
Student 1 Student 2 Student 3 Student 4 Student 5
605040302010
0
Maths
English
Minutes Spent on Homework
B15927 Buttons Inside_D1 10/9/07 6:01 PM Page 42

43
Appendices
A circle is inscribed in a square as shown in the
diagram. The length of the diameter of the circle is
8cm. The area of a circle is �r2.
Calculate the area of the shaded region. Use � on
your calculator or take � = 3.14159. Give your
answer correct to two decimal places.
Answer:
Content Area: Applied Arithmetic & Measure
Difficulty Level: Difficult (2%)
B15927 Buttons Inside_D1 10/9/07 6:01 PM Page 43

44
Appendix B: Glossary
Statistical Terms Used in This ReportWhile this report is designed for a general readership, some statistical terms have beenused in describing findings.
Correlation CoefficientA correlation coefficient is a measure of the relationship between two variables. Valuescan range from –1.00 to +1.00. A negative correlation (e.g., –.45) means that as onevariable increases in magnitude, the other decreases; a positive correlation (e.g., .35)means that both either increase or decrease together. A value of 0 indicates norelationship between variables, while the closer a value is to ±1, the stronger therelationship between variables. A strong correlation does not mean that one variable iscausally related to the other.
Scale Score When a pupil completes a test, basic calculations are carried out to check how manyanswers are correct. The resulting raw scores are then converted to scale scores, to give amore regular distribution of scores. Scale scores allow comparison across different tests.In 2001, each test was scaled to have a mean (average) of 250 and a standard deviationof 504. This means that 68% of scores fell between 200 and 300 (i.e., within onestandard deviation of the mean). In 2004, the mean scores deviated from those set in2001, reflecting improvement or decline in performance relative to 2001.
Significant DifferenceA significant difference in achievement between groups is one that a statistical test hasestablished is unlikely to be due to chance. In this report, a difference is considered to bestatistically significant if the probability that the difference arose by chance is less than5%. Hence, where it is stated that a difference is statistically significant, we can say that,95 times in 100, such a difference is unlikely to occur by chance.
Standard Error This report presents mean, or average, test scores obtained by various groups of pupils(e.g., pupils taking the Calculator Optional test with calculator access in 2004). Eachmean has a standard error, which is an estimate of how accurately the mean found in oursample reflects the ‘true’ mean in the population. There is a 68% chance that ‘true’ meanis within one standard deviation of the obtained mean, and a 95% chance that it iswithin two standard deviations. Thus, if the mean score is 250, and the standard error 3
Pressing the Right Buttons: Calculator Use in Schools and in Junior Cycle Mathematics
4 The mean scores for the Calculator Optional test deviate from this since they were subsequently computedfor students with and without calculator access.
B15927 Buttons Inside_D1 10/9/07 6:01 PM Page 44

points, we can be 68% certain that the true mean falls into the interval 247 to 253, and95% certain that it falls into the interval 244 – 256. Standard errors are taken intoaccount when differences between mean scores are computed.
45
Appendices
B15927 Buttons Inside_D1 10/9/07 6:01 PM Page 45

46
Appendix C: Calculator Activities
1. CountdownStudents are given a target number (e.g., 432). They use given numbers and operations,as in the TV game, to make (or get as close as possible to) the target number.
2. Broken calculatorStudents are told to pretend that certain keys (number or operation keys or both) ontheir calculators are “broken,” and hence cannot be used. They have to carry out givencomputations without using the “broken” keys (e.g., work out 738 + 872 without usingthe 7 or 8 keys; calculate 432 / 12 without using the division key).
3. Five steps to zeroStudents are given a three-digit number less than or equal to 900. They try to reduce itto zero in at most five steps, using any of the basic operations and a single-digit numberat each step.
4. Squares and square rootsStudents are given a number that is the square of a natural number. They have to findthe natural number without using the square root key on the calculator.
5. I have … you haveThis game involves use of a set of cards, each of which displays a number (e.g. 74) and aquestion (e.g. Who has one-eighth of this?). The teacher starts: “I have 74. Who has one-eighth of this?” The student with the appropriate card responds and poses the nextquestion.
6. Guess and pressStudents are given an incomplete statement, e.g. 40 x 57 = or 34 x = 600. Theyhave to guess (estimate) the missing number, record their guess, and then check it outand refine it using the calculator (i.e., pressing keys).
7. WipeoutStudents are given a multi-digit number (e.g. 35746) and must find what to subtract inorder to reduce a given digit to zero (e.g. to make the number 35046).
Pressing the Right Buttons: Calculator Use in Schools and in Junior Cycle Mathematics
B15927 Buttons Inside_D1 10/9/07 6:01 PM Page 46

8. Cross-numbers Students are given a “crossword puzzle” in which the clues are calculations (perhapsones demanding use of brackets or other such features) and the answers are numbers.
9. Beat the calculator Students try to beat the calculator in doing calculations that can reasonably be donementally and/or with pen and paper.
10. Choose and use the appropriate methodStudents are grouped into teams and each team in turn is given a question. One membermust answer. More marks are awarded for an answer calculated mentally than for one forwhich a calculator is used. Paper-and-pencil methods can be awarded an intermediatescore. Wrong answers can be penalised by deduction of marks.
11. Estimate then check Use mental arithmetic/estimation to identify correct/incorrect solutions to complexcomputations and then check with calculator
12. Missing operators Find the missing operators in multi-digit operations [e.g. 43 37 (4 30) = 9600].
13. Missing digitsFind the missing digits in multi-digit operations [e.g. + 37 (4 x 30) = 9600].
47
Appendices
B15927 Buttons Inside_D1 10/9/07 6:01 PM Page 47

Pressing theRight Buttons
Calculator Use in Schools and inJunior Cycle Mathematics
Summary Report on Phase II of the Study of the Effects of Calculator Use
on Mathematics in Schools and in the Certificate Examinations
Paul Surgenor, Elizabeth Oldham, Seán Close, Gerry Shiel,
Thérèse Dooley and Michael O’Leary
Education Department, St Patrick’s College, Dublin
School of Education, Trinity College, Dublin
Educational Research Centre, St Patrick’s College, Dublin
B15927 Cover 9/4/07 1:26 PM Page 1