presenting hdfc top 200 fund - hdfcfund.com · hdfc mutual fund/amc is not guaranteeing returns on...
TRANSCRIPT
February 2017
Table of Contents
• Investment Styles
• Product Rationale
• Current Investment Strategy
• The Matching Principle Explained
• Fund Suitability
• Why HDFC Top 200?
• Portfolio Facts
• Product Features
• Asset Allocation
• Performance
• Disclaimer & Risk Factors
2
Investment Styles
• Active Management: Refers to the use of a human element, such as a single manager, co-managers or a team of managers, toactively manage a fund’s portfolio. They rely on analytical research, forecasts and their own judgment and experience inmaking investment decisions. They believe it is possible to profit from the stock market through any number of strategies thataim to identify mis-priced securities
• Passive Management: An investment strategy that mirrors a market index and does not attempt to beat the market
3
HDFC Mutual Fund/AMC is not guaranteeing returns on investments made in this scheme. The current investment strategy is subject to change depending on the market conditions
Product Rationale
• In the nature of an Index + Fund (active + passive); internal guidelines of matched positions with the index (refer slides 7&8)
• Focus on GARP (growth at reasonable price) for active positions
• Limited exposure to mid-caps; avoids large individual positions in mid-caps
• Offers portfolio diversification comparable to market indices
4
HDFC Mutual Fund/AMC is not guaranteeing returns on investments made in this scheme. The current investment strategy is subject to change depending on the market conditions
Current Investment Strategy
• The investment portfolio for equity and equity linked instruments will be primarily drawn from the companies in the S&P BSE 200 Index
• The fund seeks to invest in higher quality, competitive, sustainable businesses by primarily restricting the equity portfolio to the S&P BSE 200 Index scrips; this is intended to reduce risks while maintaining steady growth
• Focuses on secular growth companies compared to cyclicals; this strategy reduces risk on one hand and improves chances of positive returns over the long term
• This includes participation in large IPO’s wherein the market capitalization of the company based on issue price would make the company a part of the top 200 companies listed on the BSE based on market capitalization
5
HDFC Mutual Fund/AMC is not guaranteeing returns on investments made in this scheme. The current investment strategy is subject to change depending on the market conditions
Current Investment Strategy - (Matching Principle)
• There are primarily two sources of returns for a fund – Index returns and returns from active management; over periods of time, index returns are expected to form a large portion of total returns
• The fund targets to capture a large part of index returns by maintaining around 60% of the portfolio in matched positions with the S&P BSE 200 index; positions are not matched on a stock-to-stock basis but on an aggregate level
• Active management in the scheme is done on two levels:
• Selection of matched positions
• Selection of the balance portfolio
• Selection of the matched positions with the index and the selection of other active positions are aimed to deliver returns above the S&P BSE 200 index without increasing the risk to the levels of active managed funds
6
HDFC Mutual Fund/AMC is not guaranteeing returns on investments made in this scheme. The current investment strategy is subject to change depending on the market conditions
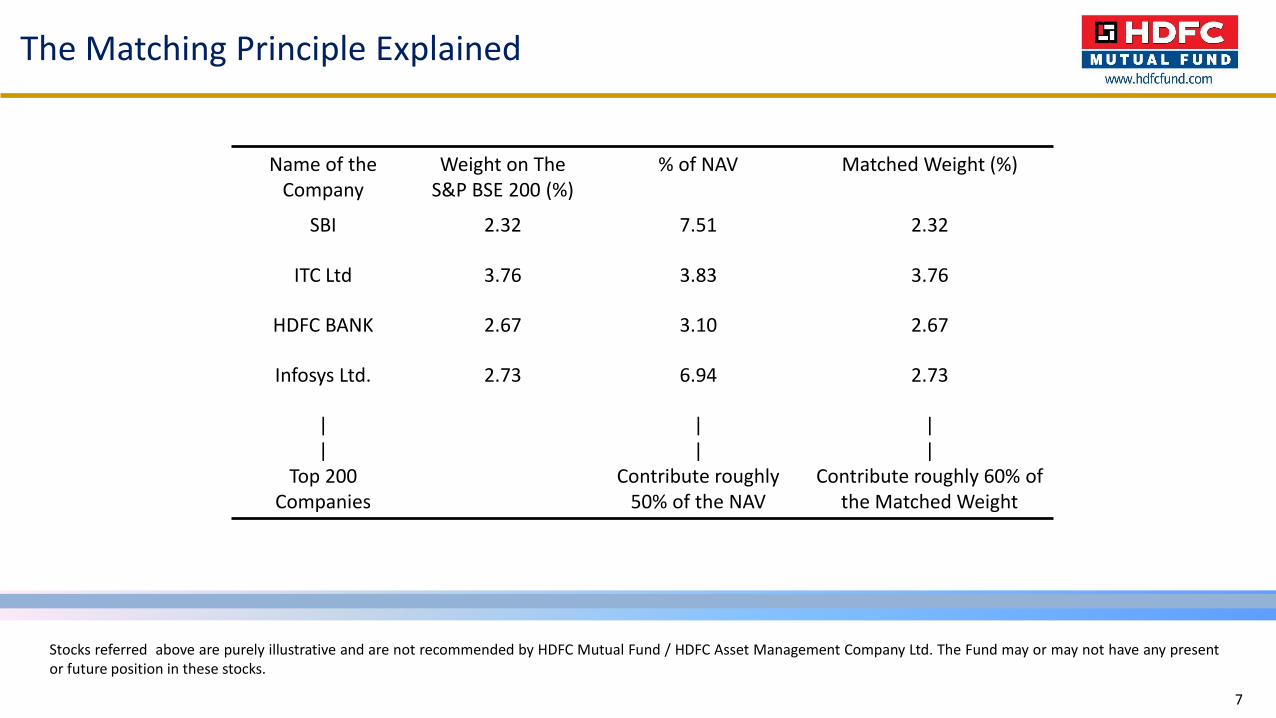
Stocks referred above are purely illustrative and are not recommended by HDFC Mutual Fund / HDFC Asset Management Company Ltd. The Fund may or may not have any presentor future position in these stocks.
Name of the Company
Weight on The S&P BSE 200 (%)
% of NAV Matched Weight (%)
SBI 2.32 7.51 2.32
ITC Ltd 3.76 3.83 3.76
HDFC BANK 2.67 3.10 2.67
Infosys Ltd. 2.73 6.94 2.73
||
Top 200 Companies
||
Contribute roughly 50% of the NAV
||
Contribute roughly 60% of the Matched Weight
The Matching Principle Explained
7
Fund Suitability
• Looking for a large cap oriented, well diversified core holding within their mutual fund portfolio
• Preferring a active + passive investment management approach
• Preferring a fund with a disciplined investment strategy
• Planning for long term financial goals such as retirement, children’s education and marriage etc.
8
Why HDFC Top 200 Fund?
• The fund is by design well diversified, hence is a lower risk product compared to less diversified funds
• Well defined investment universe primarily comprising S&P BSE 200 companies and Top 200 capitalized companies supports good quality of portfolio, which also reduces risk
• Well established track record of ~ 20 years*
*Past performance may or may not be sustained in the future. Please refer scheme performance summary on slide 14.
9
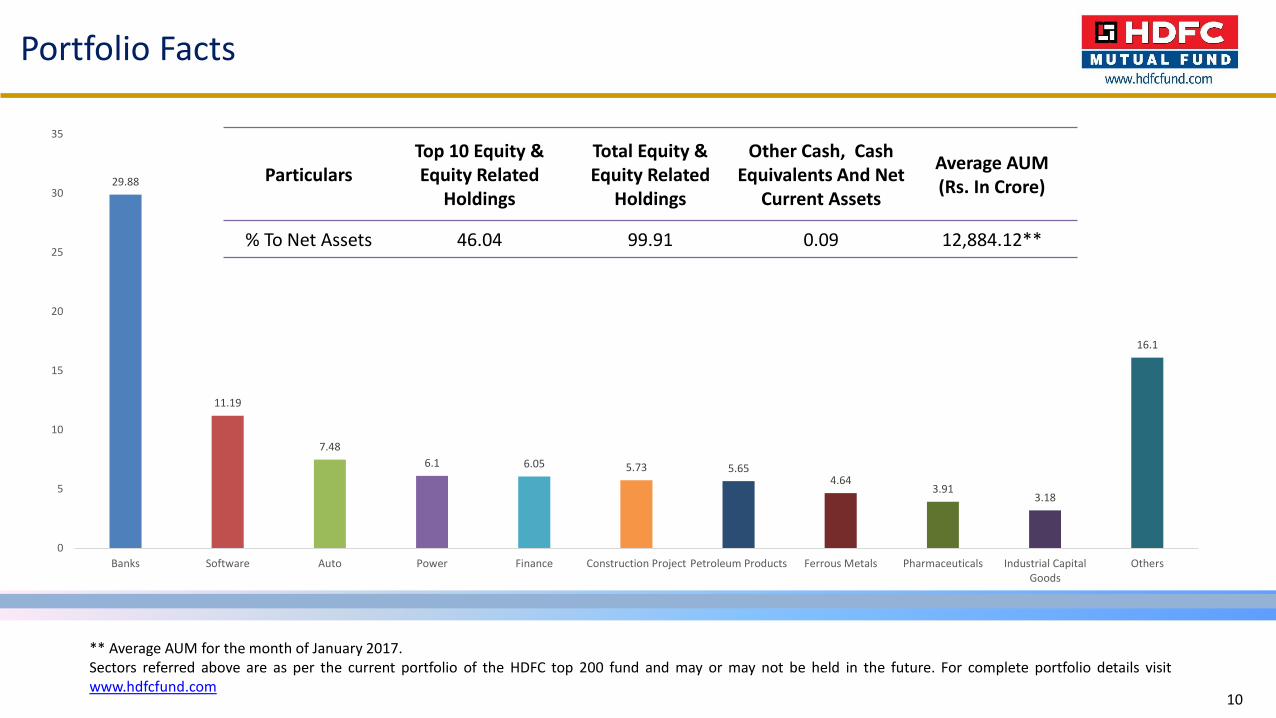
29.88
11.19
7.48
6.1 6.05 5.73 5.654.64
3.913.18
16.1
0
5
10
15
20
25
30
35
Banks Software Auto Power Finance Construction Project Petroleum Products Ferrous Metals Pharmaceuticals Industrial CapitalGoods
Others
Portfolio Facts
** Average AUM for the month of January 2017.Sectors referred above are as per the current portfolio of the HDFC top 200 fund and may or may not be held in the future. For complete portfolio details visitwww.hdfcfund.com
10
ParticularsTop 10 Equity & Equity Related
Holdings
Total Equity & Equity Related
Holdings
Other Cash, Cash Equivalents And Net
Current Assets
Average AUM (Rs. In Crore)
% To Net Assets 46.04 99.91 0.09 12,884.12**
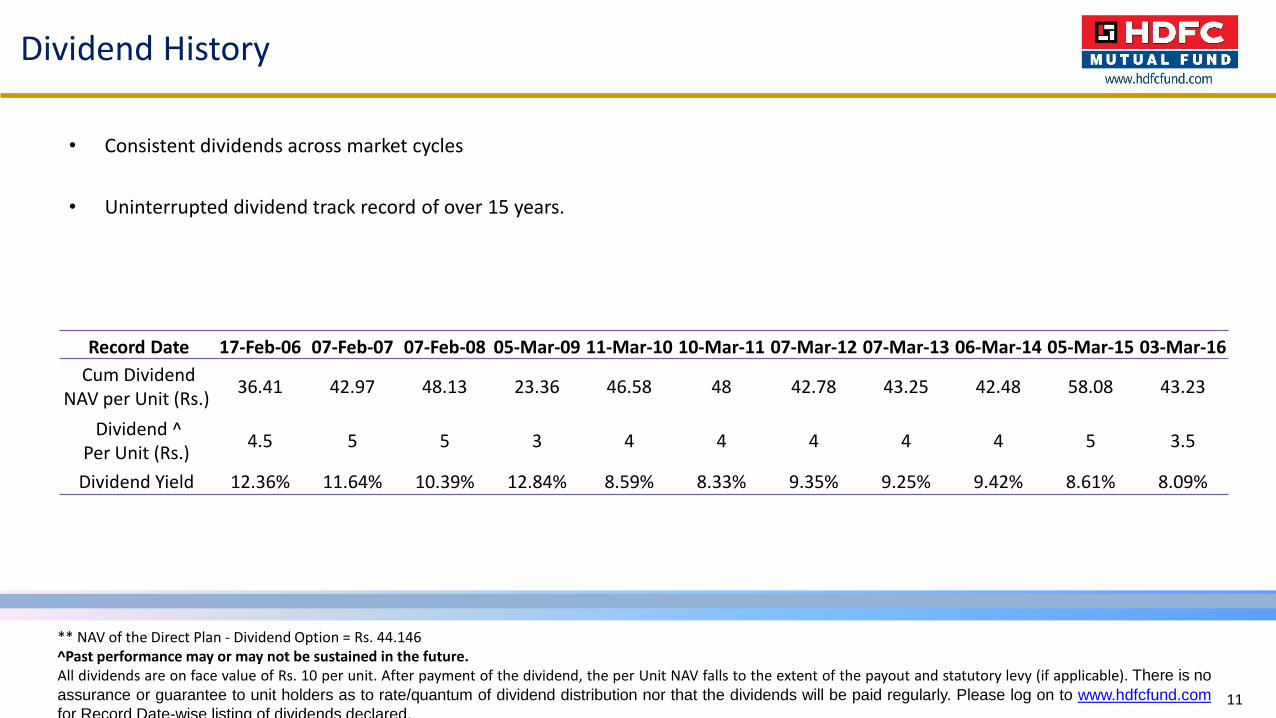
Dividend History
• Consistent dividends across market cycles
• Uninterrupted dividend track record of over 15 years.
** NAV of the Direct Plan - Dividend Option = Rs. 44.146^Past performance may or may not be sustained in the future.All dividends are on face value of Rs. 10 per unit. After payment of the dividend, the per Unit NAV falls to the extent of the payout and statutory levy (if applicable). There is no
assurance or guarantee to unit holders as to rate/quantum of dividend distribution nor that the dividends will be paid regularly. Please log on to www.hdfcfund.com
for Record Date-wise listing of dividends declared.11
Record Date 17-Feb-06 07-Feb-07 07-Feb-08 05-Mar-09 11-Mar-10 10-Mar-11 07-Mar-12 07-Mar-13 06-Mar-14 05-Mar-15 03-Mar-16
Cum Dividend NAV per Unit (Rs.)
36.41 42.97 48.13 23.36 46.58 48 42.78 43.25 42.48 58.08 43.23
Dividend ^Per Unit (Rs.)
4.5 5 5 3 4 4 4 4 4 5 3.5
Dividend Yield 12.36% 11.64% 10.39% 12.84% 8.59% 8.33% 9.35% 9.25% 9.42% 8.61% 8.09%

Product Features
Type of Scheme Open-ended Growth Scheme
Inception Date(Date of allotment)
October 11, 1996
Investment Objective To generate long term capital appreciation from a portfolio of equity and equity-linked instruments primarily drawn from thecompanies in the BSE 200 index
Fund Manager $ Prashant Jain
Investment Plan Direct Plan, Regular Plan
Investment Options Under Each Plan : Growth & Dividend. The Dividend Option offers Dividend Payout and Reinvestment facility.
Minimum Application Amount(Under Each Plan /Option)
Purchase: Rs. 5,000 and any amount thereafterAdditional Purchase: Rs. 1,000 and any amount thereafter
Load Structure Entry Load: Not Applicable. Upfront commission shall be paid directly by the investor to the ARNHolder (AMFI registered Distributor) based on the investor’s assessment of various factors includingthe service rendered by the ARN Holder.Exit Load:
• In respect of each purchase / switch – in of units, an exit load of 1.00% is payable if units are redeemed / switched – outwithin 12 months from the date of allotment.
• No exit load is payable if units are redeemed / switched out after 12 months from the date of allotment.
Benchmark S&P BSE 200 Index
$ Dedicated Fund Manager for Overseas Investments: Mr. Rakesh VyasFor further details please refer SID/KIM available on www.hdfcfund.com and at Investor Service Centers of HDFC Mutual Fund
12
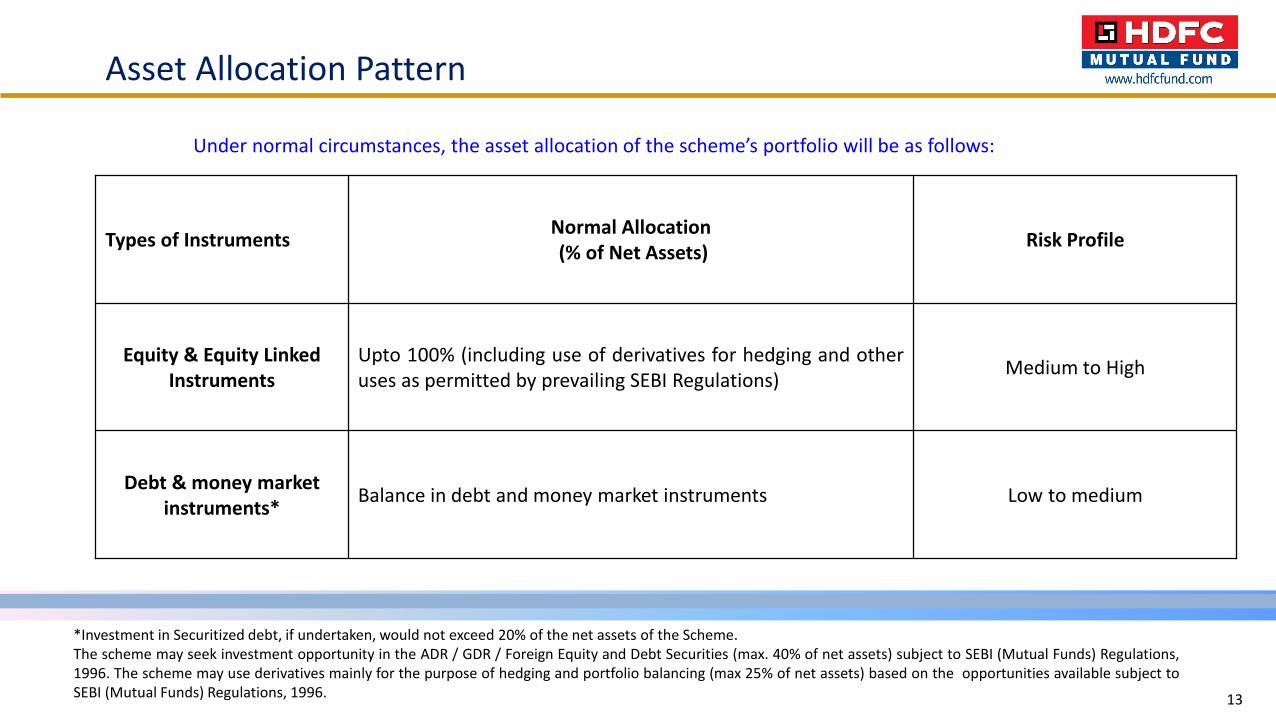
*Investment in Securitized debt, if undertaken, would not exceed 20% of the net assets of the Scheme.The scheme may seek investment opportunity in the ADR / GDR / Foreign Equity and Debt Securities (max. 40% of net assets) subject to SEBI (Mutual Funds) Regulations,1996. The scheme may use derivatives mainly for the purpose of hedging and portfolio balancing (max 25% of net assets) based on the opportunities available subject toSEBI (Mutual Funds) Regulations, 1996.
Asset Allocation Pattern
Under normal circumstances, the asset allocation of the scheme’s portfolio will be as follows:
Types of InstrumentsNormal Allocation(% of Net Assets)
Risk Profile
Equity & Equity Linked Instruments
Upto 100% (including use of derivatives for hedging and otheruses as permitted by prevailing SEBI Regulations)
Medium to High
Debt & money market instruments*
Balance in debt and money market instruments Low to medium
13
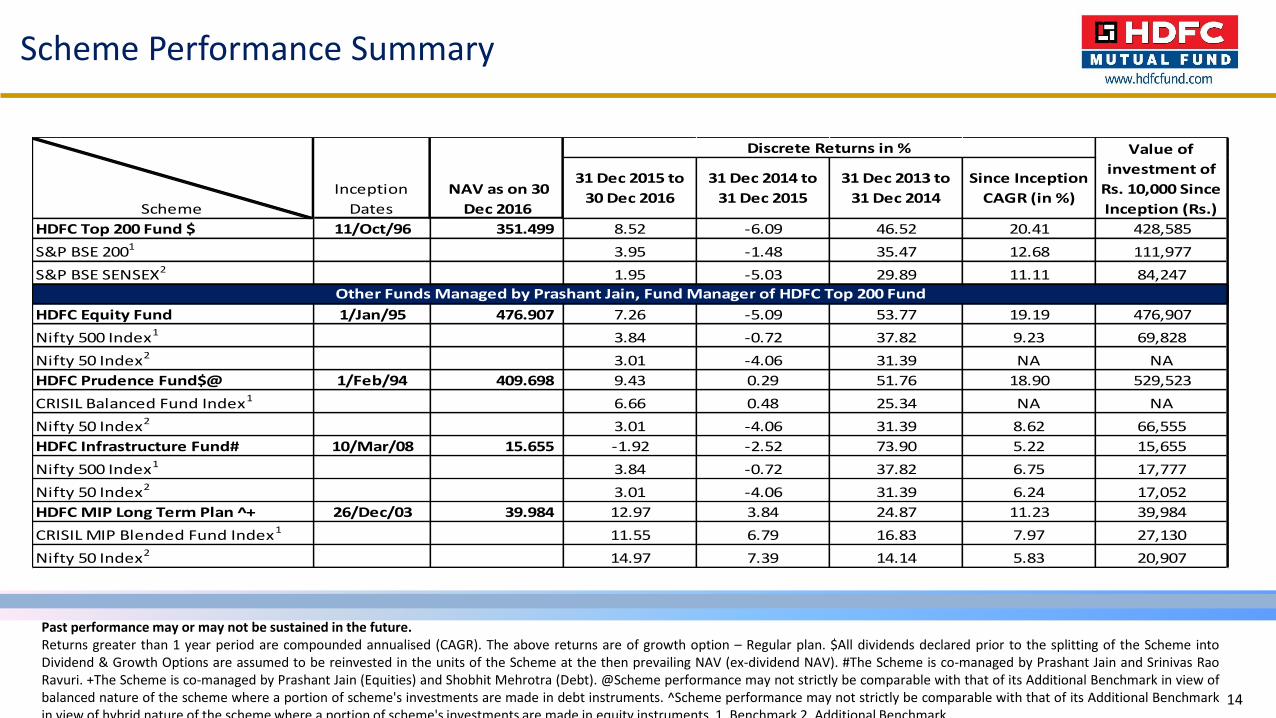
Past performance may or may not be sustained in the future. Returns greater than 1 year period are compounded annualised (CAGR). The above returns are of growth option – Regular plan. $All dividends declared prior to the splitting of the Scheme intoDividend & Growth Options are assumed to be reinvested in the units of the Scheme at the then prevailing NAV (ex-dividend NAV). #The Scheme is co-managed by Prashant Jain and Srinivas RaoRavuri. +The Scheme is co-managed by Prashant Jain (Equities) and Shobhit Mehrotra (Debt). @Scheme performance may not strictly be comparable with that of its Additional Benchmark in view ofbalanced nature of the scheme where a portion of scheme's investments are made in debt instruments. ^Scheme performance may not strictly be comparable with that of its Additional Benchmarkin view of hybrid nature of the scheme where a portion of scheme's investments are made in equity instruments. 1. Benchmark 2. Additional Benchmark
Scheme Performance Summary
14
31 Dec 2015 to
30 Dec 2016
31 Dec 2014 to
31 Dec 2015
31 Dec 2013 to
31 Dec 2014
Since Inception
CAGR (in %)
HDFC Top 200 Fund $ 11/Oct/96 351.499 8.52 -6.09 46.52 20.41 428,585
S&P BSE 2001 3.95 -1.48 35.47 12.68 111,977
S&P BSE SENSEX2 1.95 -5.03 29.89 11.11 84,247
HDFC Equity Fund 1/Jan/95 476.907 7.26 -5.09 53.77 19.19 476,907
Nifty 500 Index1 3.84 -0.72 37.82 9.23 69,828
Nifty 50 Index2 3.01 -4.06 31.39 NA NA
HDFC Prudence Fund$@ 1/Feb/94 409.698 9.43 0.29 51.76 18.90 529,523
CRISIL Balanced Fund Index1 6.66 0.48 25.34 NA NA
Nifty 50 Index2 3.01 -4.06 31.39 8.62 66,555
HDFC Infrastructure Fund# 10/Mar/08 15.655 -1.92 -2.52 73.90 5.22 15,655
Nifty 500 Index1 3.84 -0.72 37.82 6.75 17,777
Nifty 50 Index2 3.01 -4.06 31.39 6.24 17,052
HDFC MIP Long Term Plan ^+ 26/Dec/03 39.984 12.97 3.84 24.87 11.23 39,984
CRISIL MIP Blended Fund Index1 11.55 6.79 16.83 7.97 27,130
Nifty 50 Index2 14.97 7.39 14.14 5.83 20,907
Scheme
NAV as on 30
Dec 2016
Value of
investment of
Rs. 10,000 Since
Inception (Rs.)
Discrete Returns in %
Other Funds Managed by Prashant Jain, Fund Manager of HDFC Top 200 Fund
Inception
Dates
Disclaimer & Risk Factors
This presentation dated 3rd February 2017 has been prepared by HDFC Asset Management Company Limited (HDFC AMC) based oninternal data, publicly available information and other sources believed to be reliable. Any calculations made are approximations,meant as guidelines only, which you must confirm before relying on them. The information contained in this document is forgeneral purposes only. The document is given in summary form and does not purport to be complete. The document does nothave regard to specific investment objectives, financial situation and the particular needs of any specific person who may receivethis document. The information/ data herein alone are not sufficient and should not be used for the development orimplementation of an investment strategy. The statements contained herein are based on our current views and involve knownand unknown risks and uncertainties that could cause actual results, performance or events to differ materially from thoseexpressed or implied in such statements. Past performance may or may not be sustained in future. Neither HDFC AMC and HDFCMutual Fund nor any person connected with them, accepts any liability arising from the use of this document. The recipient(s)before acting on any information herein should make his/her/their own investigation and seek appropriate professional advice andshall alone be fully responsible / liable for any decision taken on the basis of information contained herein.
MUTUAL FUND INVESTMENTS ARE SUBJECT TO MARKET RISKS, READ ALL SCHEME RELATED DOCUMENTS CAREFULLY.
15

Thank You