presenters: etfs 201: dave nadig how to choose the best ... · •proshares s&p 500 dividend...
TRANSCRIPT

ETFs 201:How to Choose the Best ETF in Every Area of the Market
Presenters: DAVE NADIGFactSet
TODD ROSENBLUTHS&P Capital IQ

The Investing World Is Now Flat
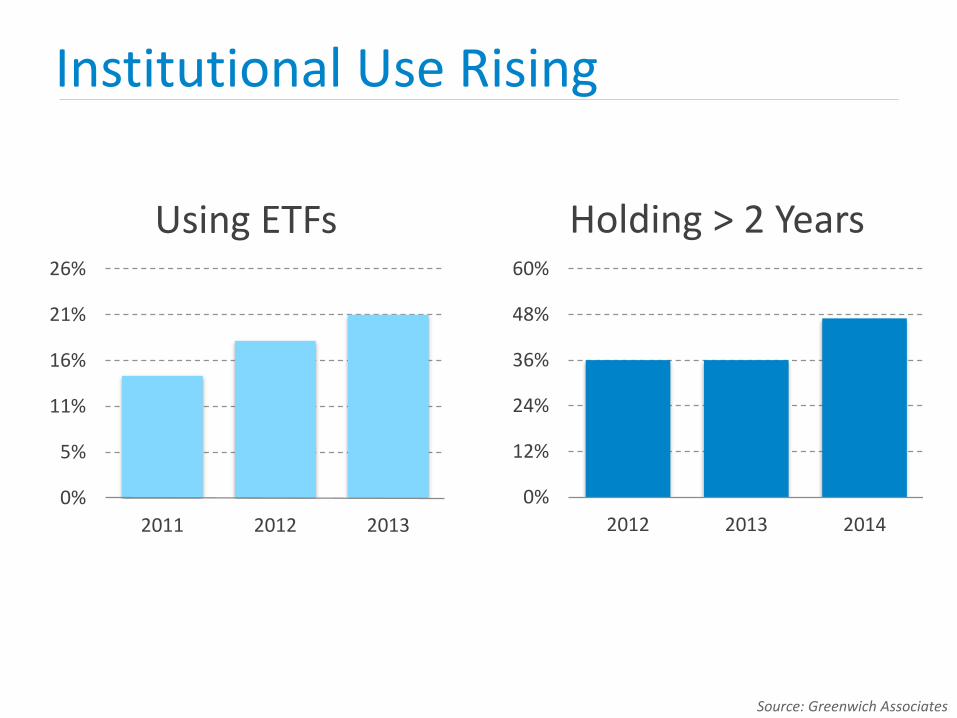
Institutional Use Rising
0%
5%
11%
16%
21%
26%
2011 2012 2013
0%
12%
24%
36%
48%
60%
2012 2013 2014
Using ETFs Holding > 2 Years
Source: Greenwich Associates

Advisor Use Is Rising
Which Investment Vehicles Do You Currently Use/Recommend with Clients?
Source: FPA's Trends in Investing Surveys
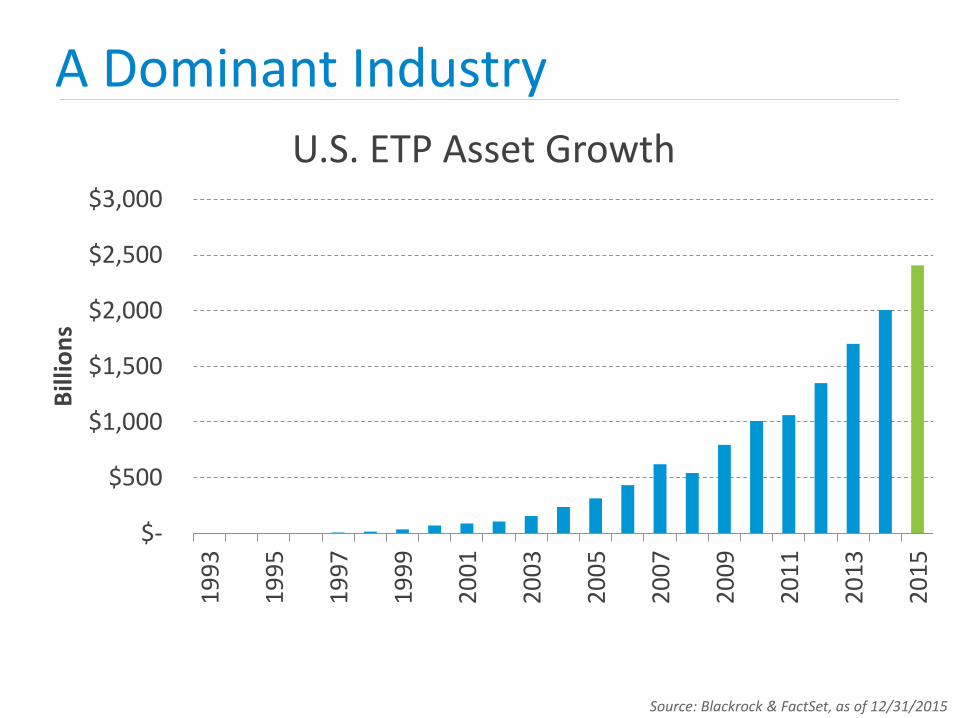
A Dominant Industry
U.S. ETP Asset Growth
Source: Blackrock & FactSet, as of 12/31/2015
$-
$500
$1,000
$1,500
$2,000
$2,500
$3,0001
99
3
19
95
19
97
19
99
20
01
20
03
20
05
20
07
20
09
20
11
20
13
20
15
Bill
ion
s

1857 ETFs
286 new in 2015
12 already in 2016
1200+ in Registration
Growing Access
Source: FactSet, as of 1/18/2016
What’s the best
ETF for me?

-15%
-10%
-5%
0%
5%
10%
15%
20%
25%
30%
12/31/2014 12/31/2015
Tota
l Ret
urn
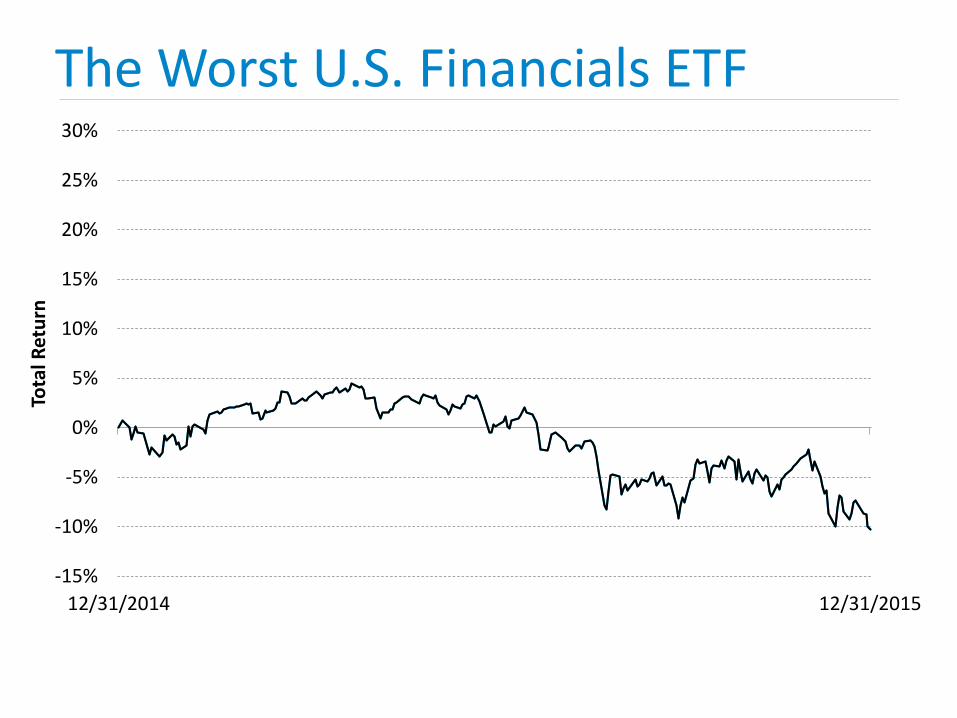
The Worst U.S. Financials ETF

The Best U.S. Financials ETF
-15%
-10%
-5%
0%
5%
10%
15%
20%
25%
30%
12/31/2014 12/31/2015
Tota
l Ret
urn
-15%
-10%
-5%
0%
5%
10%
15%
20%
25%
30%
12/31/2014 12/31/2015
Tota
l Ret
urn

-15%
-10%
-5%
0%
5%
10%
15%
20%
25%
30%
12/31/2014 12/31/2015
Tota
l Ret
urn
The Easy Button Costs Investors Money
The Easy Button Choice? XLF.$17.3 billion in assets.$1.08 billion trading a dayBUT … hyper-concentrated portfolio, avoids small capsBottom-of-the-barrel performance
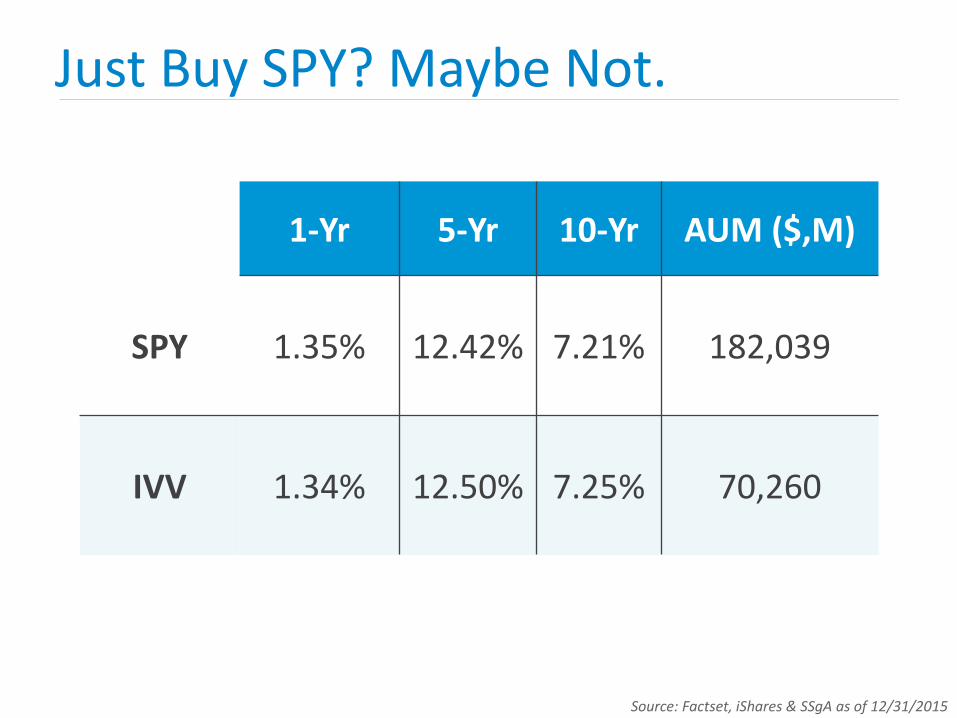
Just Buy SPY? Maybe Not.
1-Yr 5-Yr 10-Yr AUM ($,M)
SPY 1.35% 12.42% 7.21% 182,039
IVV 1.34% 12.50% 7.25% 70,260
Source: Factset, iShares & SSgA as of 12/31/2015

-20%
-15%
-10%
-5%
0%
5%
10%
15%
20%
1/4/2010 12/31/2010
2010 Performance Difference? 2.31%
EEM VWO
You Can’t Just “Trust” The Big Players
EEM vs. VWO
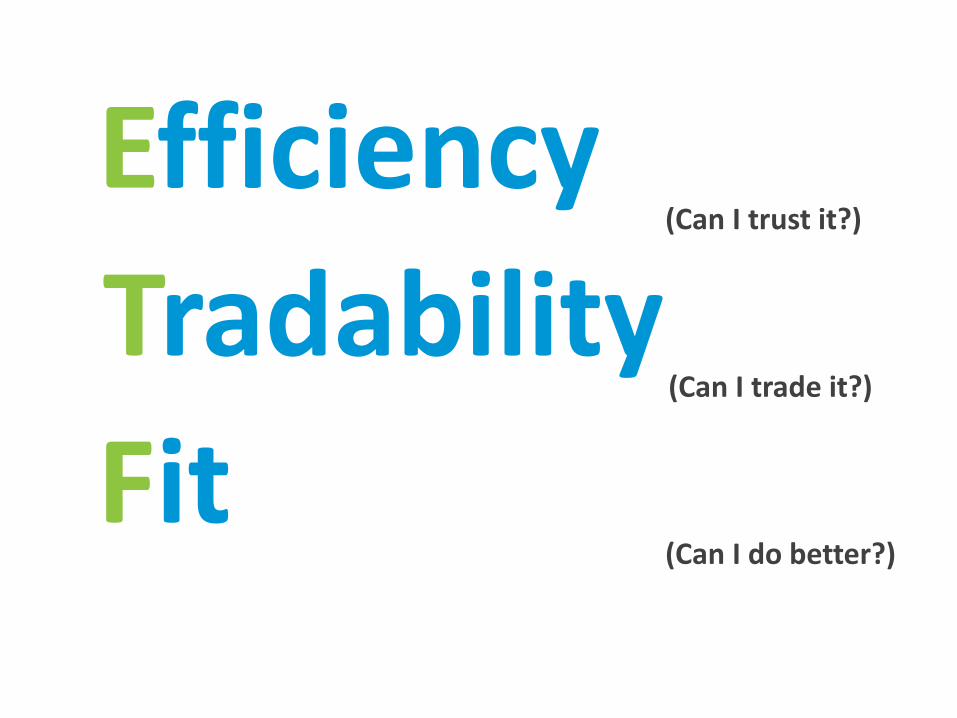
(Can I trust it?)
(Can I trade it?)
(Can I do better?)
Efficiency
Tradability
Fit

Efficiency
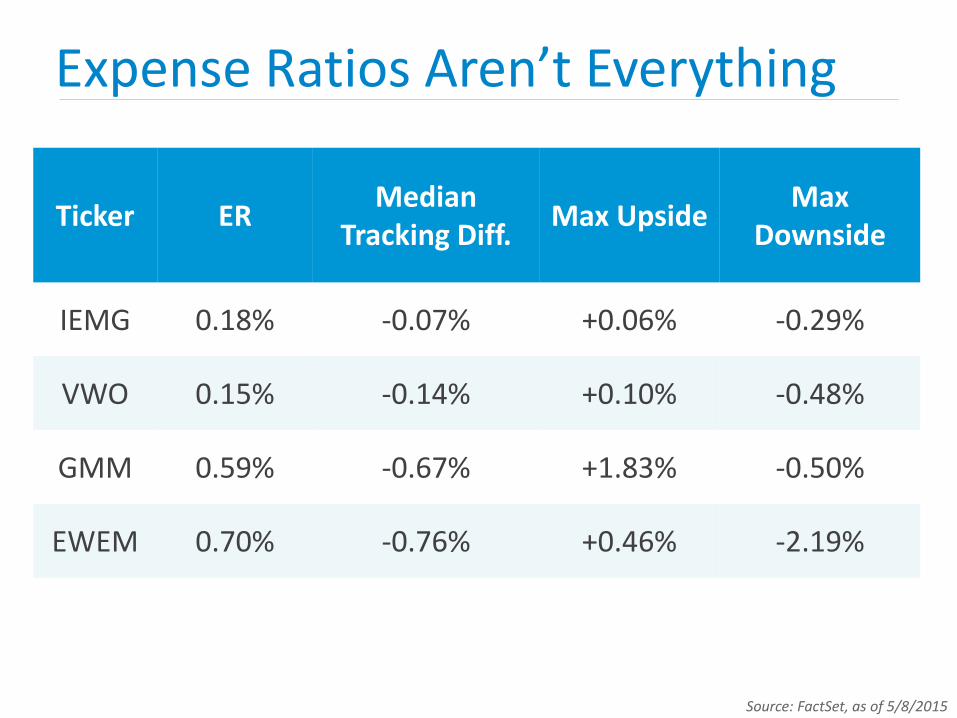
Expense Ratios Aren’t Everything
Source: FactSet, as of 5/8/2015
Ticker ERMedian
Tracking Diff.Max Upside
Max Downside
IEMG 0.18% -0.07% +0.06% -0.29%
VWO 0.15% -0.14% +0.10% -0.48%
GMM 0.59% -0.67% +1.83% -0.50%
EWEM 0.70% -0.76% +0.46% -2.19%
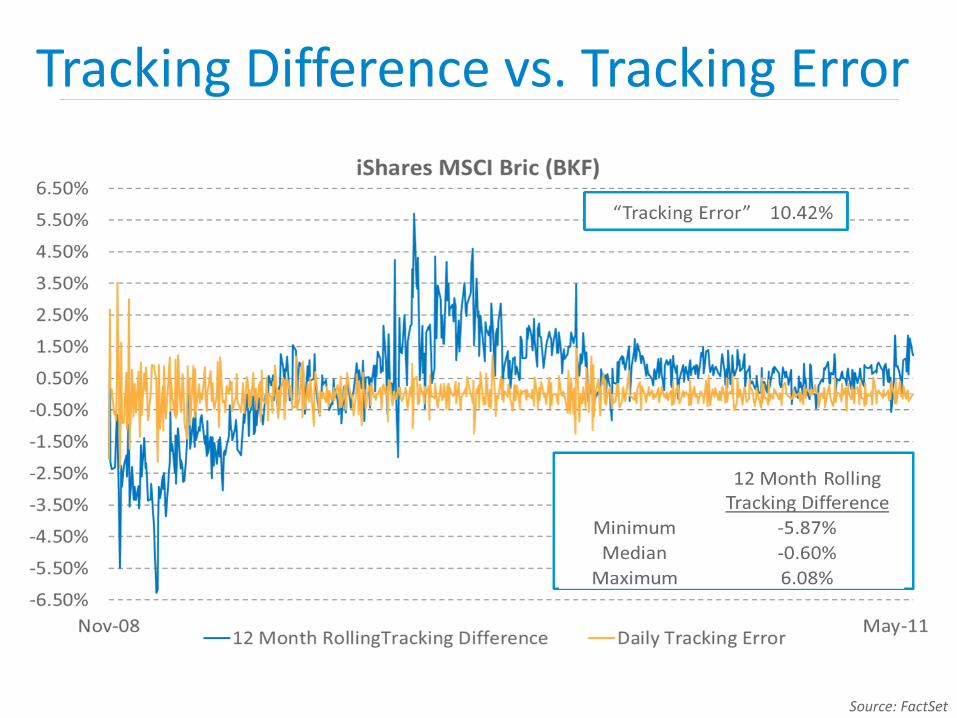
Tracking Difference vs. Tracking Error
Source: FactSet
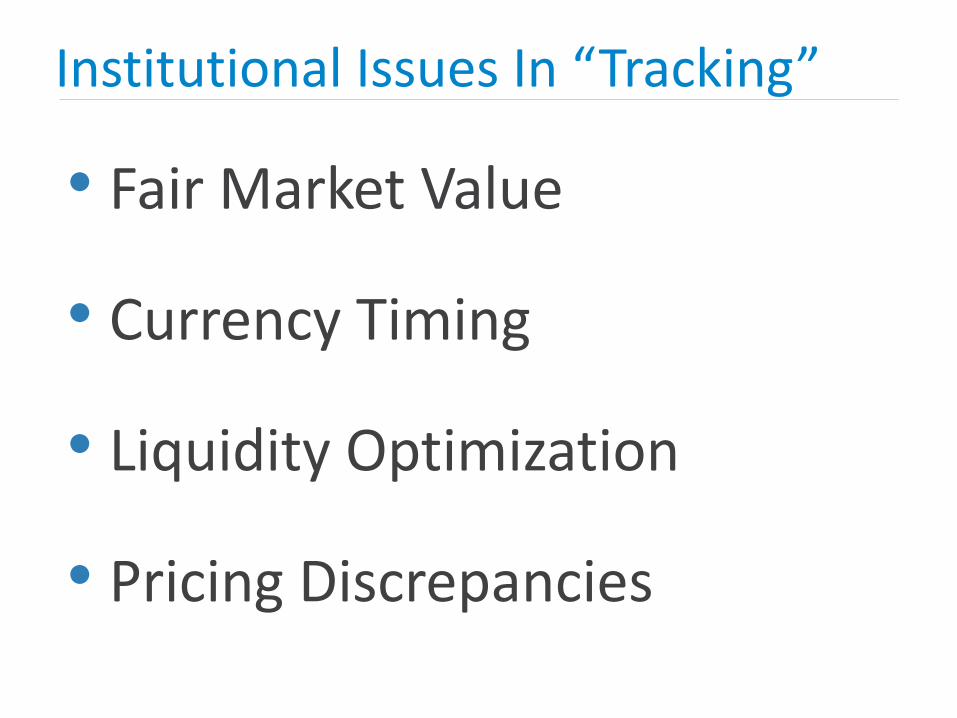
Institutional Issues In “Tracking”
• Fair Market Value
• Currency Timing
• Liquidity Optimization
• Pricing Discrepancies

The Scale of Counterparty Risk
High RiskLow Risk

Credit Default Swaps
Source: Bloomberg, as of 1/20/2015

Ticker Fund NameClosure
Risk
CORP PIMCO Investment Grade Corporate Bond Low
LQD iShares iBoxx $ Investment Grade Corporate Bond Low
CBND SPDR Barclays Issuer Scored Corporate Bond Medium
LQDH iShares Interest Rate Hedged Corporate Bond Medium
COBO ProShares USD Covered Bond High
Fund Closure Risk
Source: FactSet, as of 10/28/2015
Tradability
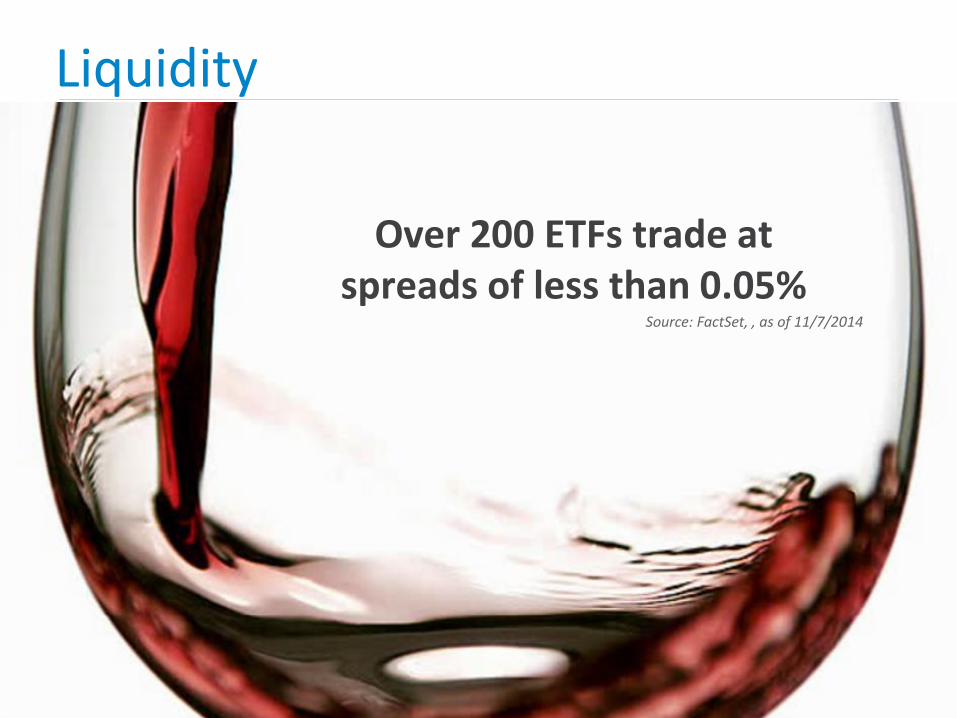
Liquidity
Over 200 ETFs trade at spreads of less than 0.05%
Source: FactSet, , as of 11/7/2014

Different Asset Classes, Different Spreads
Source: FactSet, as of 12/31/2015

Ticker Fund NameClosure
Risk
CORP PIMCO Investment Grade Corporate Bond Low
LQD iShares iBoxx $ Investment Grade Corporate Bond Low
CBND SPDR Barclays Issuer Scored Corporate Bond Medium
LQDH iShares Interest Rate Hedged Corporate Bond Medium
COBO ProShares USD Covered Bond High
Fund Closure Risk
Source: FactSet, as of 10/28/2015

0%
10%
20%
30%
40%
50%
60%
70%
80%
90%
100%
LQD HYG JNK CORP VCSH
Bond ETF Trading vs. Holdings
Source: FactSet

Commission Free Trading

Flows Impact
-2.500%
-2.000%
-1.500%
-1.000%
-0.500%
0.000%
0.500%
1.000%
1.500%
2.000%
2.500%
$78
$79
$80
$81
$82
$83
$84
12
/1/1
5
12
/2/1
5
12
/3/1
5
12
/4/1
5
12
/7/1
5
12
/8/1
5
12
/9/1
5
12
/10
/15
12
/11
/15
12
/14
/15
12
/15
/15
12
/16
/15
12
/17
/15
12
/18
/15
12
/21
/15
12
/22
/15
12
/23
/15
12
/28
/15
12
/29
/15
12
/30
/15
12
/31
/15
1/4
/16
1/5
/16
1/6
/16
1/7
/16
1/8
/16
Pre
miu
m (
Dis
cou
nt)
Pri
ce/I
NA
V
iShares iBoxx USD High Yield Corporate Bond ETF (HYG)
Premium (Discount) HYG Price HYG Inav
Source: FactSet

Market Impact
Source: FactSet, as of 1/13/2016
Name Ticker % of Underlying
iShares MSCI Emerging Markets EEM 0.53%
iShares Emerging Markets Min Vol EEMV 0.89%
iShares Emerging Markets Small Cap EEMS 0.85%
iShares MSCI Frontier 100 FM 3.88%
Global X MSCI Nigeria NGE 14.93%

Fit

Too Much Vanilla?
MSCI 350 S&P 500 Russell 1000
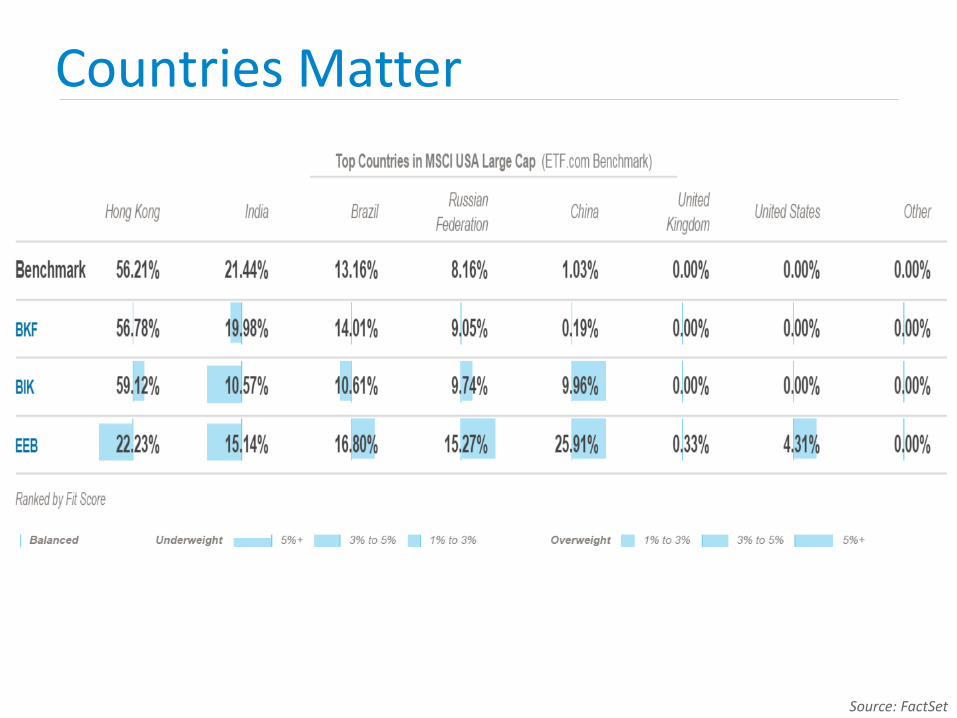
Countries Matter
Source: FactSet

Example: Global Ex-US Suite
Source: FactSet
IssuerDeveloped
Ex U.S. Options
Emerging Markets Options
Includes Canada
SmallCaps
S. Korea Treatment
SSgA GWL GMM Yes Yes Developed
BlackRock (Core)
IEFA IEMG No Yes Emerging
Schwab SCHF SCHE Yes No Developed
BlackRock (Legacy)
EFA EEM No No Emerging
Vanguard VEA VWO No NoDeveloped

Different Schemes, Different Tilts
S&P 500
Equal Weight
Revenue Weighted
High Quality
Low Volatility
HighBeta
P/E 13.37 14.09 11.47 13.8 14.14 10.93
P/B 2.02 1.77 1.48 2.57 2.14 1.06
P/S 1.22 0.94 0.54 1.07 1.21 0.78
Yield 2.44 2.28 2.05 2.31 3.53 0.85
Turnover 3.72 21 12.73 64 12 16
Source: FactSet
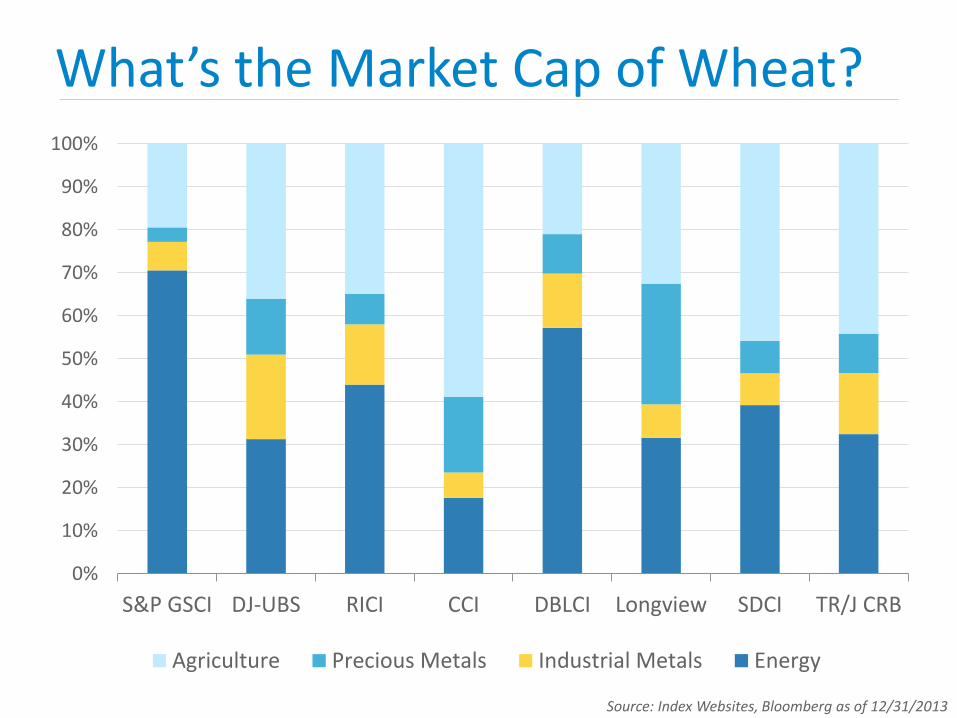
What’s the Market Cap of Wheat?
Source: Index Websites, Bloomberg as of 12/31/2013
0%
10%
20%
30%
40%
50%
60%
70%
80%
90%
100%
S&P GSCI DJ-UBS RICI CCI DBLCI Longview SDCI TR/J CRB
Agriculture Precious Metals Industrial Metals Energy
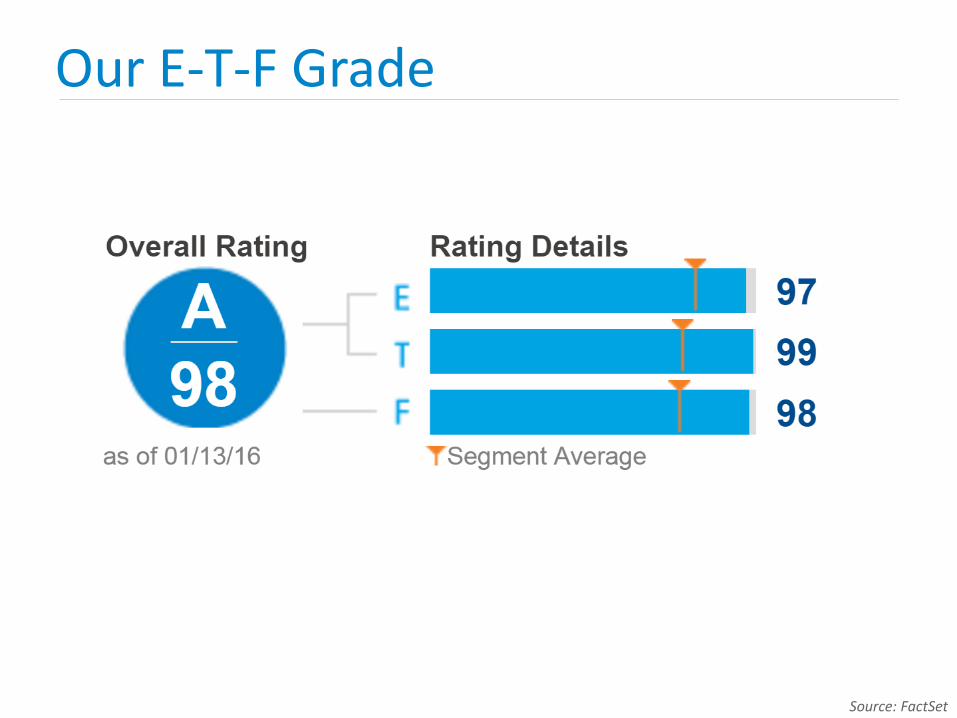
Our E-T-F Grade
Source: FactSet

ETFs: What’s Inside Matters A Lot
Todd RosenbluthDirector of ETF Research, S&P Capital IQ
@ToddSPCAPIQ
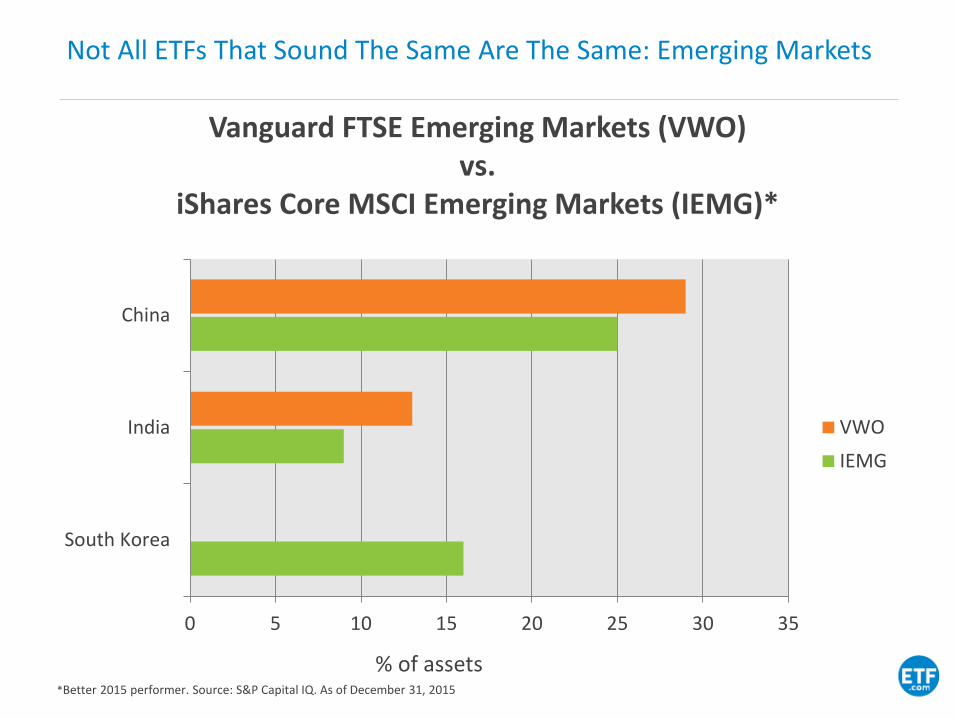
Not All ETFs That Sound The Same Are The Same: Emerging Markets
Vanguard FTSE Emerging Markets (VWO)vs.
iShares Core MSCI Emerging Markets (IEMG)*
0 5 10 15 20 25 30 35
South Korea
India
China
VWO
IEMG
*Better 2015 performer. Source: S&P Capital IQ. As of December 31, 2015
% of assets
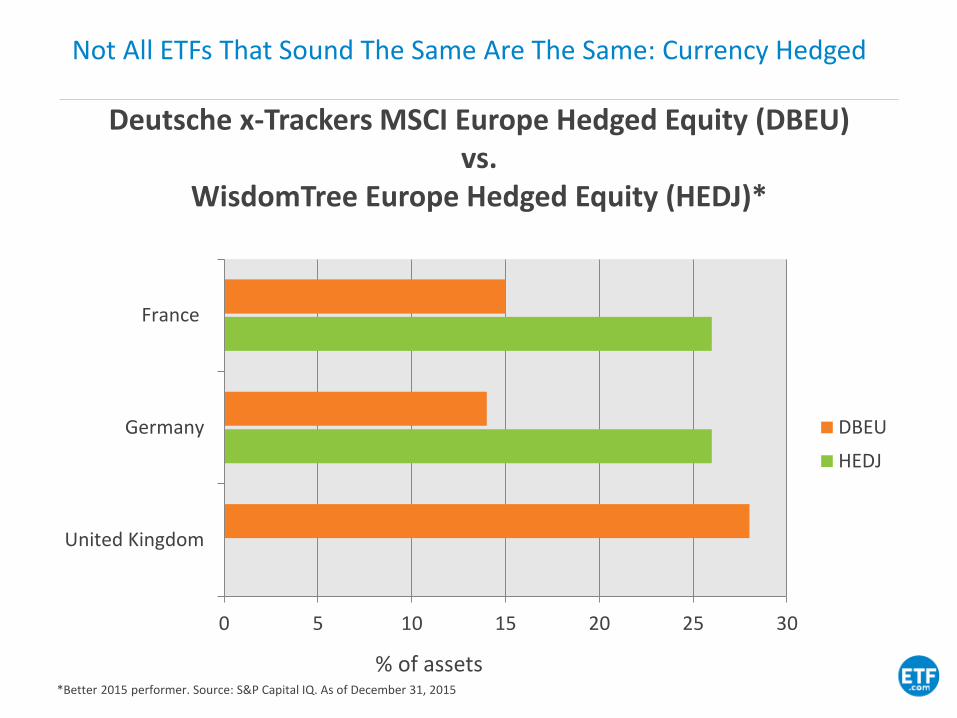
Not All ETFs That Sound The Same Are The Same: Currency Hedged
Deutsche x-Trackers MSCI Europe Hedged Equity (DBEU)vs.
WisdomTree Europe Hedged Equity (HEDJ)*
0 5 10 15 20 25 30
United Kingdom
Germany
France
DBEU
HEDJ
*Better 2015 performer. Source: S&P Capital IQ. As of December 31, 2015
% of assets

Don’t Invest Using Rearview Mirror
For illustrative purposes only.

S&P Capital IQ ETF Philosophy
• Past performance is not necessarily indicative of future results, so we do not rely on it. Most ETFs seek to track and replicate a benchmark, so a long record as an ETF is not needed, in our view
• Understanding what’s inside a fund from a risk/reward perspective can help sort through various options
• We believe an appealing fund is one that has holdings that are aligned with your objectives and that makes sense in the current environment
• A fund’s expense ratio and liquidity can impact returns either directly or indirectly and should be a factor in the selection process
• Investors can also work with an ETF Strategist that dynamically shifts a diversified strategy yet reflects their risk-profile

Feature Deep-Dive: Equity ETF Ranking Inputs
• The ETF ranking is based on a weighted average computation of three components – performance analytics, risk considerations and cost factors, providing a holistic assessment of the fund
• Holdings-based inputs are used in the Performance and Risk ranking components
• These factors evaluate the underlying holdings and characteristics of a fund relative to its peers
• The factors are evaluated using a proprietary S&P Capital IQ quantitative model, ensuring a consistent and objective application
Component assessmentsroll up to the overall ranking
The individual component assessments are established using a weighted average score of their individual inputs, following a normal distribution curve.
Input factors show which model inputs contributed favorably, neutrally or unfavorably to the ranking
• Calculated as holdings-weighted average score
• S&P Capital IQ views rankings of Overweight, Marketweight and Underweight as favorable, neutral and unfavorable, respectively.
Percentages highlight coverage for holdings-based inputs:
• % shows S&P Capital IQ coverage (ex: 99% have a STARS opinion, 95% have a Fair Value)
For definitions of each input, and details on score calculations, please see the Appendix. For illustrative purposes only.

Who Said Your Beta Was So Smart?: Dividends
iShares Core High Dividend (HDV)vs.
Vanguard High Dividend Yield (VYM)*
0 5 10 15 20 25
Financials
Energy
Consumer Staples
HDV
VYM
*Better 2015 performer. Source: S&P Capital IQ. As of December 31, 2015
% of assets
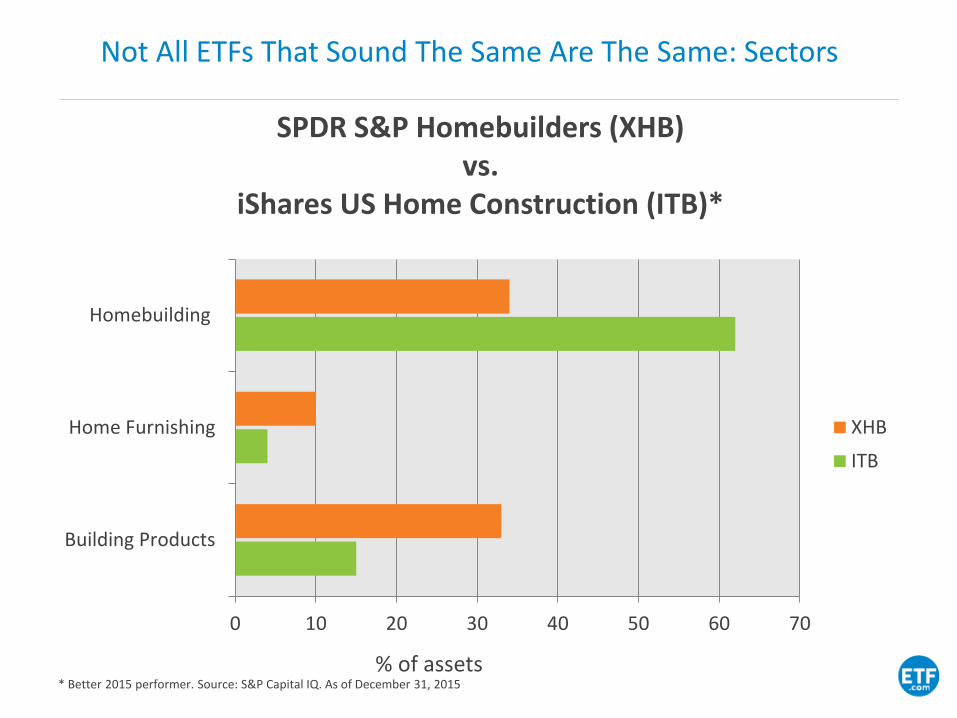
Not All ETFs That Sound The Same Are The Same: Sectors
SPDR S&P Homebuilders (XHB)vs.
iShares US Home Construction (ITB)*
0 10 20 30 40 50 60 70
Building Products
Home Furnishing
Homebuilding
XHB
ITB
* Better 2015 performer. Source: S&P Capital IQ. As of December 31, 2015
% of assets

Should You Wait Three Years Before Investing in ETFs?
or
For illustrative purposes only.

Nearly 50 ETFs Gathered $250M Despite Being Under Three
• ProShares S&P 500 Dividend Aristocrats (NOBL)• Record of raising dividend 25 consecutive years.
• Favorable risk considerations of holdings according to S&P Capital IQ.
• iShares Short Maturity (NEAR)• 30-day SEC yield of 1.0% with duration less than 0.5 years.
• Trades approximately 600,000 shares daily with tight bid/ask spread.
Source: S&P Capital IQ. As of December 31, 2015.
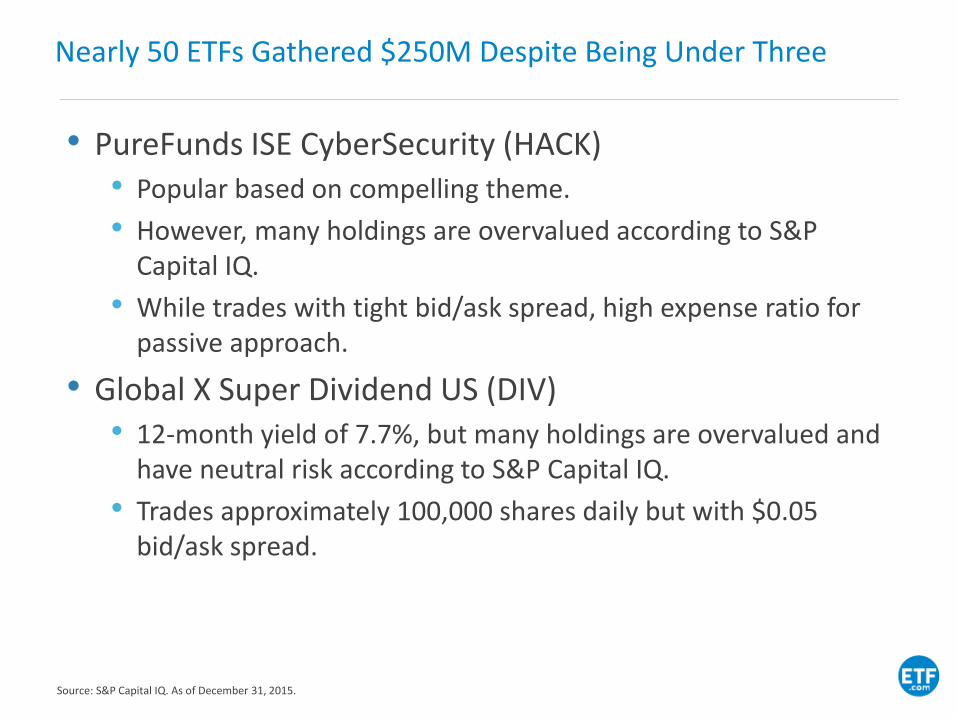
Nearly 50 ETFs Gathered $250M Despite Being Under Three
• PureFunds ISE CyberSecurity (HACK)• Popular based on compelling theme.
• However, many holdings are overvalued according to S&P Capital IQ.
• While trades with tight bid/ask spread, high expense ratio for passive approach.
• Global X Super Dividend US (DIV)• 12-month yield of 7.7%, but many holdings are overvalued and
have neutral risk according to S&P Capital IQ.
• Trades approximately 100,000 shares daily but with $0.05 bid/ask spread.
Source: S&P Capital IQ. As of December 31, 2015.

Equity ETF Model Performance Through 12/31/15
For Illustrative Purposes Only

Appendix

ETF Model Portfolio Performance Disclosures
The exchange-traded fund (“ETF”) model performance chart is only an illustration of S&P ETF research; it shows how all ETF’s that received a particular Overall S&P ETF ranking of Overweight,Marketweight or Underweight performed. The Overall S&P ETF rankings in the above chart are model portfolios only; they are not collective investment funds. (The ETF model portfolios are alsocollectively referred to as “model” or “model portfolio”.) Model performance has inherent limitations. The ETF model performance does not show how any actual portfolio has performed. ETFmodel performance does not represent the results of actual trading of investor assets. S&P maintains the model and calculates the model performance shown or discussed, but does not manageactual assets. Thus, the performance shown or discussed does not reflect the impact that material economic and market factors had or might have had on decision-making if actual investormoney had been managed. Performance of an investor’s actual portfolio will not necessarily match the performance of the model portfolio due to differences in the weightings of the individualsecurities. In addition, the model results do not take into account timing differences between the selections by S&P and purchases that were or would have been made based on those selectionsby any advisor or by actual investors. While model performance for some or all ETF ranking categories may have performed better than the illustrative reference point for the period shown, theperformance during any shorter period may not have, and there is no assurance that the model will perform better than the illustrative reference point in the future. The model does not take intoaccount any particular investment objective, financial situation or need and are not intended as an investment recommendation or strategy. Investments based on the ETF methodology may losemoney. Past performance of the ETF model is no guarantee of future results.
Performance is calculated daily using a time-weighted rate of return. The model performance calculation takes into account dividends and distributions but does not take into accountreinvestment of dividends. ETF’s in each model will change over time, and some or all of the ETF’s that received rankings during the time period shown may not have maintained their rankingduring the entire period.
For model performance calculation purposes, the ETF’s within each model at October 14, 2008 were equally weighted. Thereafter, additions to the composition of the ETF’s in each model aremade at the average market value of the ETF model at the preceding month end with no rebalancing. The average market value of the ETF equals the total market value of the ETF model at theprior month-end divided by the number of ETFs in the ETF model at the prior month-end. The number of shares of the new ETF added equals the average value of an ETF in the ETF model at thepreceding month-end divided by the price of the added ETF at the close of the day it was added. The number of shares remains fixed unless there is a subsequent distribution. Subsequent to theaddition of the equity, the performance calculation is based on the number of shares and the daily closing prices. An ETF is deleted in its entirety, and the deletion is made at the closing price ofthe day that the deletion is made.
ETF model performance reflects the fees and expenses of the underlying ETFs. The model performance does not consider taxes and brokerage commissions, nor does it reflect the deduction ofany advisory or other fees charged by advisors or other parties that investors will incur when their accounts are managed in accordance with the model. The imposition of these fees and chargeswould cause actual performance to be lower than the performance shown. For example, if the model returned 10 percent on a $100,000 investment for a 12-month period (or $10,000) and anannual asset-based fee of 1.5 percent were imposed at the end of the period (or $1,650), the net return would be 8.35 percent (or $8,350) for the year. Over 3 years, an annual 1.5% fee taken atyear end with an assumed 10% return per year would result in a cumulative gross return of 33.1%, a total fee of $5,375 and a cumulative net return of 27.2% (or $27,200).
An investment based upon any of the models should only be made after consulting with a financial advisor and with an understanding of the risks associated with any investment in securities,including, but not limited to, market risk, currency risk, political and credit risks, the risk of economic recession and the risk that issuers of securities or general stock market conditions mayworsen, over time. Foreign investing involves certain risks, including currency fluctuations and controls, restrictions on foreign investments, less governmental supervision and regulation, lessliquidity and the potential for market volatility and political instability. As with any investment, investment returns and principal value will fluctuate, so that when redeemed, an investor’s sharesmay be worth more or less than their original cost.
Benchmark Disclosure
The S&P 500 index is the benchmark for the ETF model portfolios. Indexes are unmanaged, statistical composites and their returns do not reflect payment of any sales charges or fees an investorwould pay to purchase the securities they represent. Such costs would lower performance. It is not possible to invest directly in an index. The methodology for calculating the return of the S&P500 index differs from the methodology for calculating returns for the ETF ranking categories. The S&P 500 index has different risk characteristics than the ETF model portfolios, and itsperformance calculation takes into account reinvestment of dividends and distributions. Past performance of the S&P 500 Index is no guarantee of future results.