presented by: steven landau, economic development research ... · 1 presented by: steven landau,...
TRANSCRIPT

1
Presented by:
Steven Landau, Economic Development Research Group
Rimon Rafiah, Economikr
Presented at:
I-TED 2011 INTERNATIONAL TRANSPORTATION ECONOMIC DEVELOPMENT CONFERENCE
May 1-3, 2011
Charleston, WV
Identify LONG-TERM Economic Impacts from New/Capacity-Enhancing Highway Investments
Provide Findings that Illustrate the Interaction between Highway Infrastructure and Non-Highway Investments and Initiatives
Develop Preliminary Assessment Guidance for Policy-makers and Practitioners
Design Case-Based Web-Based Tool for Illustrating and Communicating Economic Impacts
Create Flexible System for Adding New Cases
2

Synthesis of Case Studies/Interviews
Focused on project types & factors influencing economic
impacts
Literature Review
Assessed prior studies, cases & ED research
Assessment of Existing Models
Reviewed structural composition of ED models
Statistical Analysis of Case Data
Identified key interactions & controlled for key factors
Common Sense

4
Project TypeNo. Cases
Median cost per mile (millions)
Median AADT
Access Road 7 $1.61 5,502Beltway 8 $30.68 88,000Bridge (includes 1 non-US) 9 $39.22 23,600Bypass (includes 2 non-US) 11 $5.34 19,774Connector 8 $21.79 16,910Interchange 12 $14.05 53,450Limited Access Road 14 $11.05 46,150Widening 9 $46.17 24,000Freight Intermodal 10 n/a n/aPassenger Intermodal 9 n/a n/aAll Project Types (excluding 3 international)
97 $14.98 28,856

0
5
10
15
Roadway Point-to-Point FreightIntermodal
PassengerIntermodal
Nu
mb
er
of
job
s p
er
$1M
(Beltway, Bypass,
Major Highway,
Widening)
(Access Road, Bridge,
Connector,
Interchange)
Jobs reflect total economic impacts
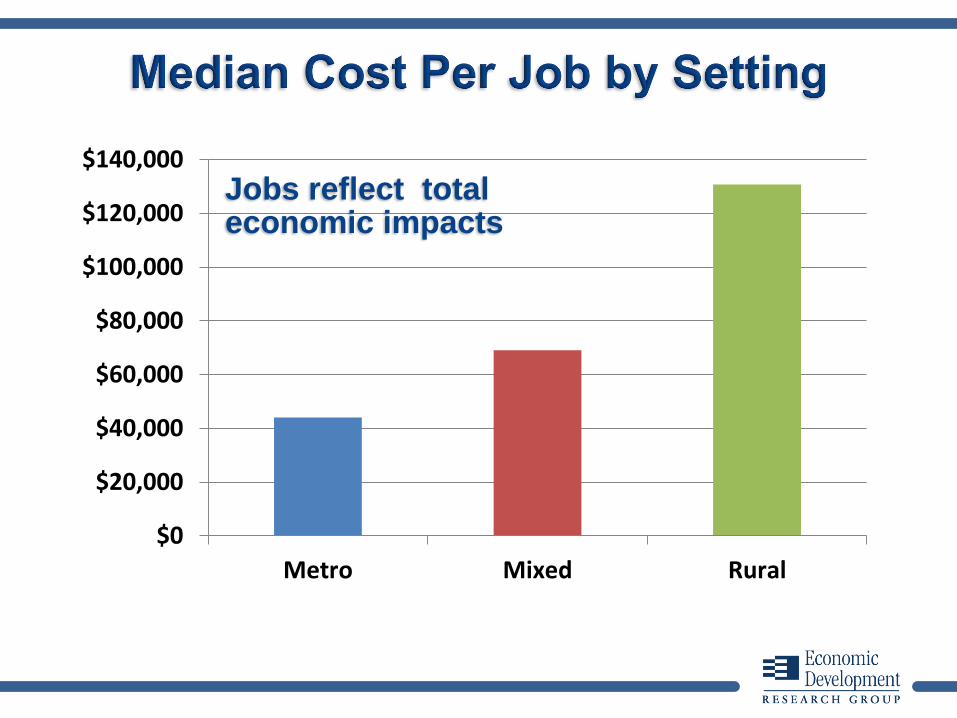
$0
$20,000
$40,000
$60,000
$80,000
$100,000
$120,000
$140,000
Metro Mixed Rural
Jobs reflect total economic impacts
7
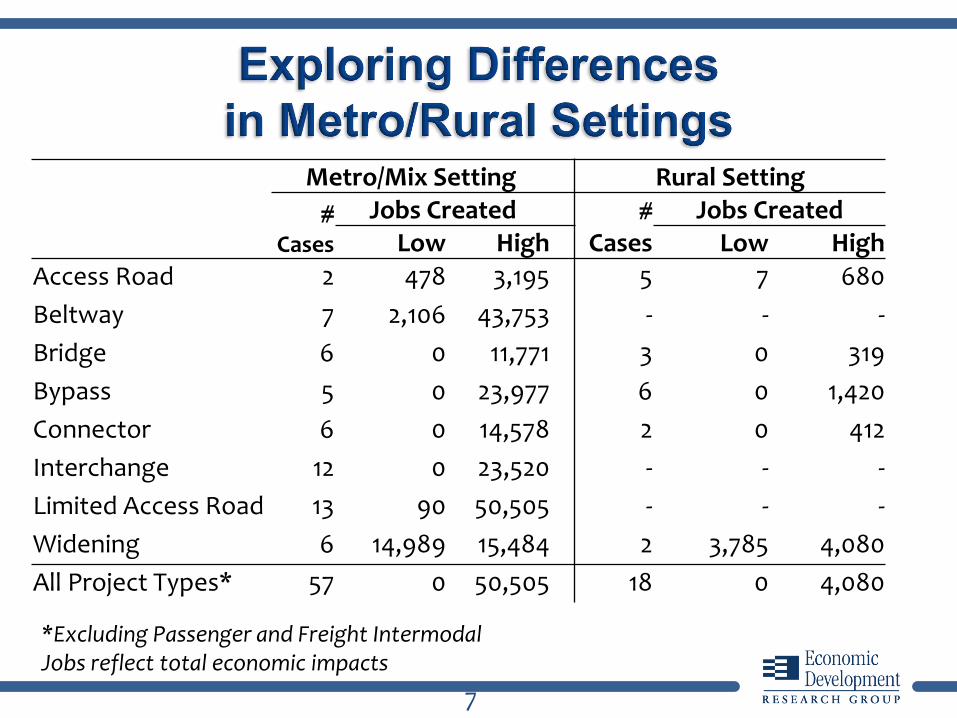
Metro/Mix Setting Rural Setting
# Cases
Jobs Created # Cases
Jobs CreatedLow High Low High
Access Road 2 478 3,195 5 7 680
Beltway 7 2,106 43,753 - - -
Bridge 6 0 11,771 3 0 319
Bypass 5 0 23,977 6 0 1,420
Connector 6 0 14,578 2 0 412
Interchange 12 0 23,520 - - -
Limited Access Road 13 90 50,505 - - -
Widening 6 14,989 15,484 2 3,785 4,080
All Project Types* 57 0 50,505 18 0 4,080
*Excluding Passenger and Freight IntermodalJobs reflect total economic impacts
8
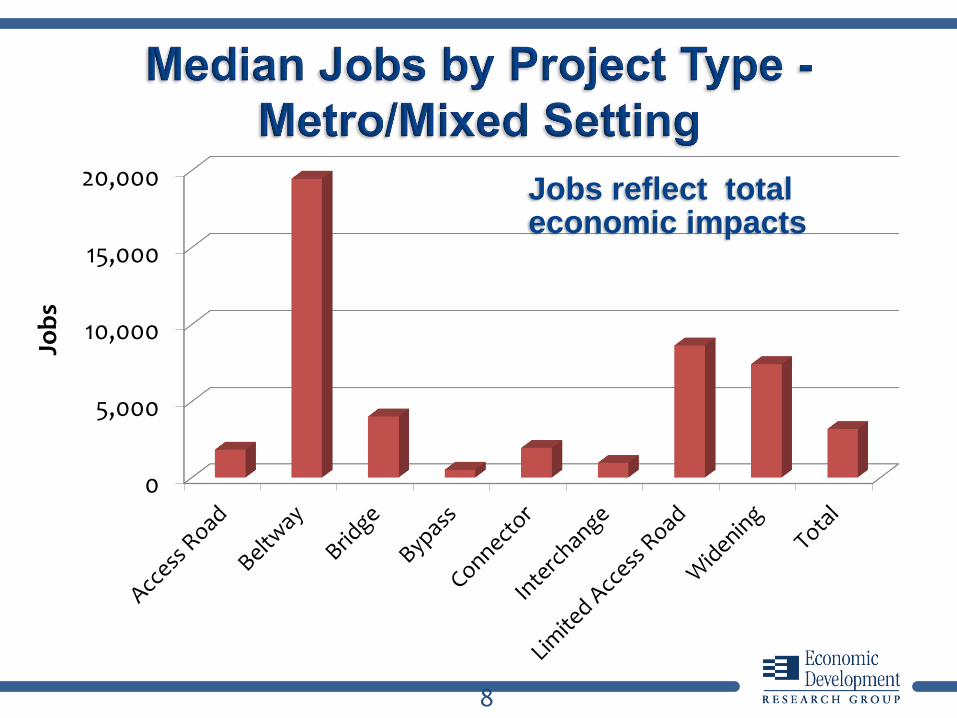
0
5,000
10,000
15,000
20,000
Job
s
Jobs reflect total economic impacts

9
0
20
40
60
80
100
Job
s P
er
$1M
Jobs reflect total economic impacts
* Excluding Passenger and Freight Intermodal

10
0
5
10
15
20
25
30
35
Job
s p
er
$1 M
illi
on
* Excluding Passenger and Freight Intermodal
Jobs reflect total economic impacts
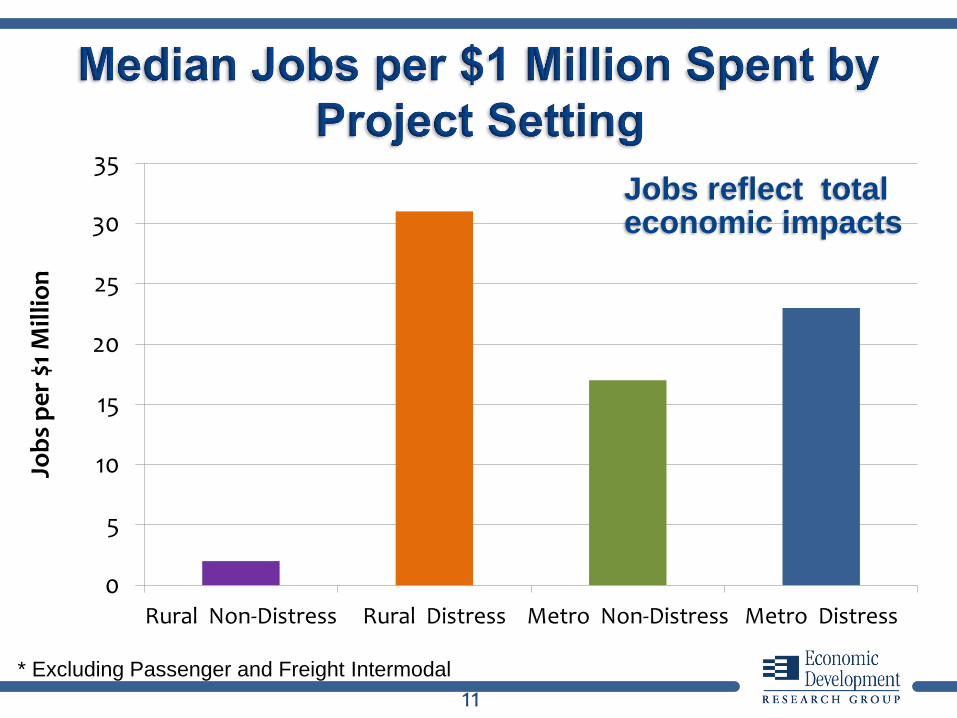
11
0
5
10
15
20
25
30
35
Rural Non-Distress Rural Distress Metro Non-Distress Metro Distress
Job
s p
er
$1 M
illi
on
* Excluding Passenger and Freight Intermodal
Jobs reflect total economic impacts
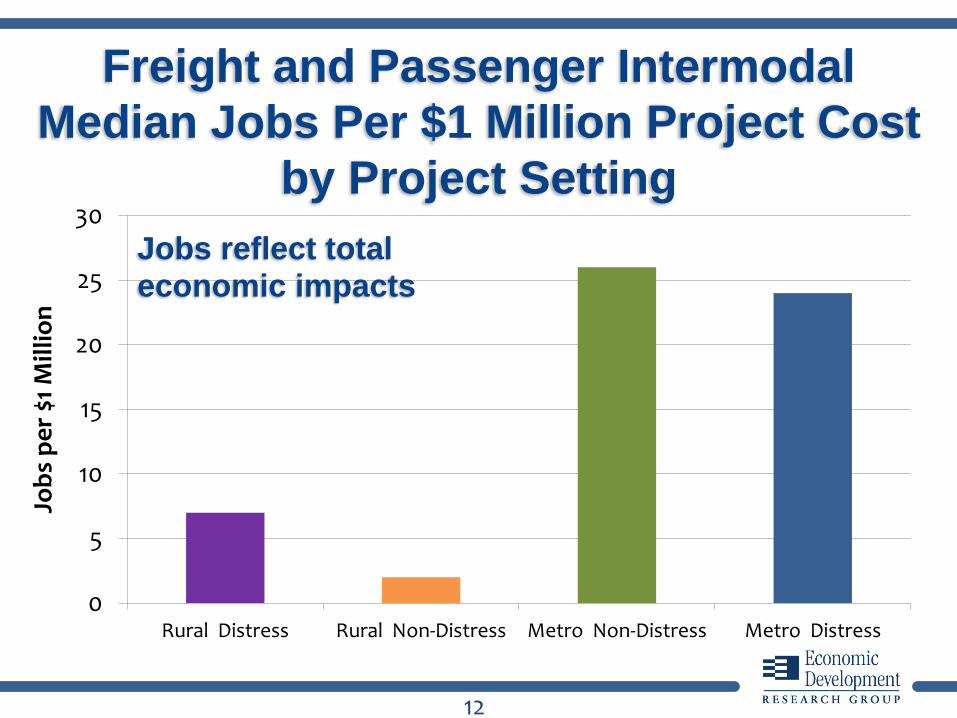
12
0
5
10
15
20
25
30
Rural Distress Rural Non-Distress Metro Non-Distress Metro Distress
Job
s p
er
$1 M
illi
on
Freight and Passenger Intermodal
Median Jobs Per $1 Million Project Cost
by Project Setting
Jobs reflect total economic impacts
13
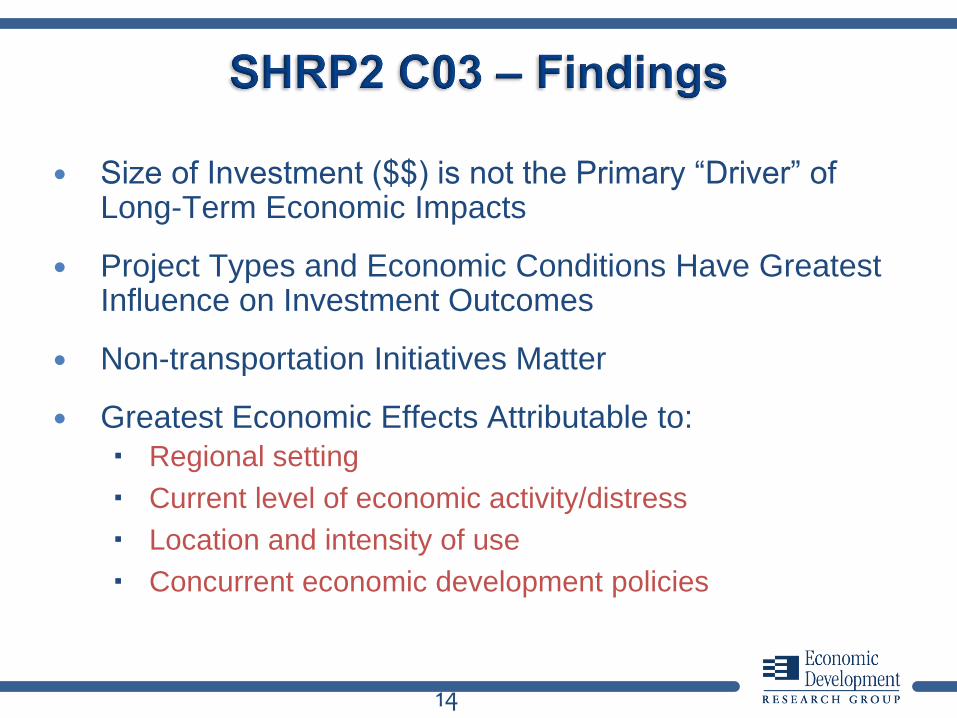
Size of Investment ($$) is not the Primary “Driver” of Long-Term Economic Impacts
Project Types and Economic Conditions Have Greatest Influence on Investment Outcomes
Non-transportation Initiatives Matter
Greatest Economic Effects Attributable to:
Regional setting
Current level of economic activity/distress
Location and intensity of use
Concurrent economic development policies
14
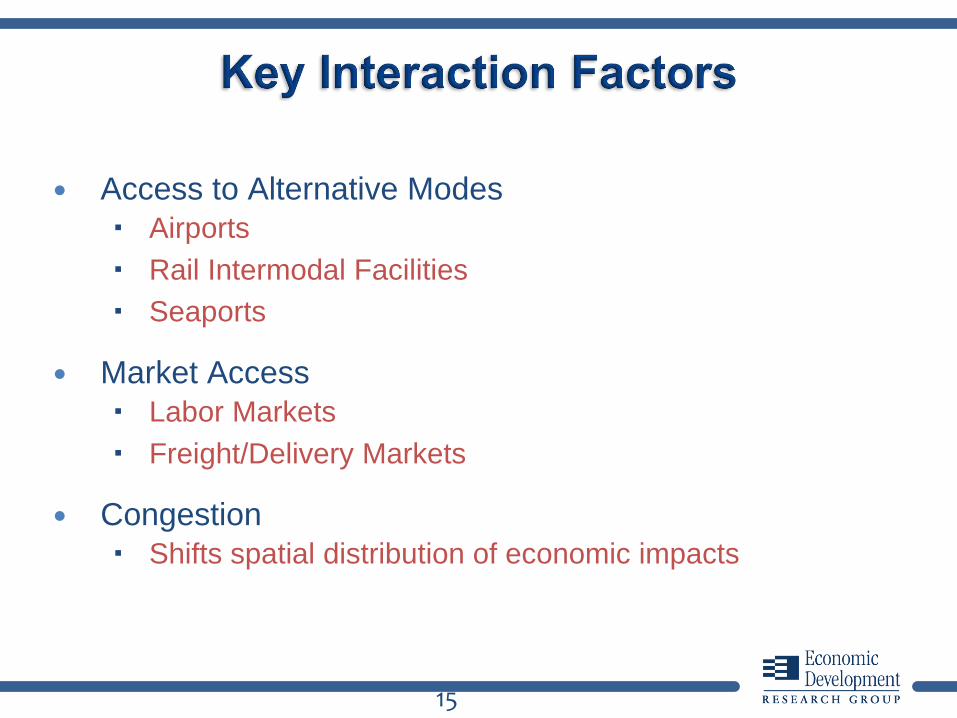
Access to Alternative Modes
Airports
Rail Intermodal Facilities
Seaports
Market Access
Labor Markets
Freight/Delivery Markets
Congestion
Shifts spatial distribution of economic impacts
15
16
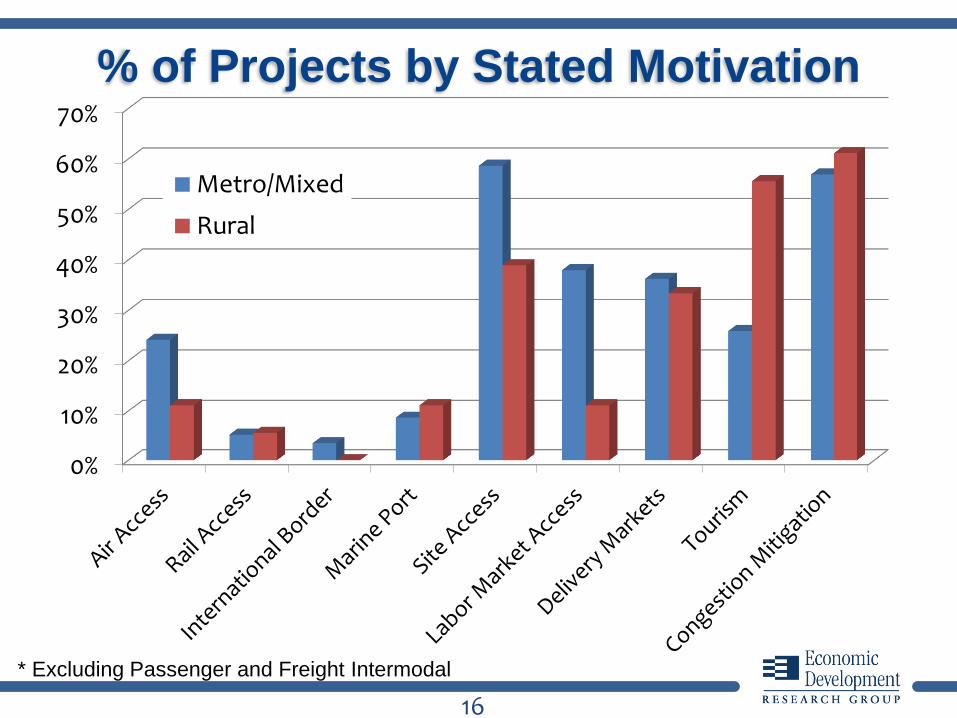
0%
10%
20%
30%
40%
50%
60%
70%
Metro/Mixed
Rural
% of Projects by Stated Motivation
* Excluding Passenger and Freight Intermodal
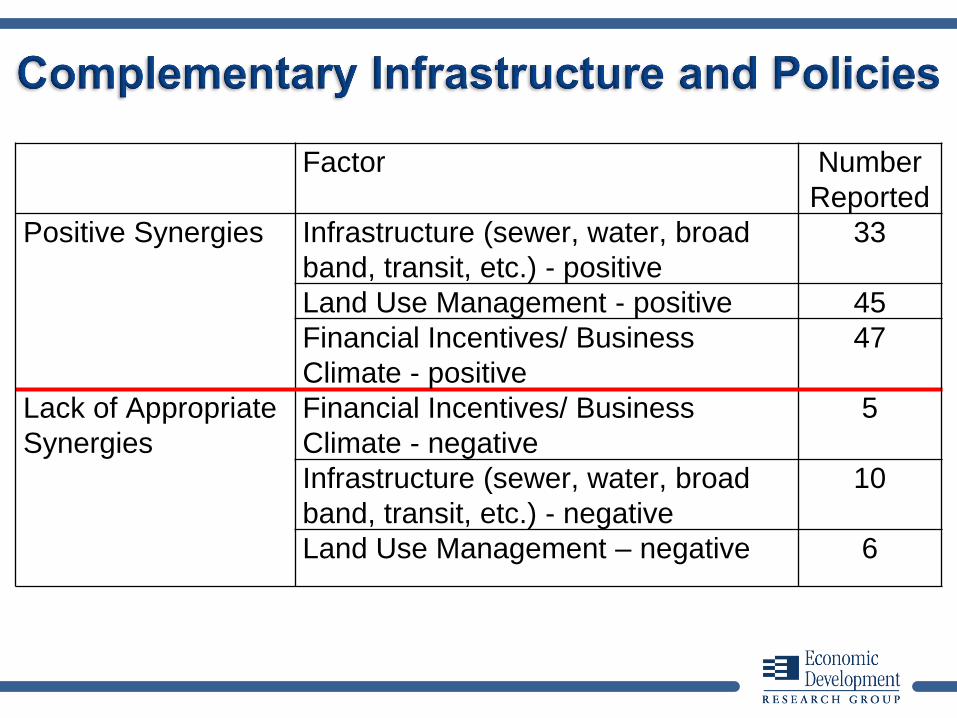
Factor Number
Reported
Positive Synergies Infrastructure (sewer, water, broad
band, transit, etc.) - positive
33
Land Use Management - positive 45
Financial Incentives/ Business
Climate - positive
47
Lack of Appropriate
Synergies
Financial Incentives/ Business
Climate - negative
5
Infrastructure (sewer, water, broad
band, transit, etc.) - negative
10
Land Use Management – negative 6
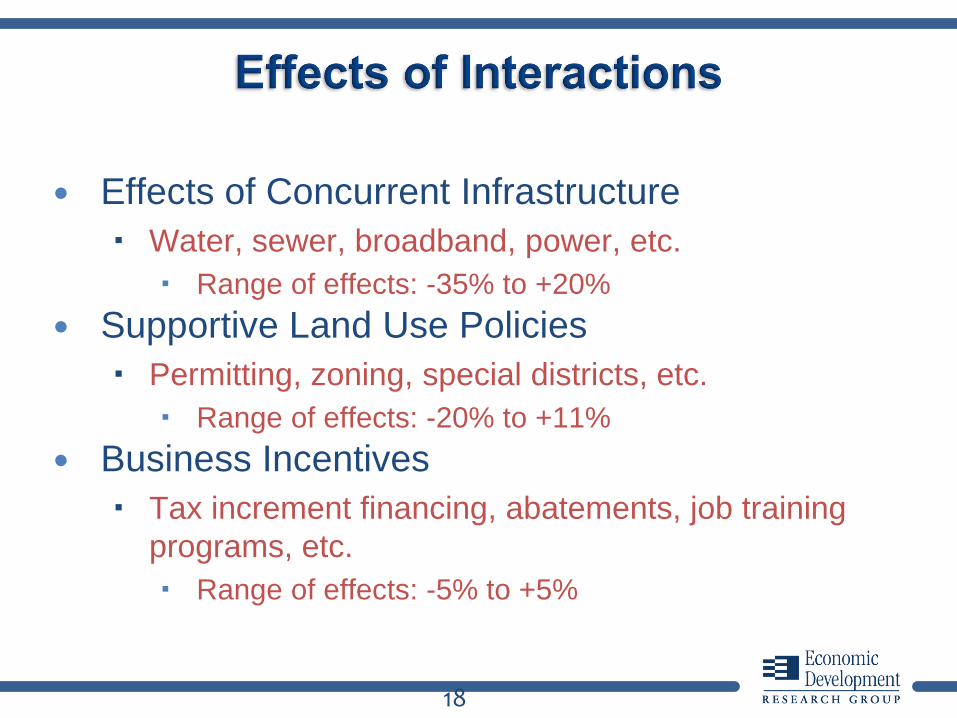
Effects of Concurrent Infrastructure
Water, sewer, broadband, power, etc.
Range of effects: -35% to +20%
Supportive Land Use Policies
Permitting, zoning, special districts, etc.
Range of effects: -20% to +11%
Business Incentives
Tax increment financing, abatements, job training
programs, etc.
Range of effects: -5% to +5%
18
Regression Analysis
19
20
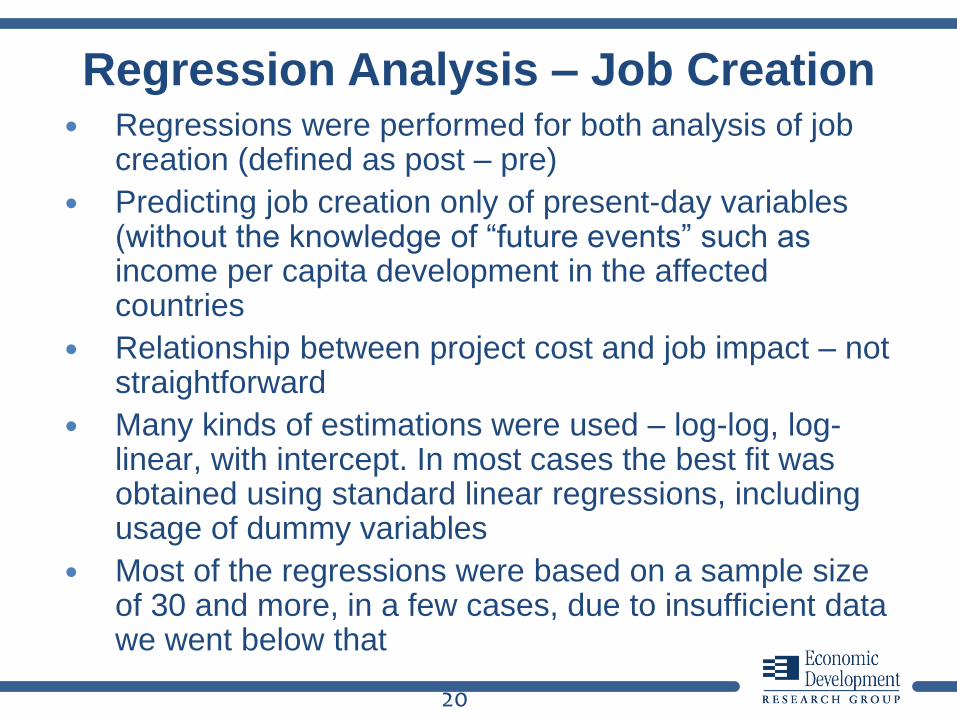
Regression Analysis – Job Creation Regressions were performed for both analysis of job
creation (defined as post – pre)
Predicting job creation only of present-day variables (without the knowledge of “future events” such as income per capita development in the affected countries
Relationship between project cost and job impact – not straightforward
Many kinds of estimations were used – log-log, log-linear, with intercept. In most cases the best fit was obtained using standard linear regressions, including usage of dummy variables
Most of the regressions were based on a sample size of 30 and more, in a few cases, due to insufficient data we went below that

21
Regression Analysis – Job Creation
Project
Population
Significant Explanatory Variables for Predicting Direct Job
Impacts
(those with statistical significance of over 80%)
R2adj
Rural Projects,
Point to Point and
Roadway
Level of Traffic Activity (VMT)
Market Scale (pop. size)
Underlying Growth Trend (per capita income growth)
Economic Health (per capita income level)
70.2%
Metro & Mixed,
Roadway Projects
Level of Traffic Activity (AADT)
Project Scale (Lane Miles)
Urbanization (Population Density)
Market Scale (pop. size)
Underlying Growth Trend (local population & job growth)
80.9%
Metro, Road Level of Traffic Activity (AADT)
Project Scale (Lane Miles)
Urbanization (Population Density)
Underlying Growth Trend (local population & job growth)
90.9%

22
Regression Analysis – Job Creation (cont.)
Project
Population
Significant Explanatory Variables for Predicting Direct Job
Impacts
(those with statistical significance of over 80%)
R2adj
Mixed, Road Level of Traffic Activity (AADT)
Project Scale (Lane Miles)
Urbanization (Population Density)
Market Scale (pop. size)
Terrain (Mountain Terrain)
85.2%
Urban, Point to
Point
Economic Distress (dummy variable)
Underlying Growth Trend (regional job & income growth)
57.5%
Rural & Mixed,
Point to Pont
Level of Traffic Activity (VMT)
Urbanization (Population Density)
Underlying Growth Trend (regional & local income growth)
Economic Health (per capita income level)
88.3%

23
Regression Analysis – Job Creation using
present-day variables
Project Population Variables for Direct Jobs – Present
Knowledge Only
R2adj Stat.
Significance
Rural Projects,
Point to Point and
Roadway
Project Scale (miles) 42% 88%
All Roadway
Projects
Level of Traffic Activity (AADT)
Project Scale (Lane-miles)
Urbanization (Population Density)
Market Scale (pop. size)
41% 70%
Metro and Mixed
Roadway Projects
Level of Traffic Activity (AADT)
Project Scale (Lane-miles)
Urbanization (Population Density)
Market Scale (pop. Size)
35% 70%
24
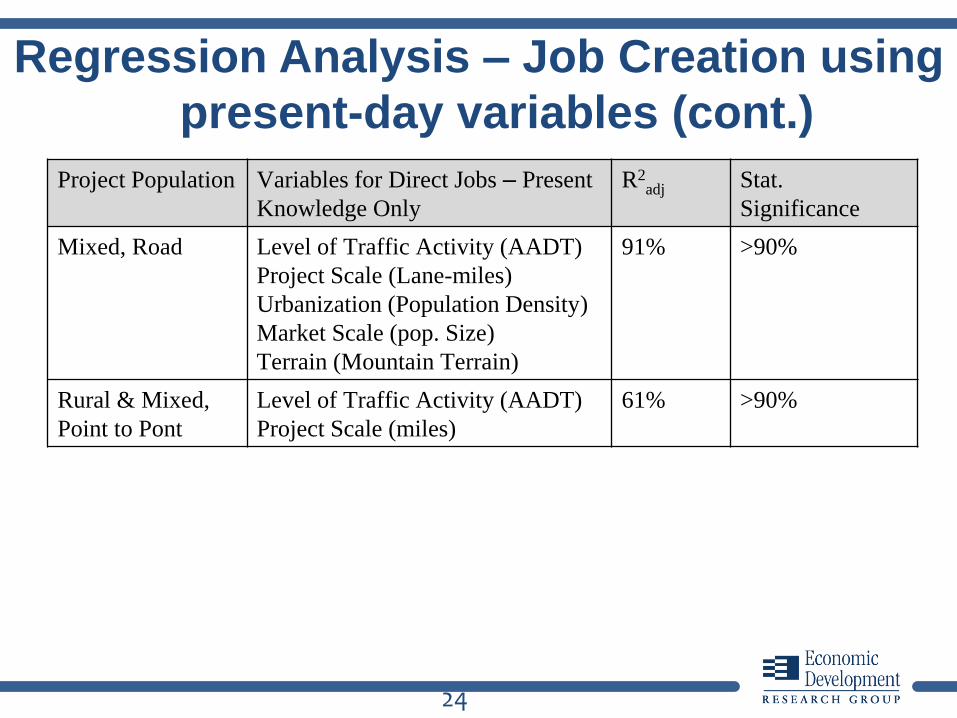
Regression Analysis – Job Creation using
present-day variables (cont.)
Project Population Variables for Direct Jobs – Present
Knowledge Only
R2adj Stat.
Significance
Mixed, Road Level of Traffic Activity (AADT)
Project Scale (Lane-miles)
Urbanization (Population Density)
Market Scale (pop. Size)
Terrain (Mountain Terrain)
91% >90%
Rural & Mixed,
Point to Pont
Level of Traffic Activity (AADT)
Project Scale (miles)
61% >90%
25
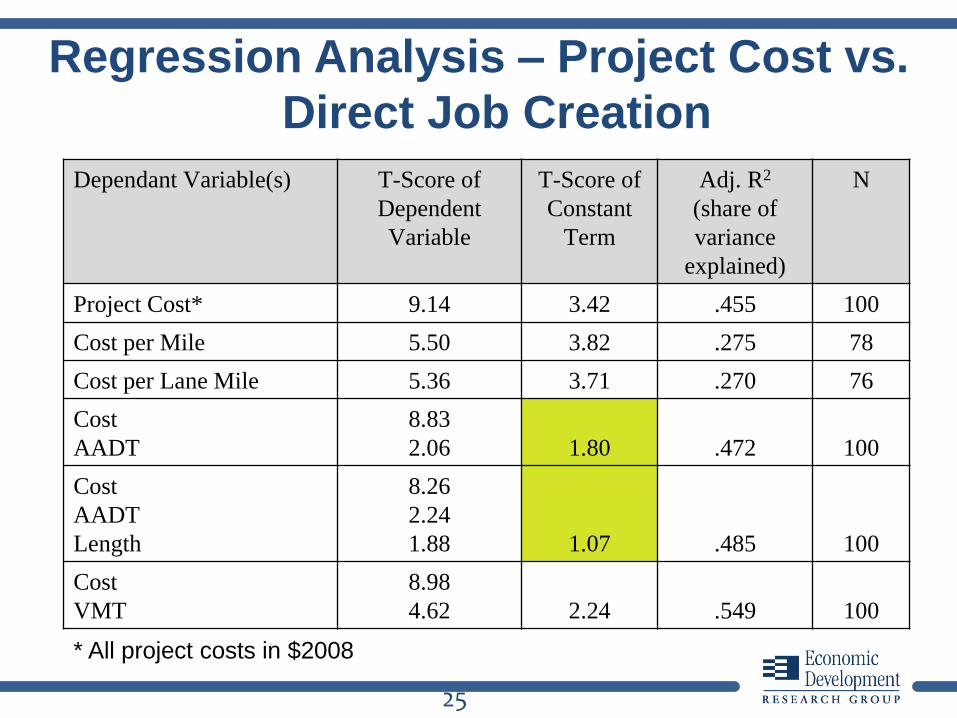
Regression Analysis – Project Cost vs.
Direct Job Creation
Dependant Variable(s) T-Score of
Dependent
Variable
T-Score of
Constant
Term
Adj. R2
(share of
variance
explained)
N
Project Cost* 9.14 3.42 .455 100
Cost per Mile 5.50 3.82 .275 78
Cost per Lane Mile 5.36 3.71 .270 76
Cost
AADT
8.83
2.06 1.80 .472 100
Cost
AADT
Length
8.26
2.24
1.88 1.07 .485 100
Cost
VMT
8.98
4.62 2.24 .549 100
* All project costs in $2008

26
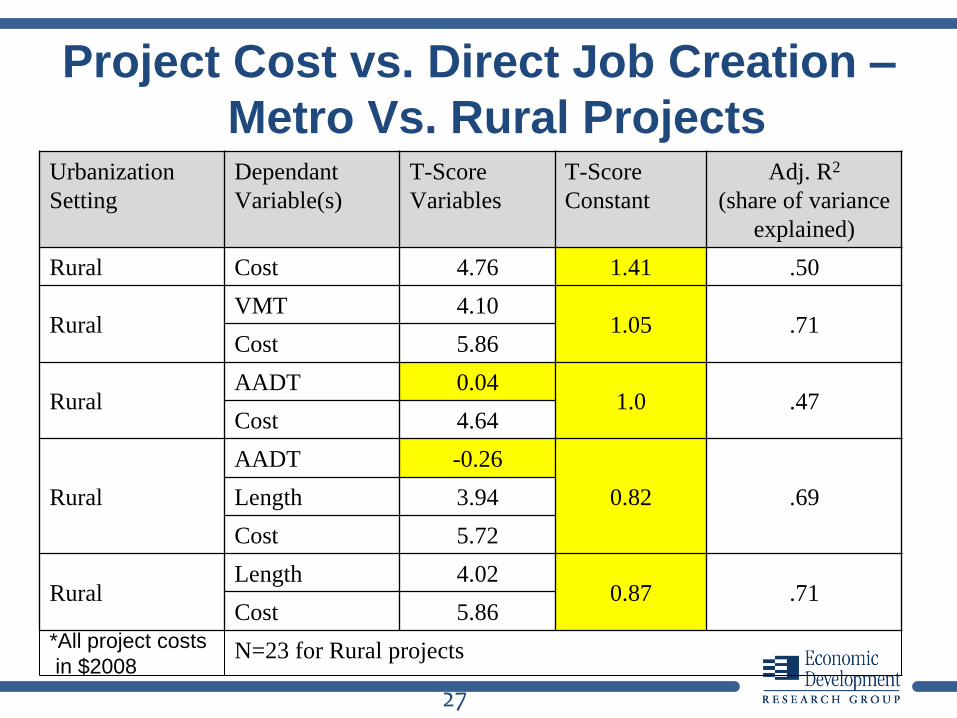
Project Cost vs. Direct Job Creation –
Metro Vs. Rural Projects
*All project
costs in $2008
Urbanization
Setting
Dependant
Variable(s)
T-Score
Variables
T-Score
Constant
Adj. R2
(share of variance
explained)
Metro Cost 7.82 3.56 .44
MetroVMT 3.85
2.41 .53Cost 7.73
MetroAADT 1.35
2.09 .45Cost 7.63
Metro
AADT 1.55
1.37 .46Length 1.53
Cost 7.11
MetroLength 1.33
2.81 .45Cost 7.37
N= 77 for Metro and Mixed
27
Project Cost vs. Direct Job Creation –
Metro Vs. Rural Projects
*All project costs
in $2008
Urbanization
Setting
Dependant
Variable(s)
T-Score
Variables
T-Score
Constant
Adj. R2
(share of variance
explained)
Rural Cost 4.76 1.41 .50
RuralVMT 4.10
1.05 .71Cost 5.86
RuralAADT 0.04
1.0 .47Cost 4.64
Rural
AADT -0.26
0.82 .69Length 3.94
Cost 5.72
RuralLength 4.02
0.87 .71Cost 5.86
N=23 for Rural projects

28
The project cost, in most cases, is not a good predictor of the number of jobs which might be created.
Job creation is mostly dependent on the type of project, and its underlying characteristics
Future job creation is dependent not only on the project investment, but how that investment is parlayed into the development of the specific area where the project is located (in terms of higher per capita income, etc.).
A wonderful opportunity exists now to measure investment (ARRA) and its future effects – road for further research and analysis.
29
Economic Development Research Group, Inc.
In Association With:
ICF International
Cambridge Systematics, Inc.
Wilbur Smith Associates, Inc.
Susan Jones Moses and Associates
SHRP2 C03: Interactions between Transportation Capacity, Economic
Systems, and Land Use

30
Steven Landau Rimon Rafiah
Economic Development
Research Group
Economikr
2 Oliver St., Boston MA 02109 22 Yashfe St, Modiin Israel
71725
617-338-6775 x 206 +972-73-737-3513
[email protected] [email protected]
www.edrgroup.com www.economikr.com