presented at the 58th convention november 4-7, 1977 …€¦ · his idea was to analyze the signal...
TRANSCRIPT

preprint no. 1265 (7_,-_)
FAST PITCH DETECTION
By
Russell O. HammGotham Audio CorporationNew York, New York
presented at the58th ConventionNovember 4-7, 1977NewYork
AN AUDIO ENGINEERING SOCIETY PREPRINT.This prep/tint has been reproduced from the author's advancemanuscript, without editing, corrections or consideration by theReview Board. For this reason there may be changes should fhispaper be published in the Audio Engineering Society JournalAdditiona/ preprints may be obtained by sending request andremittance to the Audio Engineering Society, Room 449, 60 East42nd Street, New York, N.Y. 10017.©Copyright 1977 by the Audio Engineering Society. ,N/ rightsreserved. Reproduction of this preprint, or any portion thereof, isnot permitted without direct permission from the pub/icationoffice of the Society.

FAST ?I?CI_ DLTIDT!ON
Ju_ell O. Har_ *
Gotham Audio Co:'pora_ion, Nel. Yon'k, N.Y.
I. Introduction
The definite trend _n audio equipment design engineering today is toward
digital systems. However, most of this effort is aimed at digital reali-
zations of well perfected analog systems in order to gain minor improvements
in their performance. The major breakthroughs which digital systems promise
in the areas of signal analysis, synthesis and information compression still
-seem a long way off. Perhaps.the major reason for this lag is the difficulty
of grasping the new digital concepts as opposed to the established ones.
Traditionally, analog signal systems are based on the concepts of integ_atlon
and differentiation where continuance of time and amplitude relationships are
involved. Such concepts are difficult to conceptualize in digital systems
where all operatlons must he structured as discrete, binary statements.
The pitch system this paper _ill describe is s small but important step
forward In digital signal analysis. It is a first step toward our goal of
making practical use of a power analytical tool, the Fast Fourier Transform.
This project was undertaken largely due to the individual interest and
continuous financial support of Mr. Walter E. Sear. Mr. Sear, a strong
proponent of the music synthesizer from its infancy, thought that musical
Instruments of the future must he structured as analysls/synthesizer systems.
His idea was to analyze the signal of a guitar, extract its basic pitch and
use this to control the Moog synthesizer thus producing sounds a _ibrating
string could not possibly generate. Of course, the test of _ny good idea
comes in its application. In this case, it required many years of dedicated
work by some very talented people.
II. Waveform Model
The first step in developing a complex wave analysis system is to develop a model
of the waveform that can be generated in the laboratory under controlled conditions.
This can prove to he the most important step of any design effort and sometimes the
most difficult. While there has been a _reat deal of study in mathematically modeling
the vibrating string, (i) (2) most of this deals with ideal conditions which are not
found in musical instruments. In the case of the Eultar, the vibration is inltiated
by plucklng the string with a pick. The string is supported at one end by a metal
bridge and at the other end by metal fretts along the neck. The fretts are spaced
to produce _ tone musical intervals over a scale of two octaves on each of the six
* Currently Application_ knz-ineer _-ithGoLham Audio
--1--
strings. While in overview the instrument's design seems straight forward_'_imost
ideal, the waveforms it generates are extremely complex end do not lend th_elves/
to simple mathematical modeling.
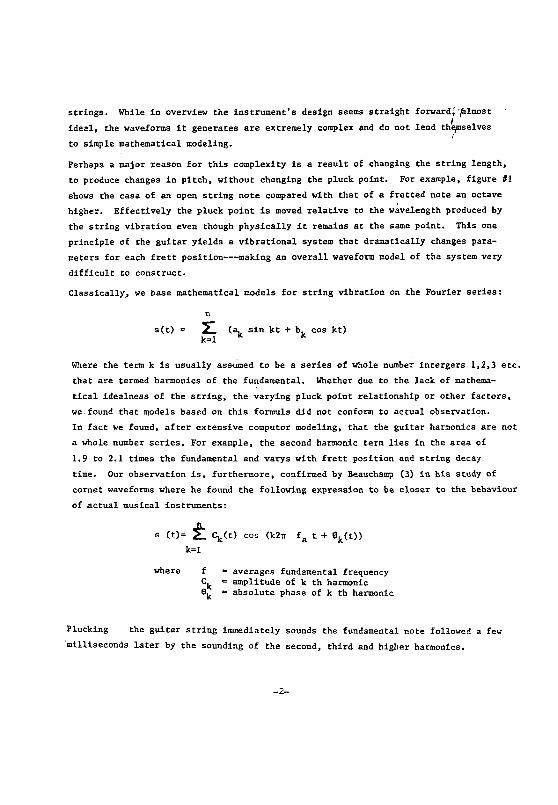
Perhaps a major _eason for this complexity is a result of changing the string length,
to produce changes in pitch, without changing the pluck point. For example, figure #I
shows the case of an open string note compared with that of a fretted note an octave
higher. Effectively the pluck point is moved relative to the wavelength produced by
the string vibration even though physically it remains at the same point. This one
principle of the guitar yields a vibrational system that dramatically changes para-
meters for each frett position---making an overall waveform model of the system very
difficult to construct.
Classically, we base mathematical models for string vibration on the Fourier series:
s(t) = _KL (ak sin kt + b k cos kt)k=l
Where the term k is usually assumed to be a series of whole number intergers 1,2,3 etc.
that are termed harmonics of the fundamental. Whether due to the lack of mathema-
tical idealness of the string, the varying pluck point relationship or other factors,
we found that models based on this formula did not conform to actual observation.
In fact we found, after extensive computor modeling, that the guitar harmonics are not
a whole number series. For example, the second harmonic term lies in the area of
1.9 to 2.1 times the fundamental and varys with frett position and string decay
time. Our observation is, furthermore, confirmed by Beauchamp (3) in his study of
cornet waveforms where he found the following expression to be closer to the behaviour
of actual musical instruments:
s (t)= _" Ck(t ) cos (k2w fa t + Ok(t))
k=I
where f = averages fundamental frequency
Ck = amplitude of k th harmonic
8k = absolute phase of k th harmonic
Plucking the guitar string immediately sounds the fundamental note followed a few
milliseconds later by the sounding of the second, third and higher harmonics.
-2-

This hehaviourholds true for almost all musical instruments (4) (5), however,
observations of the guitar string's harmonics revealed they actually change fre-
quency as they rise and decay forming clear beat note patterns with the fundamental.
Not only can these patterns be seen on an oscilloscope, they are also q,,_teaudible
on many guit@r frett posltions. Figure 2 shows the waveforms produced by playing
fretts A through C on the B string. Each photograph was taken 250milllseconds
after actually plucking the string to allow the second harmonic to reach full
amplitude. They clearly show the phase change of the second harmonic relative to
the fundamental for each note. Observing these same waveforms over longer periods
of time on an oscillograph reveals clear beat note patterns produced by the second
harmonic as it contlnuously changes its phase.
The waveform of Figure 3 while remarkahly resemhliug the previous oue was actually
produced by two laboratory function generators tuned to a frequency ratio of 1:2.1.
Comparing this closely wlth the guitar notes of Figure 2 shows a clear correlation
of the waveforms. And, pretuning the generators to frequency intervals such as
1:1.9 or 1:2.05 produces various heat patterns which very accurately resemble those
of the _ultar throughout most of its range. That this correlation of waveforms
exists and that the laboratory model should he so simple is to grossly underestimate
the untold hours of searching behind discovering this relationship. These para-
graphs only briefly cover a derivation that could easily be the basis for an entire
paper.
While our simple model does not totally describe the behaviour of the guitar waveform
under all conditions, by using it we were able to see problems in developing our
pitch tracking systems which would have taken much longer using the actual transient
waveform0f the guitar. With hindsight we can state that throughout this work we
found excellent correlation between the behaviour of our circuitry with this test
signal andwlth that of the actual guitar generated signal.
III. Analog Filtering
Using filters to separate the fundamental from the harmonics is a logical approach
to obtaining the pitch of a complex wave (6). Since each string of the guitar covers
a range of only two octaves, a low pass filter with a cut off frequency located at the
-j-

highest pitch for each string will eliminate all but the second and third harmonic
components from the waveform except for the open string where the fourth harmonic
will be _resent. However, in the previous section, analysls showed that the second
harmonic_Is the most troublesome component of the string waveform due to its
shifting phase as shown in Figure 2.
It is therefore necessary to eliminate all the second harmonic content which necessitates
using filters spaced less than one octave apart. Filtering each string separately
requires two filters per string or a total of t_elve for the whole instrument.
Since the frequency range of the guitar is only four octaves_ and the pitch system
will be monophonlc_ that is it will analyze only one pitch at a time, a better approach
is to use a bank of five filters spaced as shown in Figure 4. The level sensing
logic system of Figure 5 is then used to select the output of the fundamental filter
each time a new note is plucked. With proper logic switching only low pass, rather
than handpass, filters are required.
Results of our experiments show that filters must reject the second harmonic by more
than 40 dB for proper operation of the logic. We found this very critical sioce the
dynam/c range of the logic system must be able to track not only the string's full
dynamic range, but also discriminate low level in hand notes from those lying in the
frequency range which is only partially attenuated by a filter's skirt. To meet this
requirement we used ninth order eliptical filters with skirts approaching 500 dB/octave
(7). We constructed these using the state varlahle approach rather than other methods
since the circuitry is inherently easier to fine tune once the filter is assembled.
However, even using high precision components, we found the precise tuning of the
poles and zeros very tricky due to the rather high Q's involved. Figure 5 shows a
computor simulation of our final design for the 622 Hz filter while Figure 6 is a
spectrum analyzer sweep of the actual circuit. One thing our printout did not mention
is the fact that these filters are light sensitive due also to the high Q's and have
to be aligned in the dark.
With high Q filters, ringing is also a problem. Since the initial transient of a
plucked string presents a verysharp wavefront, it looks llke a pulse to the filter's
input. For a filter tuned to the fundamental frequency or above this transient has
little effect on the output. However, for the filters lower in frequency than the
fundamental this pulse will cause the high Q stages to ring. Therefore a slgnal
appears at the filter's outpu_ fo_ a period of time dependent on dampin_ eventhough
the wavetraln has no frequency in this range. This ringing triggers the logic clr-

cultry for that filter and this also has a release constant related to the frequencies
in its band. The end result is a time of uncertainty caused by the logic system's
inabillty to locate the filter with the true fundamental. Therefore, for a pitch
detection system using a bank of filters with logic switching, the uncertainty time
of one output will be directly related to the damping coefficients of the
lowest filter.
Oscillographs of actual pitch systems for the four octave
guitar range showed ringing could cause delays of 25 milliseconds in the
highest playing ranges of the guitar. In the lower ranges delay was minimal.
While 25milllseconds is not long in terms of the carts reaction time, this
problem combined with the difficulty of constructing such precision filters
required evaluation of an alternative approach.
IV. A Digital Approach
A detailed look at Figure 2 suggested to us that zero crossing detection in
conjunction with a software algorithm might be a method of extracting pitch
information from such complex waveforms. Using our test signal we generated
the wave pattern of Figure 7 which represents the behaviour of the guitar
signal over many cycles and clearly shows the beat pattern. Writing a com-
putor program that located negative zero crossing in the waveform and counted
the distance between them, we were able to construct Figure 8. For simplicity
we chose a fundamental frequency of I/2_ and a second harmonic of 2.125/_
producing a beat every eight cycles. Notice that the period 628 which
is the true pitch does not appear in the zero crossing pulse train. Most
of the pulses are spaced about one half this period but not exactly and never
quite the same Value. Since PLL (Phase Lock Loops) generally operate on this
principle of negative zero crossings, it is clear why such a device cannot
be used to track guitar forms. What actually is required is a type of control
algorlthmwhlch can selectively cancel out the extra zero crossings which
clearly are caused by the second harmonic beat note.
-5-

i ,I
I1 T
FIGURE _SA. BLOCK DIACRAM OF LOW PASS FILTER BANK WITH LEVEL DETECTOR
SWITCHING TO SELECT FUNDAMENTAL PITCH.

After a great deal of analysis of the zero crossing patterns produced by
various beat frequency present in guitar waveforms, we developed the following
algorithm:
÷ alternately if:
(A= B) or (A+ B = C) or (B + C = A) or (C = O)
A, B and C refer to the time periods between negative zero crossings shown in
Figure 8. A is the most recent period, B the period Just past, while C is
2 periods previous. The divide function which in reality drops pulses from
the train is performed alternately only if the statement is true. When it is
false the _ is reset, pulses pass through. In other words, at the first true
statement the system divides or eliminates the zero crossing from the pulse
train. If the algorithm of the next pulse period also yields a true state-
ment then the zero pulse is passed and the divide function is reset. If
the second statement had been false, the divide would again be reset and the
pulse wouid also pass. The bottom pulse train of Figure 8 illustrates its
application to the model waveform. All extraneous zero crossings are elimi-
nated and what remains is a series of almost evenly spaced pulses which are
close to the wave length of the fundamental. There is one exception, however.
For each complete cycle of the beat pattern, there is an odd period which
apparently is not related to the period of the pulse train or to the fundamental
frequency.
Scanning over the pulse train of Figure 8 clearly shows that the majority of
the periods fall within I% of each other. If the basic period is 603, as
shown here, then the long period, 804, is 201 units too long. If this error
of 201 units is nOw equally divided among the other periods, the pulse spacing
then becomes 628 or 2 _ which is exactly the period of the model's fundamental.
By adding a predictive clause to the basic algorithm it is possible to calculate
this error period in a real time waveform. Of course looking at a graph of
this function makes matters simple since it is possible to see the complete

picture hut in an actual system this is not possible. Therefore, it is ne-
cessary to recognize when the odd period is received before the end of its
duration so that the error can be corrected immediately. Since past history
can predict when the pulses should he received, if one is missing then it
must indicate an odd period.
In an actual system based on the model of Figure 8p the predicted period would
be 603. If a pulse is not received by 605 a pulse is automatically inserted
in pulse train and an error counter set to count the remainder of the odd
period. Immediately upon receiving the end pulse, the error counter stops,
divides the error by the number of past periods and begins adding this delay
in decreasing increments to each new pulse received. Thus the pulse train is
adjusted to correct pitch of the model waveformand the phase error is Just
cancelled as each new odd period is received. Figure 12.
V. PROGRAHSIHU[ATION
To check the accuracy of the algorithm over a range of conditions it was
programmed on a digital computer. Figure 9 is a simplified flow chart of t_e
program. Initially the computor's memory is filled with the zero crossing
dat_ generated by another program which simulates the model waveform. The
values for A, B and.C are then taken from the memory by the algorithm and"
processed resulting in the data tabulated in Figure I0. Column number one
shows the value of the A period for each calculation. The B and C periods
in each case are the two preceding values. Column number two shows the
resulting pitch values generated by the algorithm after dividing out the
unwanted zero crossings.
C = 0 is actually the algorithm's initializing condition which allows the
first two pulses of the attack transient to pass through. Depending upon the
algorithm's starting point on the pulse train the first two periods may be
at pitch or at the second harmonic, however, the C = 0 term insures that this
will only occur for two periods. The worst case for the guitar would be the
pitch E80 , the lowest note, where two cycles of the second harmonic would
cause incorrect pitch to sound for the initial 12.5 milliseconds. After
these two periods, the algorithm yields a eoeslstant pitch period slightly
shorter than the actual fundamental period except for the odd period. At
the first odd period, the program calculates the difference between where
-7-

the zero crossing should be and where it actually occurs. It then averages
this difference over the number of cycles which have passed since the last
odd period{ and adds this error to each new pitch period. Column three shows
the results after this averaging is applied to the pulse train.
The error term generated by the algorithm, in this case 2.956793005, averaged
over 8 periods results in a period of 628 which is exactly the fundamental.
This error may also be used to calculate the frequency of the harmonic.
In this case dividing the fundamental 2_ by the error term 2.95 yields 2.125
which is exactly the multlple of the second harmonic present in the waveform.
The computor program was used to evaluating the algorithm over a range of
frequency intervals. Sllghtmodlficatlon was required to differentiate the
beat note patterns produced by frequency intervals greater than an octave
from those less than an octave. Beat patterns (sharp & flat) of I in 8_ as
shown by the print out of Figure 10, gave excellent results. However, ratios
lower than I in 5 generated enough incorrect results to indicate further modl-
fication is needed for such cases. It is quite possible that further develop-
ment of the algorithm could lead to a true polyphonic pltch detection system.
However, since the ratio I to 5 is close to a musical interval of a m/nor 7th,
it is far lower than the range of the beat patterns produced by the gultar strings.
In this application then, the algorithm performs well.
VI. Problems of Digital Hardware
The preceding simulation of the algorithm operated at very slow speed on the
computor. Construction of circultry to speed this up to real time revealed
some major difficulties. Available micro-processors are much too slow to
execute such programs therefore a combination of high speed, wired logic
controlled by programming methods was necessary. One of these stumbling blocks
was noise, present in the real world but not in our models. To deal with
this the algorithm _as modified, changing the = to --'_, meaning + 5% which takes
into account Jitter in the zero crossing circuitry. Forming such a window
comparator digitally is difficult since speed was a factor and multiplication
is a long subroutine. Even wlth the fastest processors available this approxi-
_atlon took approximately 750us which left no time to execute the actual al-
gorithm when processing notes in the upper range of the guitar where time
between pulses is less than 1 millisecond. There were two possible solutions
-8-

to the problem. One was to use a lookup table progra_ed into a ROM (Read Only
Memory). Very high speeds are obtained this way, however, size of the ROM
becomes a problem for large tables. Since the prototype system employed 8 hit
digital works, the table would have to be 256 by 256 or 65k bits. While such
devices are available, theymust be specially programmed and are expensive in
small quantities, such a solution seemed superfluous in this case.
The second alternative was to use an analog comparison. While digital counting
systems are arithmetic in nature making binary comparisons very difficult,
analog systems are geometric and such comparisons are simply voltage ratios.
Therefore by translating the pulse spacings to Voltages the comparison cir-
cuit requires only resistive voltage dividers and two opamps, addltlonally
the output is digital. The only difficulty is converting the digital words
to analog voltages, but with the availability of monolithic D to A converters
this is really no problem. Figure II shows the eomparator used in the final
system. Its speed of operation is approximately 5us which is well within the
time available. Here then is a clear example where analog and digital cir-
cuitry are combined to deal with a problem neither could solve easily alone.
Another time consuming problem_..that of digital division, presents itself
when dealing with the odd per£od correction. Here the error must actually
be averaged over the pulse train in decreasing Increments to correct the pulse
spacing to the correct pitch period.
As shown previously, this rate is predicted from'the past history of the signai
and must just cancel itself as the next odd period is received. Again, this
is easy to calculate on a computor bu t in real times lt requires complex
circuitry operating at fairly high speed. After investigating different
electronic schemes, psychoacoustlcs gave the answer.
Listening tests with a guitar signal, but using only the original algorithm
without odd period correction, revealed that the pulse" train was so close
to actual pltch that the difference was not an audible problem. What was
audibl_ was the phase shift at each odd period. Therefore, attention was
shifted to correcting Just this phase shift without fully adjusting the pulse
spacing error.
The technique used to correct this error w e termed--"pulse stretching".
Essentially, Since we can predict the origin of the incoming pulse from past
history, if the pulse is not there then we need to add one. The system then
counts the error time until we actually receive the pulse; this error is
-9-
storedln a register until we receive the next long period. Again a pulse
is added, the error is measured and the result added to the error from the
previous periods. By varying the duty cycle of the resulting train of pulses
in direct proportion to the accumulated error we form the pulse train illus-
trated in Figure 13. Whenever our correction totals one full period, a pulse
is dropped from the train, the register is set to zero and the process begins
again. _n this manner the phase error is eliminated yet the circuitry consists
of only some slmple counters and uses no processing time. Figure 14 shows a
block diagram for one of the digital prototypes. The circuitry is _MOS type
logic operating at a clock rate of IMHz. The pitch unit described here
actually forms only one component of the overall system which consists of approx-
i.mtely 100 IC packages. A photograph of the pitch and envelope board is
shown in Figure 15,
Performance of this system wlth actual guitar waveforms was identical to thatprey
dieted By the waveform model, The worst pitch error was two cycles of the
second harmonic at the onset of the signal. The actual time delay varied
directly with the wavelength which measurements verified as about I milli-
second for IkHz and I0 milliseconds at 100Hz.
VII. Conclusions
We developed a model of the guitar waveformwhieh we used to test two
systems for extracting the fundamental pitch of guitar signals. Both these
systems were constructed, tested with our mode] waveform, and tested with
actual guitar signals. We found excellent correlation between these tests
indicating that our model, which differs significantly from those found in the
mathematleal literature, represents a significant new step in laboratory
simulation of musical waveforms.
A system for pitch extraction using filters was built and its performance
evaluated. Actual testing by guitar players showed the system operated with
excellent accuarcy. However, construction of the necessary filters was
difficult due to the sharp cut offs required by the system's logic switching.
These high Q filters also resulted in a certain amount of ringing on the
attack transient causing a delay of up to 25 milliseconds in the system's
response time.
-I0-

An algorithm suitable for programming on a digital logic system was deve-
f loped and debugged with the aid of eomputor modeling. Constructing this with
:real time hardware revealed additional problems which were solved by com-
bining digital logic with analog circuitry. Testing of the system by gui-
tarists showed that it too operated with excellent accuracy. While the
response of this digital system measures somewhat faster than that of the
filters, both systems operate well within the response time of the ear.
Perhaps the most unexpected feature of both designs was their ahillty to track
the decaying signal through incredible amounts of noise. The logic of both
systems automatically locked the pitch capture range as the signal decays
below a preset amplitude in order to avoid octave JumPing as the noise
becomes more prominent. This is especially a problem with decaying guitar
notes since the second harmonic can reach amplitudes two and three times
that of the fundamental. However, as a side benefit, this technique actually
allows tracking the fundamental through the high amount of noise generated
by the guitar's other strings.
While the emphasis in electronics technology today is on higher speed digi-
tal processors which, as we have seen, lend thenselves well to pitch extrac-
tion we do not underestimate the potential of filtering. _iltering is by far
the simplest, most efficient approach from a circuit standpoint, provided
that certain drawbacks can be overcome. New developements in the technology
of gyrators point toward easier to construct, more stable filters. Combining
this with some of the logic techniques we have presented should lead to the
developement of fast polyphonic p_tch detectors in the very near future. As
stated in the introduction, such digital analysis problems are not necessar-
ily solved by only digital methods; new concepts are involved.

Acknowledgement s
This paper cannot conclude without giving proper credit to guitarist
Mr. Robert Herne Jr. for his ability to get musical sounds from some of our
worst prototypes and supply us with the type of.musical feedback necessary
in such an engineering effort. Credit also to Josh Gindel, Joey Gindel, Bob
Gelman and Jean L. Hudson.
Much of the digital work for this paper was undertaken after leaving Mr. Scar's
employment. Many thanks to Stephen F. Temmer for encouraging us to continue
;he project.
References:
(i) HILLEK and KUIZ, "Synthesizing Musical Sounds by Solvln s the Wave
Equations for Vibrating Objects: Part I," JAES v.19, pp. 462-470
(1971).
(2) HILLER and RUIZ,
JAES 19, pp. 542-551 (1971).
(3) J.W. BEAUCHAMP, "Analysis and Synthesis of Cornet Tones UsingNoullnear Interharmonic Relationships," JAES v.23, pp. 778-795
(1975).
(4) J.A. MOORER, "The Synthesis of Complex Audio Spectra hy Means ofDiscrete Summation Formulas," JAES v.24, pp. 717-727 (1976).
(5) A.H. BENADE, "The Physics of Brasses," Sel American v. 229, pp. 24-35(1973).
(6) V.W. BOLIE et al, "Active-Network Realization of at 97-Channel
Audio Filter Bank", JAES v. 19, pp. 187-196 (1971).
(7) G. VOLPE, "Action Filter Design Handbook", General Instrument Corp.,
Hybrid Division (1976).
-;Z-

PLUCK_POINTNUT
_O_AVE FRETT BRIDGE
FIGURE _1. CROSS SECTIONAL VTEW OF A GUITAR ILLUSTRATING THE POSITIONOF THE PLUCK POINT FOR TWO DIFFERENT STRING WAVELENGTI_SONE
OCTAVE APART. THE OPEN STRING, DOTTEDLINE, IS PLUCKED ATAPPROXIMATELY ITS 1/8th WAVELENGTHWHILE THE OCTAVE, SOLID
LINE_ GETS PLUCKED CLOSER TO ITS I/4 WAVE POINT.
|
A A#

B C
FIGURE #2. WAVEFORMS PRODUCED BY GUITAR NOTES A, A#, B AND C PLAYED ON
THE B STRING. THESE PHOTOGRAPHS, EACH TAKEN 250 MILLISECONDS
AFTER PLU(_(ING, SHOW THE WIDE RANGE OF SECOND HARHONIC PHASESHIFT GENERATED BY ADJACENT FRETTS.
FIGURE #3. MODEL OF GUITAR WAVEFORM USING TWO FUNCTION GENERATORS.

E 2 • E 3 E 4
ESTRINGI ! I
I I
I I ID STRING _3 D4 D5I I
I c3 J JG4 G5G STRING J l I
J I B 3 I B4 I B5
B STRING I J |
J J E4 J IE s E6E STRING J l J
I I I I
FIGURE _4. FILTER CUT-OFF POINTS SHOWN RE'LATIVE TO PITCH RANGE OF THE
SIX GUITAR STRINGS,
.7, -___ --: _'._'_*,-.-'-?.__.---._:_,._ .... :,_- :
_ i. - _'_:_ -.:_._- - -._- -
: _ _ J :
r_: ",_. :. - ,,. _.....:
_ _- _: "_-_
2 _
_ __:: -.= _ = == _,, = _..._._r__...... :_.. = ._ =., z = == __a 5___= r.= . =, _, , , •
FIGURE #5. COMPUTOR SIMULATION OF 9TH ORDER ELIPTICAL FILTER WITH
IdB PASSBAND RIPPLE AND 60dB REJECTION AT 1.05 TIMES CUT-
OFF FREQUENCY.

FIGURE #6. KEALIZATION OF 622 Hz FILTER USING STATE VARIABLE CIRCUITRY.
FIGURE #7. SEVERAL CYCLES OF MODEL GUITAR WAVEFORM ILLUSTRATING PATTERN
PRODUCED BY T_E FUNDAMENTAL BEATING WITH ITS OUT OF TUNE 2ndHARMONI C.

AAAA A AA A AAAA _A AAIvV'UvUv /v vvwtvVvv
MODEL _AVEFORM
PULSE TRAIN "A"
I I II I II IIIPULSE TRAIN "B"
FIGURE #8. TOP WAVEFORM SHOWS BEAT PATTERN PRODUCED BY FREQUENCY RATIO OF i TO 2.125. PULSE TRAINA IS PRODUCED BY NEGATIVE ZERO CROSSINGS. PULSE TRAIN B SHOWS RESULTS OF APPLYING ALGORITHM
TO ZERO CROSSINGS.

FIGURE 39. DIAGRAM OF ALGORITHM FOR PROGRAMMING COMPUTOR MODEL OF PITCHSYSTEM.

COLUMN 2 _.._. "-,='4J'_3_/ 52'_5_5. zD_257.301 628@6_3._03683.30i 628_6_3.2_!6_3.25# 6280603.482,_J.;,#o e,2_8S83.28i603.603. 628660Z.482683.2_I 628_3._7"683.4@2 E,28_6_S.I£$
[email protected] [email protected] [email protected] 62806_3,345;_83."2#JI ERROR TERM 6289E _:_.}57
COLUMN 3 _ 2. 956 Z'93_:5'/'-'" 625_6g<_. 30;"_62806_3.6_] 628_6_3.38i
_28_68'3.T_5 $2866'3_.25=62806_.257 6288603.3486288EO3.ZOl 628B6_36636280E.83.30i 62E:_603,20i6280_3.254 628_S_3.4_2
FIGURE #I0. COMPUTOR PRINTOUT FOR ALGORITHMAPPLIED TO WAVEFORM OF FIGURE #8.COLUMN I LISTS THE ZERO CROSSING PERIODS, COLUMN2, THE RESULTSOF APPLYING THE ALGORITHM AND COLUMN 3, THE CORRECTEDVALUE FORTRUE FUNDAMENTALPITCH. 2# DIVIDED BY THE PHASE ERROR YIELDS THE2nd HARMONIC TERM, HERE 2.125 TIMES THE FUNDAMENTAL.
WORD A
l!!_ I!!l
I o"i I"I .,.IIII 'llll _WORD B
FIGURE #ii. DIGITAL/ANALOGWINDOW GOMPARATORBLOCK DIAGRAM.

16o16o3I 8o I o 16o3Io3IINPUT PULSES
_ n I F1 F1 F1 H.ERROR COUNTER
OUTPUT PULSES
FIGURE #12. PULSE SPACING TO CORRECT PITCH ERROR. TOP, ALGORITHM PULSE TRAIN,
BOTTOM, INCREMENTAL ERROR FACTOR.
160316°318o416o316o316o31INPUT PULSES
CUMULATIVE ERROR
OUTPUT PULSES
FIGURE #13. CORRECTING PHASE ERROR IN PULSE TRAIN BY "PULSE STRETCHING".NO CHANGE IS MADE IN PULSE SPACING. WHENACCUMULATEDPHASEERROK EQUALS ONE PERIOD IT IS CANCELLED AND PROCESS BEGINS _AGAI N.

__ ZERO [ I
'/..N DETECTOR COUNTER
pROGRAM I
[--OItjT COm'ARATOR D/A
FIGURE #14. PARTIAL BLOCK DIAGRAM OF A DIGITAL PITCH DETECTOR.
FIGURE #15. PHOTOGRAPH OF PITCH CIRCUIT BOARD. PART OF A DIGITAL GUITAR
SYNTHESIZER PROTOTYPE.

FIGURE _16. PHOTOGRAPH OF PROTOTYPE GUITAR SYNTHESIZER USING ANALOG FILTERING
COMBINED WITH DIGITAL LOGIC.