presentazione di powerpoint - global technology leader in ... london 2015... · 5 datalogic at a...
TRANSCRIPT

STAR Conference
London
October 5th
, 2015

Disclaimer
This document has been prepared by Datalogic S.p.A. (the "Company") for use during meetings with investors and
financial analysts and is solely for information purposes. The information set out herein has not been verified by
an independent audit company.
Neither the Company nor any of its subsidiaries, affiliates, branches, representative offices (the “Group”), as well
as any of their directors, officers, employees, advisers or agents (the “Group Representatives”) accepts any
responsibility for/or makes any representation or warranty, express or implied, as to the accuracy, timeliness or
completeness of the information set out herein or any other related information regarding the Group, whether
written, oral or in visual or electronic form, transmitted or made available.
This document may contain forward-looking statements about the Company and/or the Group based on current
expectations and opinions developed by the Company, as well as based on current plans, estimates, projections
and projects of the Group. These forward-looking statements are subject to significant risks and uncertainties
(many of which are outside the control of the Company and/or the Group) which could cause a material difference
between forward-looking information and actual future results.
The information set out in this document is provided as of the date indicated herein. Except as required by
applicable laws and regulations, the Company assumes no obligation to provide updates of any of the aforesaid
forward-looking statements.
Under no circumstances shall the Group and/or any of the Group Representatives be held liable (for negligence or
otherwise) for any loss or damage howsoever arising from any use of this document or its contents or otherwise
in connection with the document or the aforesaid forward-looking statements.
This document does not constitute an offer to sell or a solicitation to buy or subscribe to Company shares and
neither this entire document or a portion of it may constitute a recommendation to effect any transaction or to
conclude any legal act of any kind whatsoever.
This document may not be reproduced or distributed, in whole or in part, by any person other than the Company.
By viewing and/or accepting a copy of this document, you agree to be bound by the foregoing limitations.
2

Agenda
3
Group Overview
Market Outlook
Business & Strategy
Financial Highlights

Group Overview
4

5
Datalogic at a glance
Global leader of barcode readers, mobile computers,
sensors, vision systems and laser marking systems
with innovative solutions in verticals market: Retail,
Transportation & Logistics, Factory Automation,
Healthcare Industries
Founded in 1972 by Romano Volta in Bologna, Italy
and listed on the STAR Segment of the Italian Stock
Exchange since 2001
A large portfolio of over 1,150 patents
About 2,400 employees, of which 400 in R&D:
1,155 (48%) in Europe
635 (26%) in US
616 (26%) in APAC
Direct presence in 30 countries worldwide selling to
120 countries, with more than 1,000 partners
worldwide

Investing in Datalogic
6
STRONG
POSITION1
PROVEN TRACK
RECORD2
VALUATION
&
OPPORTUNITIES
3
Attractive valuation
Potential from further internal reorganization
Opportunities from expansion in Fast growing markets
Unique player world wide with leadership in two markets: ADC
and IA
High entry barriers granted by solid Intellectual Property
Patents portfolio
Better time to market and more efficiency than competitors
History of profitable growth
Wise resources management to sustain a leadership position
Strong cash generation for growth

Over 40 years of Technological Innovation
7
2012
2015
2001
1988
1997
1972
2002
2011
FOUNDATION Established in Bologna
EXPANSION
Escort Memory Systems Inc.
IDWare Mobile Computing &
Comm.
LISTING Listed on the STAR segment
of Italian Stock Exchange
INNOVATIONSet up Business Development
Division
Acquisition of Multiwave
Photonics SA
Minec AB
Laservall SpA
Informatics Inc.
PSC Inc.
Datasensor SpA
Evolution Robotics Retail Inc.
Accu-Sort Systems Inc.
PPT Vision Inc.
EXPANSION

8
A Wide Geographical Footprint
8
EUROPE 42,6%
ITALY 9,6%NORTH AMERICA
28,9%
ROW 6,6%
APAC 12,3%
Note: Breakdown by area based on 2014 revenues
Direct presence in 30 countries
8 Manufacturing Sites 12 R&D Centers
2 DL LABS
9
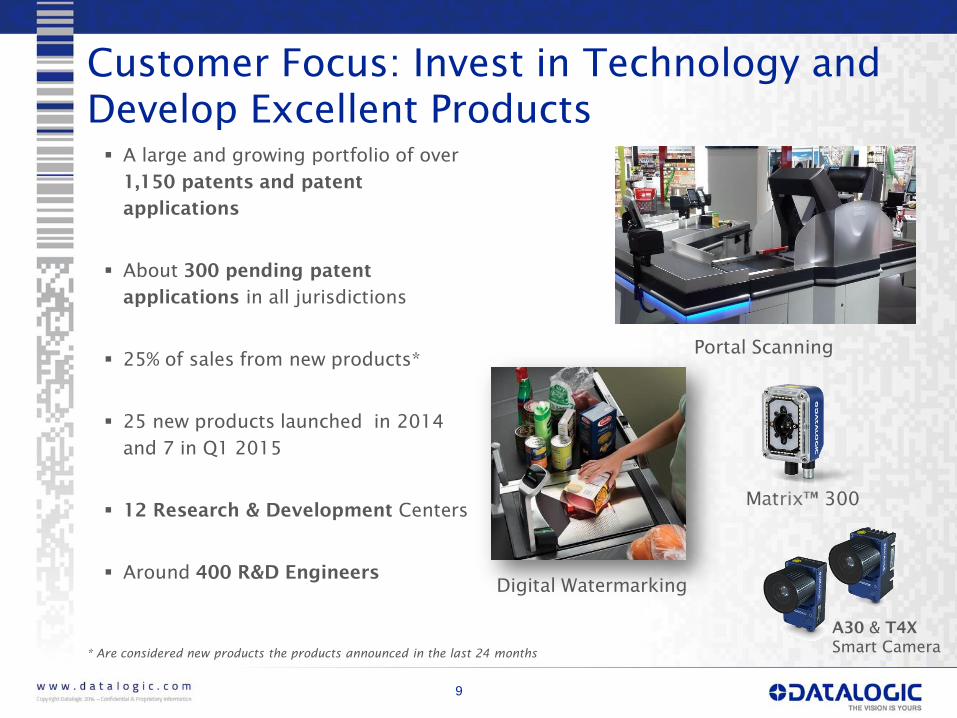
* Are considered new products the products announced in the last 24 months
A large and growing portfolio of over
1,150 patents and patent
applications
About 300 pending patent
applications in all jurisdictions
25% of sales from new products*
25 new products launched in 2014
and 7 in Q1 2015
12 Research & Development Centers
Around 400 R&D Engineers
Customer Focus: Invest in Technology and
Develop Excellent Products
Portal Scanning
Digital Watermarking
Matrix™ 300
A30 & T4X
Smart Camera

Stock and Governance
Market Segment: STAR MTA
Reuters Code: DAL.MI
Bloomberg Code: DAL IM
Outstanding Shares: 58,446,491
Share Par-Value: 0.52 Euro each
SHAREHOLDERS’ STRUCTURE
Ticker: DAL
Price (September 25th
, 2015): 14.1 Euro
Market Cap (September 25th
, 2015): 824 M Euro
Specialist: Intermonte SIM
Auditing Company: Reconta Ernst & Young
DATALOGIC PRICE PERFORMANCE
67.20%
30.35%
2.45%
Hydra S.p.A. Free Float Norges Bank
10
70
90
110
130
150
170
190
30/12/2014 30/01/2015 28/02/2015 31/03/2015 30/04/2015 31/05/2015 30/06/2015 31/07/2015 31/08/2015 30/09/2015 31/10/2015 30/11/2015 31/12/2015
DAL.MI FTSEMIB.MI ITSTAR.MI

Market Outlook
11

11% 10%
18% 19%
15%
17%
56%
54%
2014 2017e
Identification Vision Lasermarking Sensor & Safety
18% 23%
7%
7% 21%
20%
54%
50%
2014 2017e
Self Checkout Solutions POS Retail Scanners
Hand Held Scanners Mobile Computers
12
Market Outlook – ADC & IA
Source VDC 2015 (base year 2014)
CAGR + 5.1%
4.6
5.4
CAGR + 13.3%
CAGR + 4.9%
CAGR + 3.6%
CAGR + 2.7%
3.5
CAGR +4.2%
CAGR + 11.5%
CAGR + 7.5%
CAGR + 2.7%
IAADC
(B$)
4.2CAGR + 5.8%
(B$)

ADC Market Share jumped in 2014
13
ADC Market Share: 10.4%
from 9.5% in 2013
POS Retail Scanners
#1 WW
Handheld Scanners
#1 in EMEA
#3 WW
Mobile Computers
#3 in EMEA
#3 WW
2014 ADC Available Market including POS Retail Scanners, Handheld Scanners and Mobile Computers
(Handheld PDA and Fork-Lift Vehicles Mounted Computer) segments
Source VDC 2015 (base year 2014)
Zebra Technologies
Honeywell
Datalogic
Denso Wave
Casio 0%
5%
10%
15%
20%
25%
30%
35%
40%
45%
50%
- 200 400 600 800 1,000 1,200 1,400 1,600
20
14
M
arket Sh
are
2014 Revenues in $M
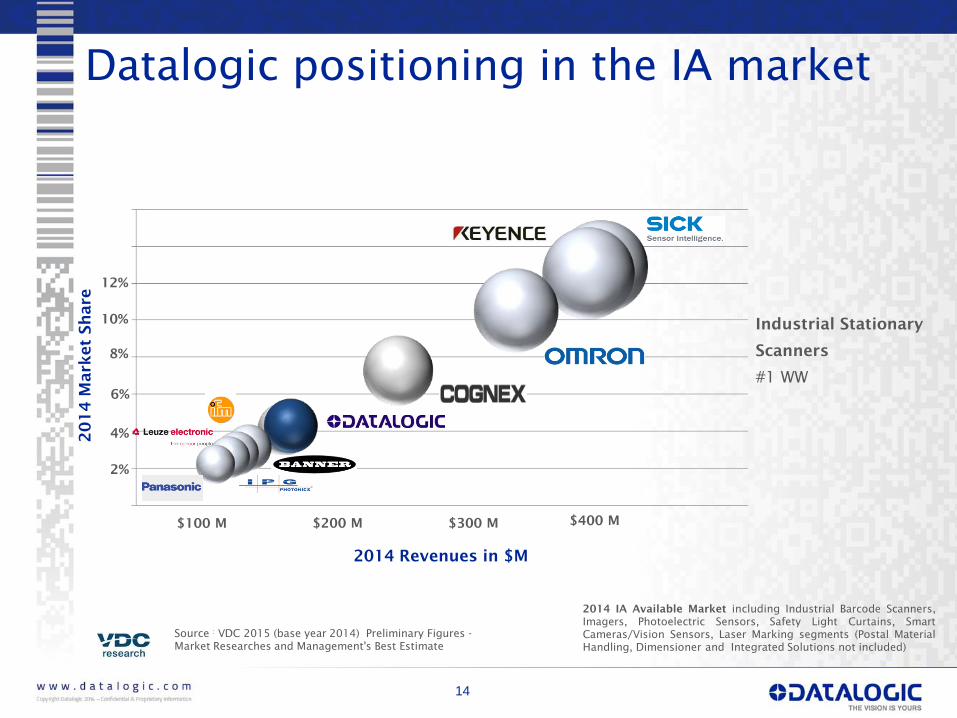
14
2014 IA Available Market including Industrial Barcode Scanners,
Imagers, Photoelectric Sensors, Safety Light Curtains, Smart
Cameras/Vision Sensors, Laser Marking segments (Postal Material
Handling, Dimensioner and Integrated Solutions not included)
Source :VDC 2015 (base year 2014) Preliminary Figures -
Market Researches and Management's Best Estimate
$200 M $300 M
12%
6%
2%
4%
8%
2014 Revenues in $M
20
14
M
arket Sh
are
$100 M
Datalogic positioning in the IA market
10%
$400 M
Industrial Stationary
Scanners
#1 WW

Business and Strategy
15

A Unique Selling Proposition
16
Americas Emea Apac
RetailTransportation
& Logistics
Factory
AutomationHealthcare

Datalogic by Verticals
ADC IA
Group revenues by verticals
Retail
49%
Factory
Automation
29%
T&L
13%
Healthcare
5%
Other
4%
Retail
65%
Factory
Automation
16%
Healthcare
7%
T&L
6%
Other
6%
Factory
Automation
58%
T&L
29%
Retail
12%
Healthcare
1%
17

Wide and Complementary Offer
18
INDUSTRIAL AUTOMATION AUTOMATIC DATA CAPTURE
Factory
Automation
T&L
Retail
Healthcare
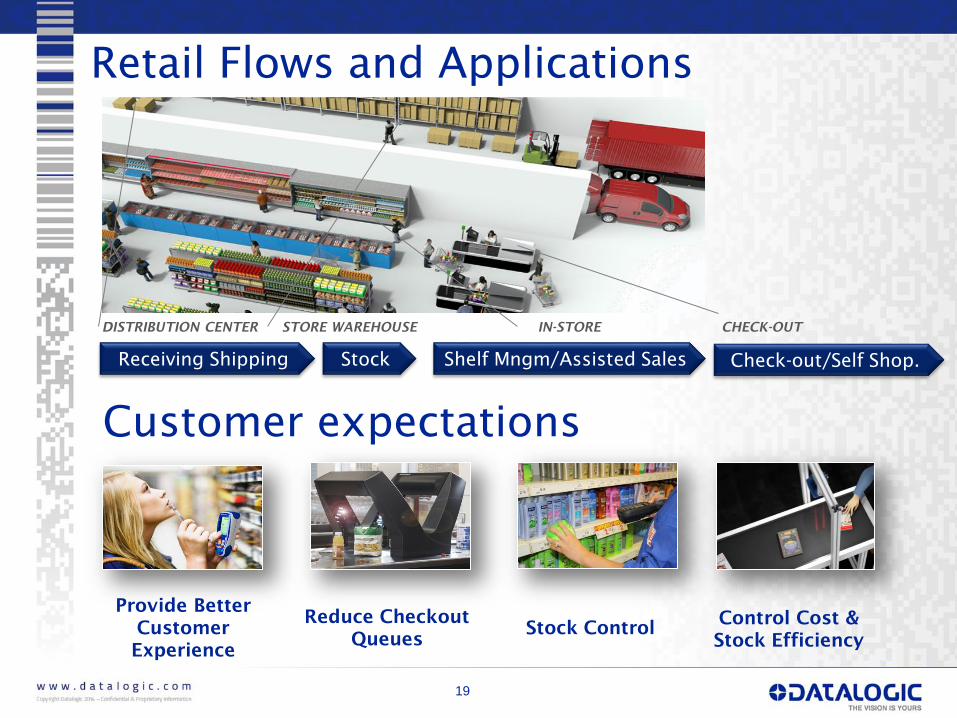
Check-out/Self Shop.StockReceiving Shipping
DISTRIBUTION CENTER STORE WAREHOUSE
Shelf Mngm/Assisted Sales
IN-STORE CHECK-OUT
Retail Flows and Applications
Customer expectations
Control Cost &
Stock Efficiency
Reduce Checkout
Queues
Provide Better
Customer
Experience
Stock Control
19

Jade and System examples
60 Jades installed in 27 stores and 3 warehouse/logistic centers
throughout Europe and U.S.
Proven perfomance in pilots worldwide over the last 2 years
Proven reliabilty over 3 years of testing and usage
Several retailers in rollouts
Expanding into backroom warehouse and order fufillment applications
Integration support materials and tools are very complete and refined
Datalogic integration support team is very experienced
Extremely simple integration to checkstand
20
Payment and bagging is key to take advantage of Jade and provide the needed ROI

ShippingWarehousingReceiving
WAREHOUSING SORTING
Fulfillment
HANDLING
DWS
DELIVERY
T&L Flows and Applications
Customer expectations
Ensure On-Time &
Zero-mistakes
results
Reduce delivery
Times
Improve Delivery
Accuracy
Manage Large
Inventories & Items
Variety
Control Cost &
Efficiency
21
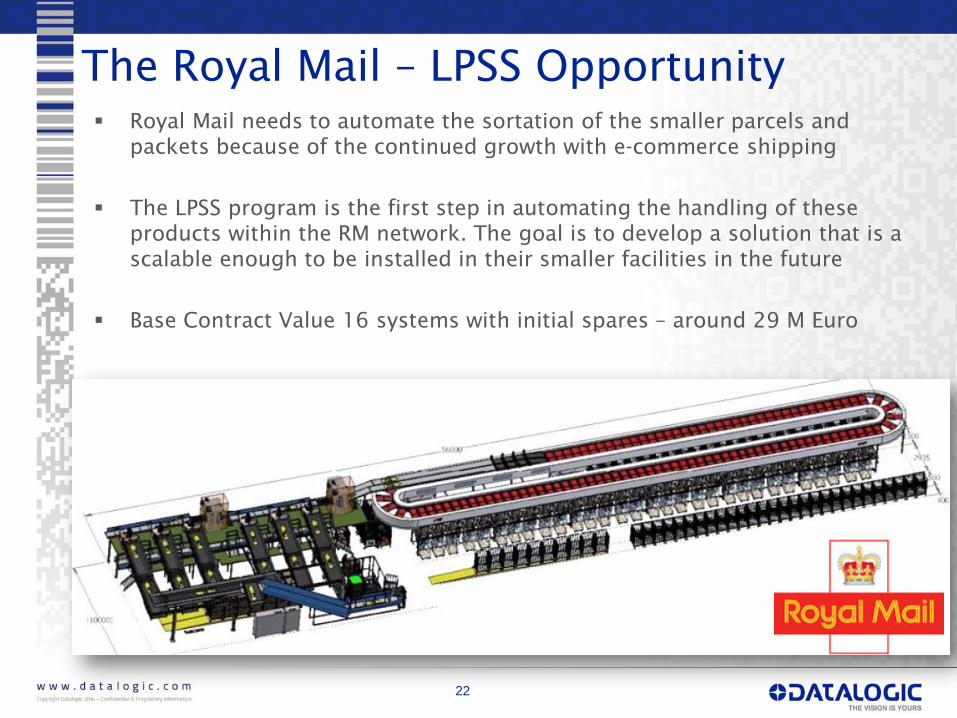
The Royal Mail – LPSS Opportunity
Royal Mail needs to automate the sortation of the smaller parcels and
packets because of the continued growth with e-commerce shipping
The LPSS program is the first step in automating the handling of these
products within the RM network. The goal is to develop a solution that is a
scalable enough to be installed in their smaller facilities in the future
Base Contract Value 16 systems with initial spares – around 29 M Euro
22

Factory
Automation
AUTOMOTIVE ELECTRONICSPACKAGING
Factory Automation
23

AUTOMATION & SAFETYIDENTIFICATIONMARKING QUALITY CONTROL
PARTS &
COMPONENTS
SUB ASSEMBLY
TEST &
CONTROL
FINAL
ASSEMBLING
Automotive Flows and Applications
Customer expectations
Pervasive Parts
Traceability
Accurate Vision
Inspection &
Measurement
Tires
TraceabilityOperators Safety
24

COMPONENTS ELECTRONIC BOARDS DEVICES PACKAGES
PACKAGINGDEVICE TESTINGBOARD ASSEMBLING
Electronics Flows and Applications
Customer expectations
Traceability
Assembling
Control
Product
Personalization/
Branding
25

PACKINGPACKAGINGPROCESSING
Packaging Flows and Applications
Customer expectations
ID/Traceability Quality InspectionObject/Parts
Detection
Operator Safety
Warehouse
Management
26

BED CARECLINICAL TESTCHECK IN POS ASSET MANGT
MEDIC. EQUIPMENT
LABORATORY PHARMACYADMITTANCE MEDIC. ADMIN.
Healthcare Flows and Applications
Customer expectations
Reducing ErrorsPreventing
Infections
Increase Staff
Productivity
Realtime Tracking
& Tracing
Accurate Asset
Management
27
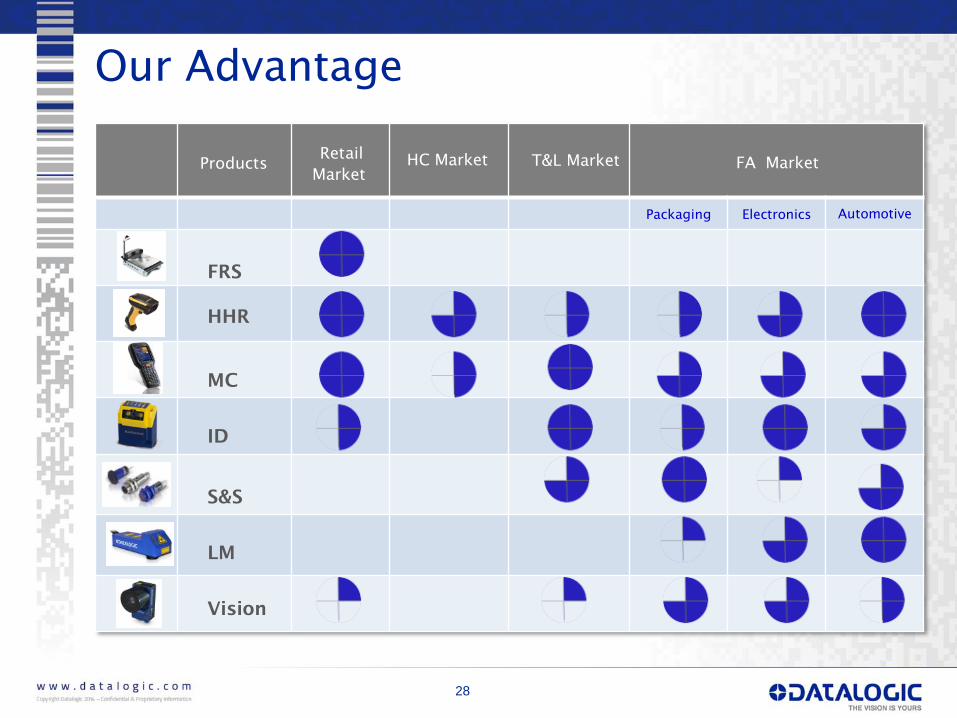
Packaging Electronics Automotive
FRS
HHR
MC
ID
S&S
LM
Vision
ProductsRetail
Market
HC Market T&L Market FA Market
Our Advantage
28

29
Outlook for 2015
H1 results confirm the positive trend of the Group in the
European Market
Positive trend in revenue booking in H1 at 271.5 M
Euro, +16.8% compared to the same period of 2014
In H2 2015 growth in the European and Asian markets
and a market recovery in the United States is expected
The Industrial Automation division would enjoy the
benefit of revenue from projects in the Transportation,
Logistics and Postal segments (contribution of Royal
Mail Order) as well as the Factory Automation sector
thanks to the launching of new top of the range
products in Q3
Strong investments in innovation continue, expected at
over 9% on revenues

Financial Highlights
31
Revenues growth driven by ADC in Europe,
North America and fast growing markets
thanks to robust investments by retailers and
the launch of technologically advanced products
Signs of recovery of Industrial Automation in
Europe and APAC while North America still
affected by the BU Systems
Order from Royal Mail to implement a new
Parcel Sorting System in UK. The total value of
the deal is around 29 M Euro
Investment in R&D continues to be crucial for
the development of the Group
EBITDA margin affected by forex
Strong improvement of financial costs thanks
to a cheaper financing contract
Robust growth of net income
Highlights 1H 2015

32
000€ 1H2015 1H2014 Var % 2014
Revenues 257,485 100.0% 224,028 100.0% 14.9% 464,546
COGS(137,699) (53.5%) (114,950) (51.3%) (238,987)
Gross Operating Margin 119,786 46.5% 109,078 48.7% 9.8% 225,559
Other revenues 1,209 0.5% 760 0.3% 2,239
R&D (23,449) (9.1%) (19,848) (8.9%) (43,108)
Distribution Costs (48,479) (18.8%) (40,350) (18.0%) (85,319)
Administrative expenses (19,691) (7.6%) (19,961) (8.9%) (39,146)
Other operating expenses (1,042) (0.4%) (1,058) (0.5%) (2,206)
Total operating expenses and others (92,661) (36.0%) (81,217) (36.3%) 14.1% (169,779)
Non recurring costs/rev (750) (0.3%) (2,392) (1.1%) 58,019
Amort. Intang. Assets from acquis. (2,899) (1.1%) (2,775) (1.2%) (5,618)
Operating Profit (EBIT) 24,685 9.6% 23,454 10.5% 5.2% (5,493)
Financial (costs)/rev. (3,162) (1.2%) (4,835) (2.2%) 46,908
Results from equity investments 97 0.0% (58) 0.0% (8,111)
Foreign exchange (costs)/rev. 3,390 1.3% 203 0.1% 25
EBT 25,010 9.7% 18,764 8.4% 33.3% 357
Taxes (3,559) (1.4%) (3,520) (1.6%) 39,179
Net Income 21,451 8.3% 15,244 6.8% 40.7% (8,322)
Depreciation (3,694) (1.4%) (3,471) (1.5%) 30,857
Amortization (2,298) (0.9%) (2,061) (0.9%) (7,199)
EBITDA 34,326 13.3% 34,153 15.2% 0.5% (4,225)
Exchange rate 1.1158 1.3703 69,443
Profit and Loss

Strong Revenues Growth
33
REVENUES BY DIVISION (%)
REVENUES BY DIVISION
€M 1H2015 1H2014 Var %
ADC 177.4 149.1 19.0%
IA 66.6 62.7 6.2%
- IA excluding BU Systems 60.4 54.4 11.0%
Informatics 14.5 13.1 10.7%
Corporate and Adjustments (1.0) (0.8) n.m.
Total revenues 257.5 224.0 14.9%
51.3%
29.0%
13.1%
6.6%
Europe North America Asia Pacific ROW
REVENUES BY COUNTRY (%)
REVENUES BY GEOGRAPHIC AREA
€M 1H2015 1H2014 Var %
Europe 132.0 117.7 12.1%
North America 74.8 64.6 15.7%
Asia Pacific 33.8 26.0 30.1%
ROW 16.9 15.7 7.6%
Total Revenues 257.5 224.0 14.9%

1H Segment Reporting
34
Gross Operating
Margin1H2015 1H2014
ADC 48.6% 51.0%
Industrial Automation 42.0% 43.4%
Informatics 44.8% 45.1%
Total Group 46.5% 48.7%
EBITDA Margin 1H2015 1H2014
ADC 20.5% 20.6%
Industrial Automation 1.0% 3.0%
Informatics 0.8% 6.2%
Total Group 13.3% 15.2%
TWC/Annualized
Revenues1H2015 1H2014
ADC 10.7% 10.1%
Industrial Automation 12.8% 19.2%
Informatics 10.4% 15.3%
Total Group 12.3% 10.5%
R&D/Revenues 1H2015 1H2014
ADC 8.7% 9.4%
Industrial Automation 12.7% 11.5%
Informatics 3.9% 2.9%
Total Group 9.1% 8.9%

35
Consolidated Balance Sheet at 30.06.2015
TOTAL ASSETS EQUITY AND LIABILITIES
Total
Fixed
Assets
Trade
Working
Capital
Other
Assets
Net
Financial
Position
Equity
€mln
Other
liabilities

Contacts
IR CONTACTS
CFO and IR Manager
Sergio Borgheresi
E-mail [email protected]
IR Assistant
Daniela Giglioli
Tel. +39 051 3147109
Fax +39 051 3147205
E-mail [email protected]
Via Candini, 2
40012 Lippo di Calderara di Reno
Bologna – Italy
IR Consultant
Vincenza Colucci
CDR Communication Srl
Tel. +39 335 6909547
NEXT EVENTS
DATALOGIC ON LINE
October 5-6th, 2015
London Star Conference
November 5th
, 2015
Approval 3Q results
36