presentations · - food chemistry - food application - water treatment ... •aim of the pilot...
TRANSCRIPT
Presentations
Day 1
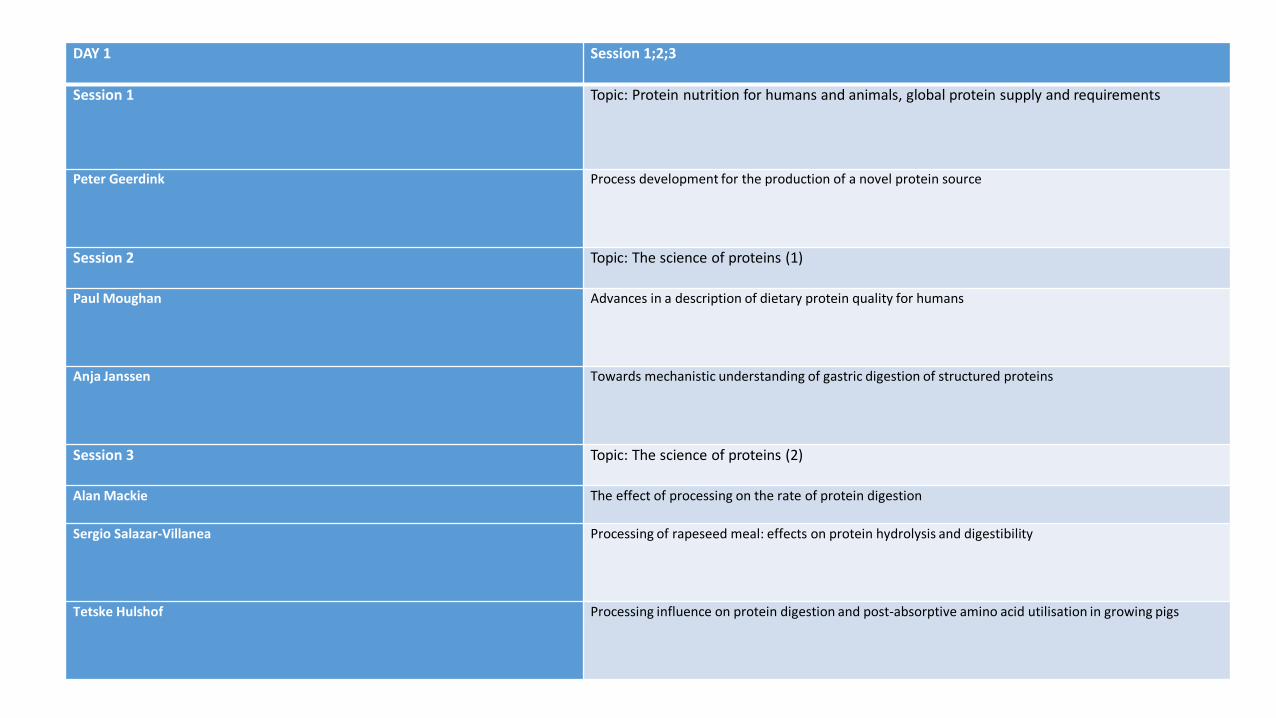
DAY 1 Session 1;2;3
Session 1 Topic: Protein nutrition for humans and animals, global protein supply and requirements
Peter Geerdink Process development for the production of a novel protein source
Session 2 Topic: The science of proteins (1)
Paul Moughan Advances in a description of dietary protein quality for humans
Anja Janssen Towards mechanistic understanding of gastric digestion of structured proteins
Session 3 Topic: The science of proteins (2)
Alan Mackie The effect of processing on the rate of protein digestion
Sergio Salazar-Villanea Processing of rapeseed meal: effects on protein hydrolysis and digestibility
Tetske Hulshof Processing influence on protein digestion and post-absorptive amino acid utilisation in growing pigs
DAY 1 Session 1,2,3 Session 1
Topic: Protein nutrition for humans and animals, global protein supply and requirements
Presentations available:
Peter Geerdink
Peter Geerdink
• Process development for the production of a novel protein source
Content
• TNO introduction
• The potential for new protein sources
• The purification process of RuBisCo
• Results of the first pilot trials
• Development of pilot plant 2.0
• Performance of RuBisCo as a food ingredient
• Conclusions
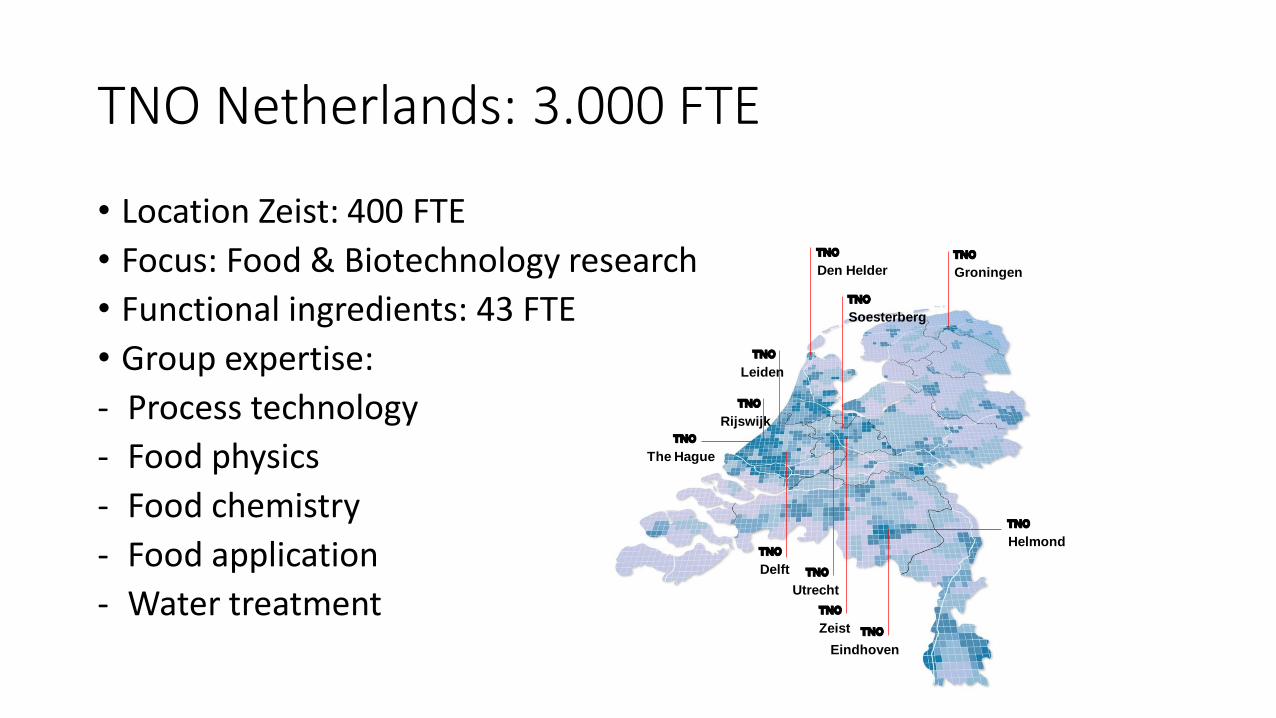
TNO Netherlands: 3.000 FTE
• Location Zeist: 400 FTE
• Focus: Food & Biotechnology research
• Functional ingredients: 43 FTE
• Group expertise:
- Process technology
- Food physics
- Food chemistry
- Food application
- Water treatment
Groningen
Eindhoven
Den Helder
The Hague
Rijswijk
Delft
Leiden
Utrecht
Soesterberg
Zeist
Helmond
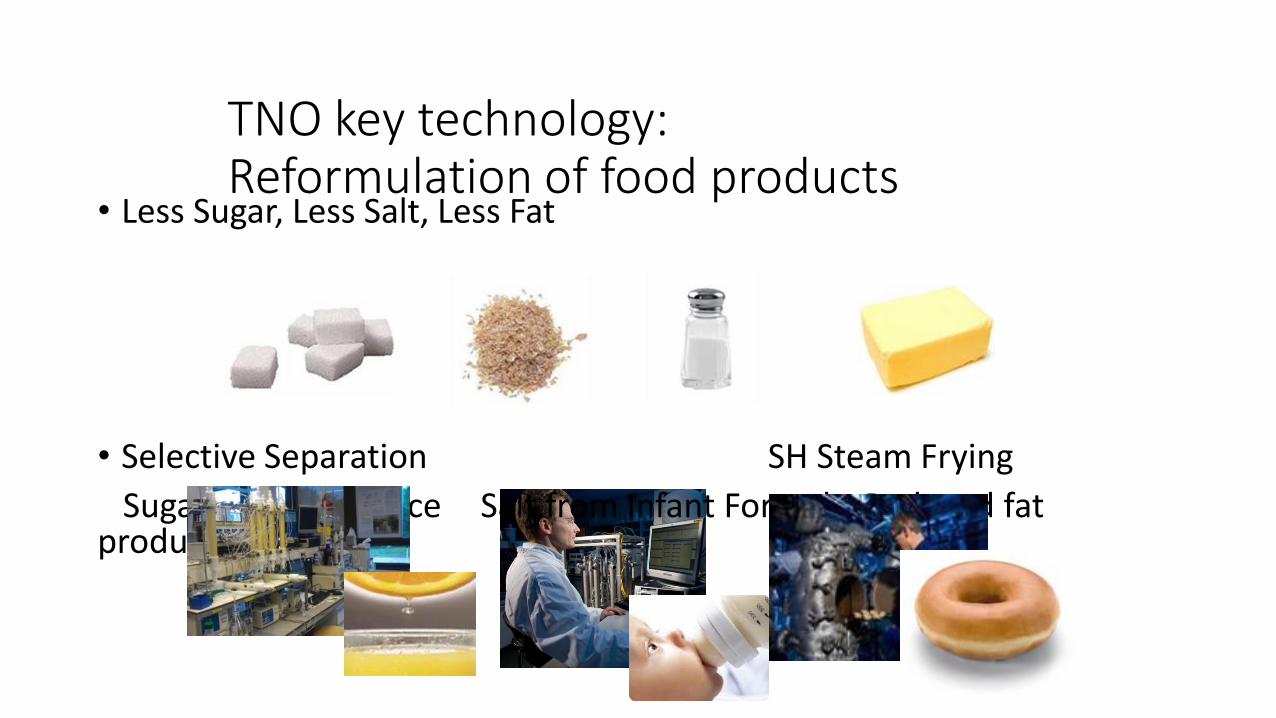
• Less Sugar, Less Salt, Less Fat
• Selective Separation SH Steam Frying
Sugar from fruit juice Salt from Infant Formula Reduced fat products
TNO key technology: Reformulation of food products
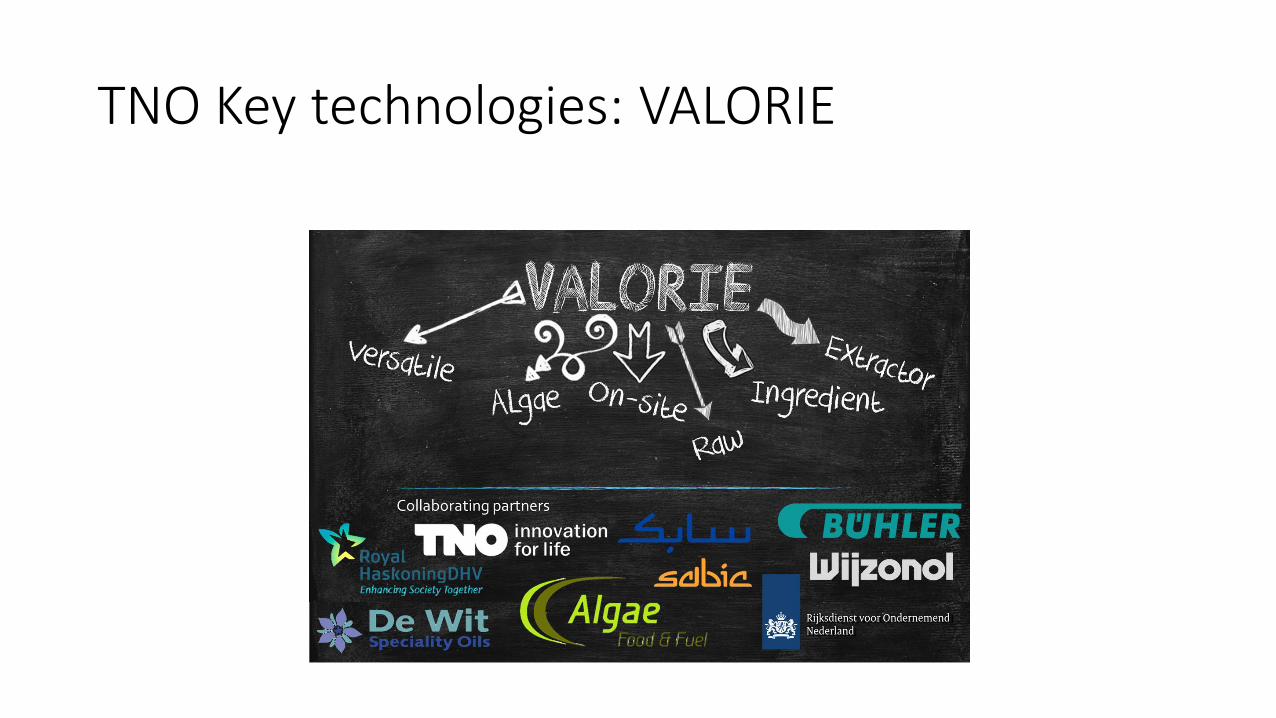
TNO Key technologies: VALORIE
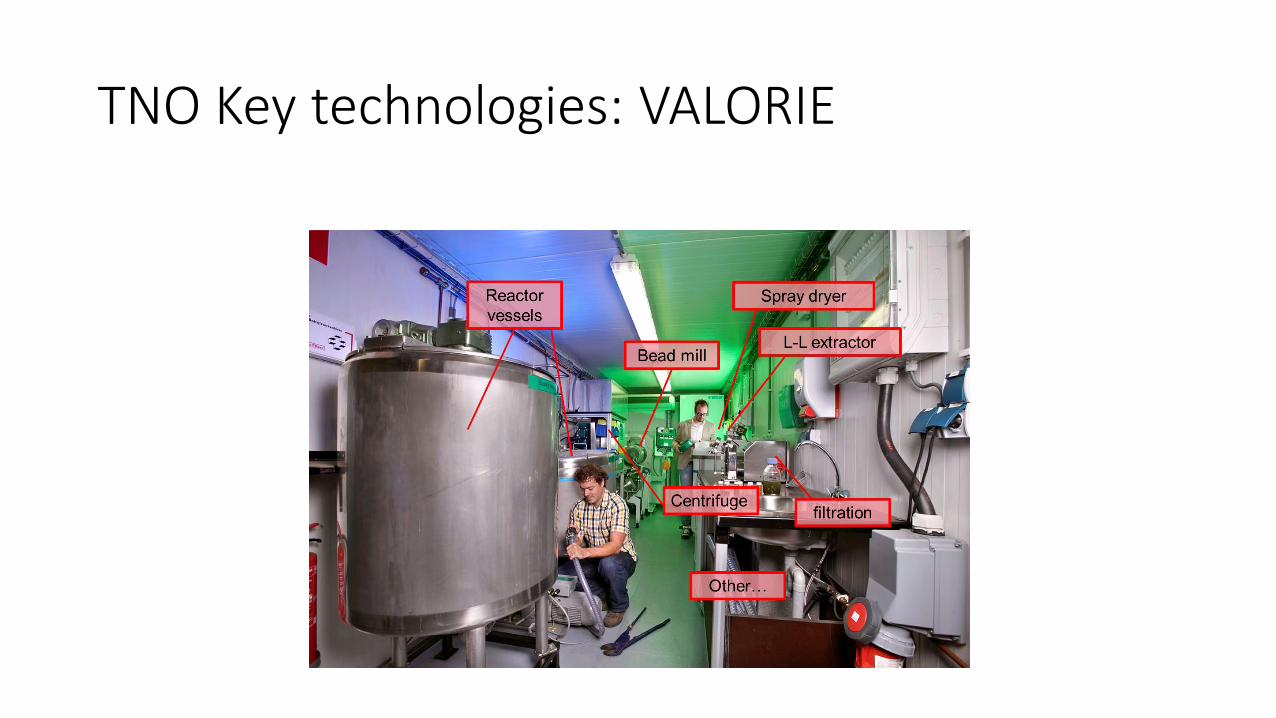
TNO Key technologies: VALORIE
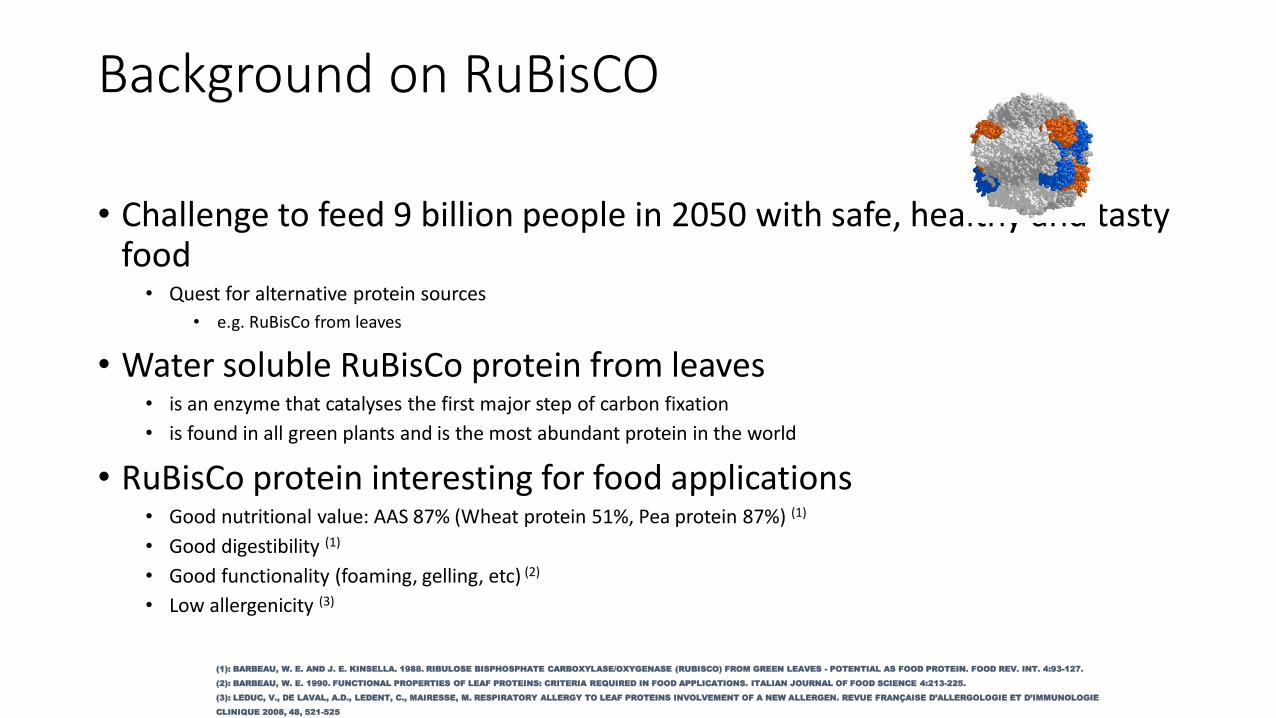
Background on RuBisCO
• Challenge to feed 9 billion people in 2050 with safe, healthy and tasty food
• Quest for alternative protein sources
• e.g. RuBisCo from leaves
• Water soluble RuBisCo protein from leaves• is an enzyme that catalyses the first major step of carbon fixation
• is found in all green plants and is the most abundant protein in the world
• RuBisCo protein interesting for food applications• Good nutritional value: AAS 87% (Wheat protein 51%, Pea protein 87%) (1)
• Good digestibility (1)
• Good functionality (foaming, gelling, etc) (2)
• Low allergenicity (3)
(1): BARBEAU, W. E. AND J. E. KINSELLA. 1988. RIBULOSE BISPHOSPHATE CARBOXYLASE/OXYGENASE (RUBISCO) FROM GREEN LEAVES - POTENTIAL AS FOOD PROTEIN. FOOD REV. INT. 4:93-127.
(2): BARBEAU, W. E. 1990. FUNCTIONAL PROPERTIES OF LEAF PROTEINS: CRITERIA REQUIRED IN FOOD APPLICATIONS. ITALIAN JOURNAL OF FOOD SCIENCE 4:213-225.
(3): LEDUC, V., DE LAVAL, A.D., LEDENT, C., MAIRESSE, M. RESPIRATORY ALLERGY TO LEAF PROTEINS INVOLVEMENT OF A NEW ALLERGEN. REVUE FRANÇAISE D’ALLERGOLOGIE ET D’IMMUNOLOGIE
CLINIQUE 2008, 48, 521-525
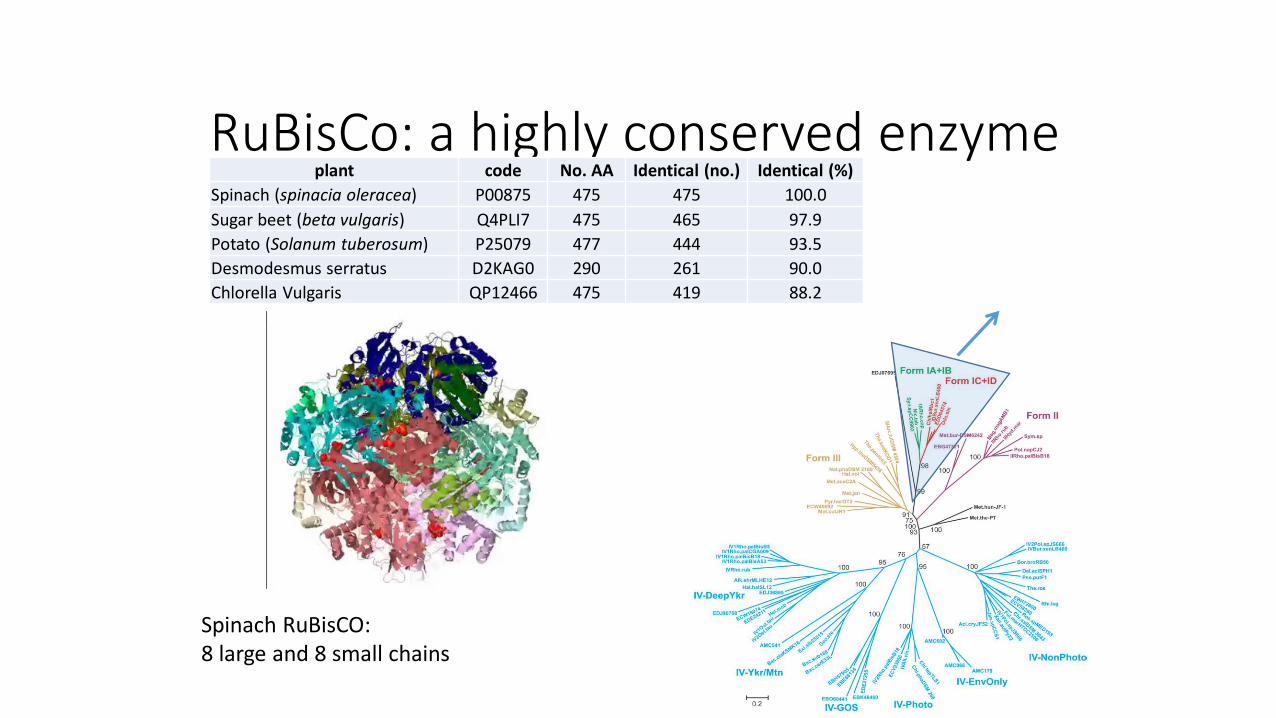
RuBisCo: a highly conserved enzymeplant code No. AA Identical (no.) Identical (%)
Spinach (spinacia oleracea) P00875 475 475 100.0
Sugar beet (beta vulgaris) Q4PLI7 475 465 97.9
Potato (Solanum tuberosum) P25079 477 444 93.5
Desmodesmus serratus D2KAG0 290 261 90.0
Chlorella Vulgaris QP12466 475 419 88.2
Spinach RuBisCO:8 large and 8 small chains
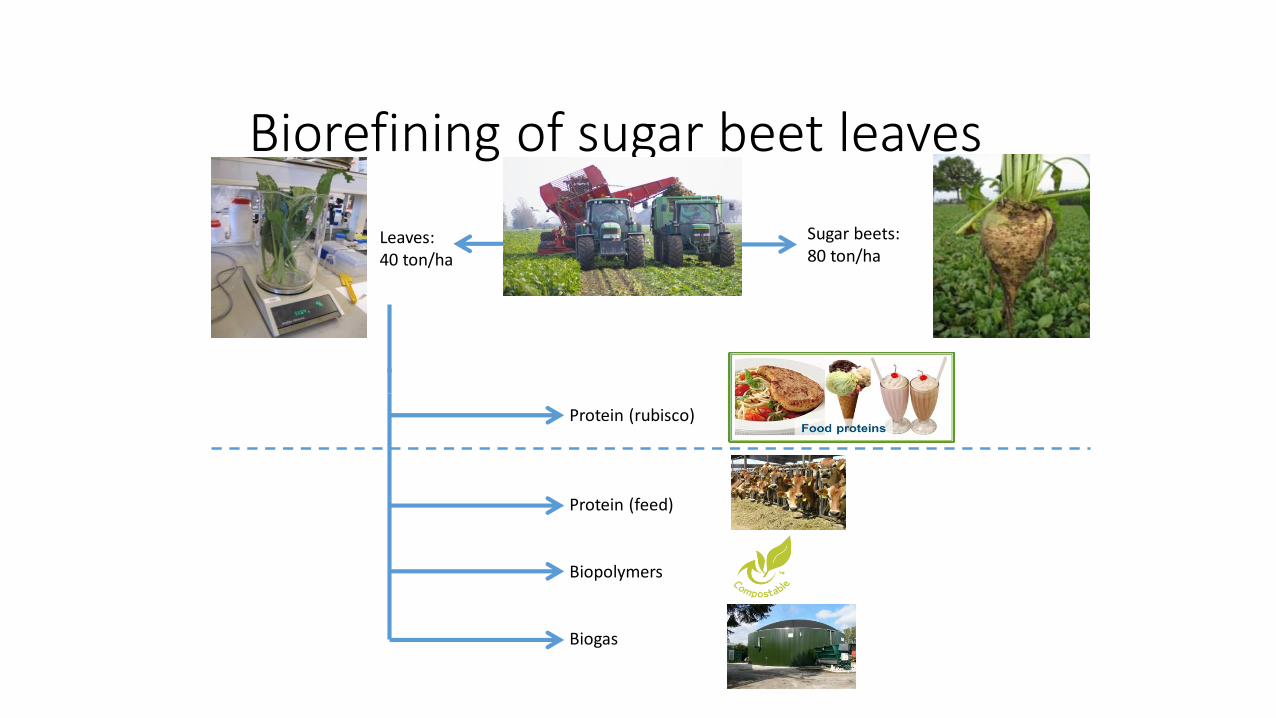
Biorefining of sugar beet leaves
Sugar beets:80 ton/ha
Leaves:40 ton/ha
Protein (rubisco)
Protein (feed)
Biopolymers
Biogas
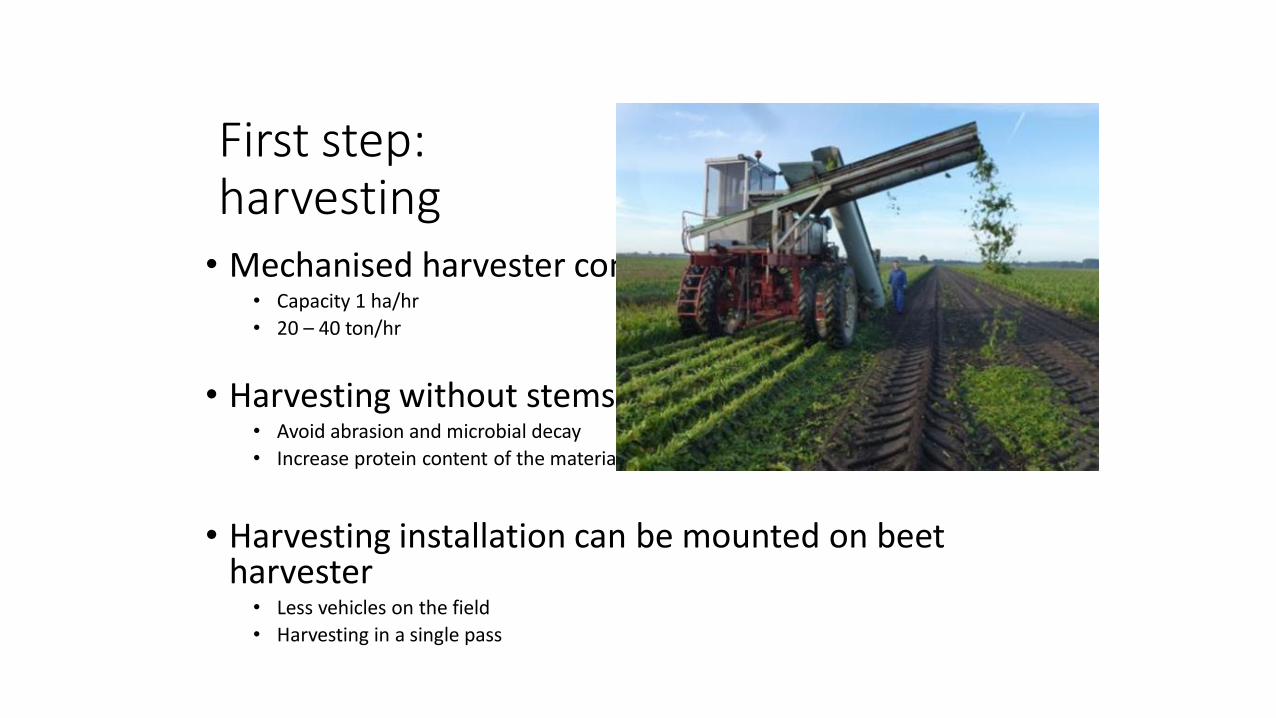
First step: harvesting
• Mechanised harvester constructed• Capacity 1 ha/hr
• 20 – 40 ton/hr
• Harvesting without stems & dirt• Avoid abrasion and microbial decay
• Increase protein content of the material (leaves > stems)
• Harvesting installation can be mounted on beet harvester
• Less vehicles on the field
• Harvesting in a single pass
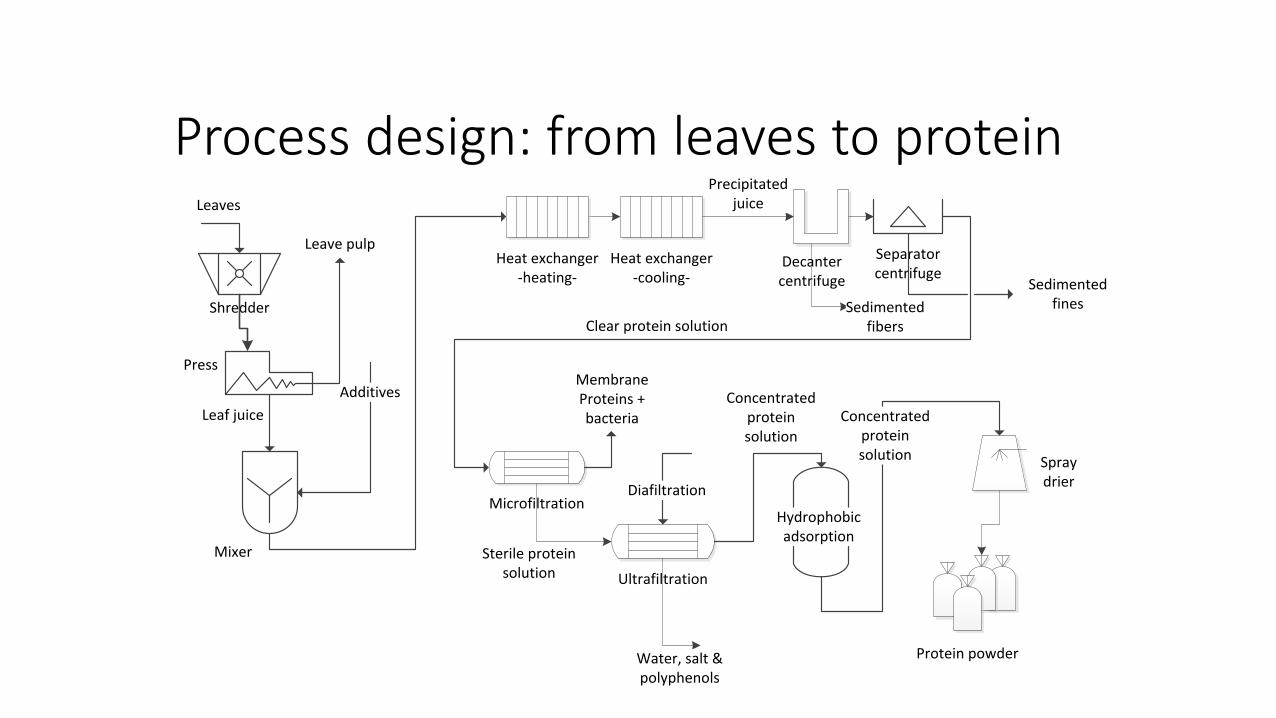
Process design: from leaves to protein
Heat exchanger-cooling-
Decanter centrifuge
Precipitated juice
Sedimented fibers
Microfiltration
Ultrafiltration
Spray drier
Sterile protein solution
Water, salt &polyphenols
Protein powder
Hydrophobicadsorption
Separator centrifuge
Press
Mixer
Leaf juice
Leaves
Additives
Heat exchanger-heating-
Clear protein solution
Sedimented fines
Concentrated protein solution
Concentratedproteinsolution
MembraneProteins + bacteria
Diafiltration
Shredder
Leave pulp
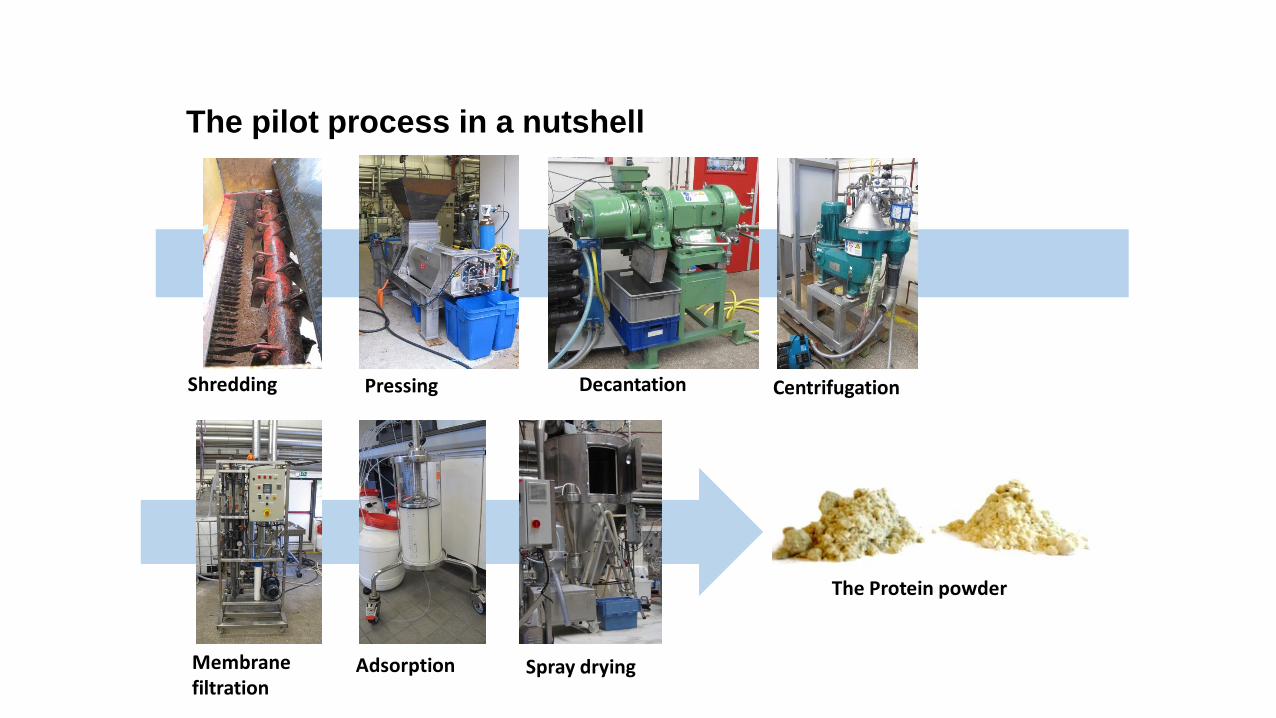
Spray drying
The Protein powder
AdsorptionMembrane filtration
CentrifugationDecantationPressingShredding
The pilot process in a nutshell
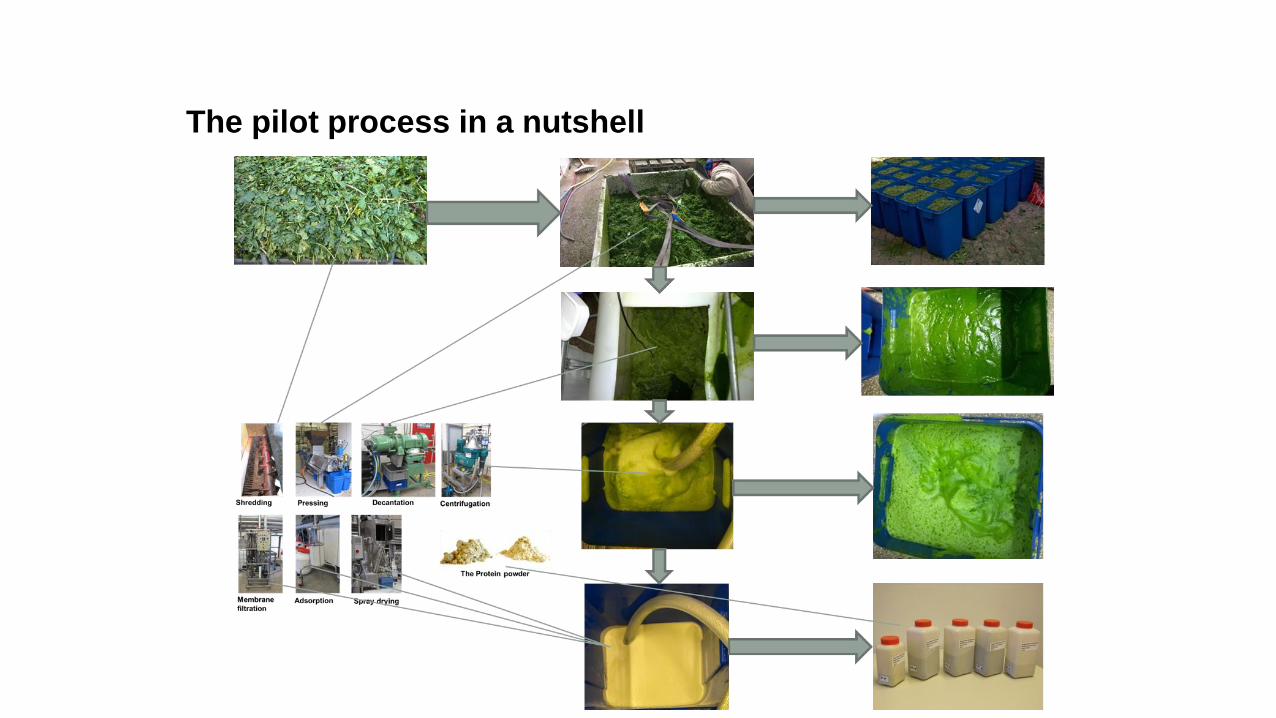
The pilot process in a nutshell
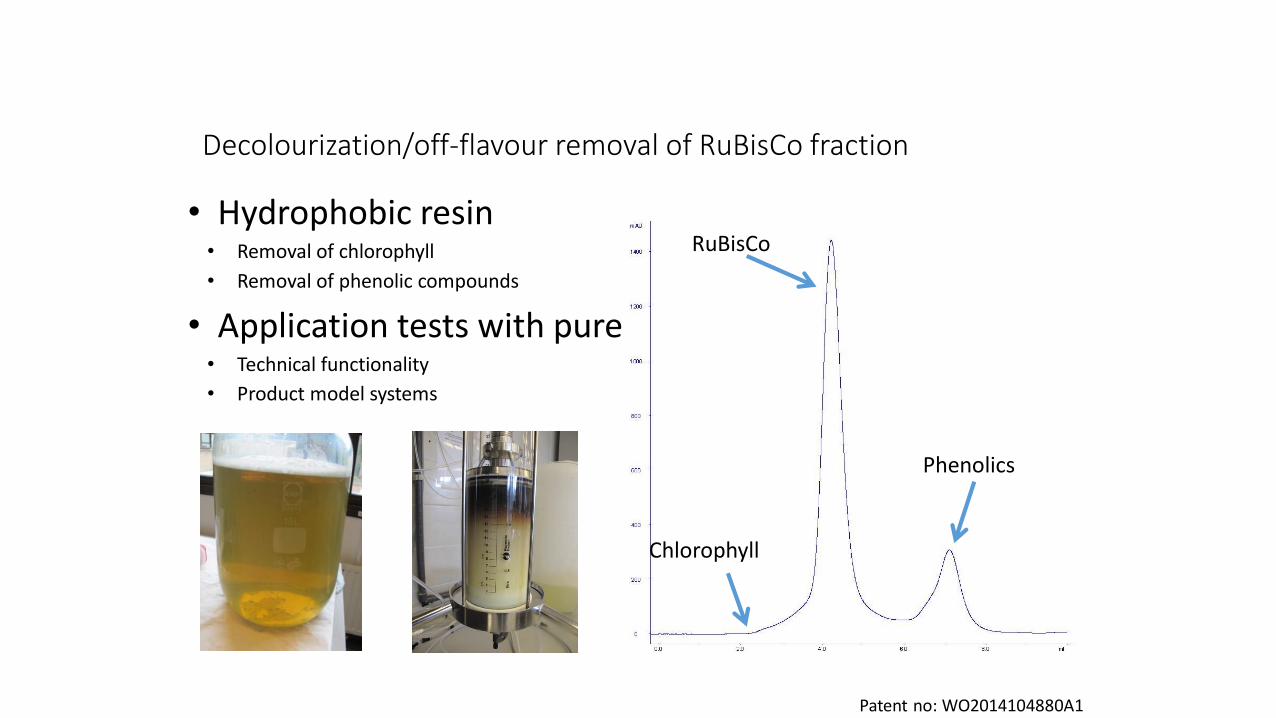
Decolourization/off-flavour removal of RuBisCo fraction
• Hydrophobic resin• Removal of chlorophyll
• Removal of phenolic compounds
• Application tests with pure product• Technical functionality
• Product model systems
RuBisCo
Chlorophyll
Phenolics
Patent no: WO2014104880A1
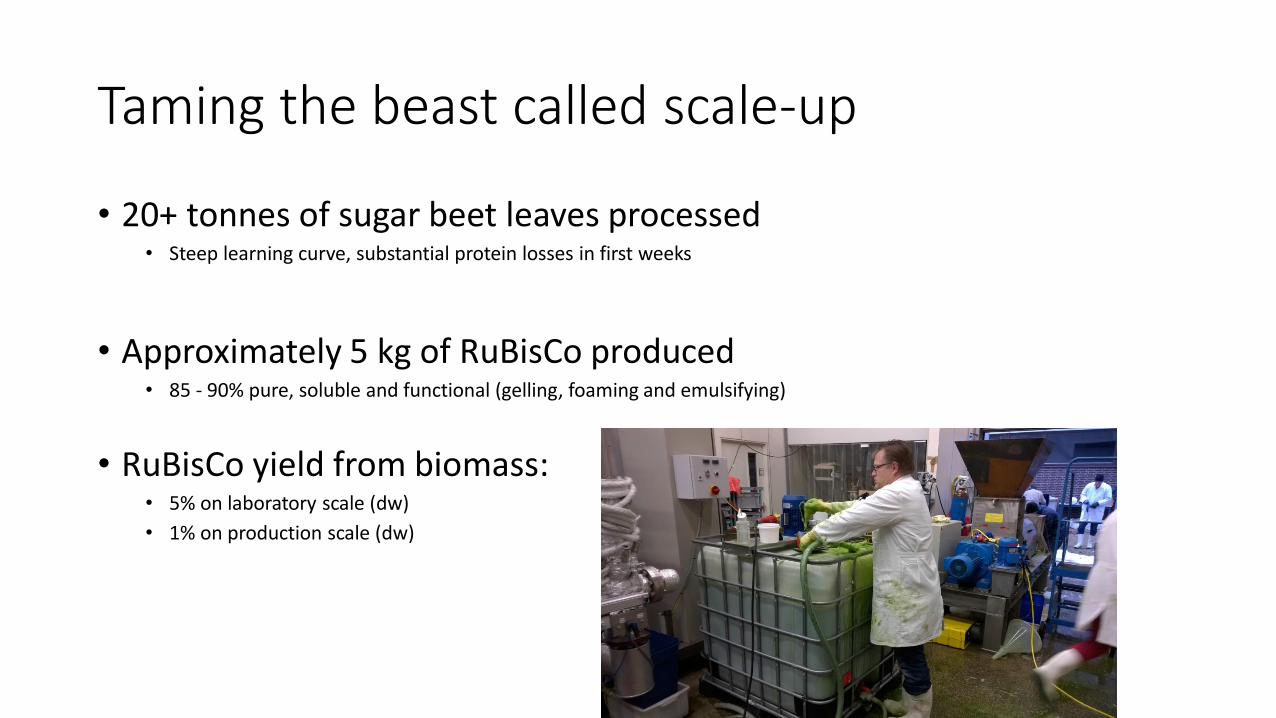
Taming the beast called scale-up
• 20+ tonnes of sugar beet leaves processed• Steep learning curve, substantial protein losses in first weeks
• Approximately 5 kg of RuBisCo produced• 85 - 90% pure, soluble and functional (gelling, foaming and emulsifying)
• RuBisCo yield from biomass:• 5% on laboratory scale (dw)
• 1% on production scale (dw)
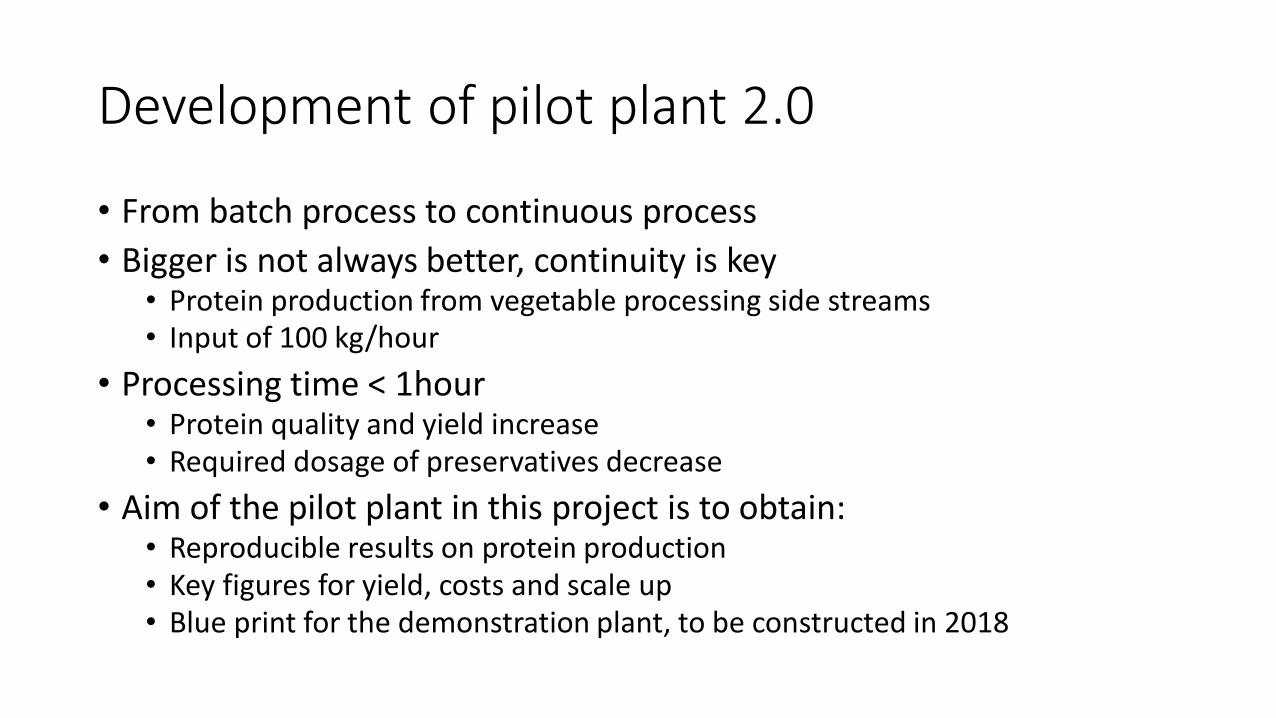
Development of pilot plant 2.0
• From batch process to continuous process
• Bigger is not always better, continuity is key• Protein production from vegetable processing side streams• Input of 100 kg/hour
• Processing time < 1hour• Protein quality and yield increase• Required dosage of preservatives decrease
• Aim of the pilot plant in this project is to obtain:• Reproducible results on protein production• Key figures for yield, costs and scale up• Blue print for the demonstration plant, to be constructed in 2018
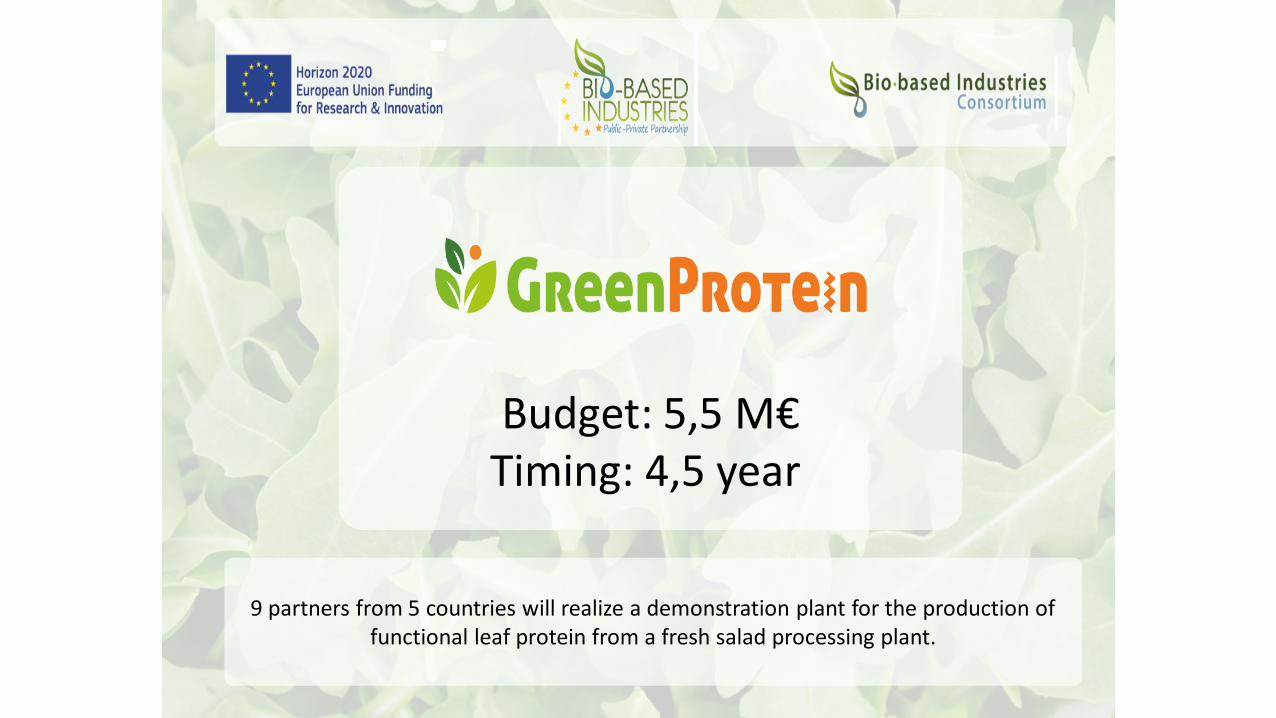
Budget: 5,5 M€Timing: 4,5 year
9 partners from 5 countries will realize a demonstration plant for the production of functional leaf protein from a fresh salad processing plant.
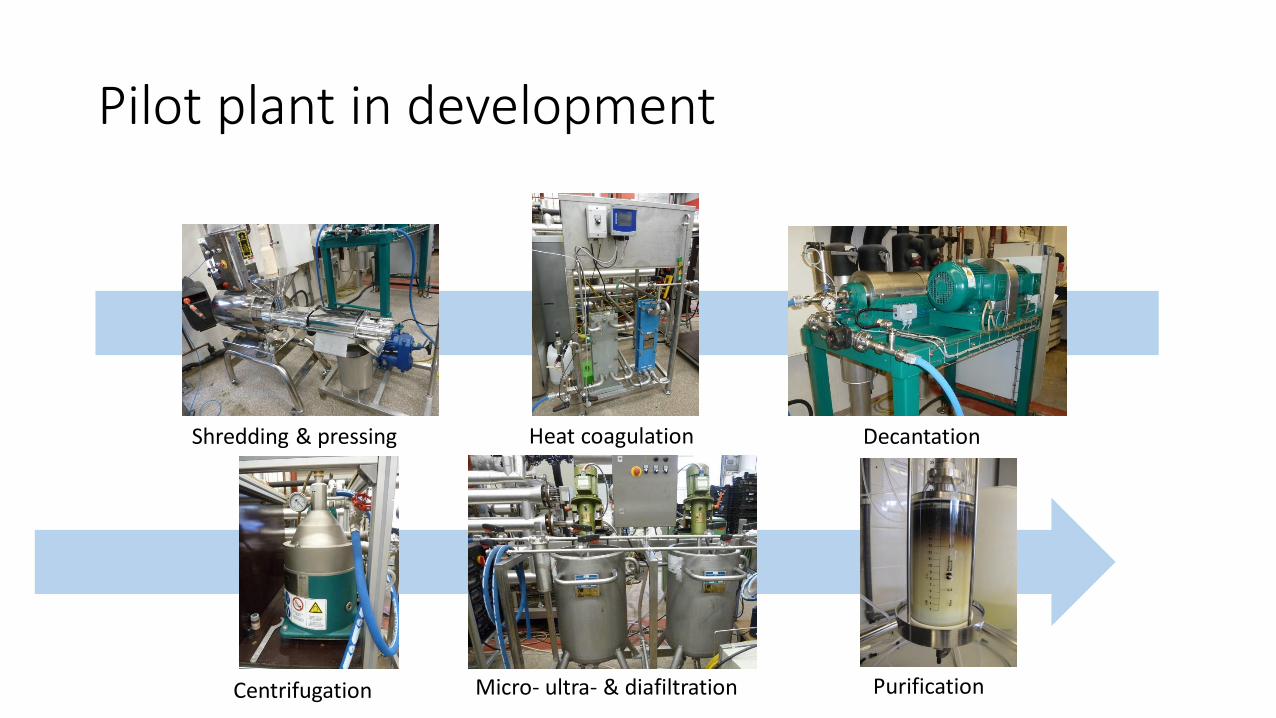
Pilot plant in development
Shredding & pressing Heat coagulation Decantation
Centrifugation Micro- ultra- & diafiltration Purification
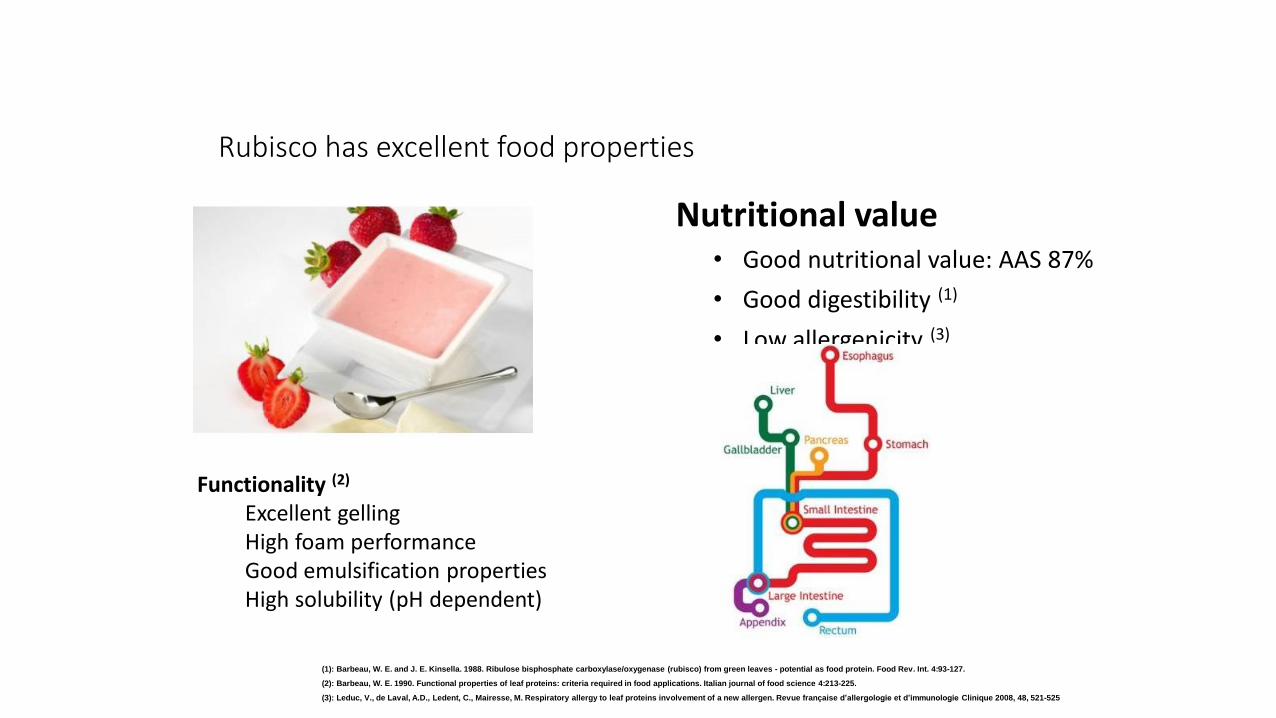
Rubisco has excellent food properties
Nutritional value• Good nutritional value: AAS 87%
• Good digestibility (1)
• Low allergenicity (3)
(1): Barbeau, W. E. and J. E. Kinsella. 1988. Ribulose bisphosphate carboxylase/oxygenase (rubisco) from green leaves - potential as food protein. Food Rev. Int. 4:93-127.
(2): Barbeau, W. E. 1990. Functional properties of leaf proteins: criteria required in food applications. Italian journal of food science 4:213-225.
(3): Leduc, V., de Laval, A.D., Ledent, C., Mairesse, M. Respiratory allergy to leaf proteins involvement of a new allergen. Revue française d’allergologie et d’immunologie Clinique 2008, 48, 521-525
Functionality (2)
Excellent gellingHigh foam performanceGood emulsification propertiesHigh solubility (pH dependent)
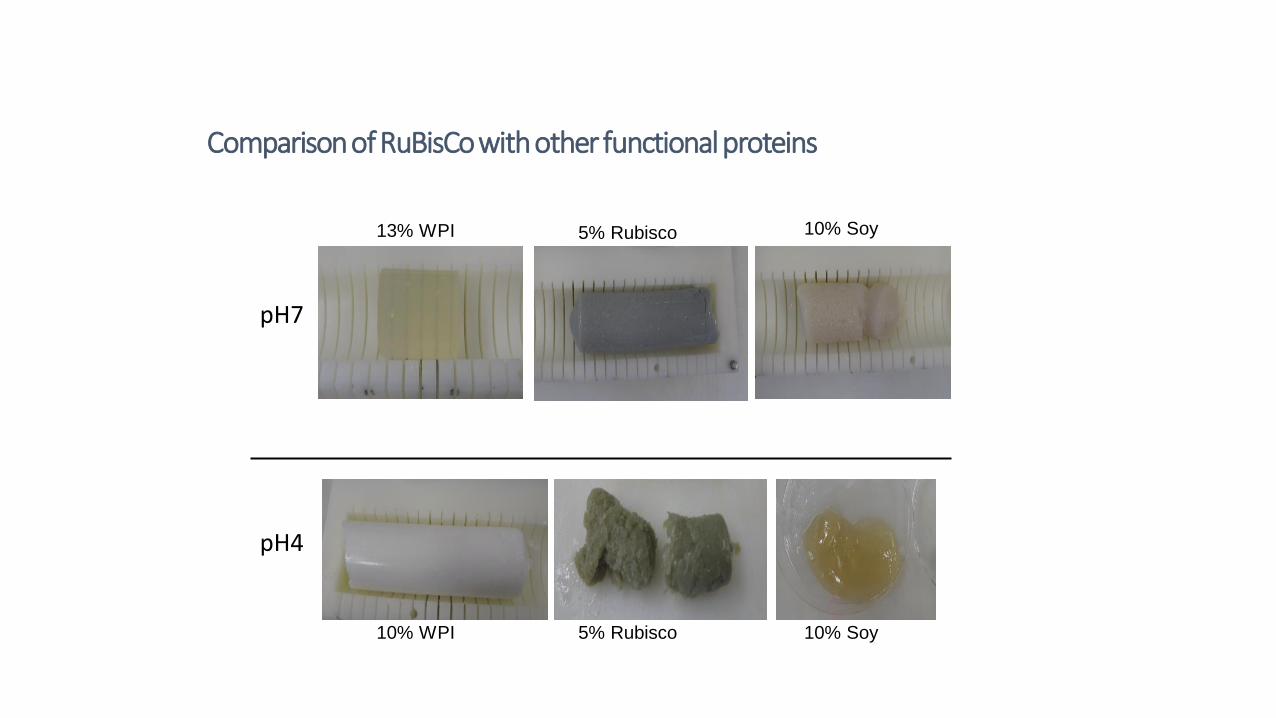
13% WPI
pH7
5% Rubisco 10% Soy
pH4
10% WPI 5% Rubisco 10% Soy
Comparison of RuBisCo with other functional proteins
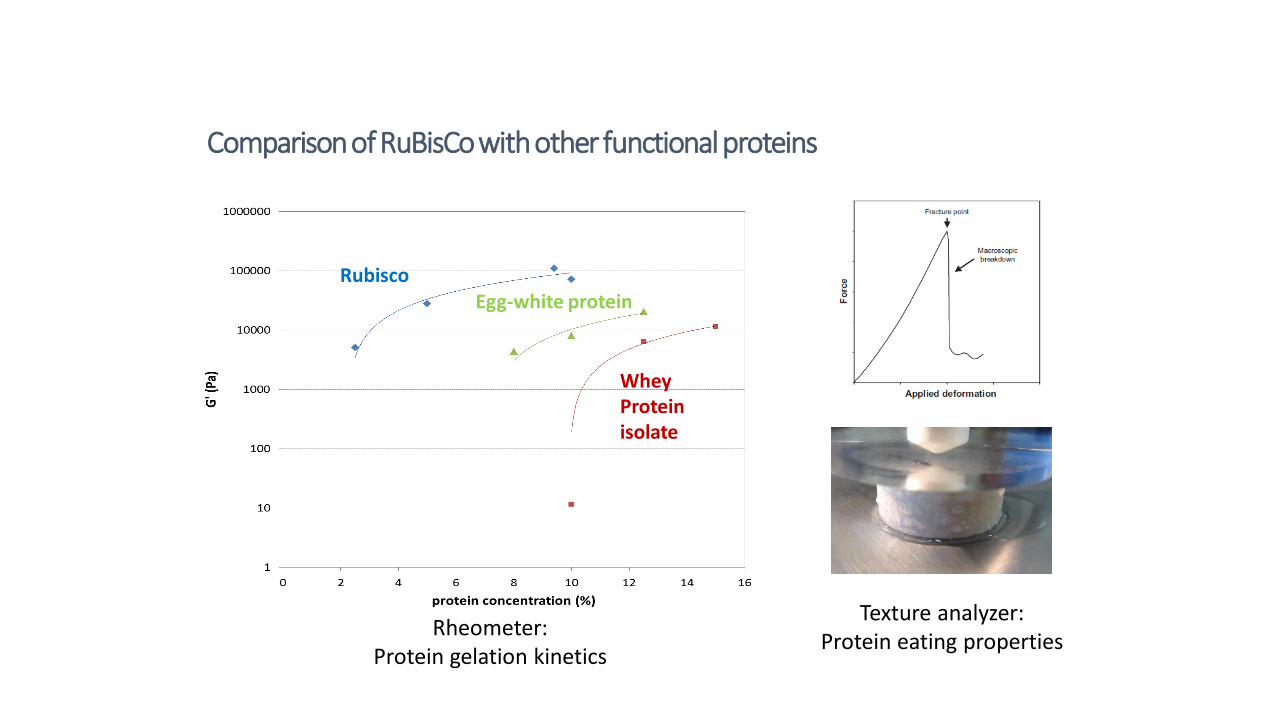
Comparison of RuBisCo with other functional proteins
WheyProteinisolate
Egg-white proteinRubisco
Rheometer: Protein gelation kinetics
Texture analyzer: Protein eating properties
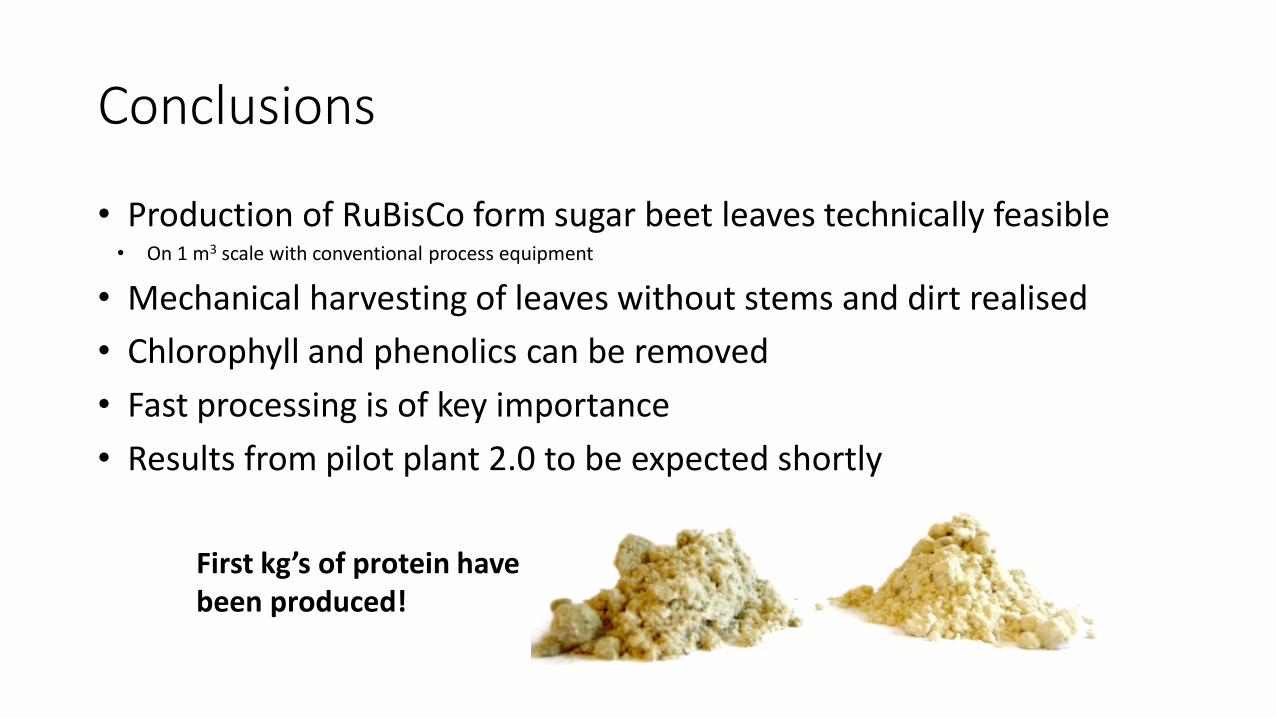
Conclusions
• Production of RuBisCo form sugar beet leaves technically feasible• On 1 m3 scale with conventional process equipment
• Mechanical harvesting of leaves without stems and dirt realised
• Chlorophyll and phenolics can be removed
• Fast processing is of key importance
• Results from pilot plant 2.0 to be expected shortly
First kg’s of protein have been produced!

DAY 1 Session 1,2,3Session 2
Topic: The science of proteins (1)
Presentations available:
Paul Moughan
Anja Janssen

Paul Moughan
• Dietary Protein Quality – Recent Advances
Paul Moughan PhD, DSc, Hon DSc, FRSNZ, FRSC
Riddet Institute, Massey University, New Zealand
Dietary Protein Quality – Recent Advances
Protein for Life ConferenceEde, The Netherlands | 23-26 October 2016
The world faces a major challenge in food production and environmental sustainability over the next 30 years.
30
“Forget the credit crunch and oil, the new
global crisis is food”
Financial Times
31
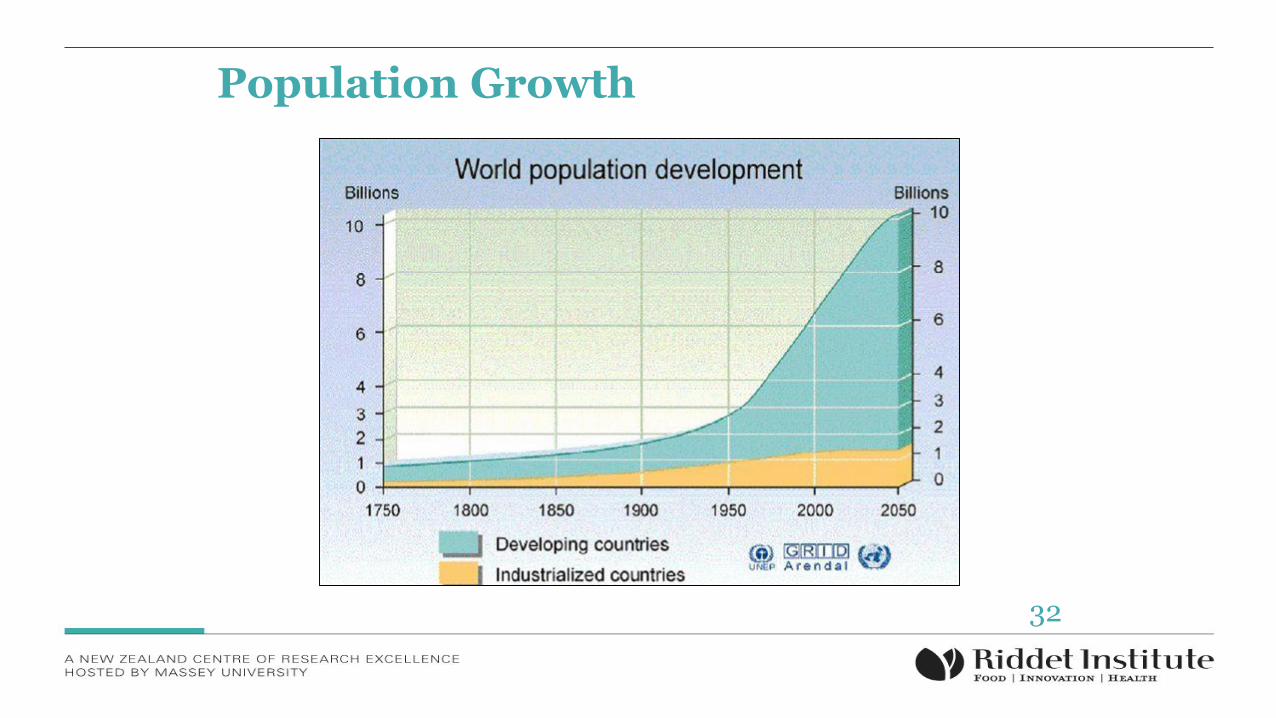
Population Growth
32
˃ Burgeoning middle class will demand more
animal proteins (milk, meat, eggs, fish)
33
˃ It is estimated that the world needs to
produce 70% more food by 2050.
AND not just more food but nutritionally better
food.
“World-wide 842 million people are undernourished. Protein/Energy Malnutrition is by far the most lethal form of malnutrition – Children are its most visible victims”
WHO (2001)
Already:
34
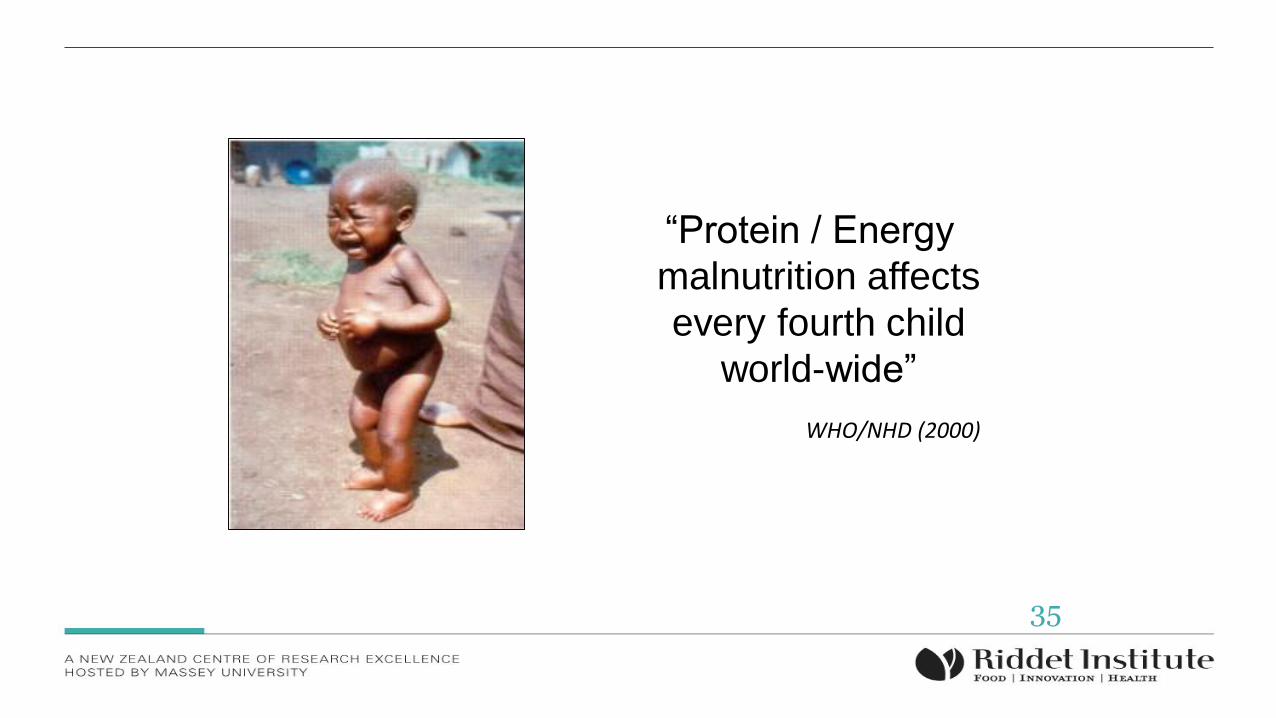
“Protein / Energy
malnutrition affects
every fourth child
world-wide”
WHO/NHD (2000)
35
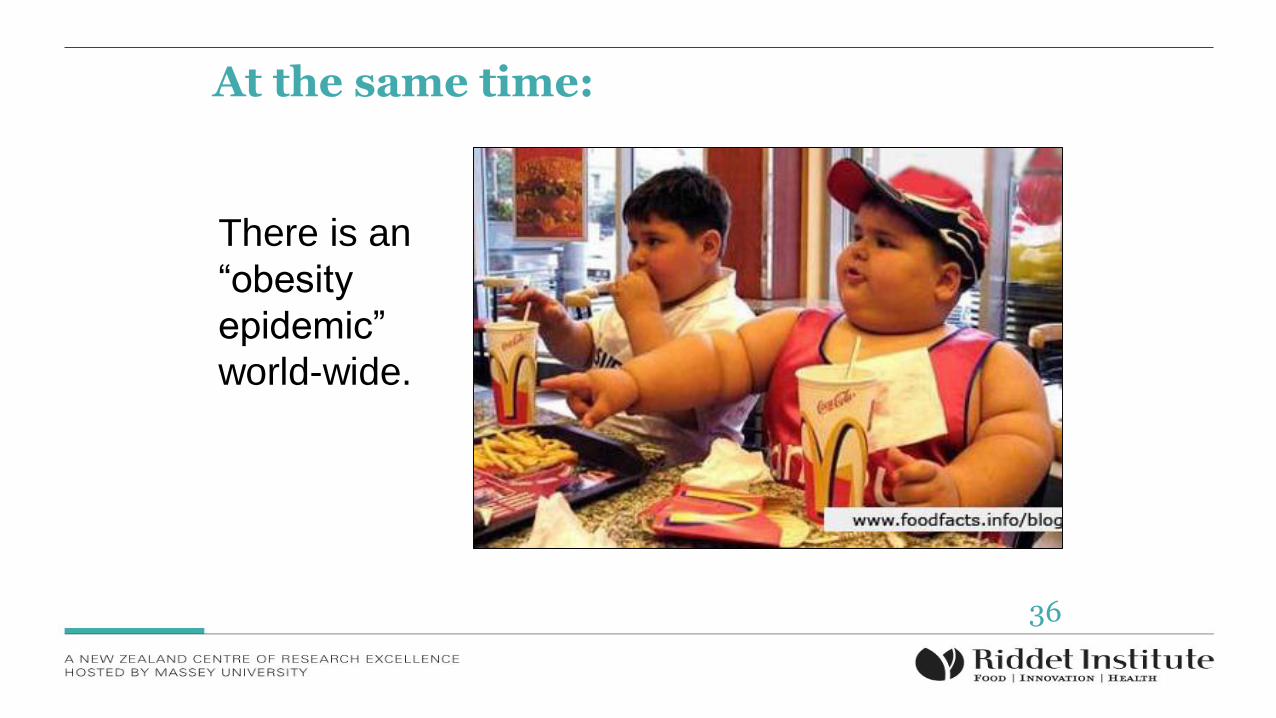
At the same time:
36
There is an
“obesity
epidemic”
world-wide.
The Metabolic Syndrome is seen increasingly in both developed and developing countries
> Obesity
> High blood pressure
> Type II diabetes
> Cardio-vascular disease
These are largely preventable conditions (diet/lifestyle)37
> Awareness of role of protein in satiety
and body muscle metabolism.
> Estimates of protein requirement being revised upwards
High-protein foods are “in-vogue”:
> Emphasis towards
food/health/wellness (especially high
protein foods)
> High-protein “weight loss” foods and
diets.
38
This all means an increasing global demand for food protein.
39
40
Dietary Protein Quality will become of fundamental importance
With Increased Demand for Protein:
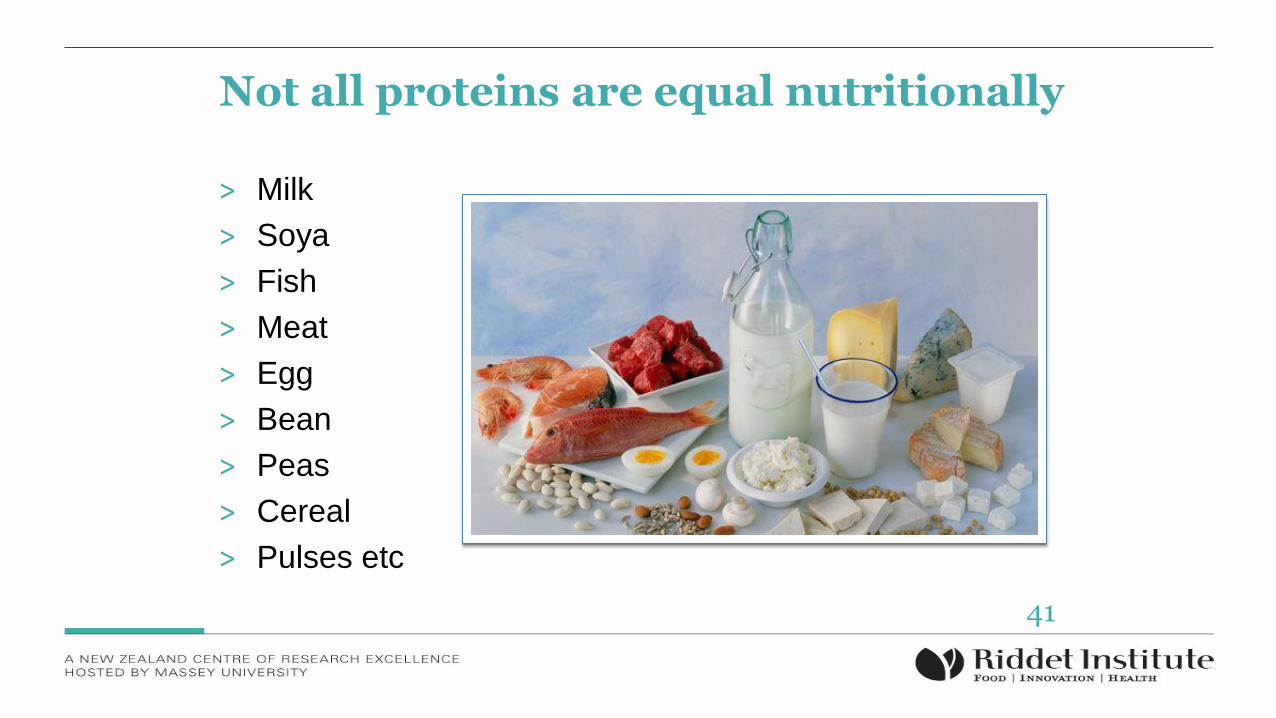
Not all proteins are equal nutritionally
> Milk
> Soya
> Fish
> Meat
> Egg
> Bean
> Peas
> Cereal
> Pulses etc
41
In particular vegetable-based proteins are of lower quality than dairy/meat/ fish based proteins
> fibre
> anti-nutritional factors
> different structures
42
This is not properly captured in the traditional way of describing the Protein Quality of food: “Protein Digestibility Corrected Amino Acid Score”, PDCAAS.
43
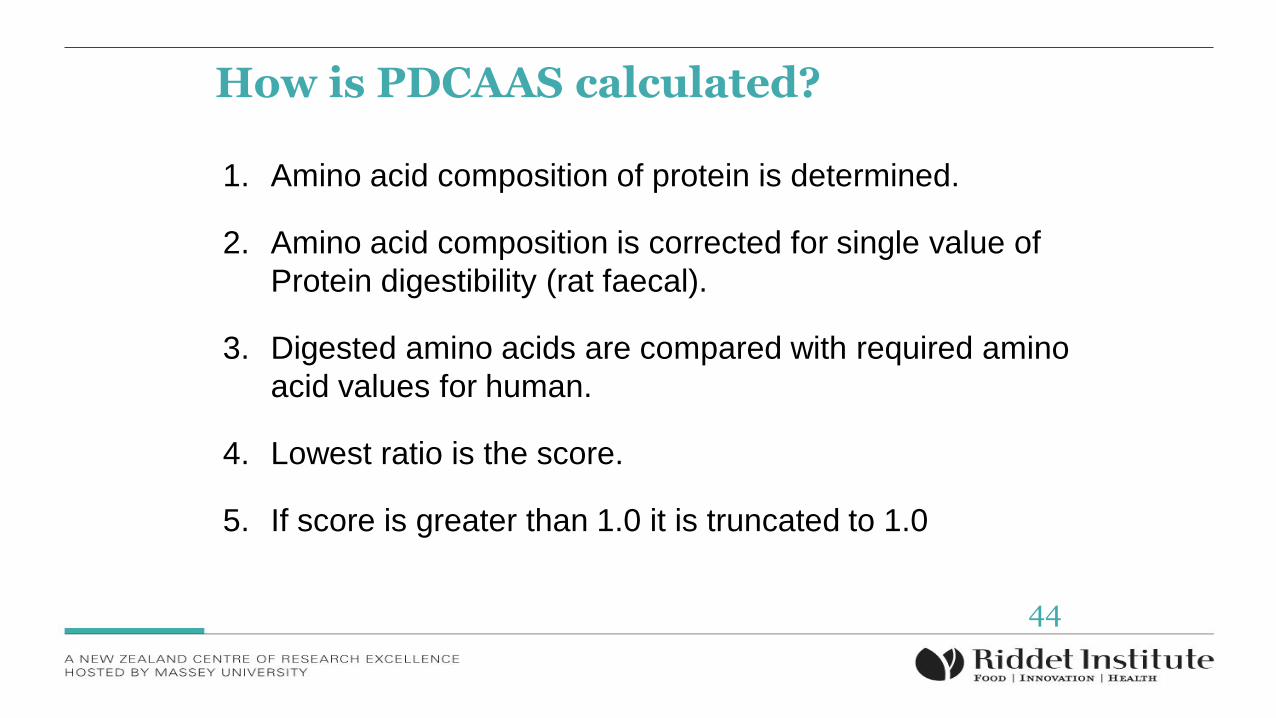
How is PDCAAS calculated?
1. Amino acid composition of protein is determined.
2. Amino acid composition is corrected for single value of
Protein digestibility (rat faecal).
3. Digested amino acids are compared with required amino
acid values for human.
4. Lowest ratio is the score.
5. If score is greater than 1.0 it is truncated to 1.0
44
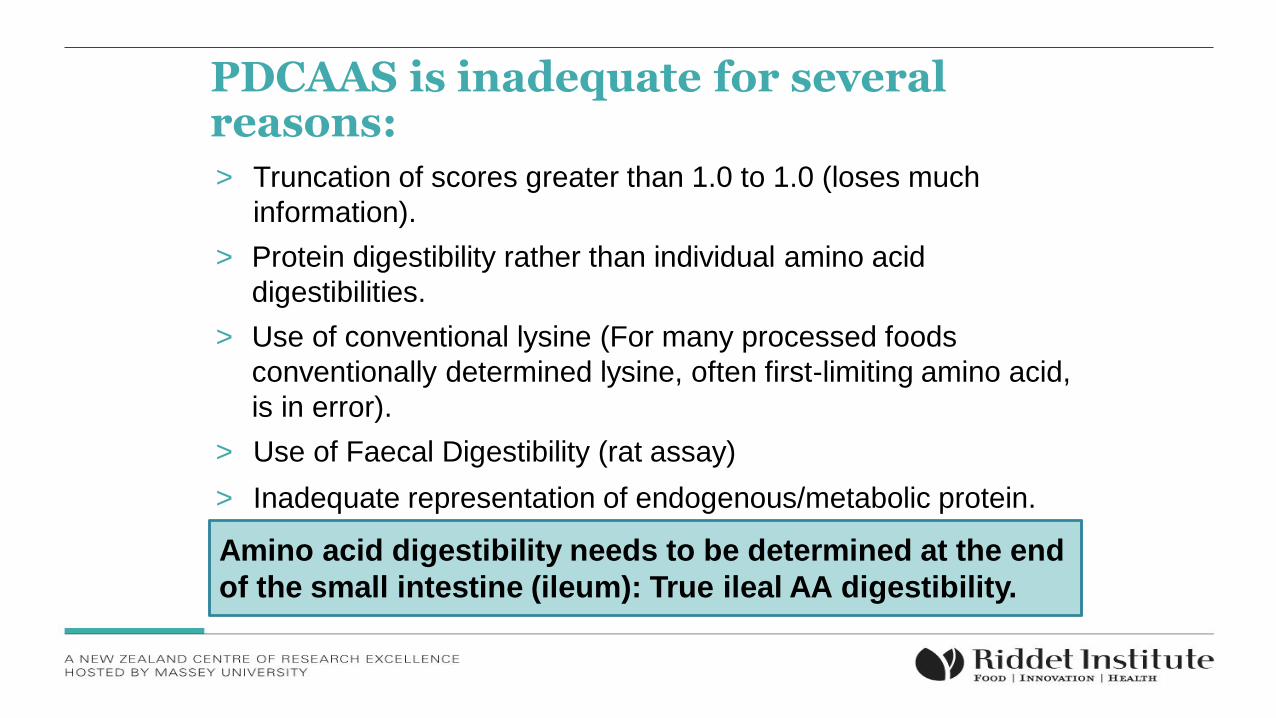
PDCAAS is inadequate for several reasons:> Truncation of scores greater than 1.0 to 1.0 (loses much
information).
> Protein digestibility rather than individual amino acid
digestibilities.
> Use of conventional lysine (For many processed foods
conventionally determined lysine, often first-limiting amino acid,
is in error).
> Use of Faecal Digestibility (rat assay)
> Inadequate representation of endogenous/metabolic protein.
Amino acid digestibility needs to be determined at the end
of the small intestine (ileum): True ileal AA digestibility.
46
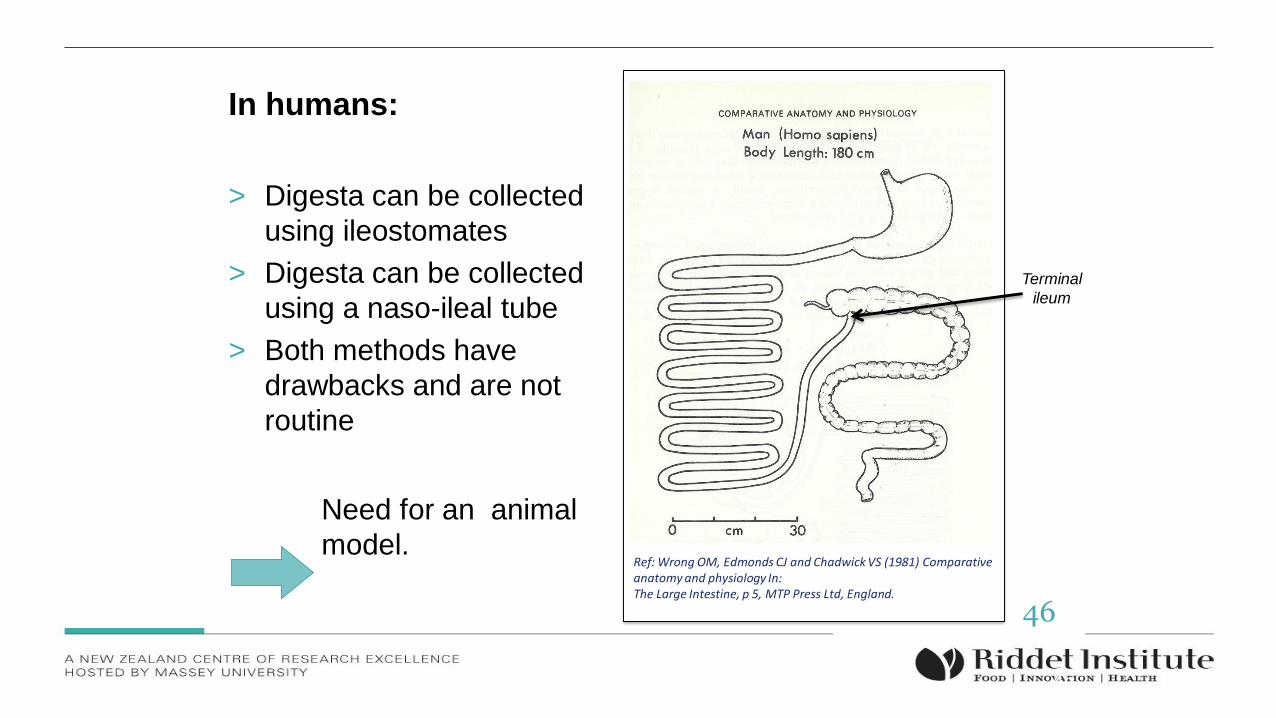
> Digesta can be collected
using ileostomates
> Digesta can be collected
using a naso-ileal tube
> Both methods have
drawbacks and are not
routine
Need for an animal
model.Ref: Wrong OM, Edmonds CJ and Chadwick VS (1981) Comparative anatomy and physiology In:The Large Intestine, p 5, MTP Press Ltd, England.
Terminal
ileum
In humans:
46
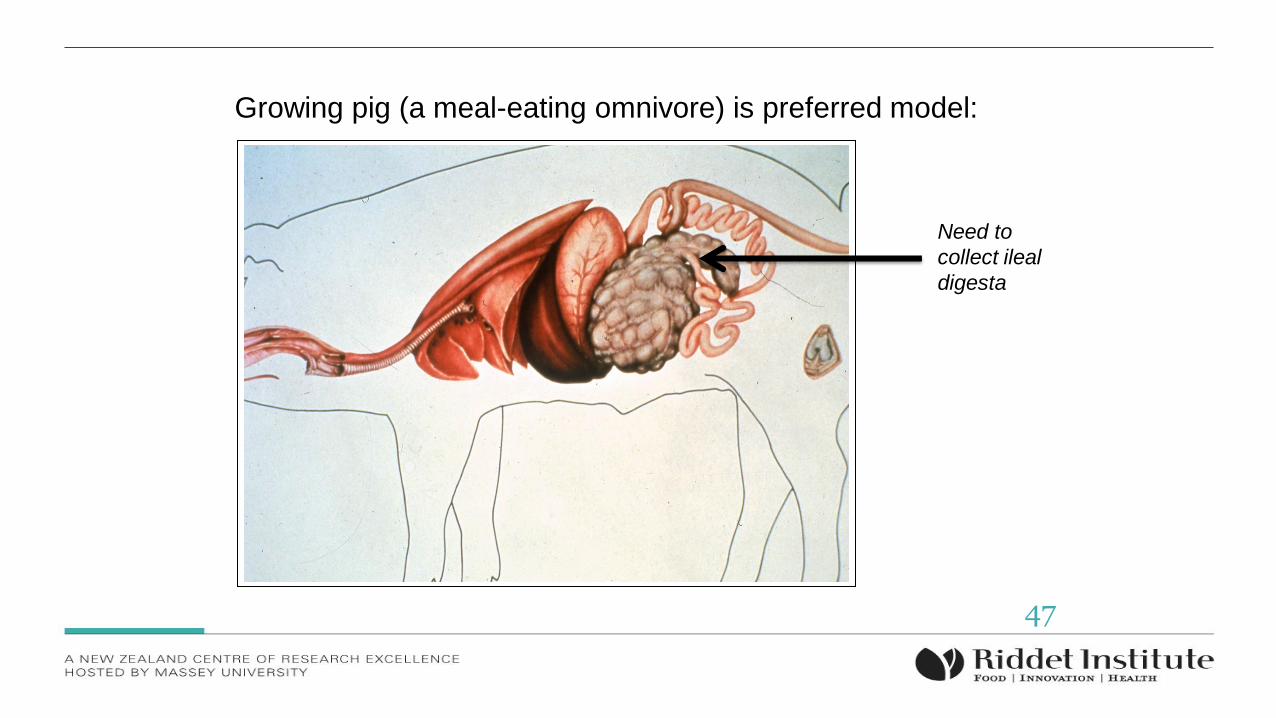
Growing pig (a meal-eating omnivore) is preferred model:
Need to
collect ileal
digesta
47
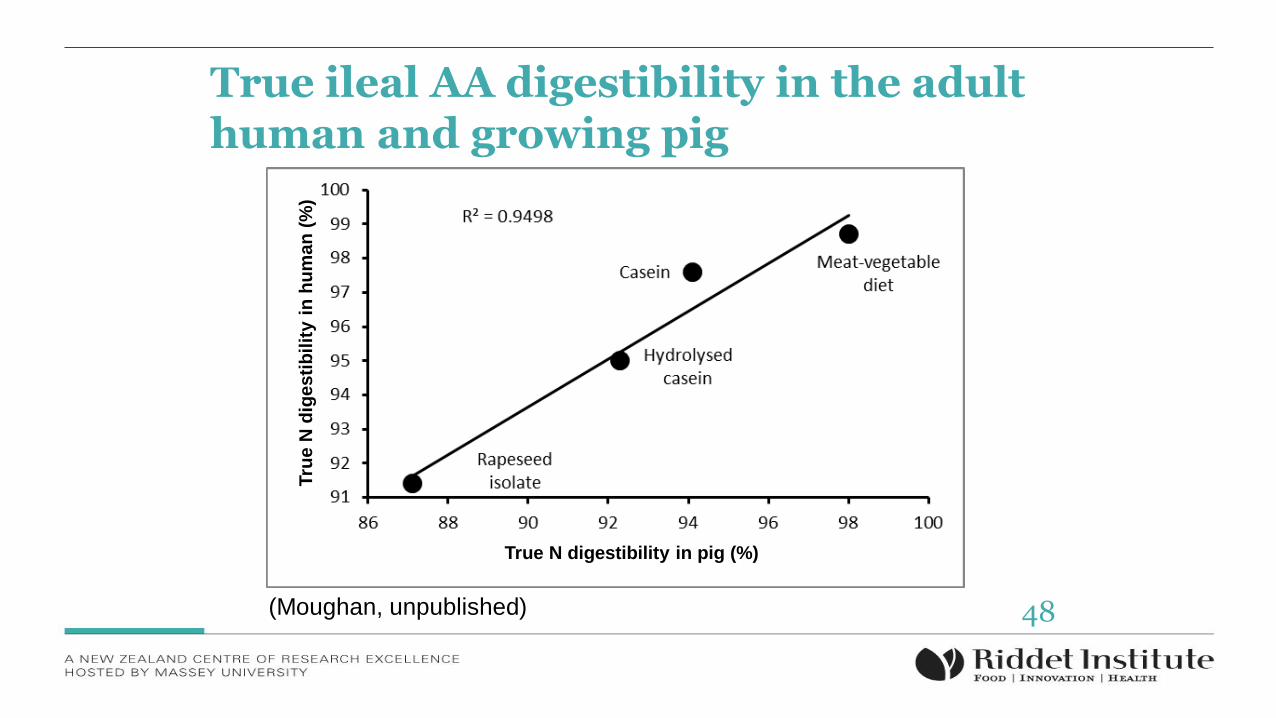
True ileal AA digestibility in the adult human and growing pig
Tru
e N
dig
esti
bilit
y i
n h
um
an
(%
)
True N digestibility in pig (%)
(Moughan, unpublished) 48
49
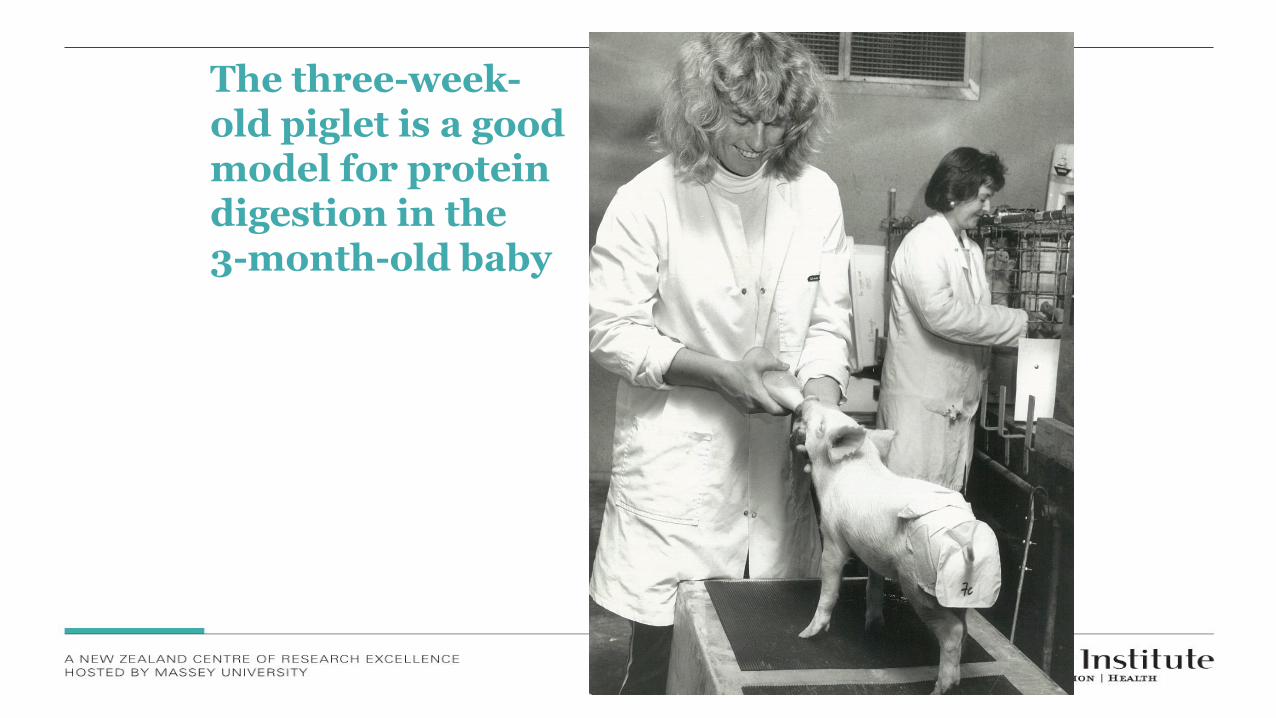
The three-week-old piglet is a good model for protein digestion in the 3-month-old baby
50
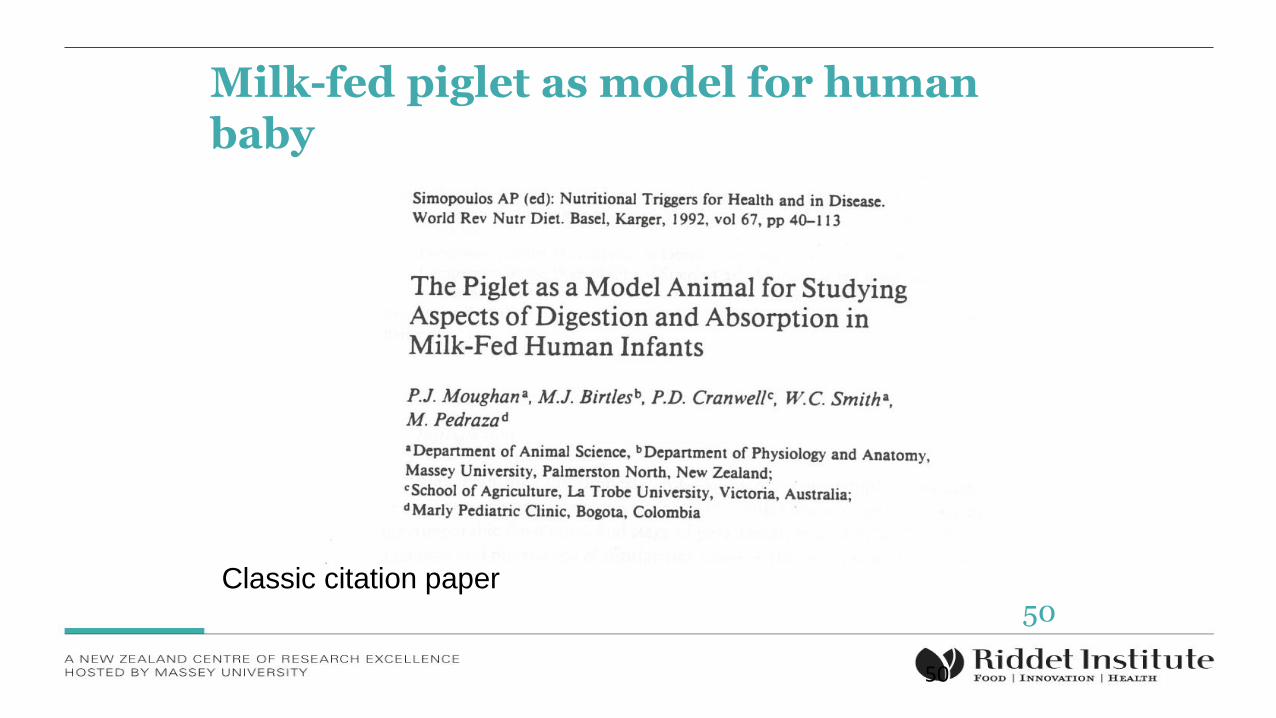
Milk-fed piglet as model for human baby
Classic citation paper50
Underlying deficiencies of PDCAAS
51
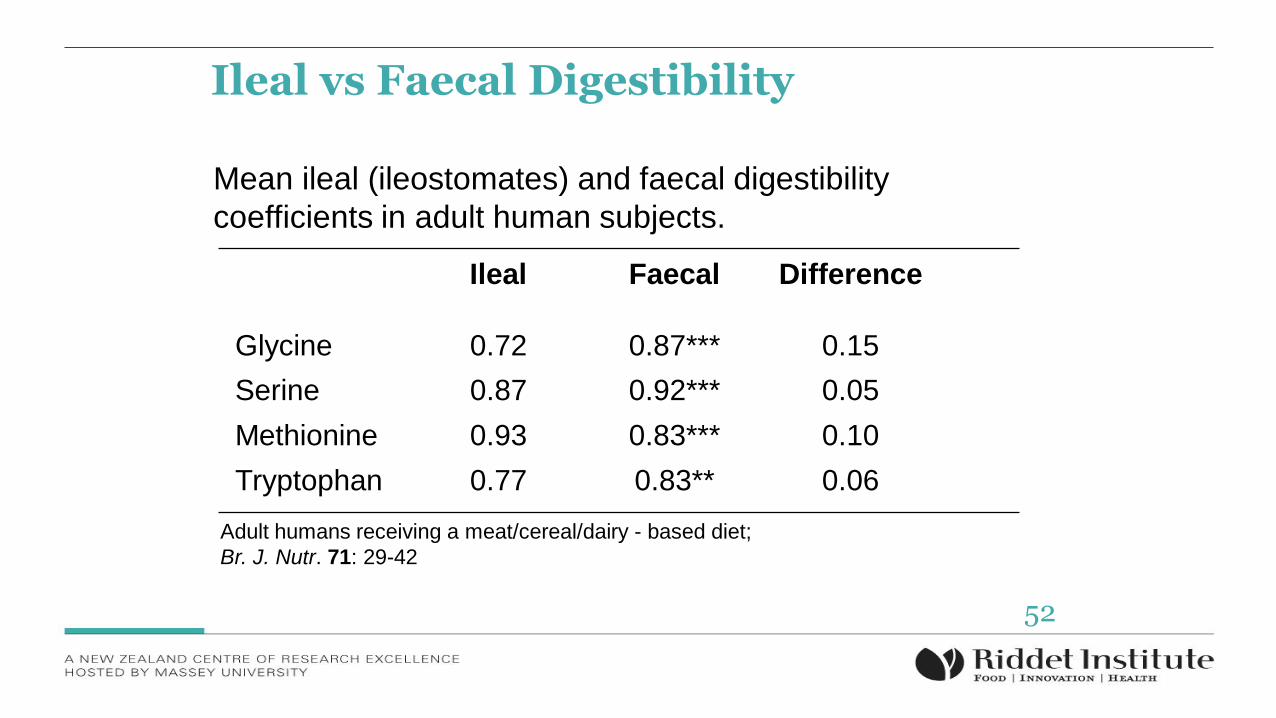
Ileal vs Faecal Digestibility
Mean ileal (ileostomates) and faecal digestibility
coefficients in adult human subjects.
Ileal Faecal Difference
Glycine 0.72 0.87*** 0.15
Serine 0.87 0.92*** 0.05
Methionine 0.93 0.83*** 0.10
Tryptophan 0.77 0.83** 0.06
Adult humans receiving a meat/cereal/dairy - based diet;
Br. J. Nutr. 71: 29-42
52
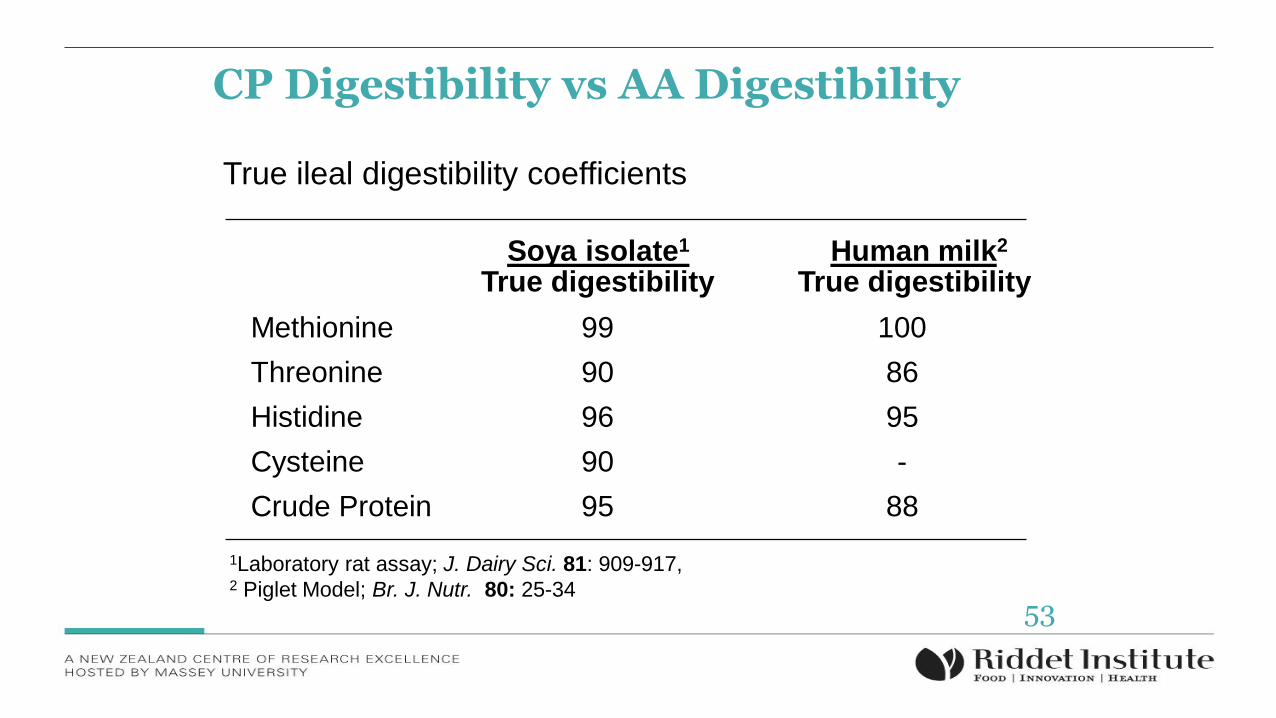
CP Digestibility vs AA Digestibility:
True ileal digestibility coefficients
Soya isolate1
1Laboratory rat assay; J. Dairy Sci. 81: 909-917,2 Piglet Model; Br. J. Nutr. 80: 25-34
True digestibility True digestibility
Methionine 99 100
Threonine 90 86
Histidine 96 95
Cysteine 90 -
Crude Protein 95 88
Human milk2
53
Processed Foods — Conventional AA Digestibility Is Inaccurate: (lysine as example)
˃ Conventional determination of lysine and lysine
digestibility are inaccurate for processed foods.
˃ Damaged lysine molecules revert to lysine with
conventional procedures.
˃ Need for a new approach.
˃ Reaction of food and digesta with o-methylisourea allows
accurate determination of absorbed actual lysine.
54
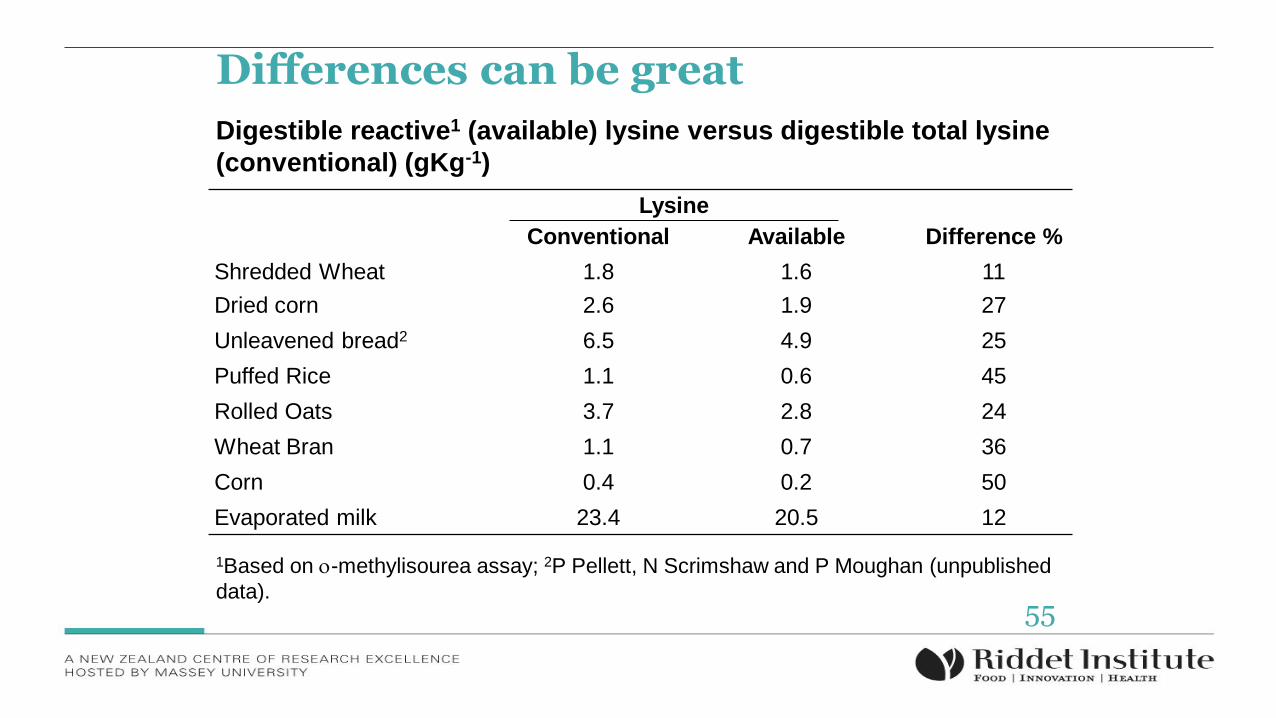
Conventional Available Difference %
Shredded Wheat 1.8 1.6 11
Dried corn 2.6 1.9 27
Unleavened bread2 6.5 4.9 25
Puffed Rice 1.1 0.6 45
Rolled Oats 3.7 2.8 24
Wheat Bran 1.1 0.7 36
Corn 0.4 0.2 50
Evaporated milk 23.4 20.5 12
Digestible reactive1 (available) lysine versus digestible total lysine
(conventional) (gKg-1)
Lysine
1Based on -methylisourea assay; 2P Pellett, N Scrimshaw and P Moughan (unpublished
data).
Differences can be great
55
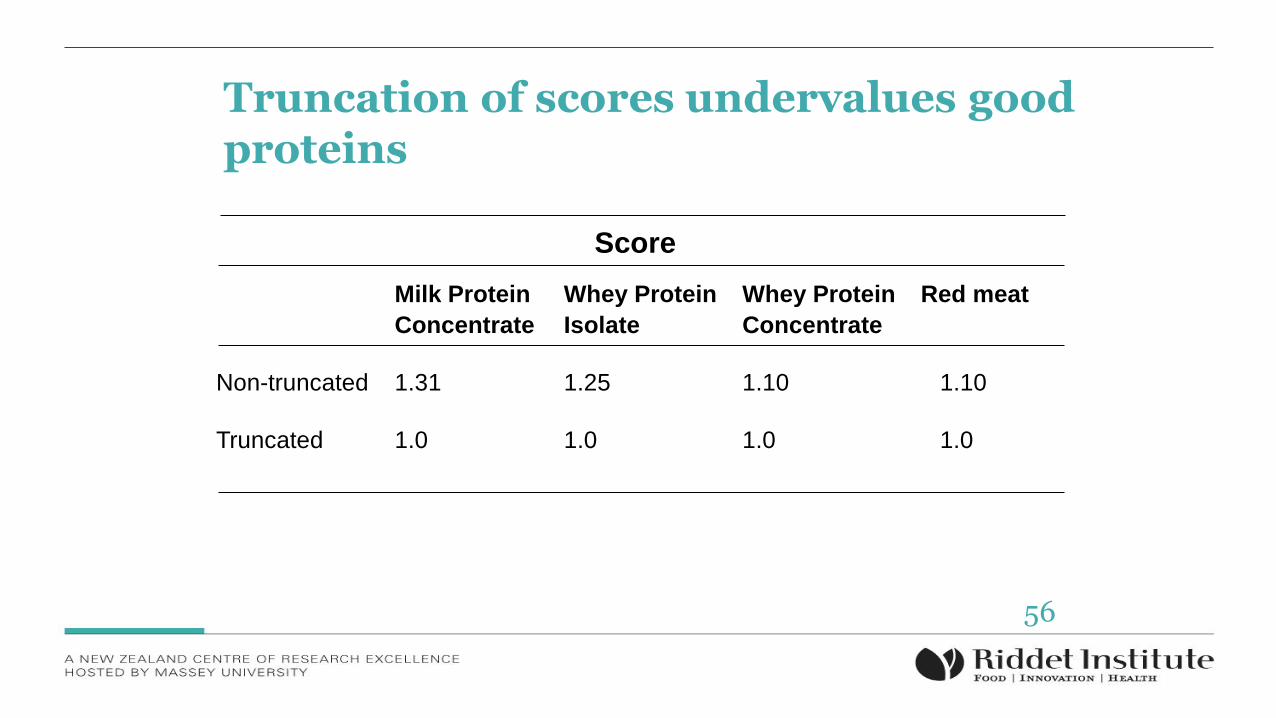
Milk Protein Whey Protein Whey Protein Red meat
Concentrate Isolate Concentrate
Non-truncated 1.31 1.25 1.10 1.10
Truncated 1.0 1.0 1.0 1.0
Score
Truncation of scores undervalues good proteins
56
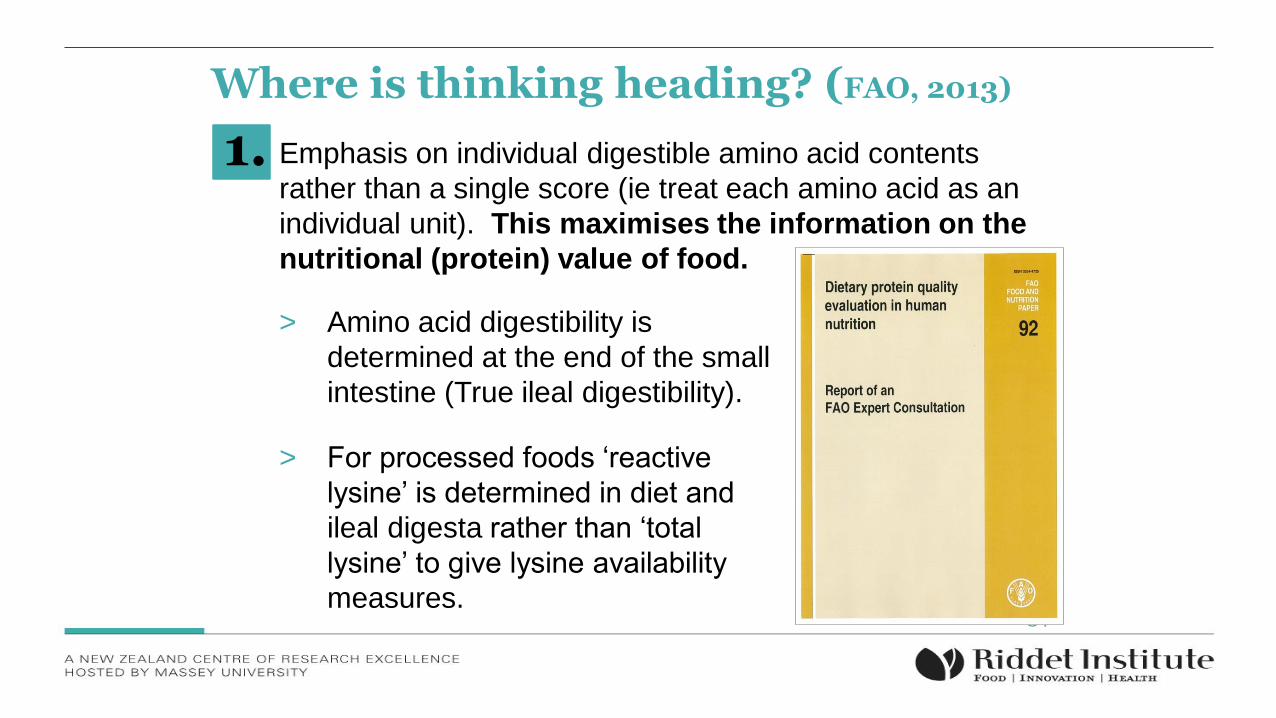
1. Emphasis on individual digestible amino acid contents
rather than a single score (ie treat each amino acid as an
individual unit). This maximises the information on the
nutritional (protein) value of food.
57
Where is thinking heading? (FAO, 2013)
> Amino acid digestibility is
determined at the end of the small
intestine (True ileal digestibility).
> For processed foods ‘reactive
lysine’ is determined in diet and
ileal digesta rather than ‘total
lysine’ to give lysine availability
measures.
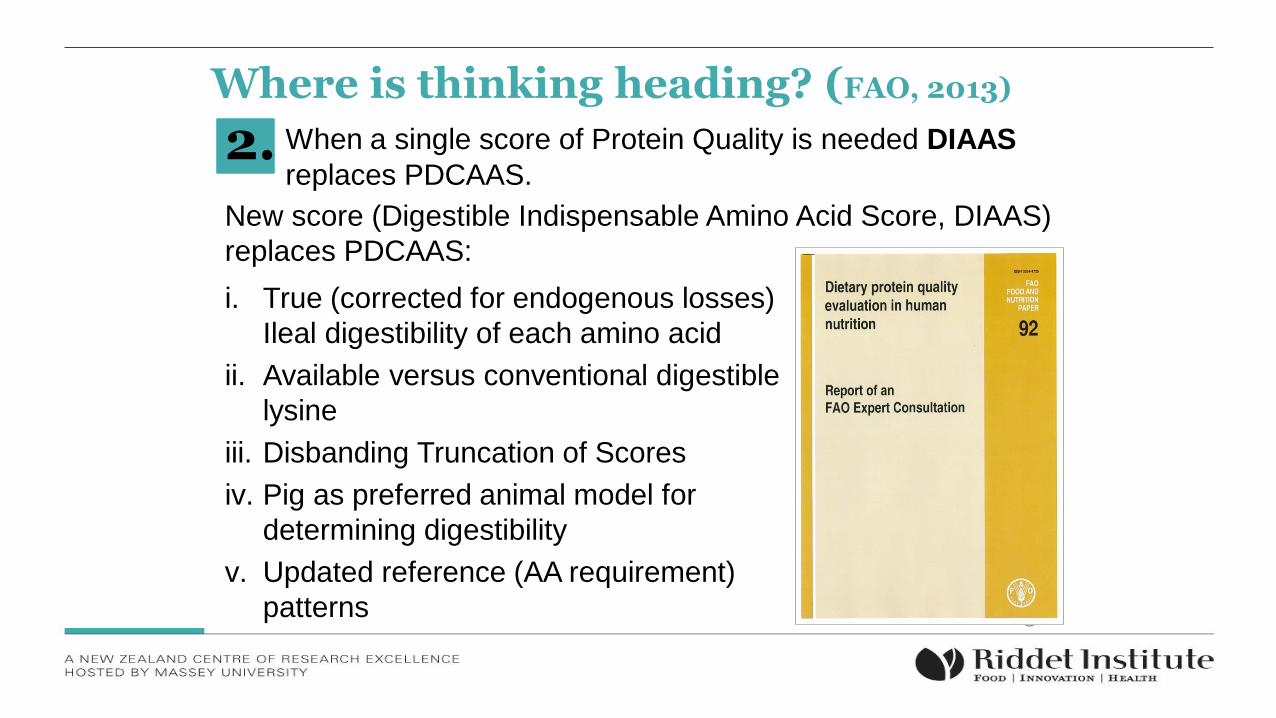
When a single score of Protein Quality is needed DIAAS
replaces PDCAAS. 2.
58
Where is thinking heading? (FAO, 2013)
New score (Digestible Indispensable Amino Acid Score, DIAAS)
replaces PDCAAS:
i. True (corrected for endogenous losses)
Ileal digestibility of each amino acid
ii. Available versus conventional digestible
lysine
iii. Disbanding Truncation of Scores
iv. Pig as preferred animal model for
determining digestibility
v. Updated reference (AA requirement)
patterns
59
DIAAS is a considerable step forward in the description of Dietary
Protein Quality
59
60
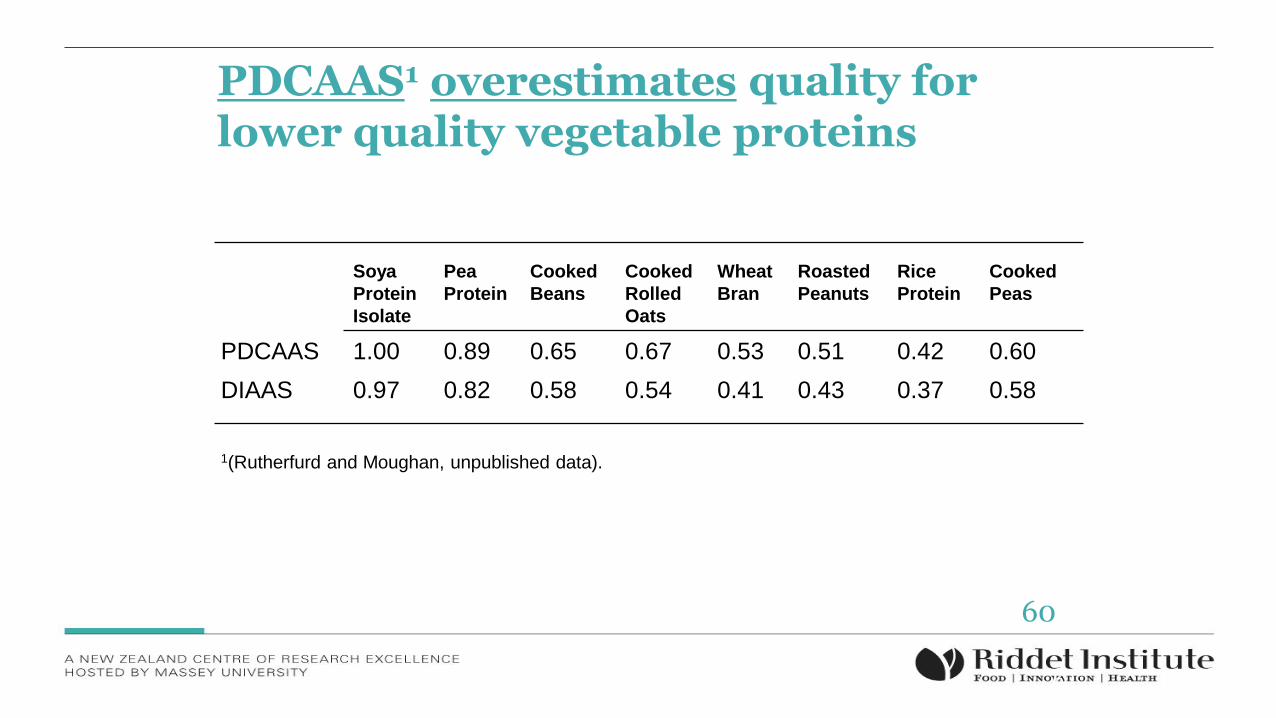
1(Rutherfurd and Moughan, unpublished data).
Soya
Protein
Isolate
Pea
Protein
Cooked
Beans
Cooked
Rolled
Oats
Wheat
Bran
Roasted
Peanuts
Rice
Protein
Cooked
Peas
PDCAAS 1.00 0.89 0.65 0.67 0.53 0.51 0.42 0.60
DIAAS 0.97 0.82 0.58 0.54 0.41 0.43 0.37 0.58
PDCAAS1 overestimates quality for lower quality vegetable proteins
60
61
Such differences have meaningful impacts in describing protein supply
and the value of specific proteins.
61
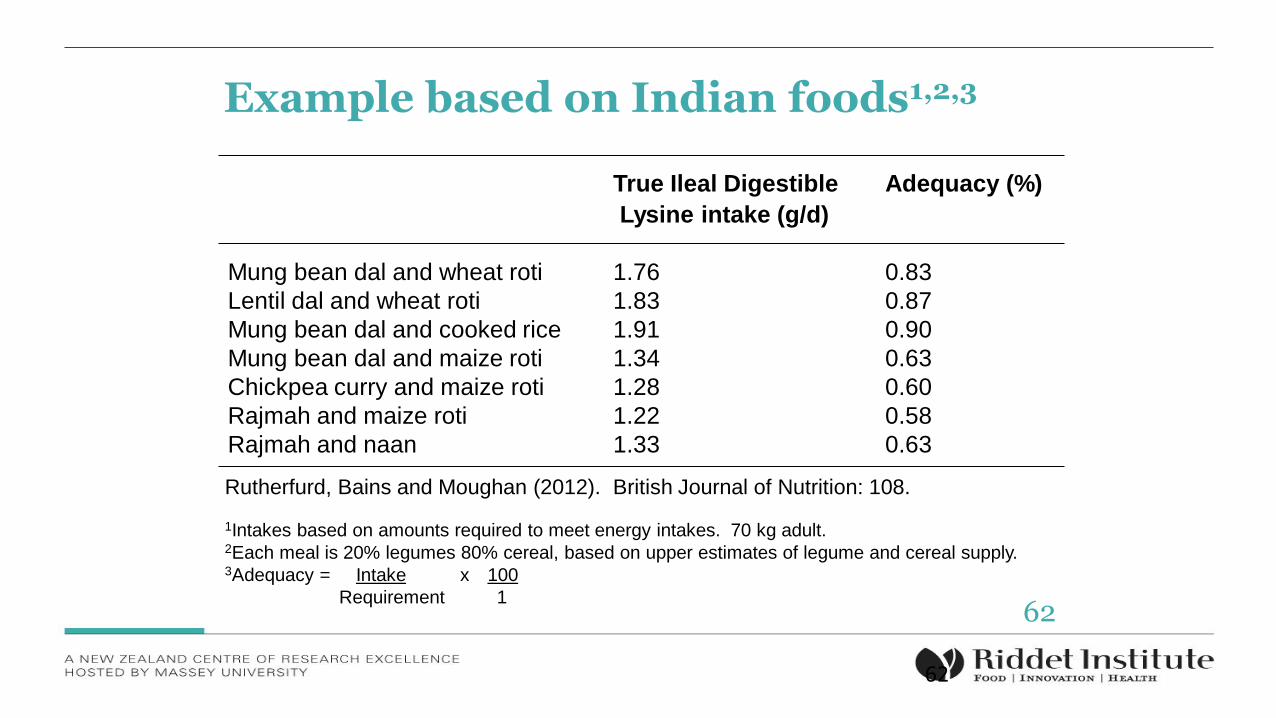
Example based on Indian foods1,2,3
62
True Ileal Digestible Adequacy (%)
Lysine intake (g/d)
Mung bean dal and wheat roti 1.76 0.83
Lentil dal and wheat roti 1.83 0.87
Mung bean dal and cooked rice 1.91 0.90
Mung bean dal and maize roti 1.34 0.63
Chickpea curry and maize roti 1.28 0.60
Rajmah and maize roti 1.22 0.58
Rajmah and naan 1.33 0.63
Rutherfurd, Bains and Moughan (2012). British Journal of Nutrition: 108.
1Intakes based on amounts required to meet energy intakes. 70 kg adult.2Each meal is 20% legumes 80% cereal, based on upper estimates of legume and cereal supply.3Adequacy = Intake x 100
Requirement 162
Re-cap
> Protein will be central to world food and nutrition security.
> Protein Quality Evaluation is of fundamental importance.
> A new emphasis on the availability of each AA as a single
nutrient.
> DIAAS incorporates recent scientific advances. Is an
improvement over the old Scoring method (PDCAAS).
> Information on true ileal AA digestibility of foods and DIAAS
values is greatly needed.
63
Proteos> An initiative funded by the world’s food sectors
(coordinated by Global Dairy Platform, GDP)
> Consortium of Research Providers (Massey University,
Wageningen UR, University of Illinois, AgroParisTech).
AIMS:
˃ To provide further justification of pig model (human/pig
comparisons).
˃ To provide a global dataset of true ileal AA digestibility
and DIAAS (initially 100 foods).
This will provide the data to allow DIAAS to be fully
implemented 64
These are important steps in the fight
against malnutrition, both under- and over-
feeding and in ensuring sustainable food
and protein nutrition.
Conclusion
65
Thank you
66
Anja Janssen
• Towards mechanistic understanding of gastric digestion of structured proteins
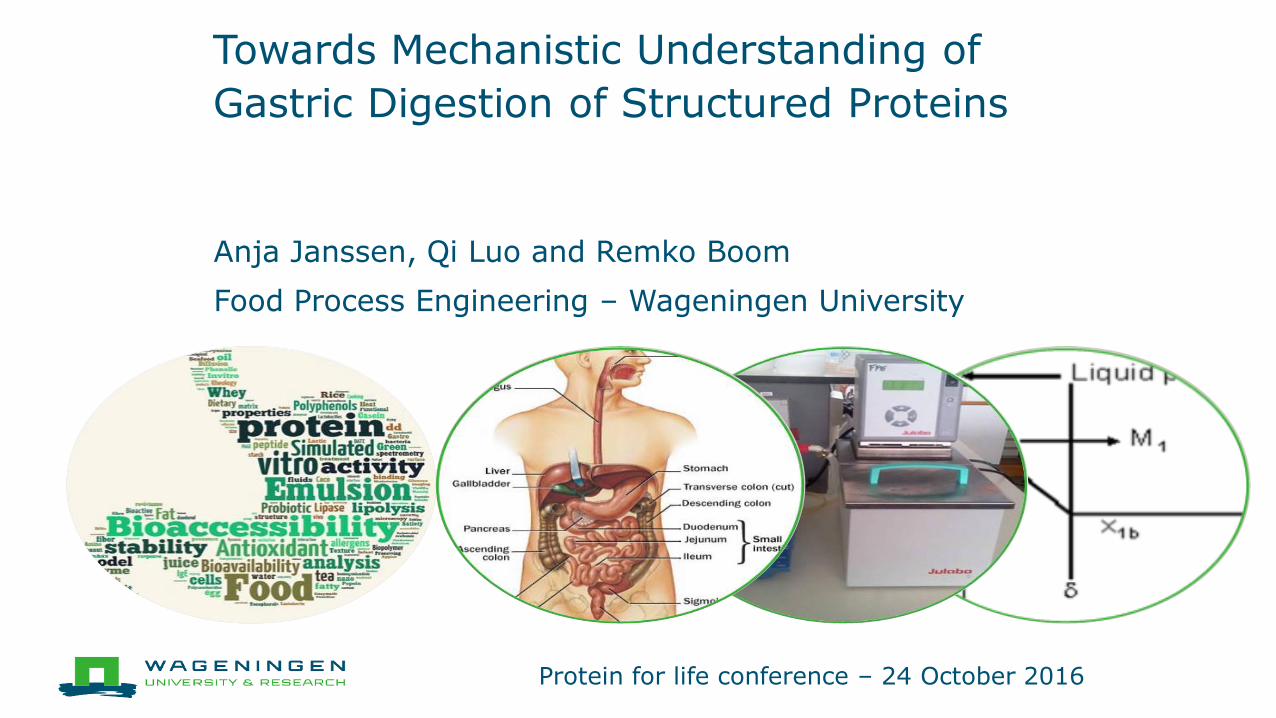
Towards Mechanistic Understanding of
Gastric Digestion of Structured Proteins
Anja Janssen, Qi Luo and Remko Boom
Food Process Engineering – Wageningen University
Protein for life conference – 24 October 2016
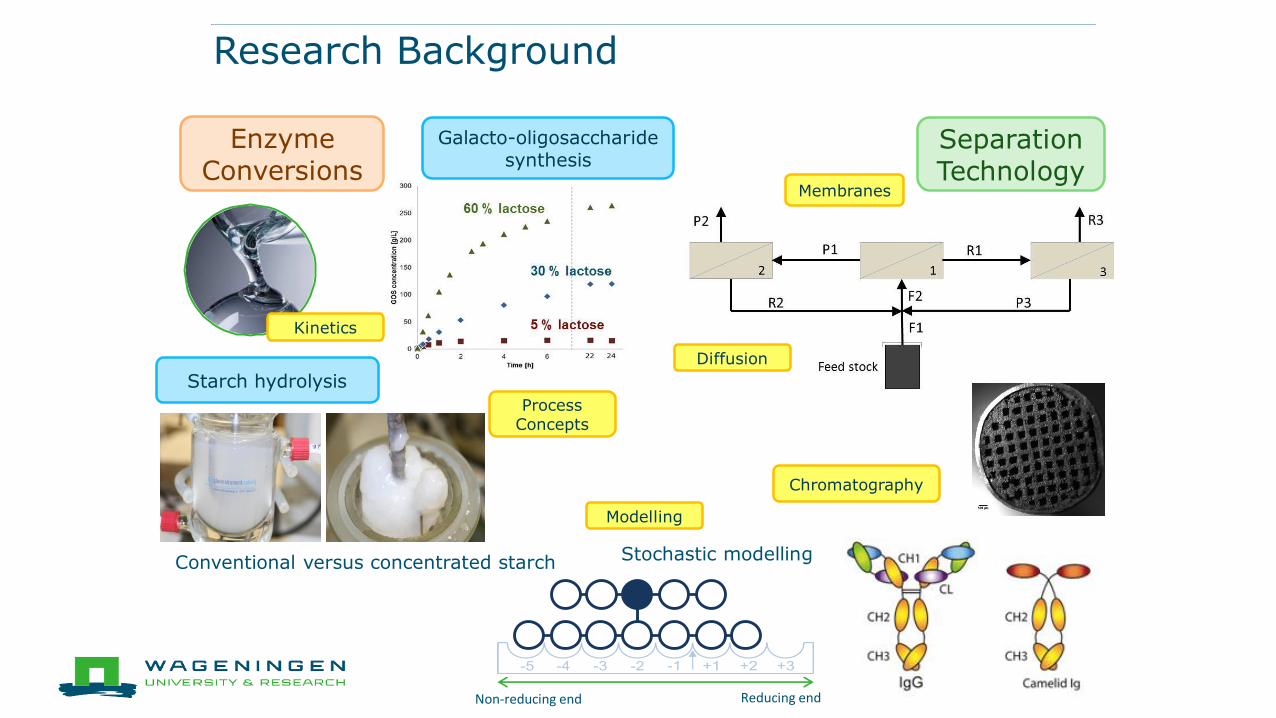
Research Background
Process Concepts
Modelling
Non-reducing end Reducing end
Conventional versus concentrated starch Stochastic modelling
Chromatography
Starch hydrolysis
Galacto-oligosaccharide synthesis
Kinetics
Separation Technology
Membranes
Diffusion
Enzyme Conversions
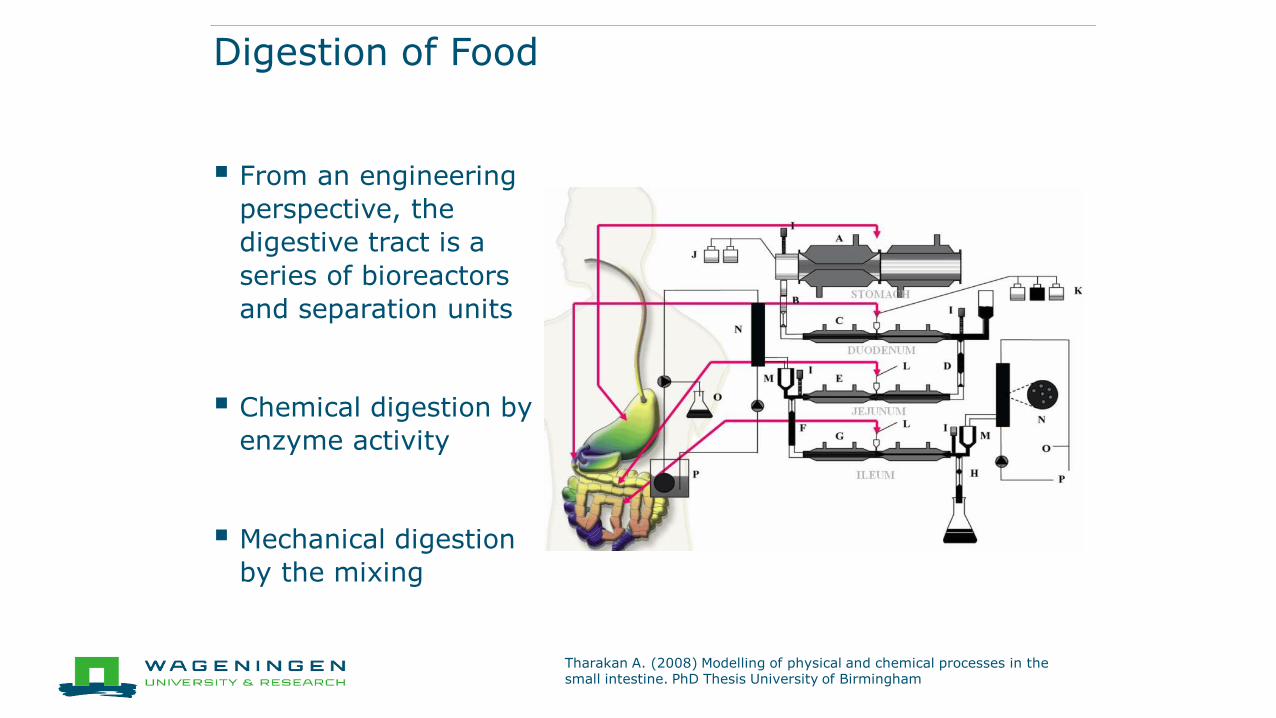
Digestion of Food
From an engineering
perspective, the
digestive tract is a
series of bioreactors
and separation units
Chemical digestion by
enzyme activity
Mechanical digestion
by the mixing
Tharakan A. (2008) Modelling of physical and chemical processes in the small intestine. PhD Thesis University of Birmingham
Research Interests
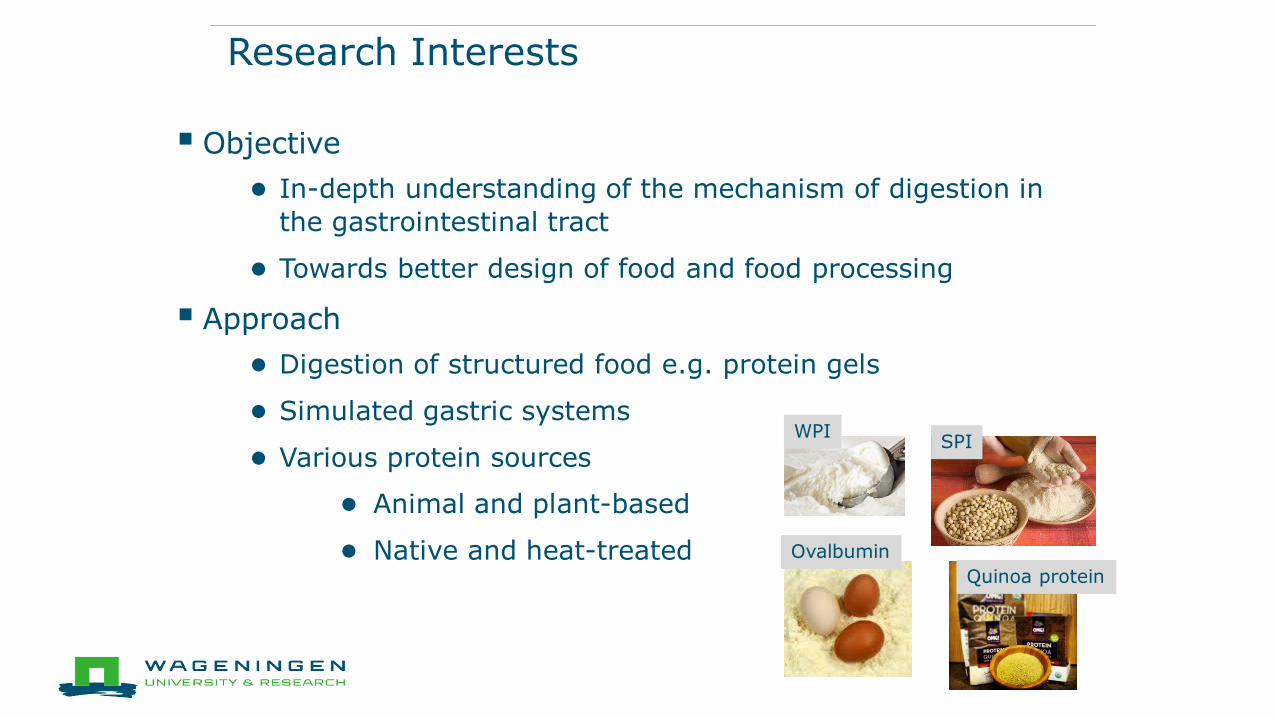
Objective
● In-depth understanding of the mechanism of digestion in
the gastrointestinal tract
● Towards better design of food and food processing
Approach
● Digestion of structured food e.g. protein gels
● Simulated gastric systems
● Various protein sources
● Animal and plant-based
● Native and heat-treated
WPISPI
Ovalbumin
Quinoa protein
-10
0
10
20
30
40
50
60
70
80
90
0 2 4 6
Dry
matt
er
loss (
%)
Time (h)
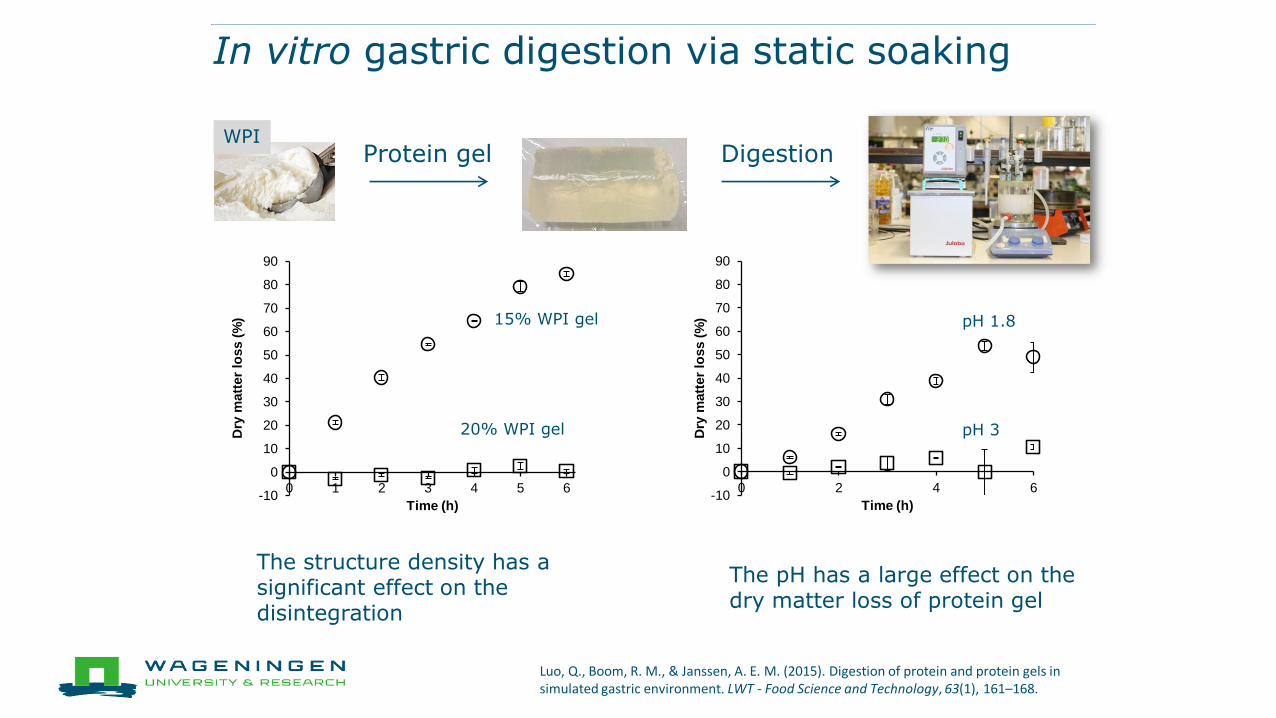
In vitro gastric digestion via static soaking
-10
0
10
20
30
40
50
60
70
80
90
0 1 2 3 4 5 6
Dry
matt
er
loss (
%)
Time (h)
15% WPI gel pH 1.8
Luo, Q., Boom, R. M., & Janssen, A. E. M. (2015). Digestion of protein and protein gels in simulated gastric environment. LWT - Food Science and Technology, 63(1), 161–168.
The structure density has a significant effect on the disintegration
20% WPI gel pH 3
The pH has a large effect on the dry matter loss of protein gel
DigestionProtein gelWPI
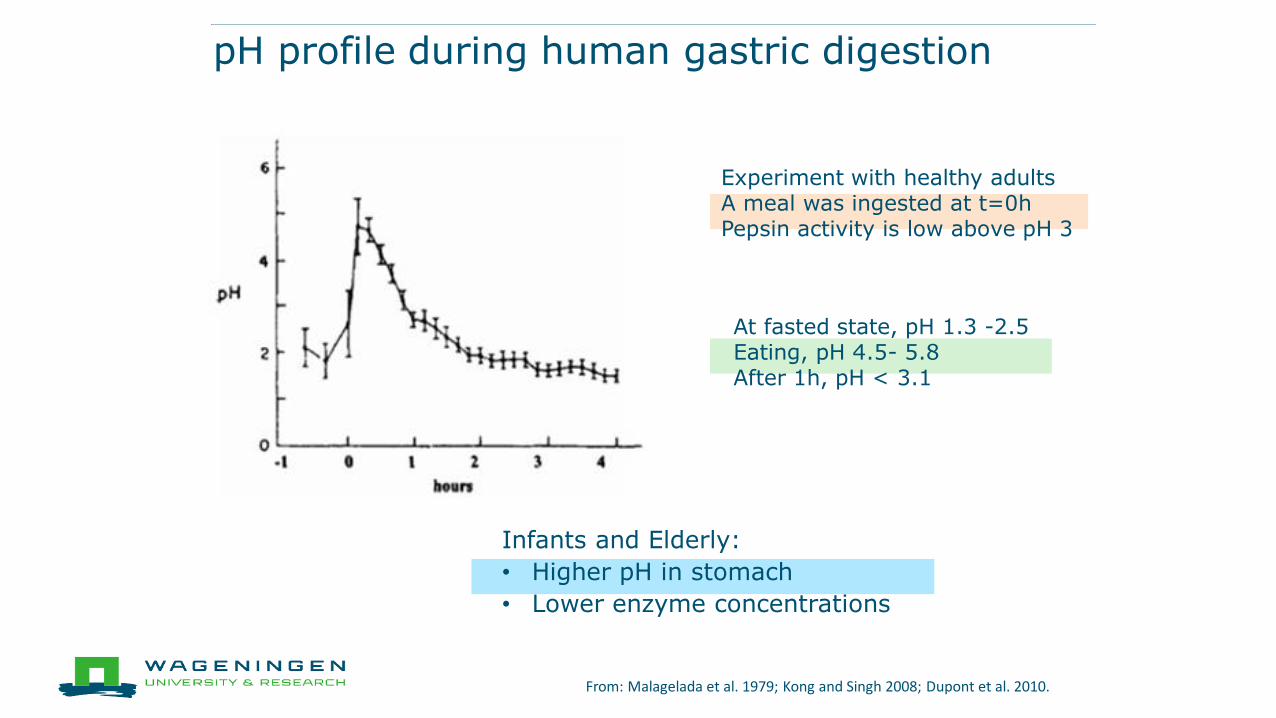
pH profile during human gastric digestion
From: Malagelada et al. 1979; Kong and Singh 2008; Dupont et al. 2010.
At fasted state, pH 1.3 -2.5 Eating, pH 4.5- 5.8After 1h, pH < 3.1
Experiment with healthy adultsA meal was ingested at t=0hPepsin activity is low above pH 3
Infants and Elderly:
• Higher pH in stomach
• Lower enzyme concentrations
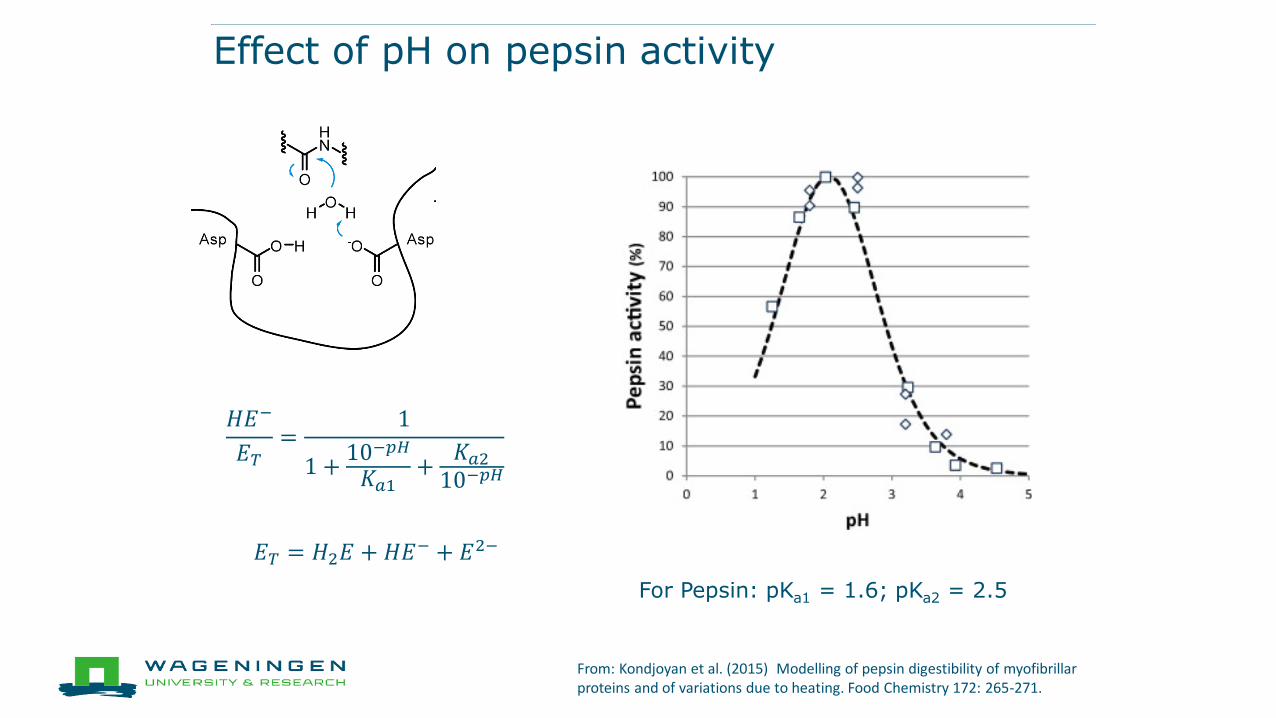
Effect of pH on pepsin activity
From: Kondjoyan et al. (2015) Modelling of pepsin digestibility of myofibrillarproteins and of variations due to heating. Food Chemistry 172: 265-271.
𝐸𝑇 = 𝐻2𝐸 + 𝐻𝐸− + 𝐸2−
𝐻𝐸−
𝐸𝑇=
1
1 +10−𝑝𝐻
𝐾𝑎1+
𝐾𝑎210−𝑝𝐻
For Pepsin: pKa1 = 1.6; pKa2 = 2.5
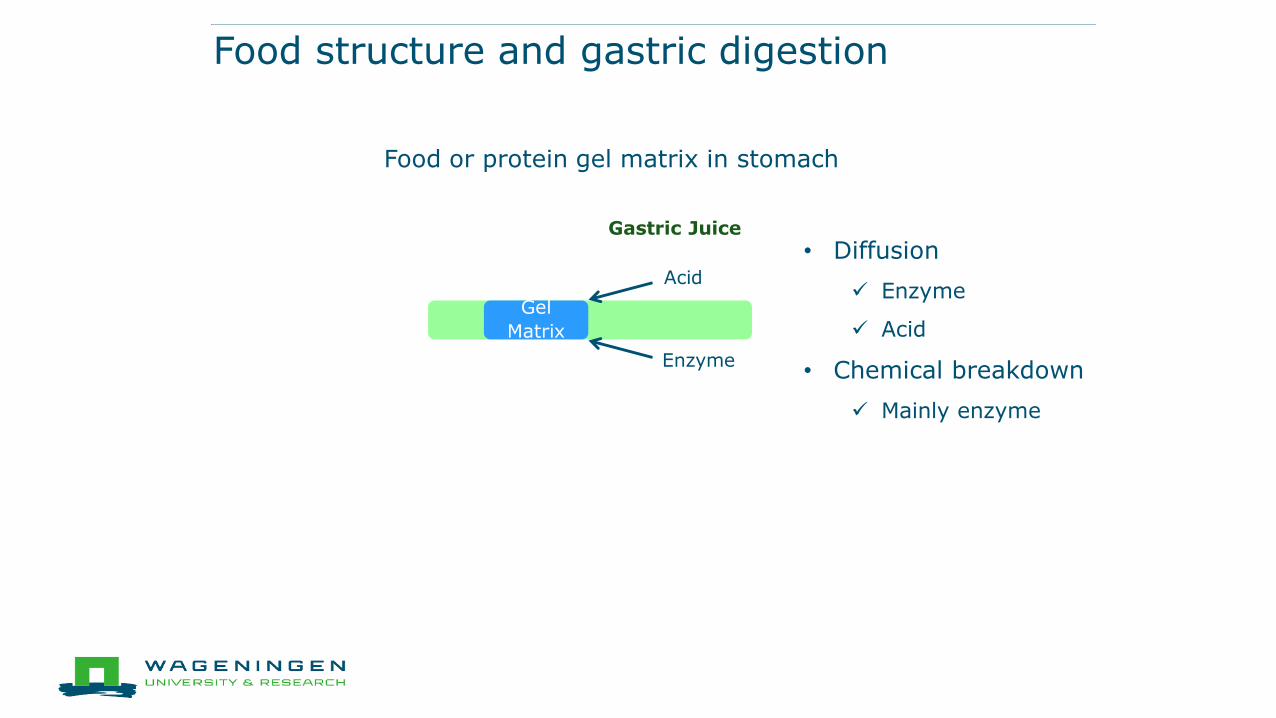
Food structure and gastric digestion
Gastric Juice
Gel
Matrix
Acid
Enzyme
• Diffusion
Enzyme
Acid
• Chemical breakdown
Mainly enzyme
Food or protein gel matrix in stomach
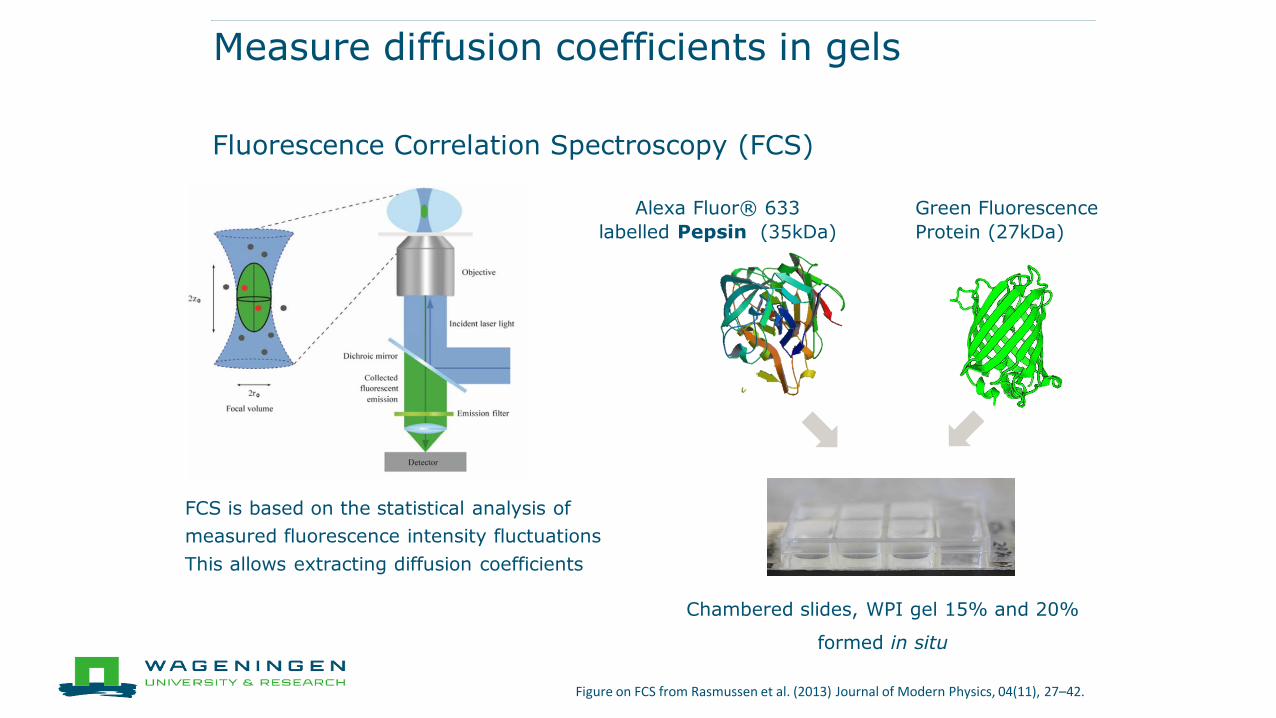
Measure diffusion coefficients in gels
Fluorescence Correlation Spectroscopy (FCS)
Alexa Fluor® 633
labelled Pepsin (35kDa)
Green Fluorescence
Protein (27kDa)
Chambered slides, WPI gel 15% and 20%
formed in situ
Figure on FCS from Rasmussen et al. (2013) Journal of Modern Physics, 04(11), 27–42.
FCS is based on the statistical analysis of
measured fluorescence intensity fluctuations
This allows extracting diffusion coefficients
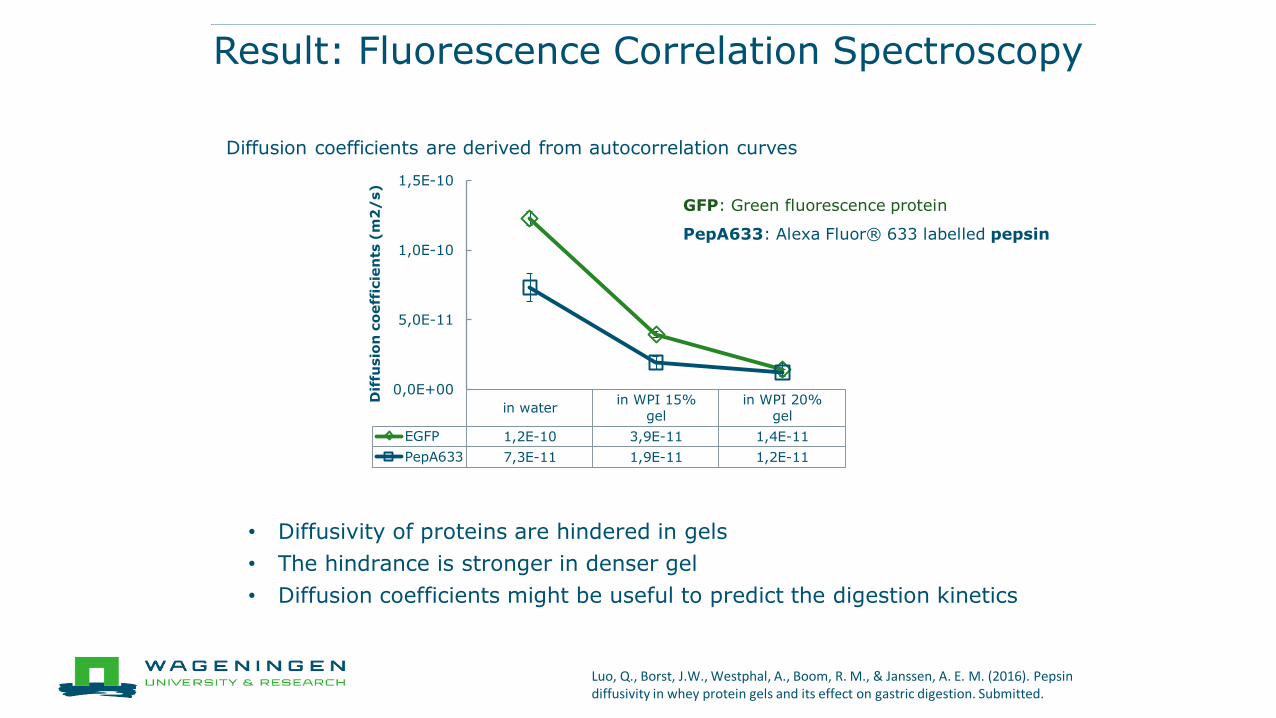
Result: Fluorescence Correlation Spectroscopy
• Diffusivity of proteins are hindered in gels
• The hindrance is stronger in denser gel
• Diffusion coefficients might be useful to predict the digestion kinetics
in waterin WPI 15%
gelin WPI 20%
gel
EGFP 1,2E-10 3,9E-11 1,4E-11
PepA633 7,3E-11 1,9E-11 1,2E-11
0,0E+00
5,0E-11
1,0E-10
1,5E-10
Dif
fusio
n c
oeff
icie
nts
(m
2/
s)
GFP: Green fluorescence protein
PepA633: Alexa Fluor® 633 labelled pepsin
Diffusion coefficients are derived from autocorrelation curves
Luo, Q., Borst, J.W., Westphal, A., Boom, R. M., & Janssen, A. E. M. (2016). Pepsin diffusivity in whey protein gels and its effect on gastric digestion. Submitted.
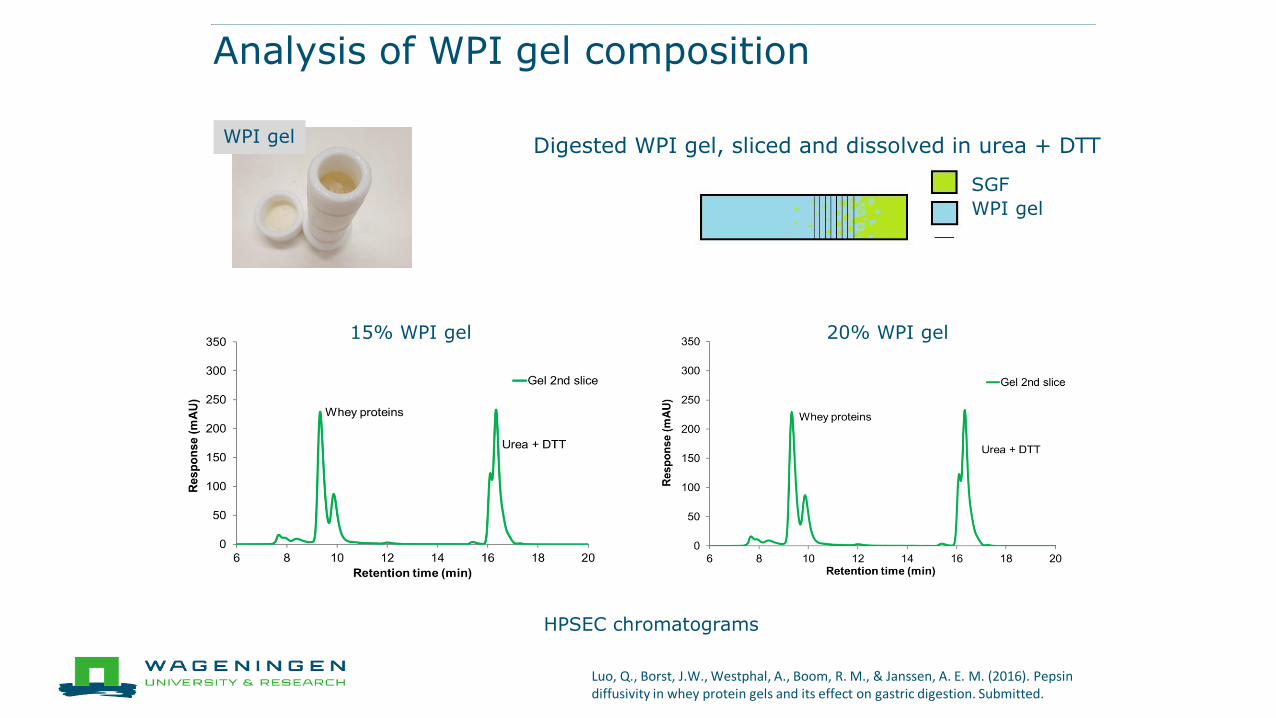
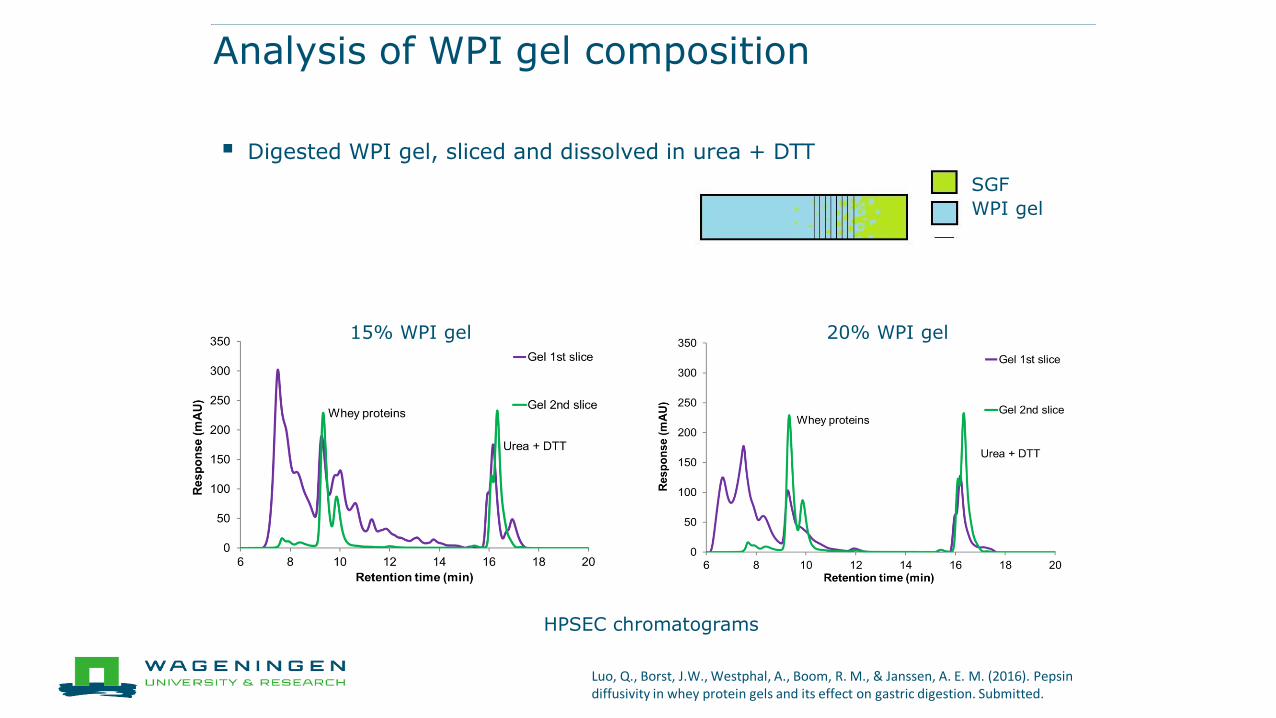
Analysis of WPI gel composition
Digested WPI gel, sliced and dissolved in urea + DTT
SGF
WPI gel
WPI gel
15% WPI gel 20% WPI gel
Luo, Q., Borst, J.W., Westphal, A., Boom, R. M., & Janssen, A. E. M. (2016). Pepsin diffusivity in whey protein gels and its effect on gastric digestion. Submitted.
HPSEC chromatograms
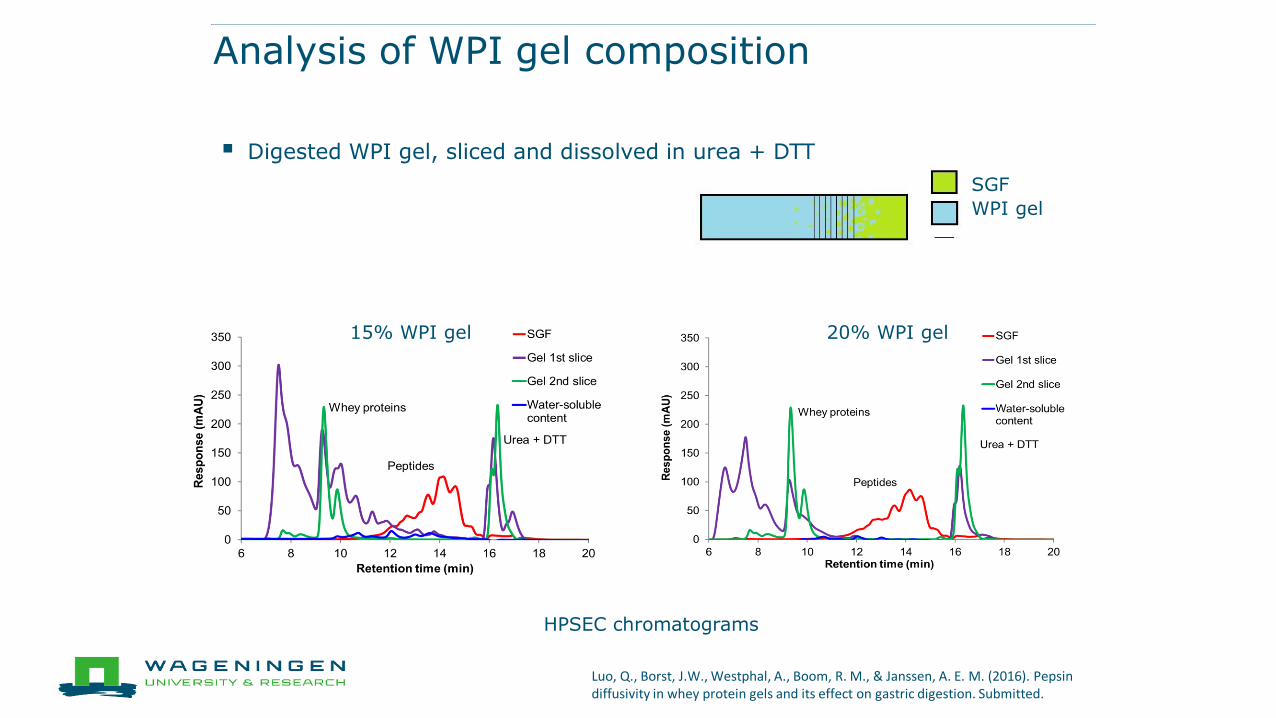
Analysis of WPI gel composition
Digested WPI gel, sliced and dissolved in urea + DTT
SGF
WPI gel
15% WPI gel 20% WPI gel
Luo, Q., Borst, J.W., Westphal, A., Boom, R. M., & Janssen, A. E. M. (2016). Pepsin diffusivity in whey protein gels and its effect on gastric digestion. Submitted.
HPSEC chromatograms
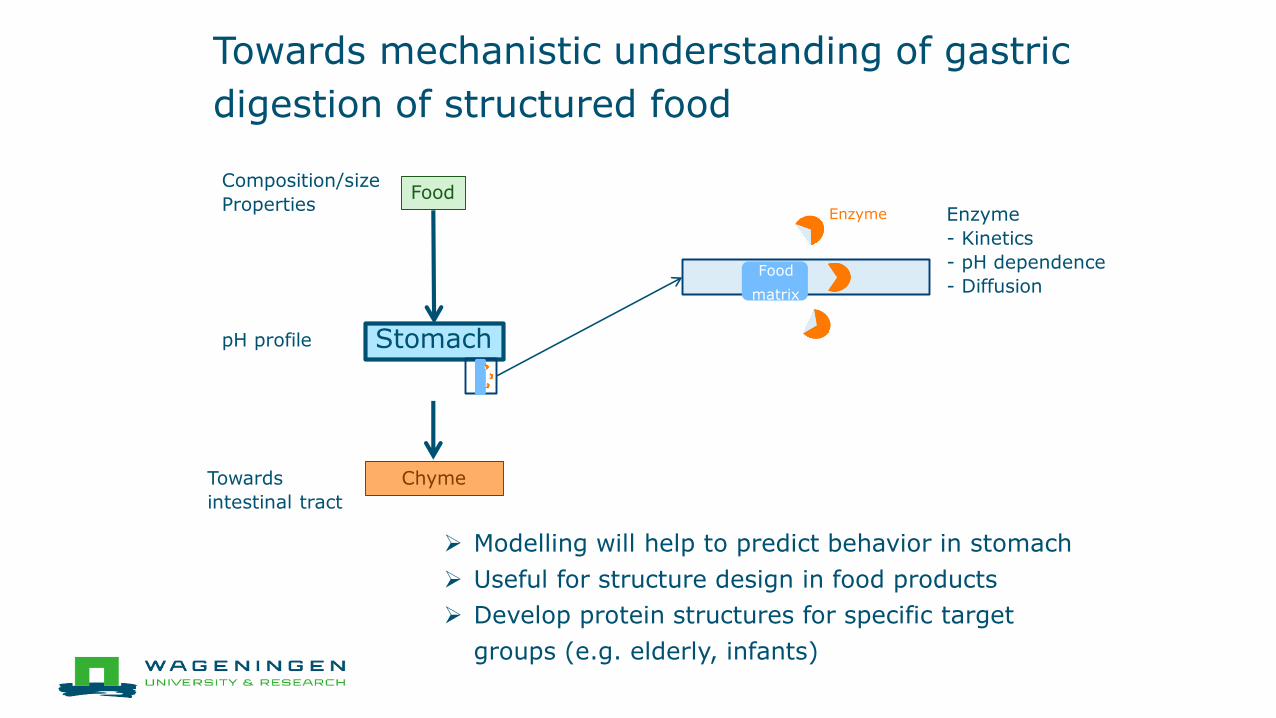
Towards mechanistic understanding of gastric
digestion of structured food
Stomach
Food
Chyme
Composition/size
Properties
pH profile
Towards
intestinal tract
Modelling will help to predict behavior in stomach
Useful for structure design in food products
Develop protein structures for specific target
groups (e.g. elderly, infants)
Enzyme
- Kinetics
- pH dependence
- DiffusionFood
matrix
Enzyme
Contributed by
● Qi Luo, Remko Boom
● Mauricio Opazo Navarette
● Maurice Strubel, Jos Sewalt
● Jan Willem Borst, AdrieWestphal
● BSc and MSc students:
Le Deng, Zhe Huo, Anne de
Swart, Thao Doan, Olga Nikoloudaki, Remko de Lange
DAY 1 Session 1,2,3Session 3
Topic: Topic: The science of proteins (2)
Presentations available:
Alan Mackie
Sergio Salazar-Villanea
Tetske Hulshof
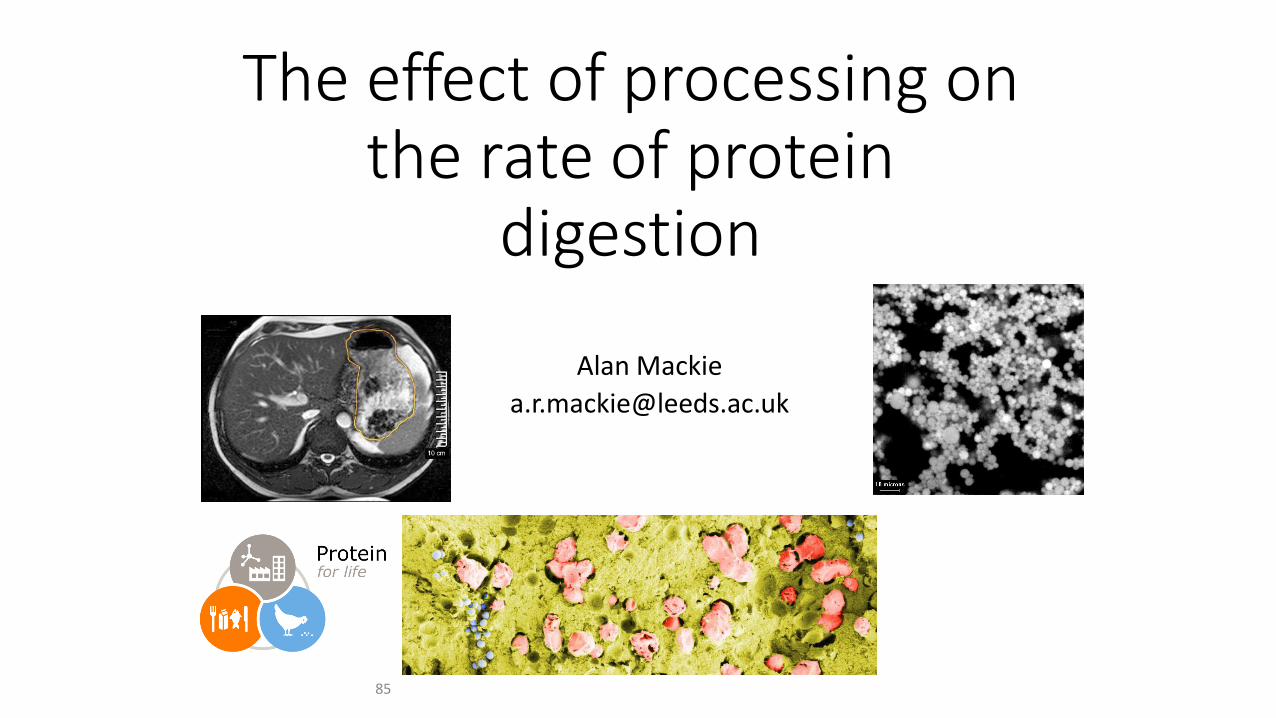
Alan Mackie
• The effect of processing on the rate of protein digestion
The effect of processing on the rates of protein digestion
• Introduction
• Processing and structure
• Behaviour in the stomach
• In vitro modelling of digestion
• Limiting hydrolysis
• The use of protein crosslinking
• Potential for the future
12/12/201686
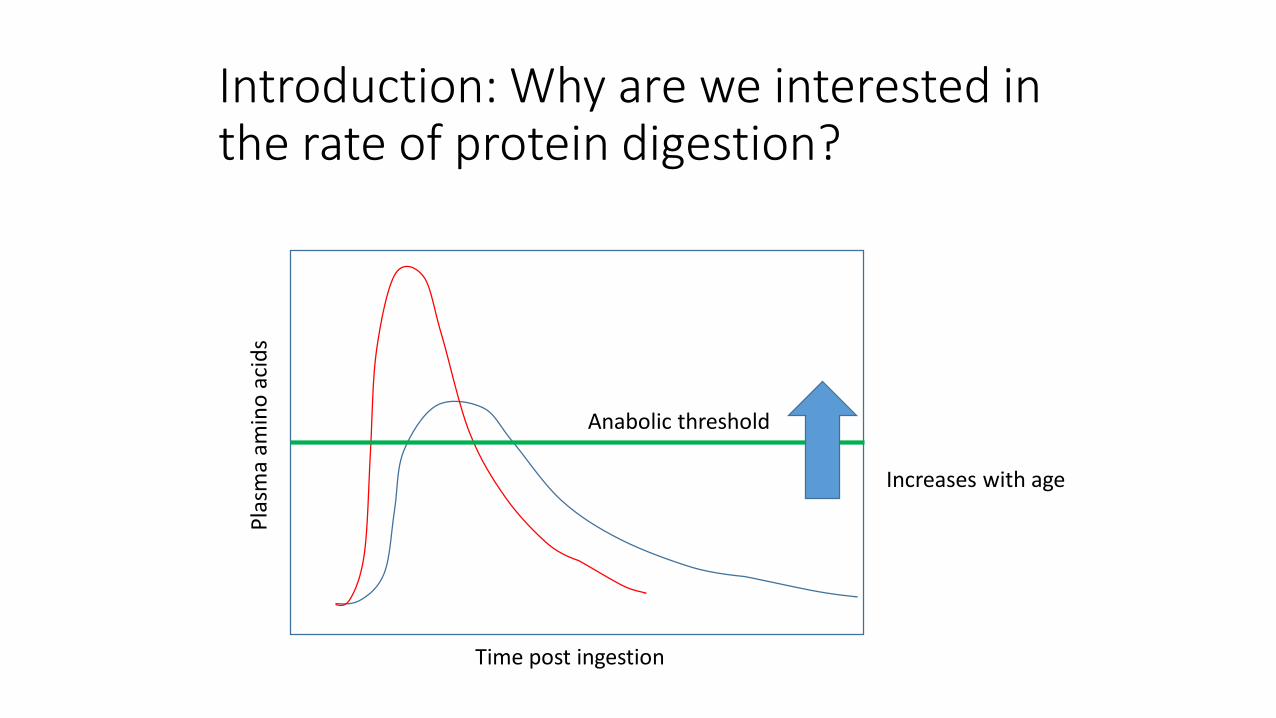
Introduction: Why are we interested in the rate of protein digestion?
Anabolic threshold
Increases with age
Time post ingestion
Pla
sma
amin
o a
cid
s
Introduction: Why are we interested in the rate of protein digestion? Bioactive peptides
• Consumed orally as part of the diet
• Produced as part of gastrointestinal hydrolysis
• Many hundreds have been shown to have “activity”
• Few can reach the site of action in the concentrations needed to show an effect.
• Can diet be manipulated to improve delivery?
12/12/2016 88
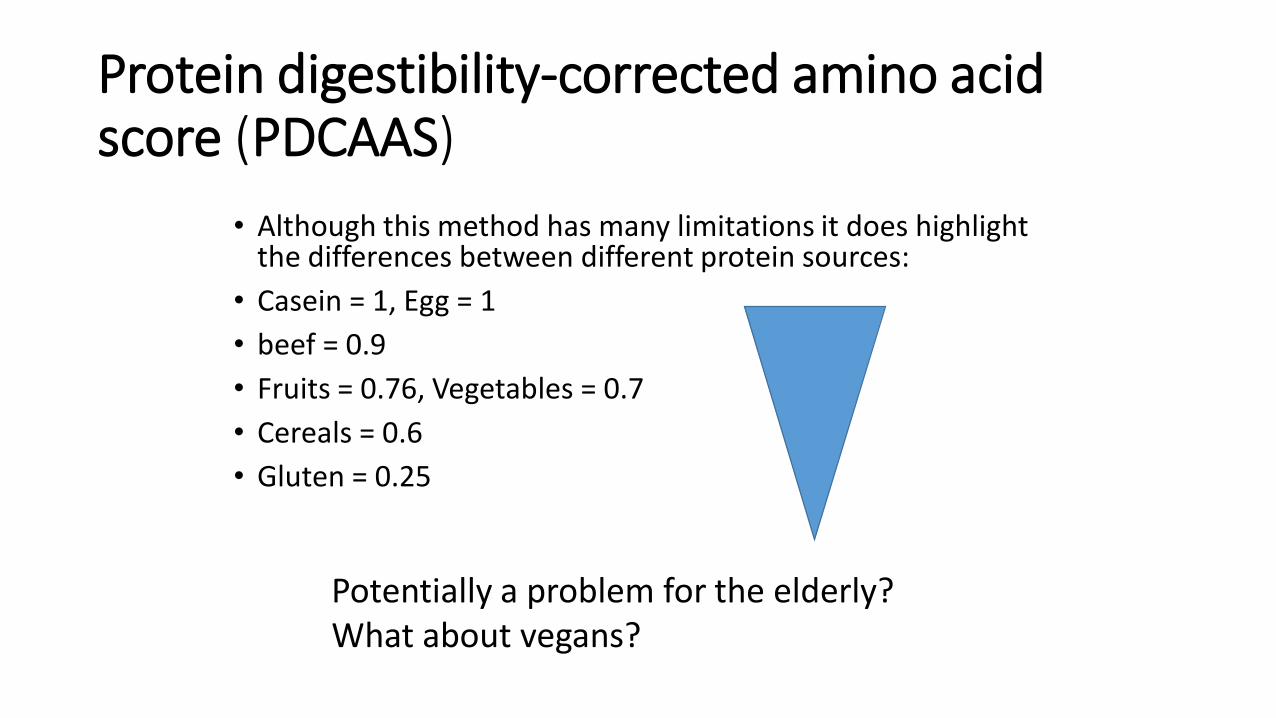
Protein digestibility-corrected amino acid score (PDCAAS)
• Although this method has many limitations it does highlight the differences between different protein sources:
• Casein = 1, Egg = 1
• beef = 0.9
• Fruits = 0.76, Vegetables = 0.7
• Cereals = 0.6
• Gluten = 0.25
Potentially a problem for the elderly? What about vegans?
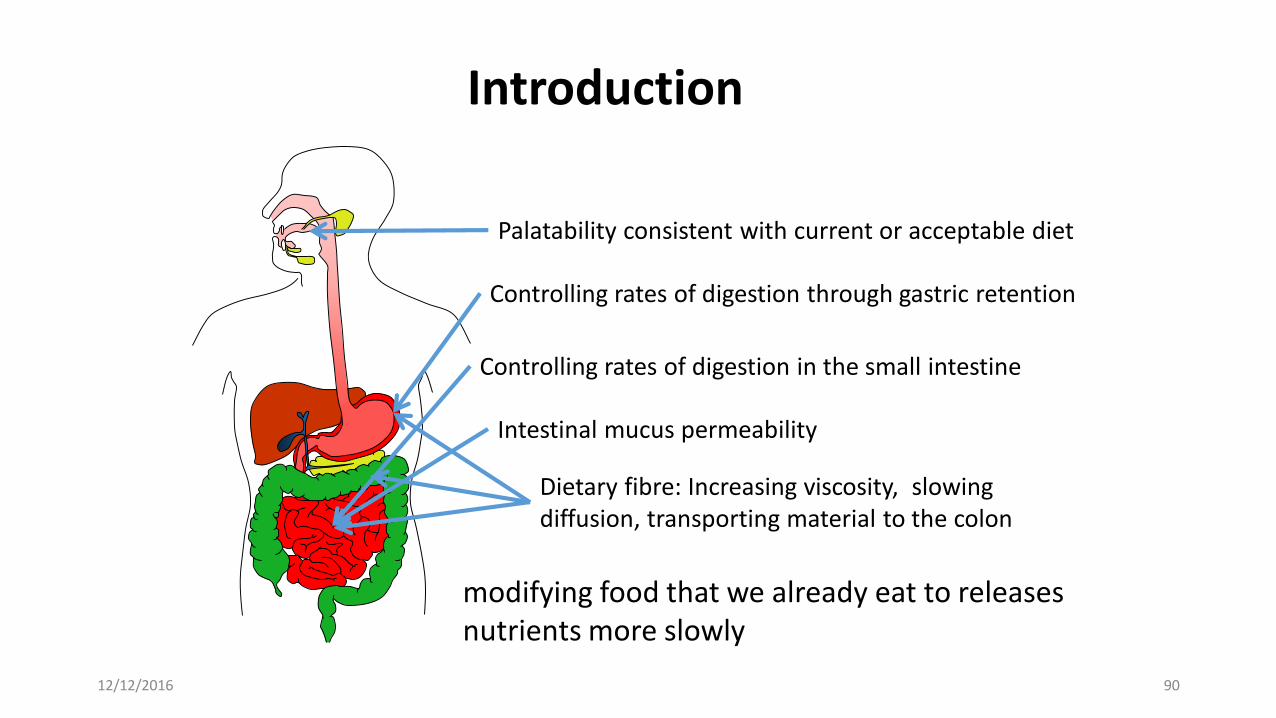
Introduction
Palatability consistent with current or acceptable diet
Controlling rates of digestion through gastric retention
Intestinal mucus permeability
Dietary fibre: Increasing viscosity, slowing diffusion, transporting material to the colon
modifying food that we already eat to releases nutrients more slowly
Controlling rates of digestion in the small intestine
12/12/2016 90
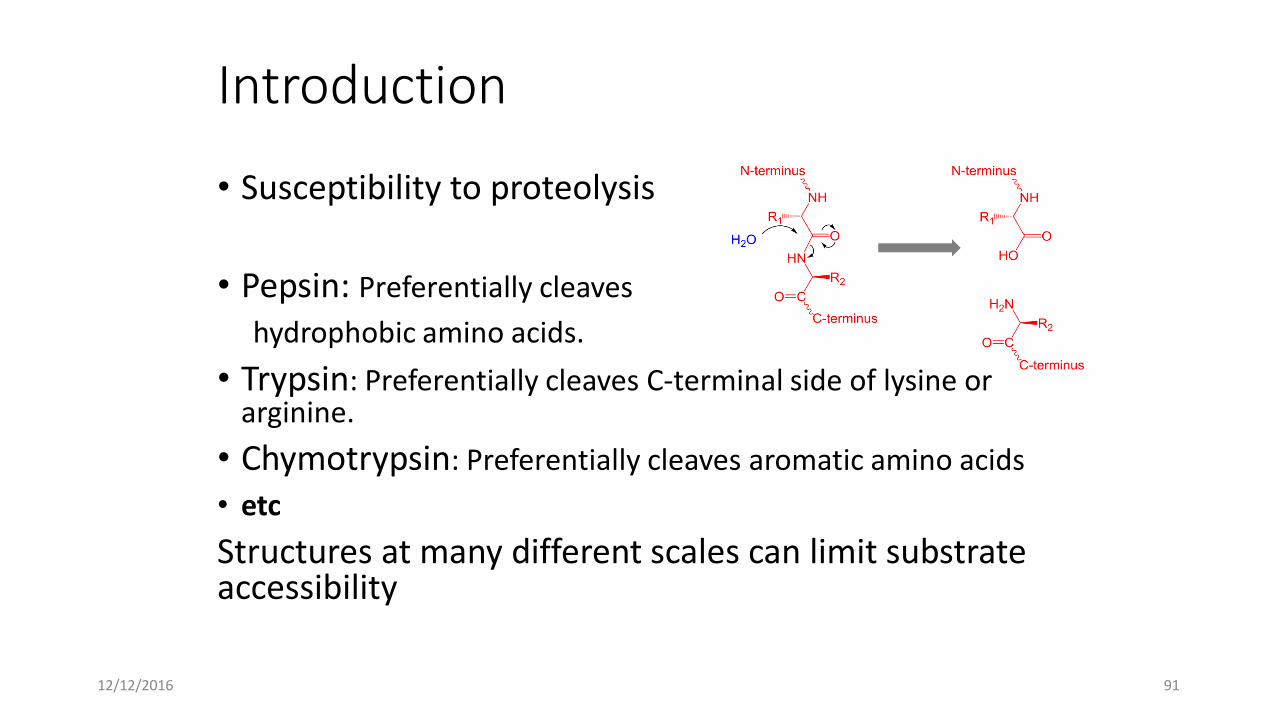
Introduction
• Susceptibility to proteolysis
• Pepsin: Preferentially cleaves
hydrophobic amino acids.
• Trypsin: Preferentially cleaves C-terminal side of lysine or arginine.
• Chymotrypsin: Preferentially cleaves aromatic amino acids
• etc
Structures at many different scales can limit substrate accessibility
12/12/2016 91
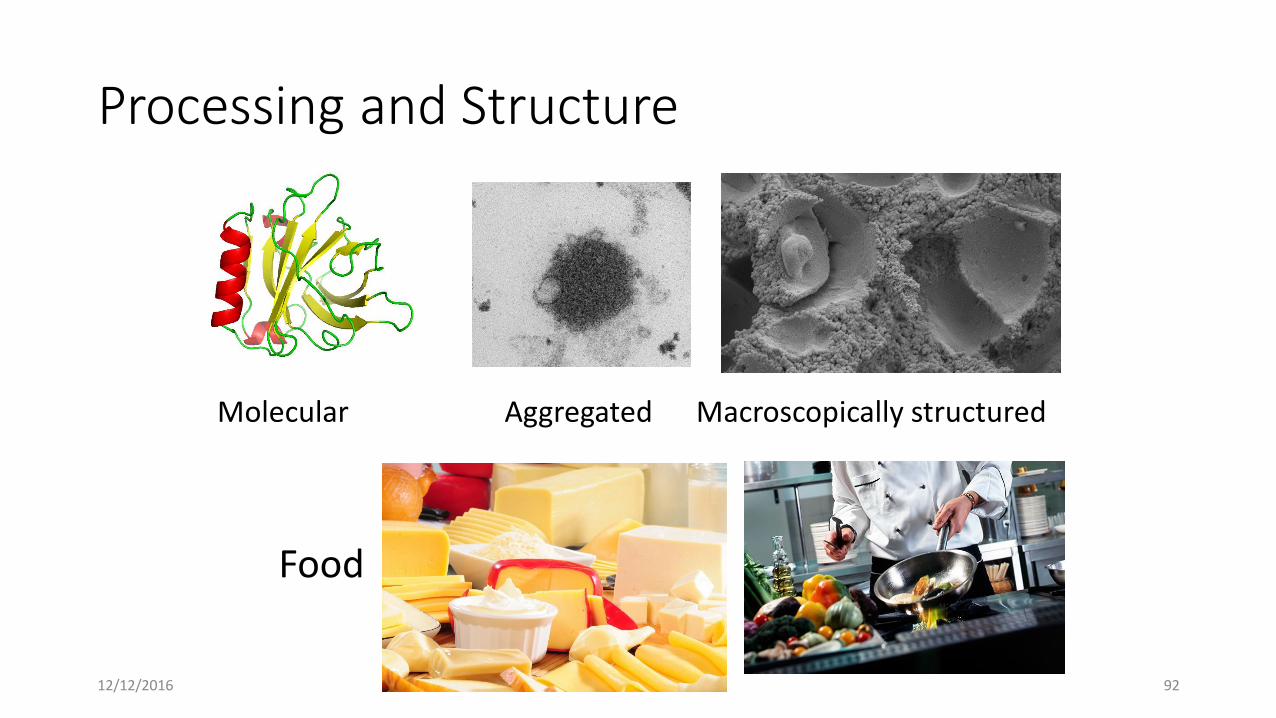
Processing and Structure
Molecular Aggregated Macroscopically structured
Food
12/12/2016 92
Processing and Structure1. Secondary and tertiary structure2. Thermal processing -> impact on 13. Micro / nano-particulation4. Glycation or crosslinking5. Complexation with: ions, lipids, polyphenols, biopolymers, etc6. Encapsulation in artificial or natural structures
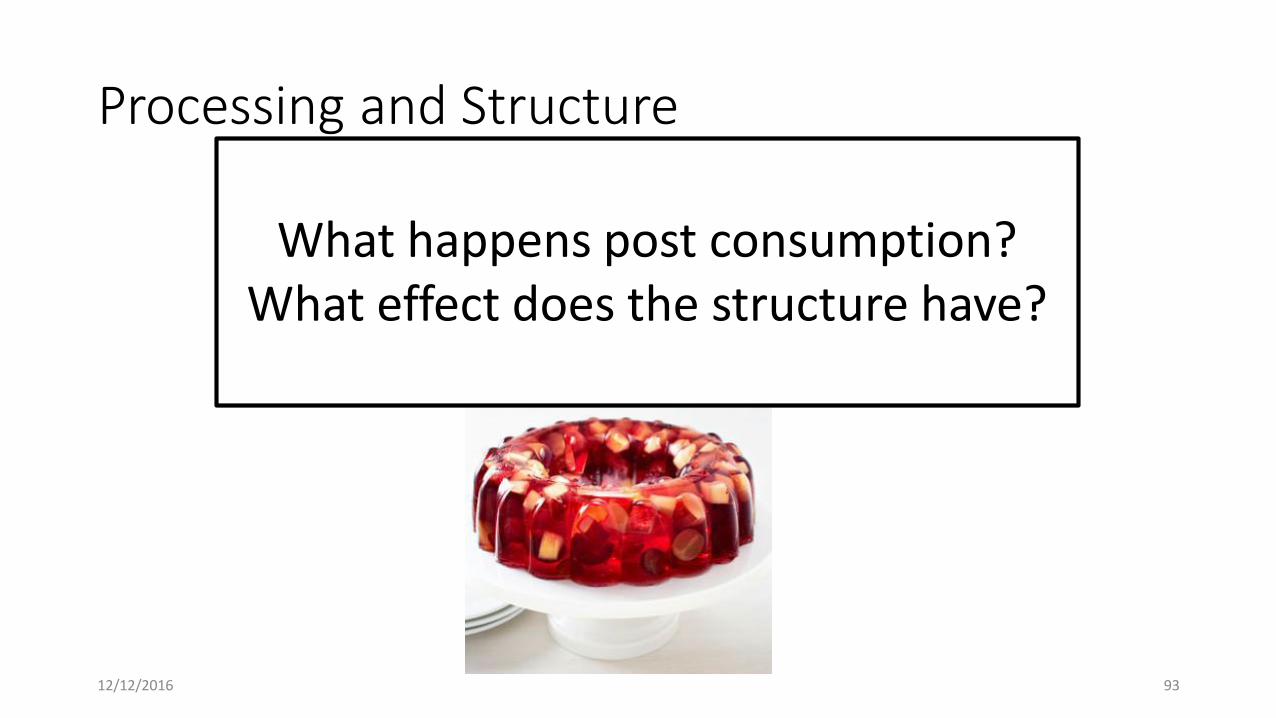
What happens post consumption?What effect does the structure have?
12/12/2016 93
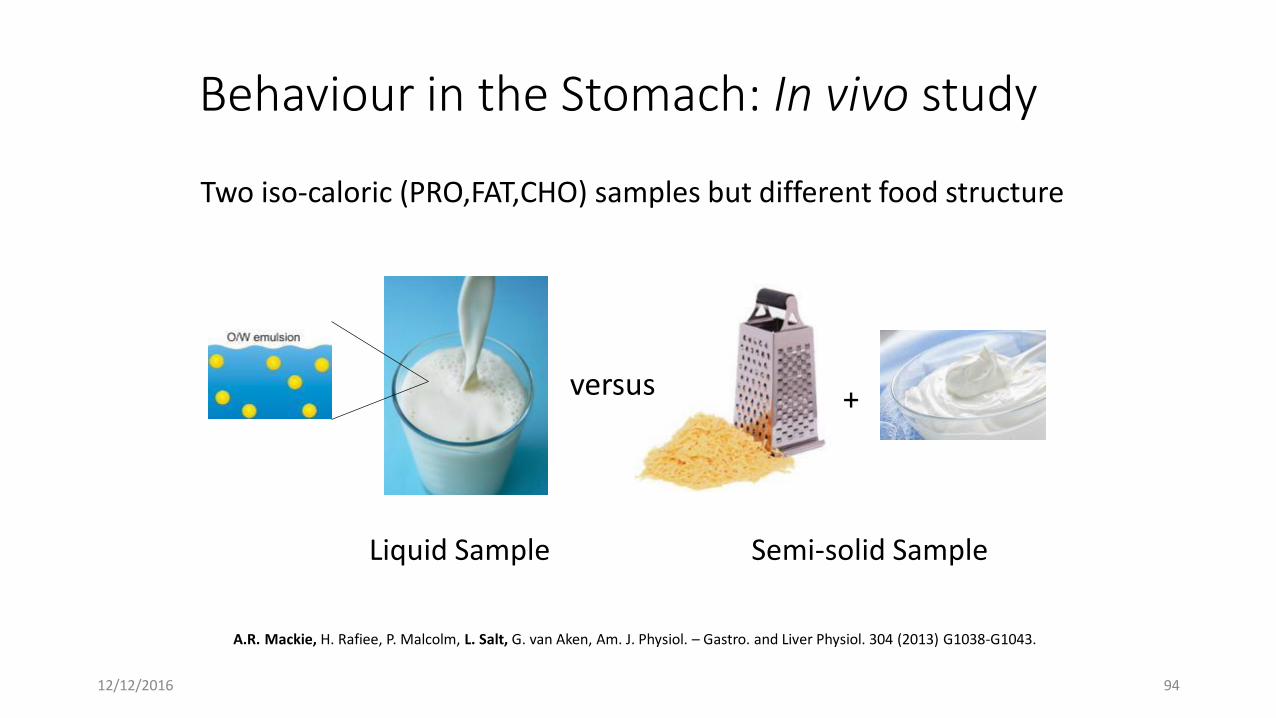
Liquid Sample Semi-solid Sample
Two iso-caloric (PRO,FAT,CHO) samples but different food structure
Behaviour in the Stomach: In vivo study
versus +
A.R. Mackie, H. Rafiee, P. Malcolm, L. Salt, G. van Aken, Am. J. Physiol. – Gastro. and Liver Physiol. 304 (2013) G1038-G1043.
12/12/2016 94
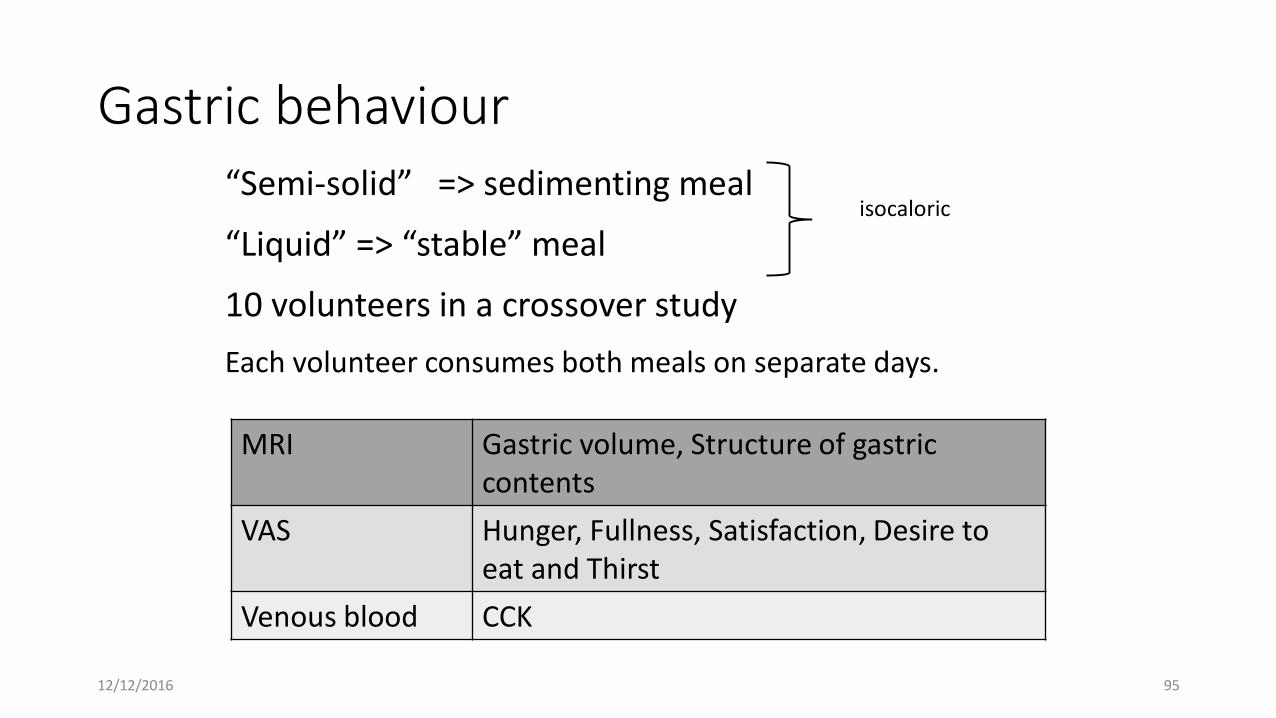
Gastric behaviour“Semi-solid” => sedimenting meal
“Liquid” => “stable” meal
10 volunteers in a crossover study
Each volunteer consumes both meals on separate days.
isocaloric
MRI Gastric volume, Structure of gastric contents
VAS Hunger, Fullness, Satisfaction, Desire to eat and Thirst
Venous blood CCK
12/12/2016 95
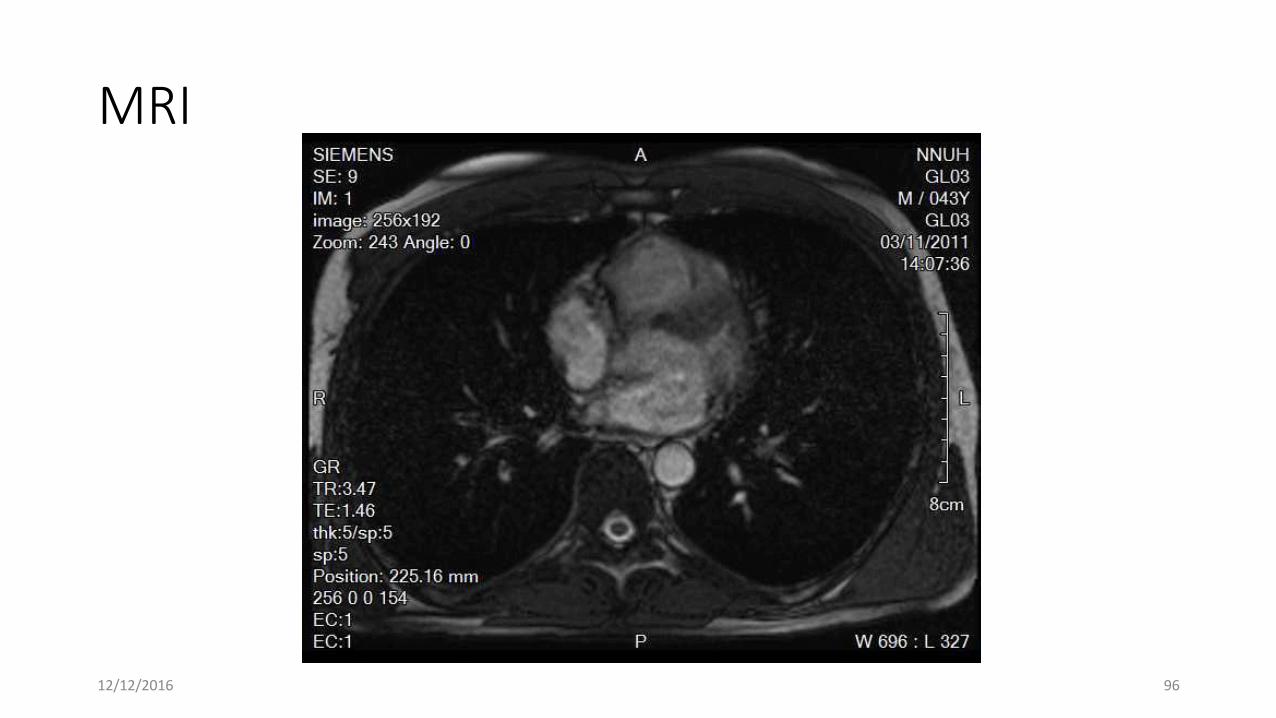
MRI
12/12/2016 96
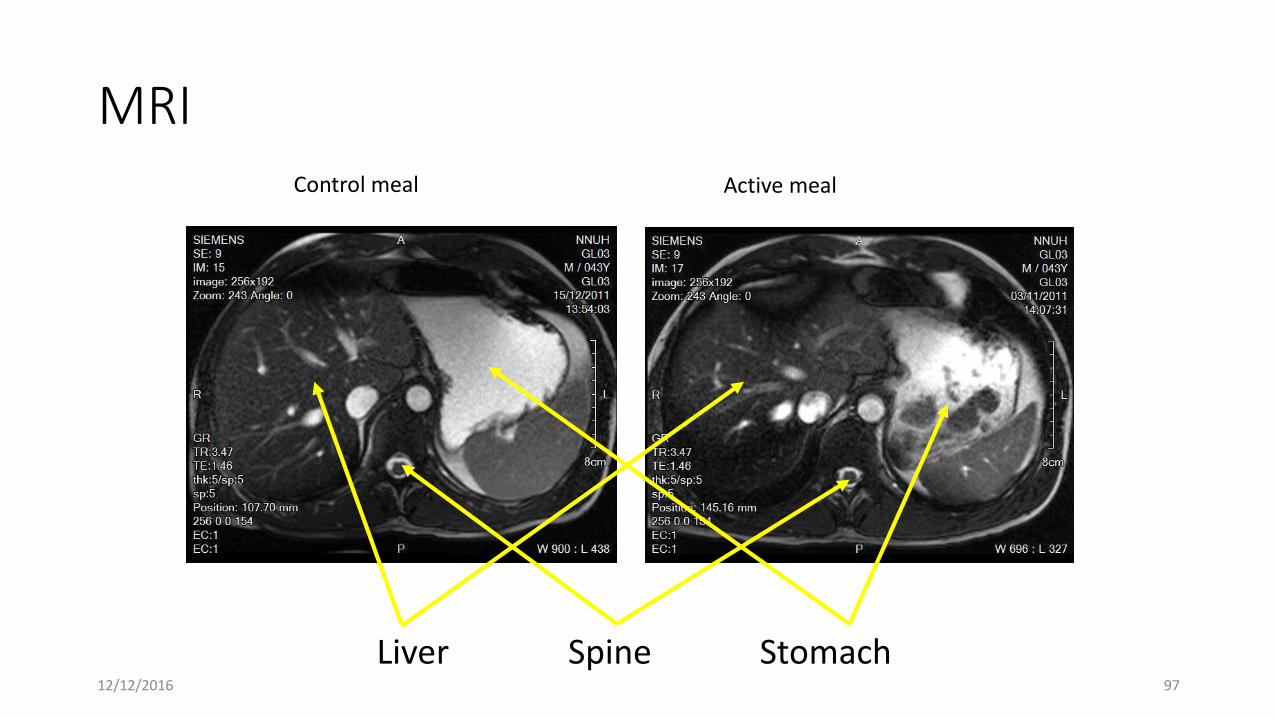
MRIControl meal Active meal
Liver Spine Stomach12/12/2016 97
0
50
100
150
200
250
300
350
400
450
-50 0 50 100 150 200 250
Vo
lum
e (
ml)
Time after meal (minutes)
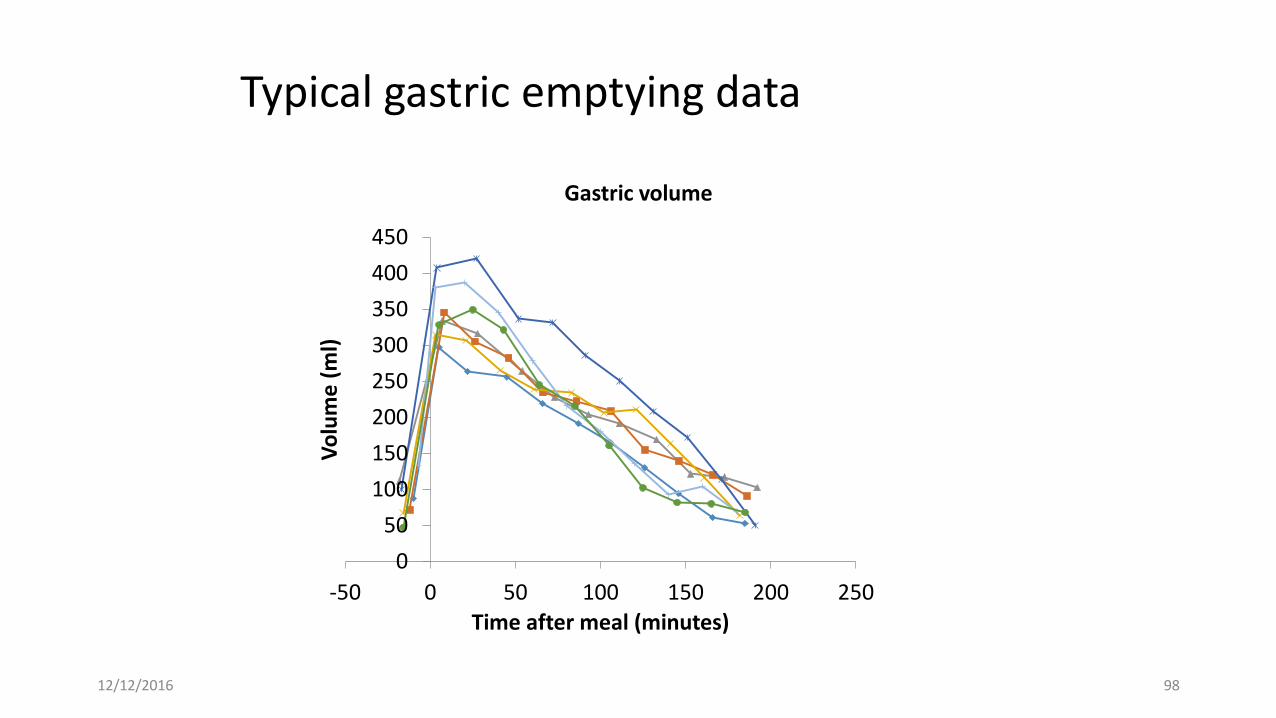
Gastric volume
Typical gastric emptying data
12/12/2016 98
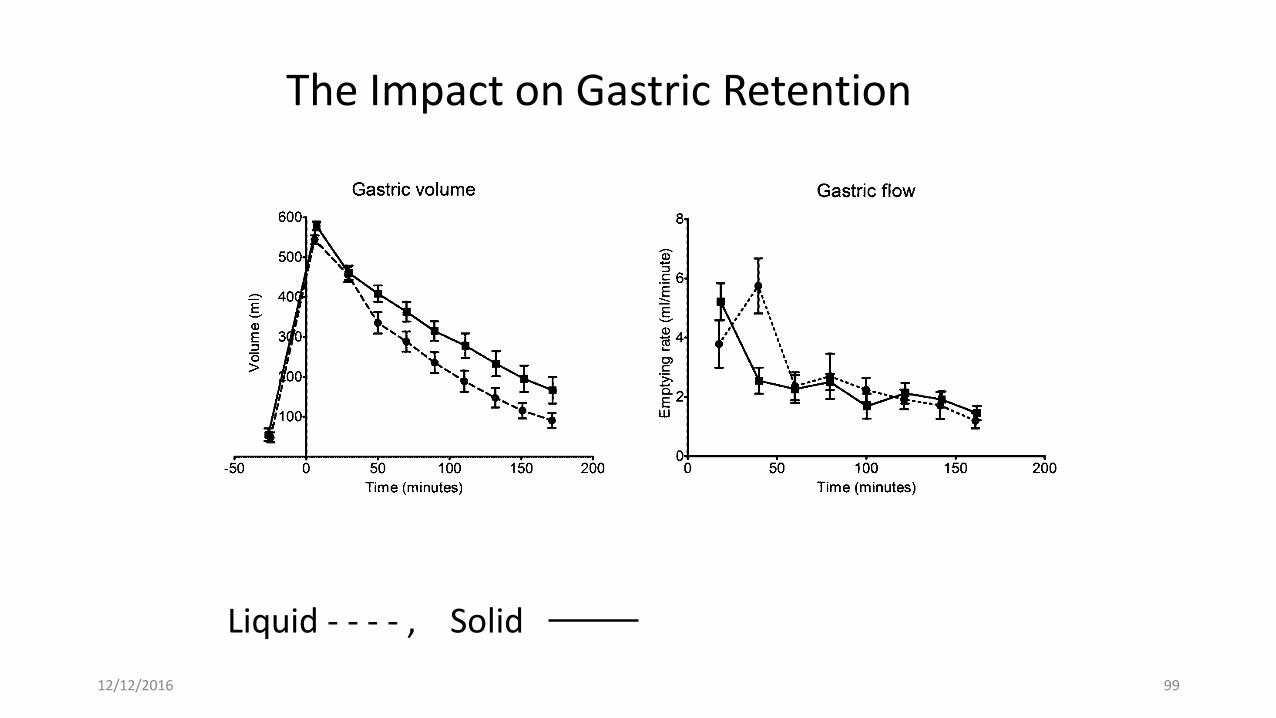
Examples of real data (GRT)The Impact on Gastric Retention
Liquid - - - - , Solid
12/12/2016 99
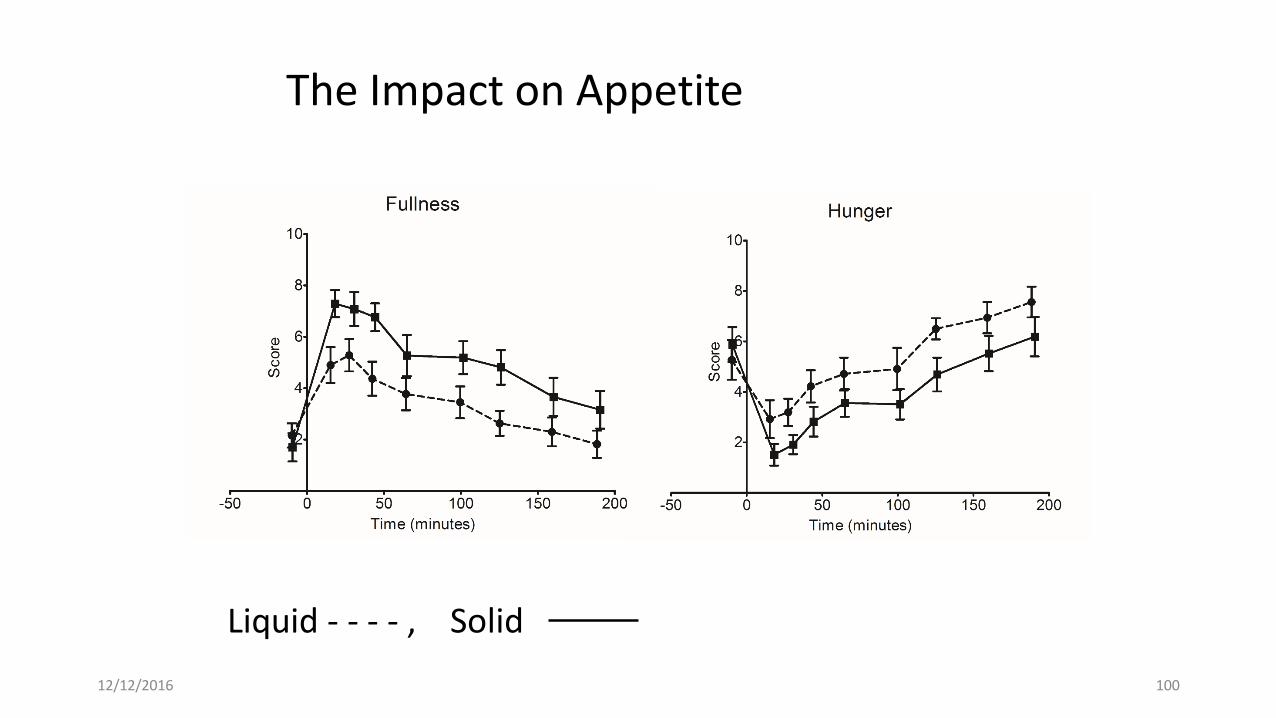
Examples of real data (VAS)
Liquid - - - - , Solid
The Impact on Appetite
12/12/2016 100
In Vitro Modelling of Digestion
• Using an appropriate simulation of GI tract functionality
• Accessing samples for multi-scale characterisation
• Determining:• The composition of chime
• Rates of digestion
• Bioaccessibility of nutrients
• Correlating data with physiological responses
12/12/2016 101
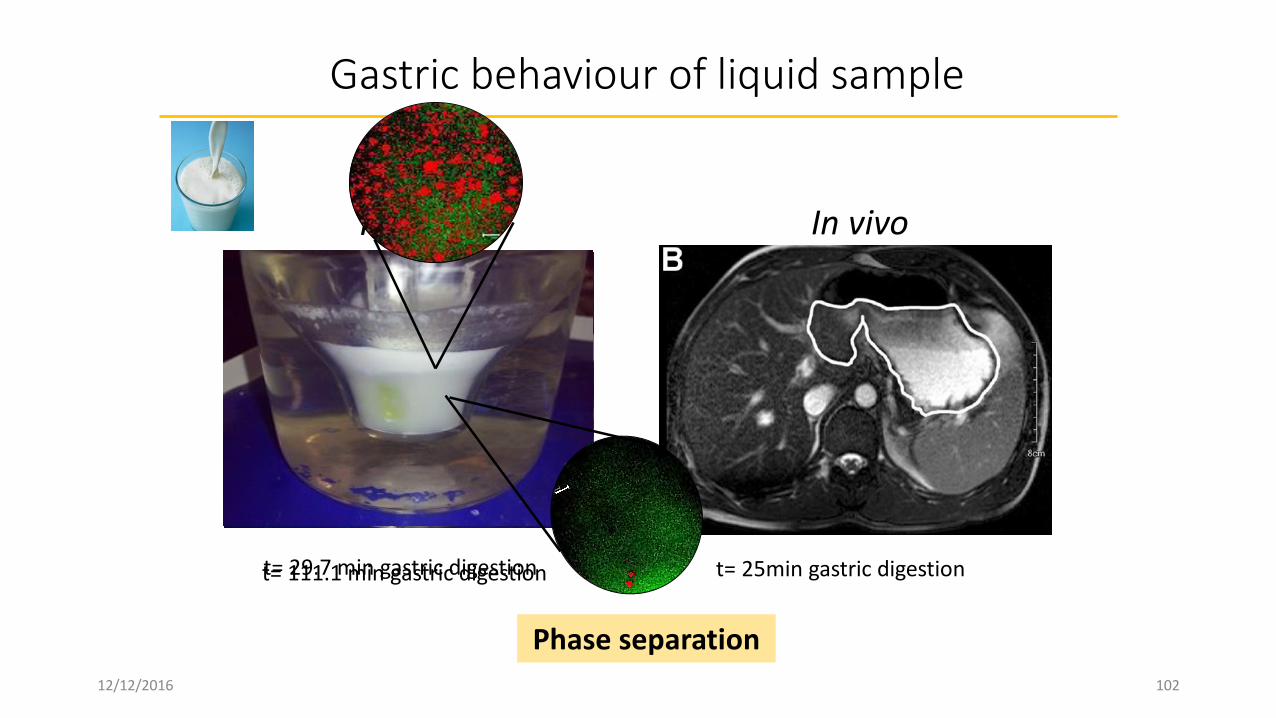
Gastric behaviour of liquid sample
t= 29.7 min gastric digestion t= 25min gastric digestion
In vitro In vivo
t= 111.1 min gastric digestion
Phase separation
12/12/2016 102
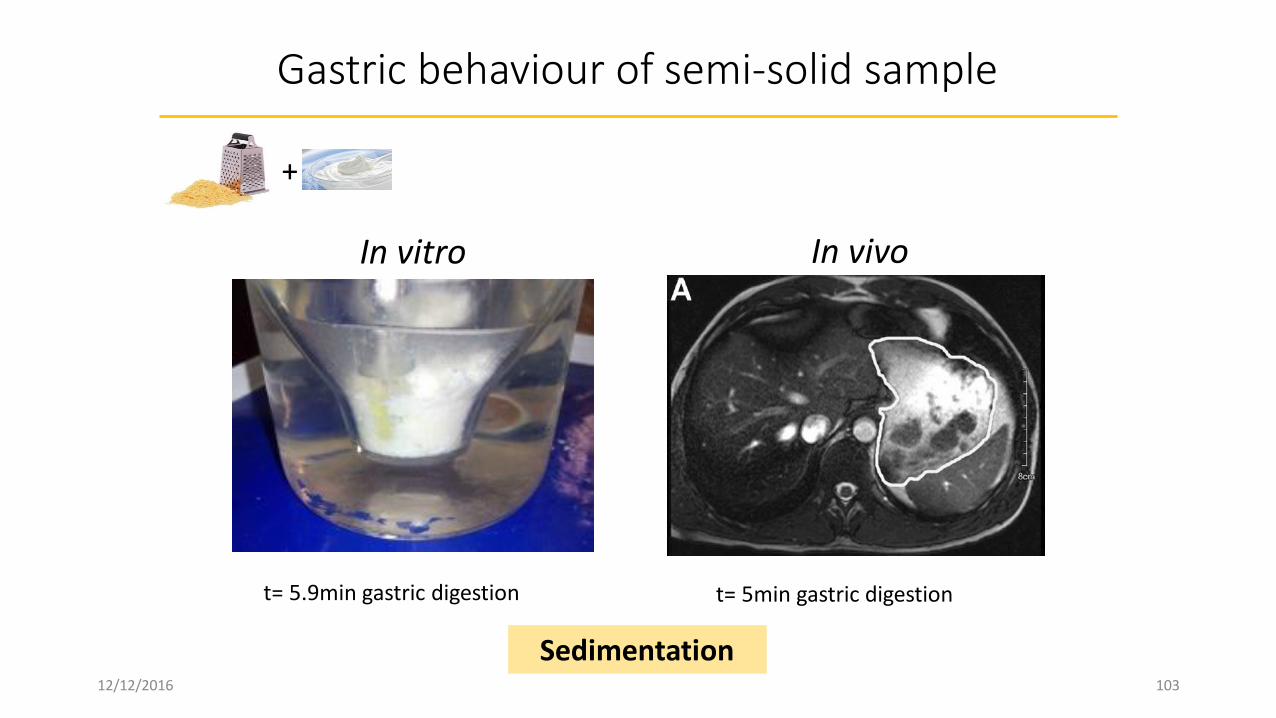
Gastric behaviour of semi-solid sample
t= 5.9min gastric digestion t= 5min gastric digestion
In vitro In vivo
+
Sedimentation12/12/2016 103
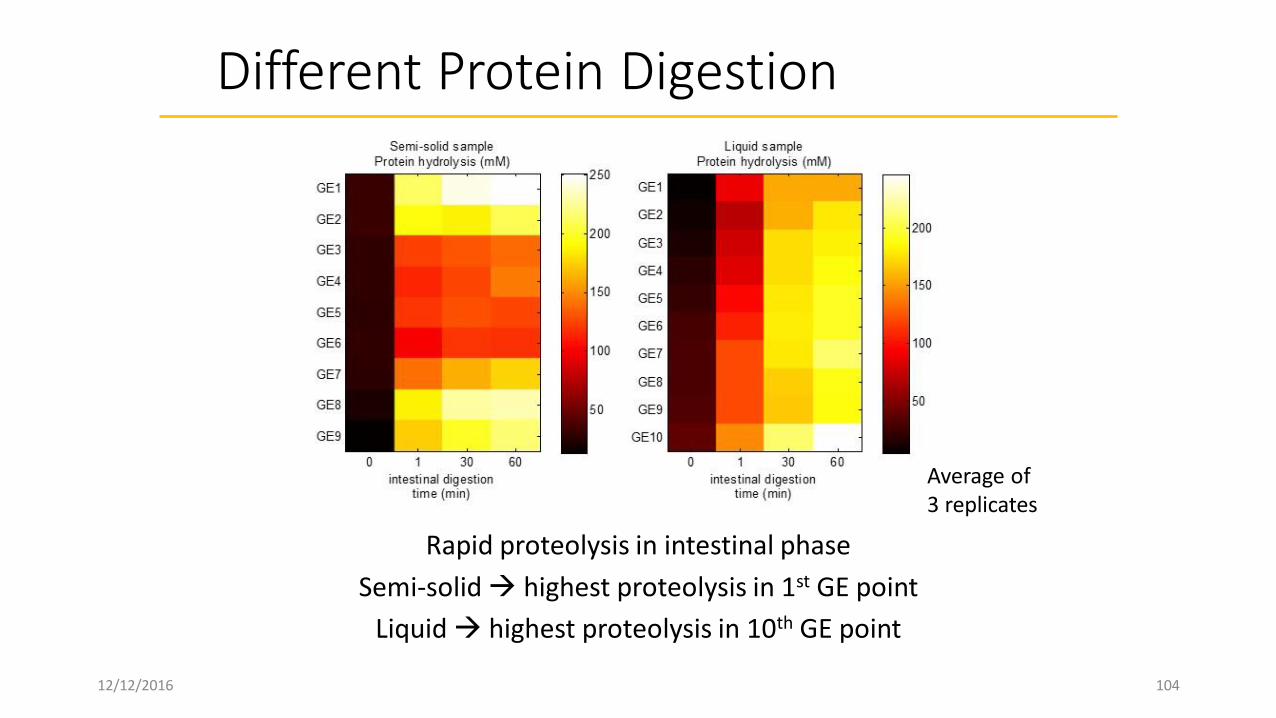
Different Protein Digestion
Rapid proteolysis in intestinal phase
Semi-solid highest proteolysis in 1st GE point
Liquid highest proteolysis in 10th GE point
Average of 3 replicates
12/12/2016 104
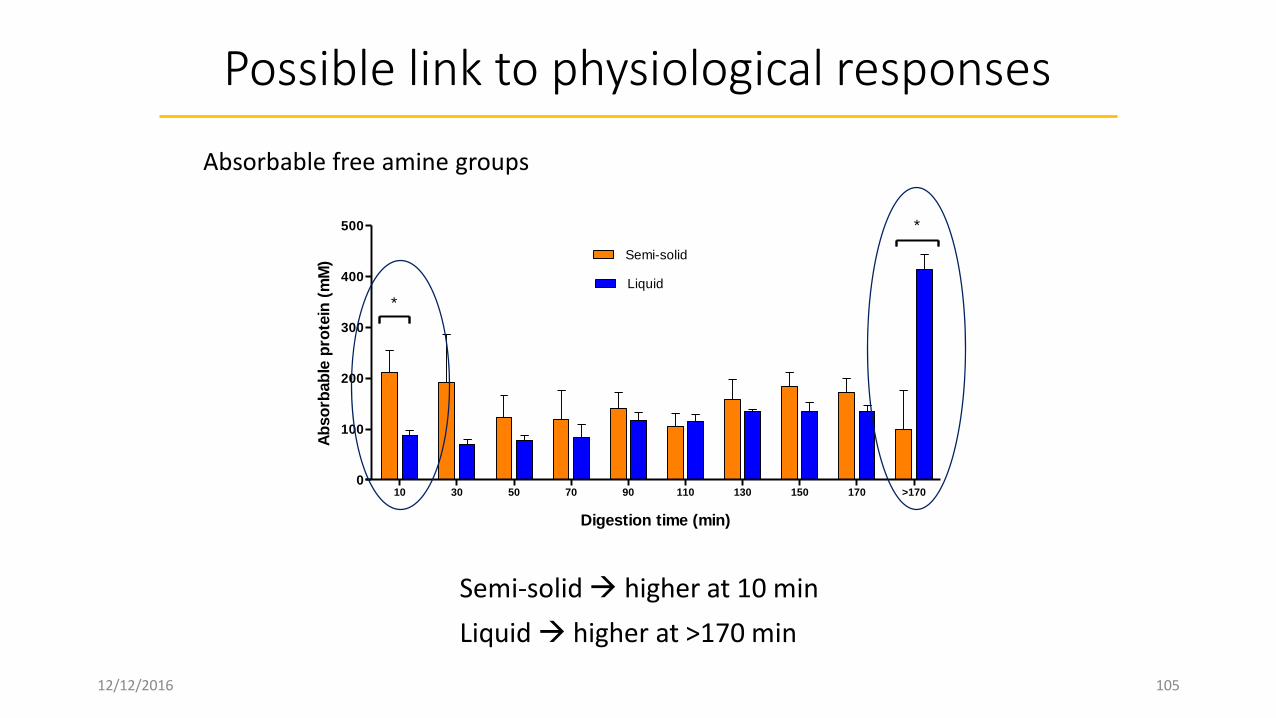
Possible link to physiological responses
Digestion time (min)
Ab
so
rbab
le p
rote
in (
mM
)
10 30 50 70 90 110 130 150 170 >1700
100
200
300
400
500
Semi-solid
Liquid
*
*
Absorbable free amine groups
Semi-solid higher at 10 min
Liquid higher at >170 min
12/12/2016 105
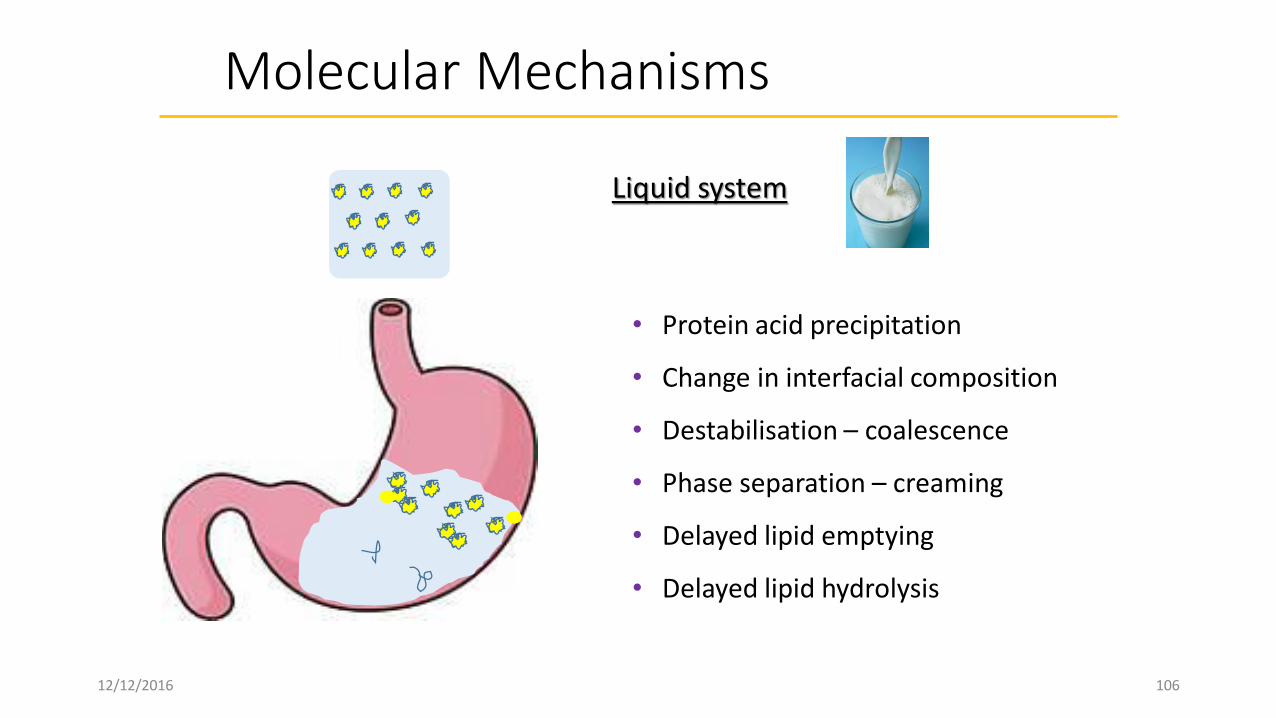
Molecular Mechanisms
• Protein acid precipitation
• Change in interfacial composition
• Destabilisation – coalescence
• Phase separation – creaming
• Delayed lipid emptying
• Delayed lipid hydrolysis
Liquid system
12/12/2016 106
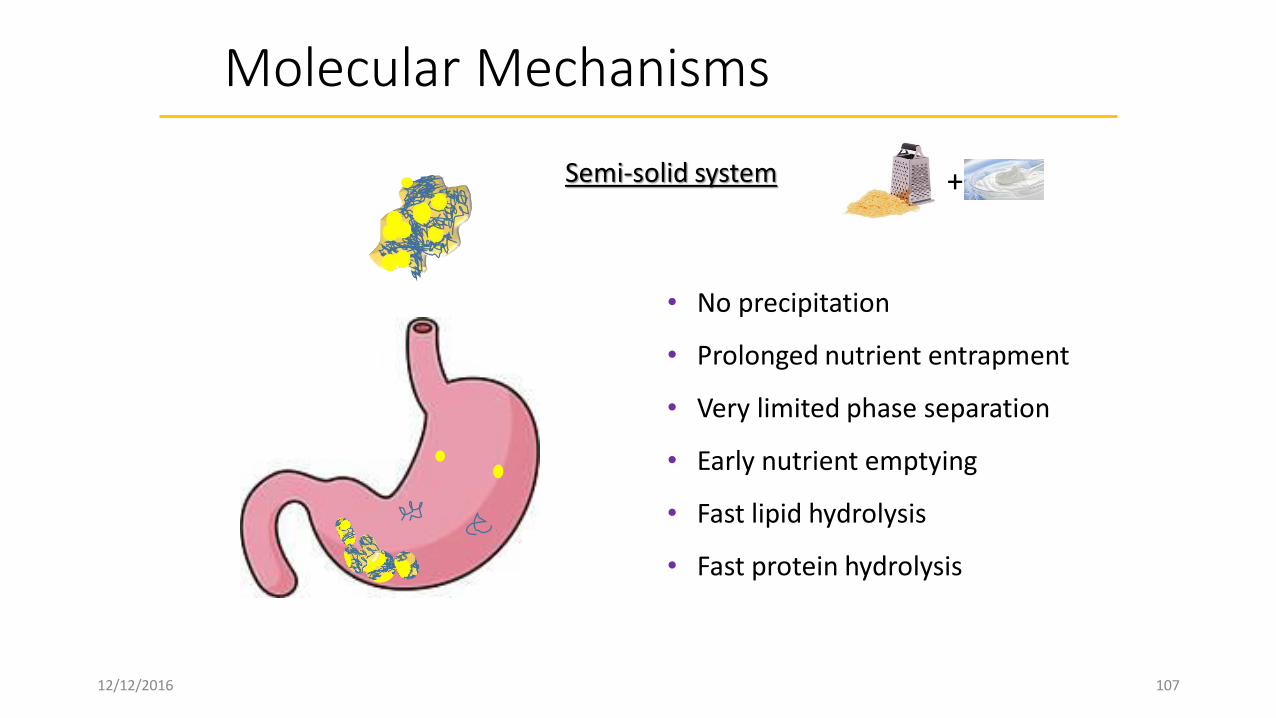
Molecular Mechanisms
• No precipitation
• Prolonged nutrient entrapment
• Very limited phase separation
• Early nutrient emptying
• Fast lipid hydrolysis
• Fast protein hydrolysis
+Semi-solid system
12/12/2016 107
Gastric behaviour: Summary
• Gastric behaviour was affected by the initial structure with either creaming or sedimentation observed.
• Digestion profiles in vitro showed clear differences in the timing of nutrients reaching the simulated small intestine and consequently the likely bioaccessibility after digestion.
• This shows the strong effect of the matrix on gastric behaviour, proteolysis and lipolysis, which explains the differences in physiological responses in terms of fullness and satiety seen in vivo.
12/12/2016 108
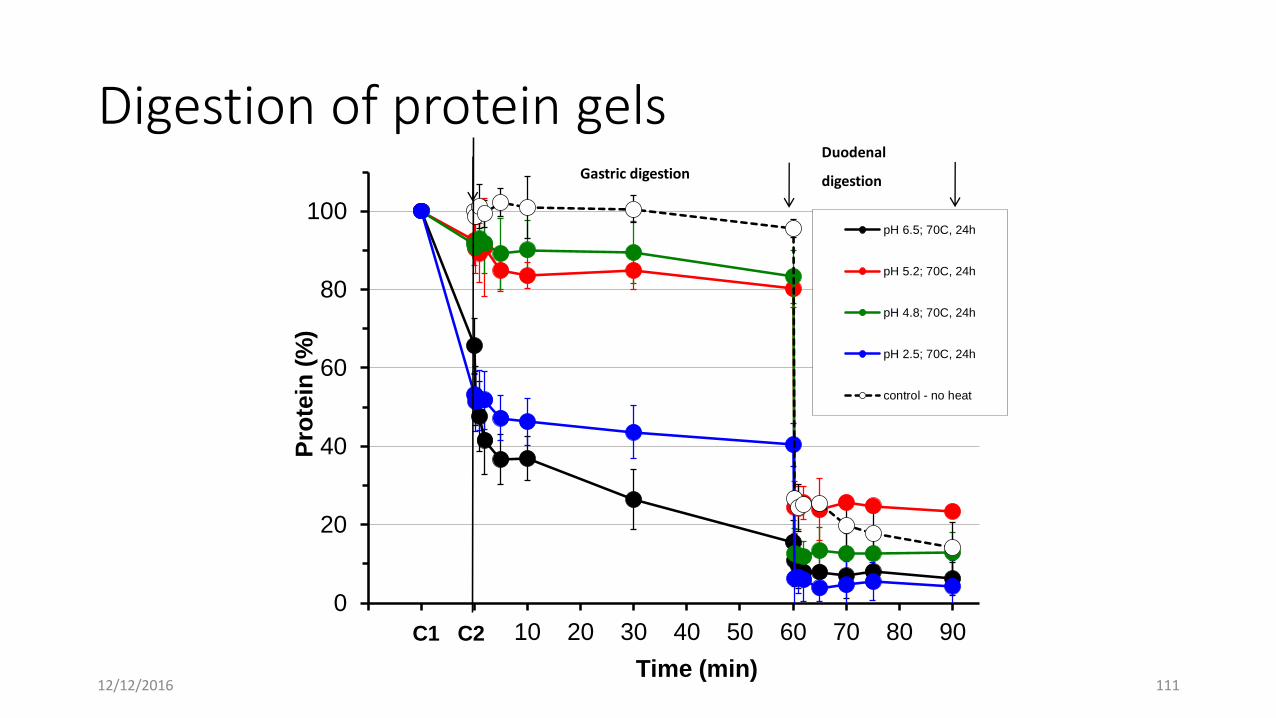
Limiting Hydrolysis
• Controlling aggregate formation through:• pH - relative to the isoelectric point.
• Temperature – relative to the main transition.
• Concentration – relative to the critical overlap concentration.
• Ionic composition and strength.
• An in vitro example
12/12/2016 109
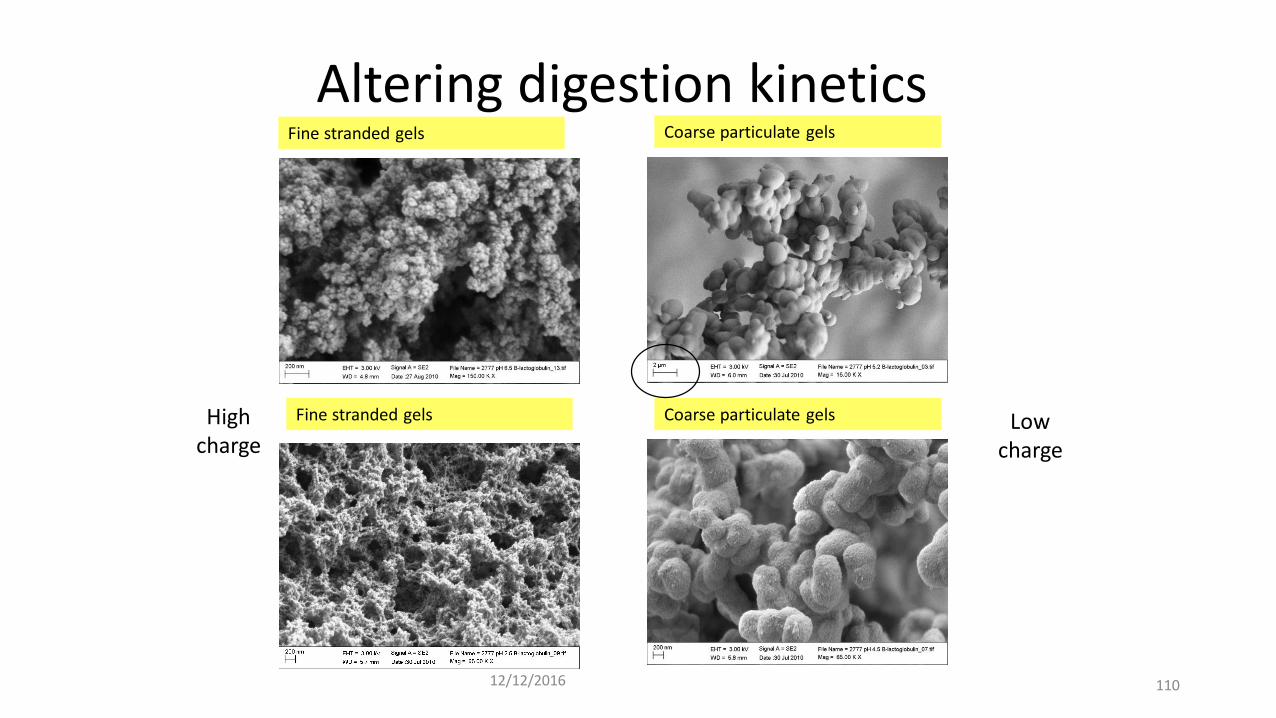
Fine stranded gels
Coarse particulate gelsFine stranded gels
Coarse particulate gels
Altering digestion kinetics
Low charge
High charge
12/12/2016 110
0
20
40
60
80
100
-20 -10 0 10 20 30 40 50 60 70 80 90
Pro
tein
(%
)
Time (min)
pH 6.5; 70C, 24h
pH 5.2; 70C, 24h
pH 4.8; 70C, 24h
pH 2.5; 70C, 24h
control - no heat
C1 C2
Gastric digestion
Duodenal
digestion
Digestion of protein gels
12/12/2016 111
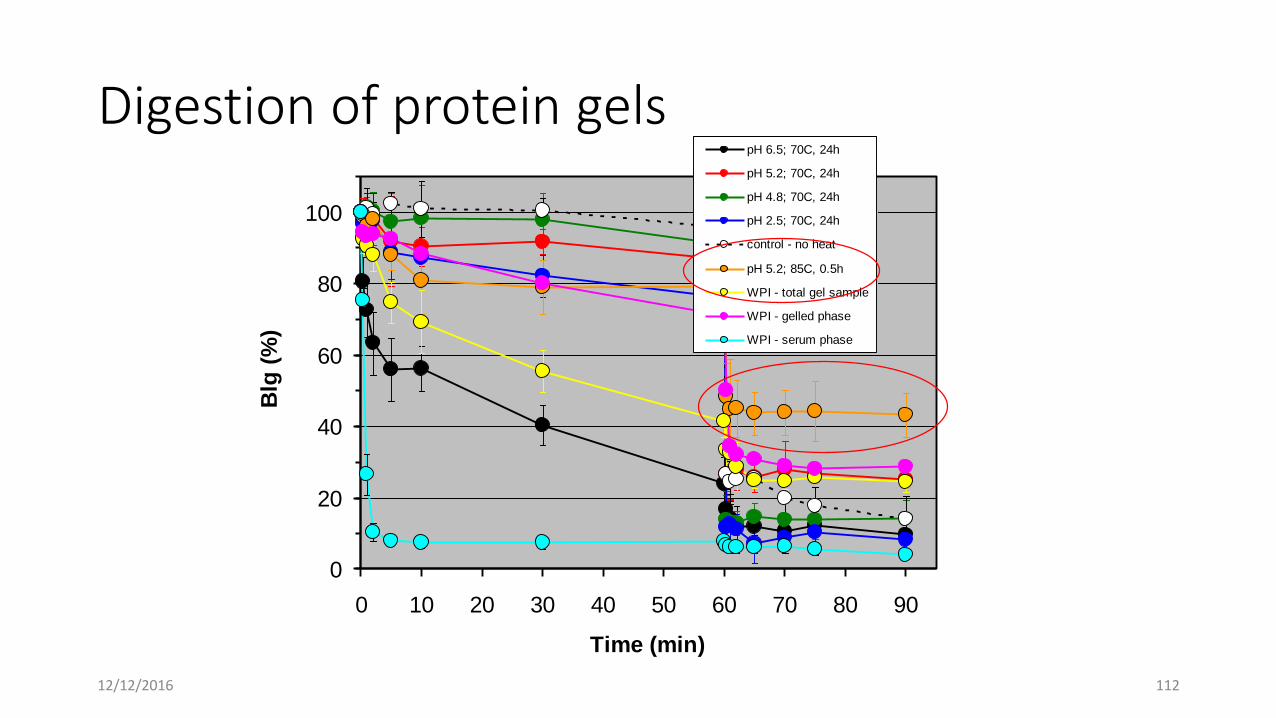
Digestion of protein gels
0
20
40
60
80
100
0 10 20 30 40 50 60 70 80 90
Time (min)
Blg
(%
)
pH 6.5; 70C, 24h
pH 5.2; 70C, 24h
pH 4.8; 70C, 24h
pH 2.5; 70C, 24h
control - no heat
pH 5.2; 85C, 0.5h
WPI - total gel sample
WPI - gelled phase
WPI - serum phase
12/12/2016 112
The use of protein cross-linking
Using Transglutaminase (TG) to structure protein in the bulk or at an interface
• TG catalyses an acyl transfer reaction between a protein or peptide bound glutamine residue and a lysine residue.
• This covalent -(-glutamyl) lysine isopeptide bond can be formed inter- or intra-molecularly.
• At sufficient protein concentration a firm gel can be formed.
Juvonen et al. BJN, 106 1890 (2011), Juvonen et al. BJN, 114 418 (2015)
12/12/2016 113
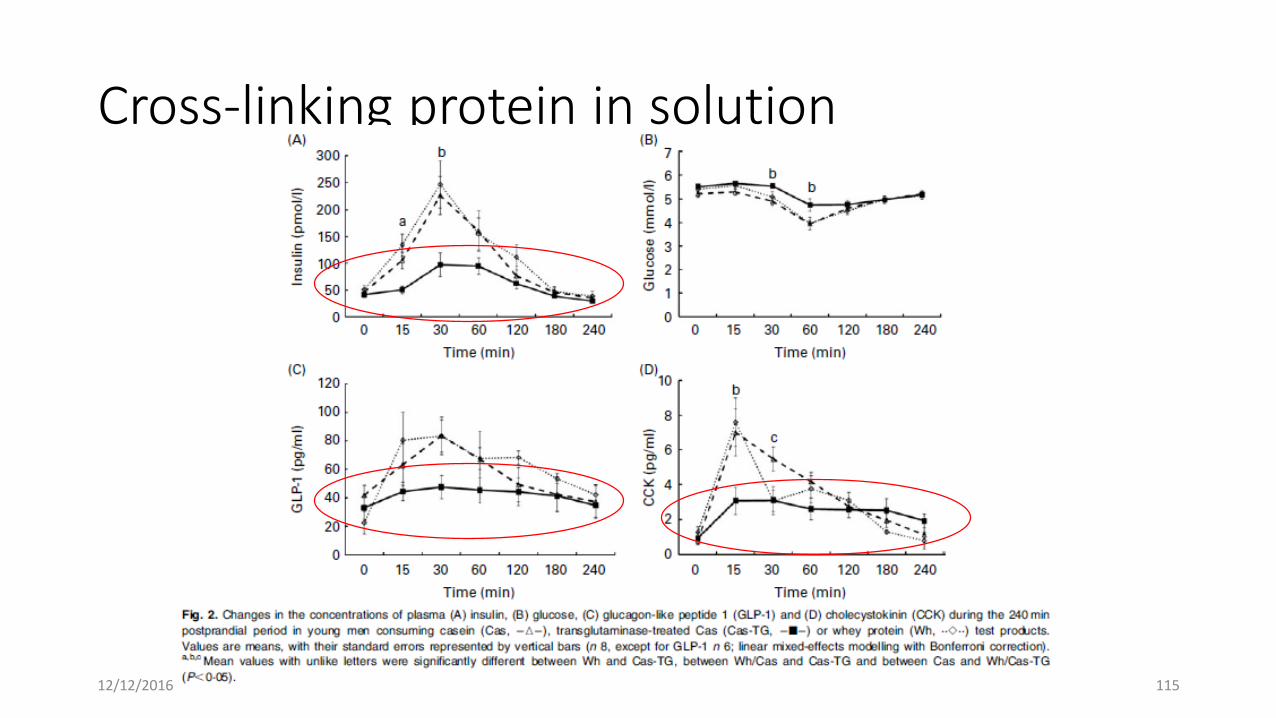
Cross-linking protein in solutionAfter a 12 h fast, 8 participants ingested one of the following milk protein-based test products along with 400 ml of water in a randomised order:
1. High-viscous Cas solution (Cas)
2. Rigid Cas gel (Cas cross-linked by TG; Cas-TG)
3. Low-viscous Wh solution (Wh).
The test products were to be consumed within 30 min.
12/12/2016 114
Cross-linking protein in solution
12/12/2016 115
Cross-linking protein in solution
12/12/2016 116
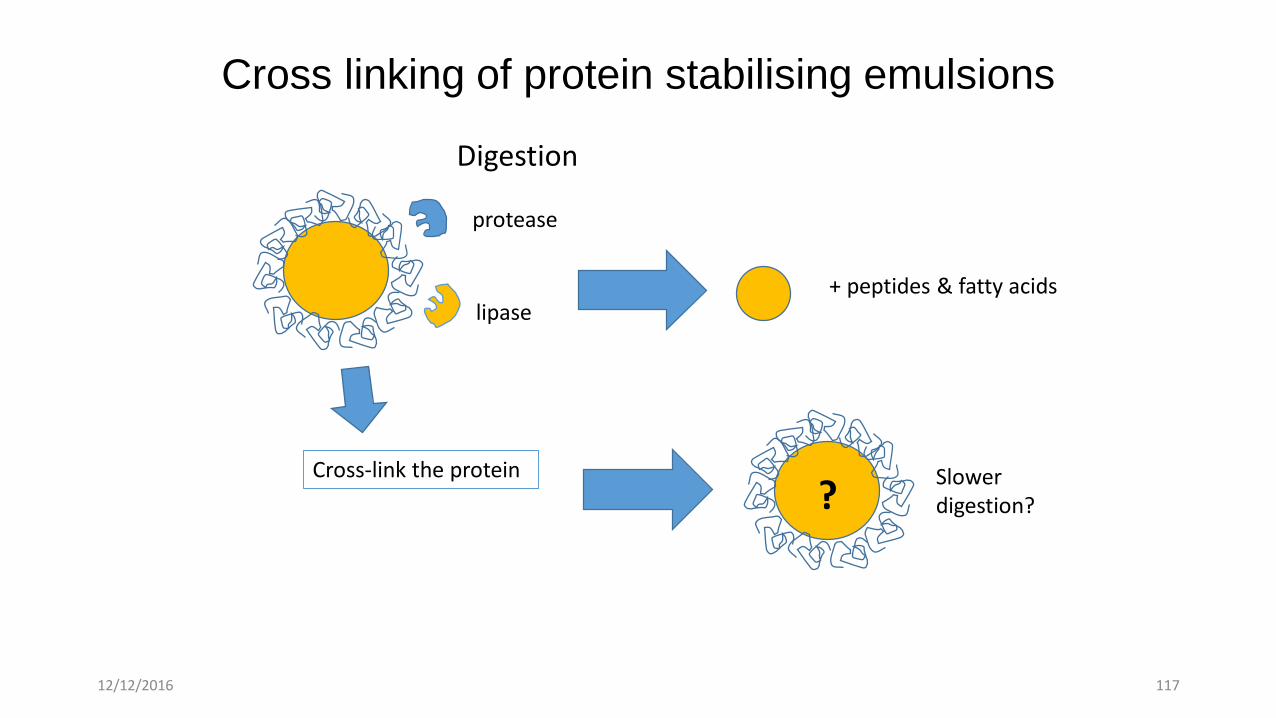
Cross linking of protein stabilising emulsions
+ peptides & fatty acidslipase
protease
Digestion
Cross-link the protein
?Slower digestion?
12/12/2016 117
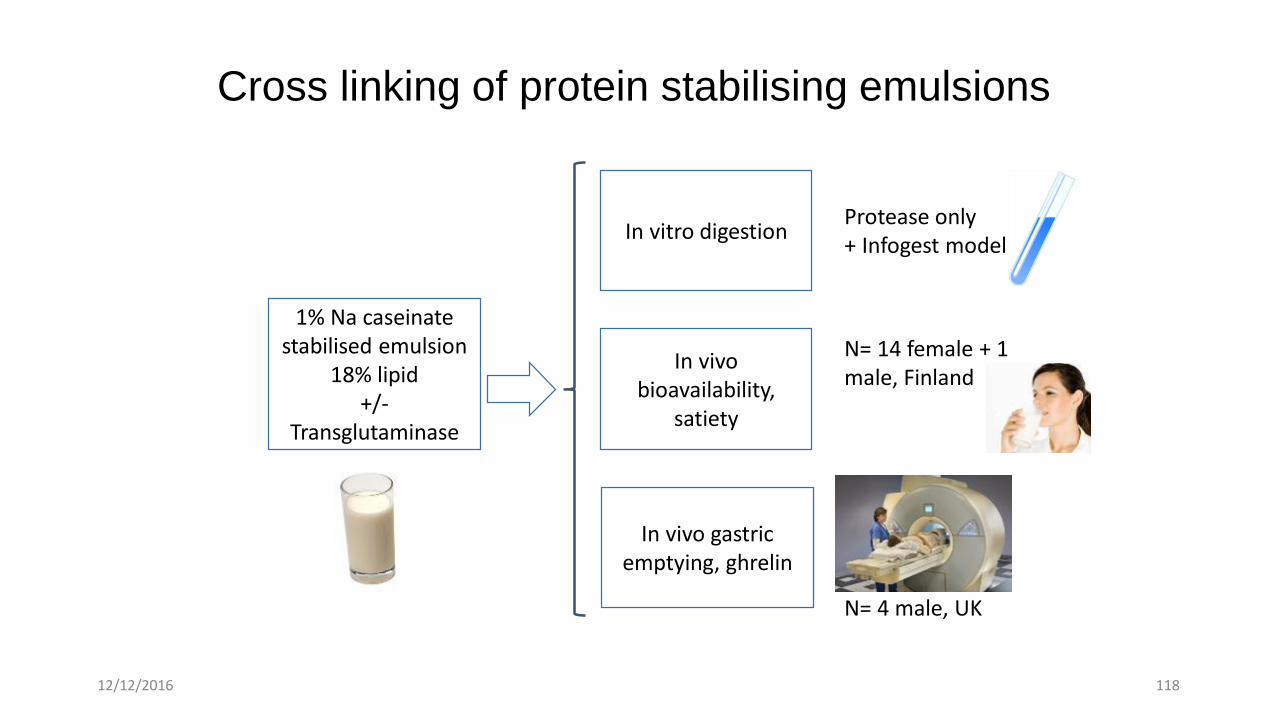
Cross linking of protein stabilising emulsions
1% Na caseinatestabilised emulsion
18% lipid+/-
Transglutaminase
In vitro digestionProtease only+ Infogest model
In vivo bioavailability,
satiety
N= 14 female + 1 male, Finland
In vivo gastric emptying, ghrelin
N= 4 male, UK
12/12/2016 118
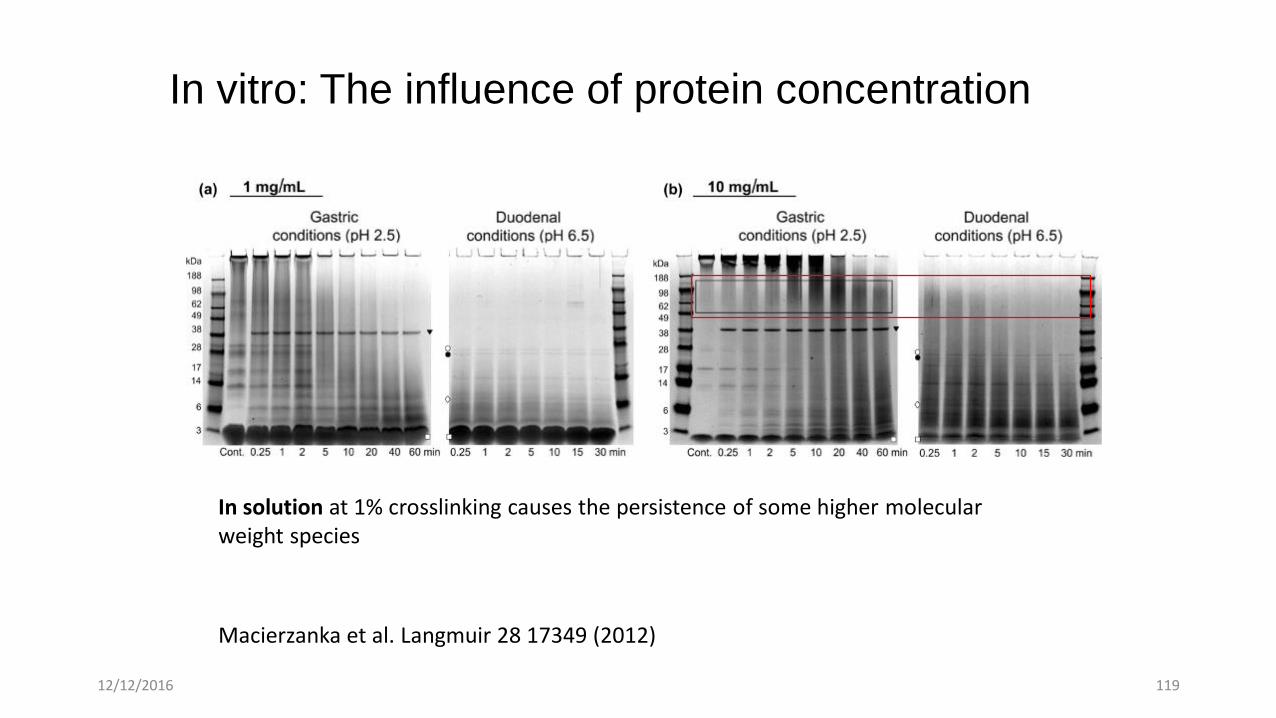
In vitro: The influence of protein concentration
In solution at 1% crosslinking causes the persistence of some higher molecular weight species
Macierzanka et al. Langmuir 28 17349 (2012)
12/12/2016 119
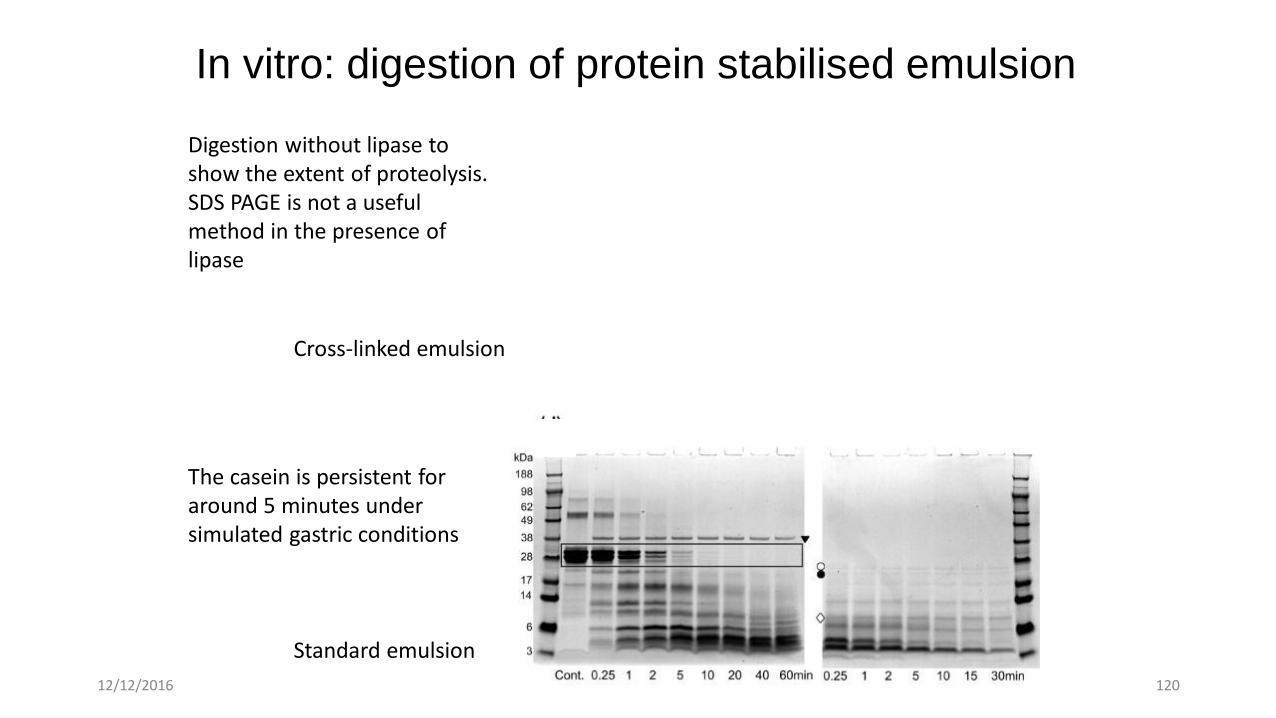
In vitro: digestion of protein stabilised emulsion
Digestion without lipase to show the extent of proteolysis. SDS PAGE is not a useful method in the presence of lipase
Cross-linked emulsion
Standard emulsion
The casein is persistent for around 5 minutes under simulated gastric conditions
12/12/2016 120
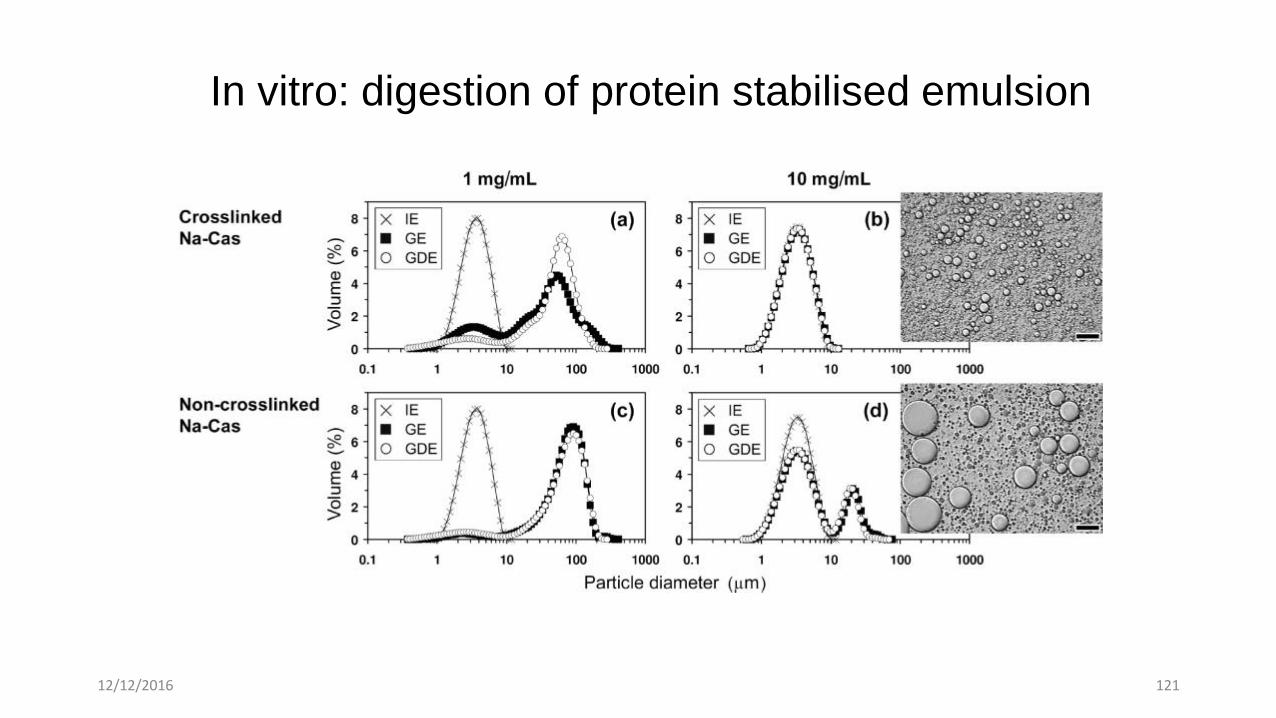
In vitro: digestion of protein stabilised emulsion
12/12/2016 121
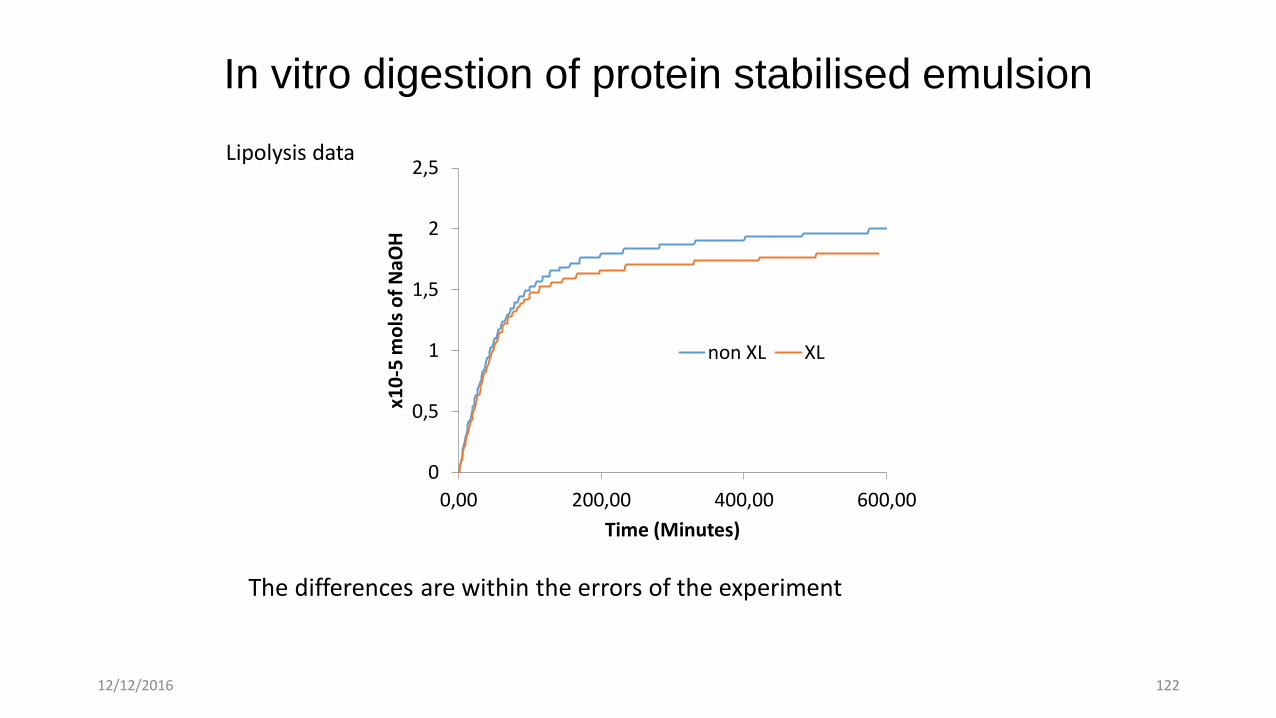
In vitro digestion of protein stabilised emulsion
Lipolysis data
The differences are within the errors of the experiment
0
0,5
1
1,5
2
2,5
0,00 200,00 400,00 600,00
x10
-5 m
ols
of
NaO
H
Time (Minutes)
non XL XL
12/12/2016 122
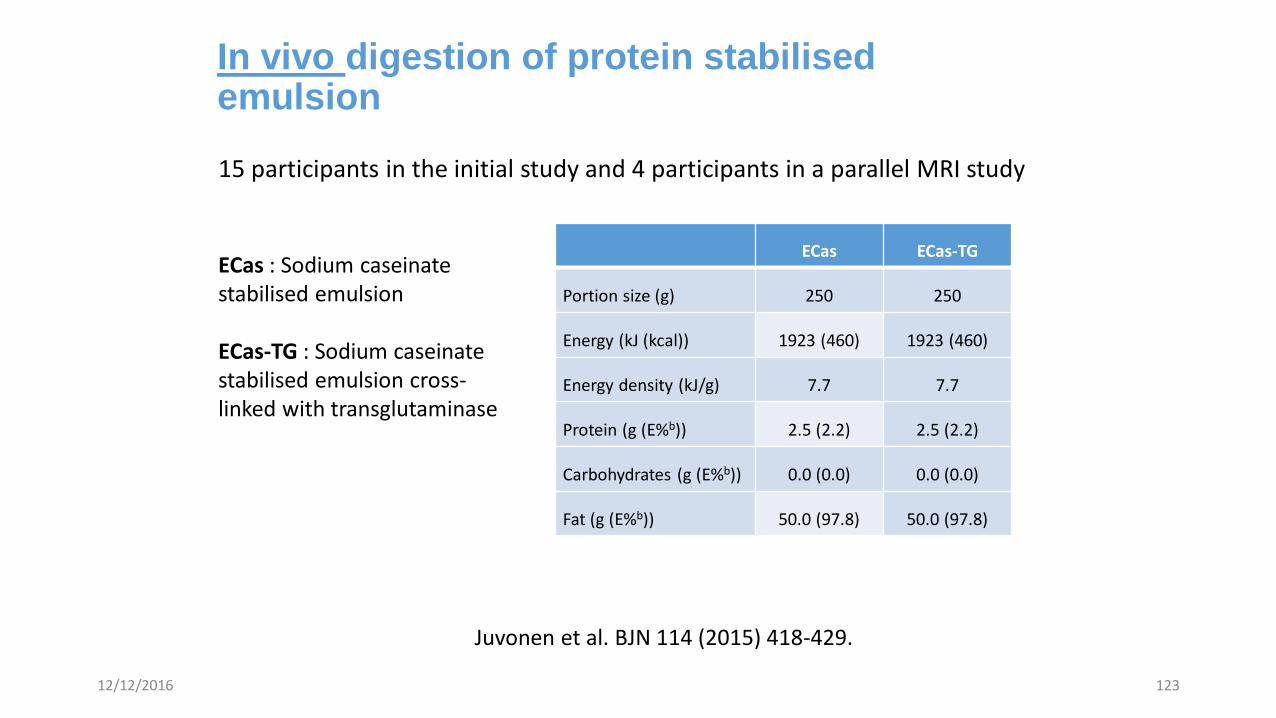
In vivo digestion of protein stabilised emulsion
15 participants in the initial study and 4 participants in a parallel MRI study
ECas ECas-TG
Portion size (g) 250 250
Energy (kJ (kcal)) 1923 (460) 1923 (460)
Energy density (kJ/g) 7.7 7.7
Protein (g (E%b)) 2.5 (2.2) 2.5 (2.2)
Carbohydrates (g (E%b)) 0.0 (0.0) 0.0 (0.0)
Fat (g (E%b)) 50.0 (97.8) 50.0 (97.8)
ECas : Sodium caseinatestabilised emulsion
ECas-TG : Sodium caseinatestabilised emulsion cross-linked with transglutaminase
12/12/2016 123
Juvonen et al. BJN 114 (2015) 418-429.
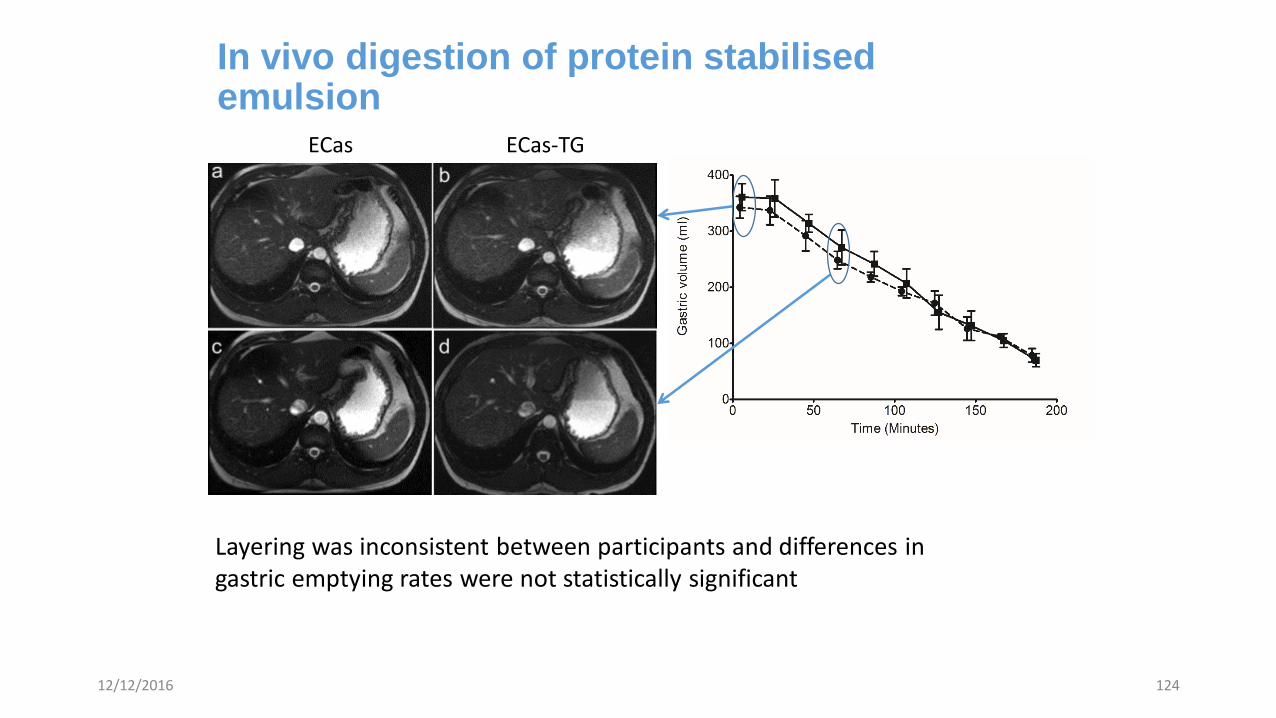
In vivo digestion of protein stabilised emulsion
Layering was inconsistent between participants and differences in gastric emptying rates were not statistically significant
ECas ECas-TG
12/12/2016 124
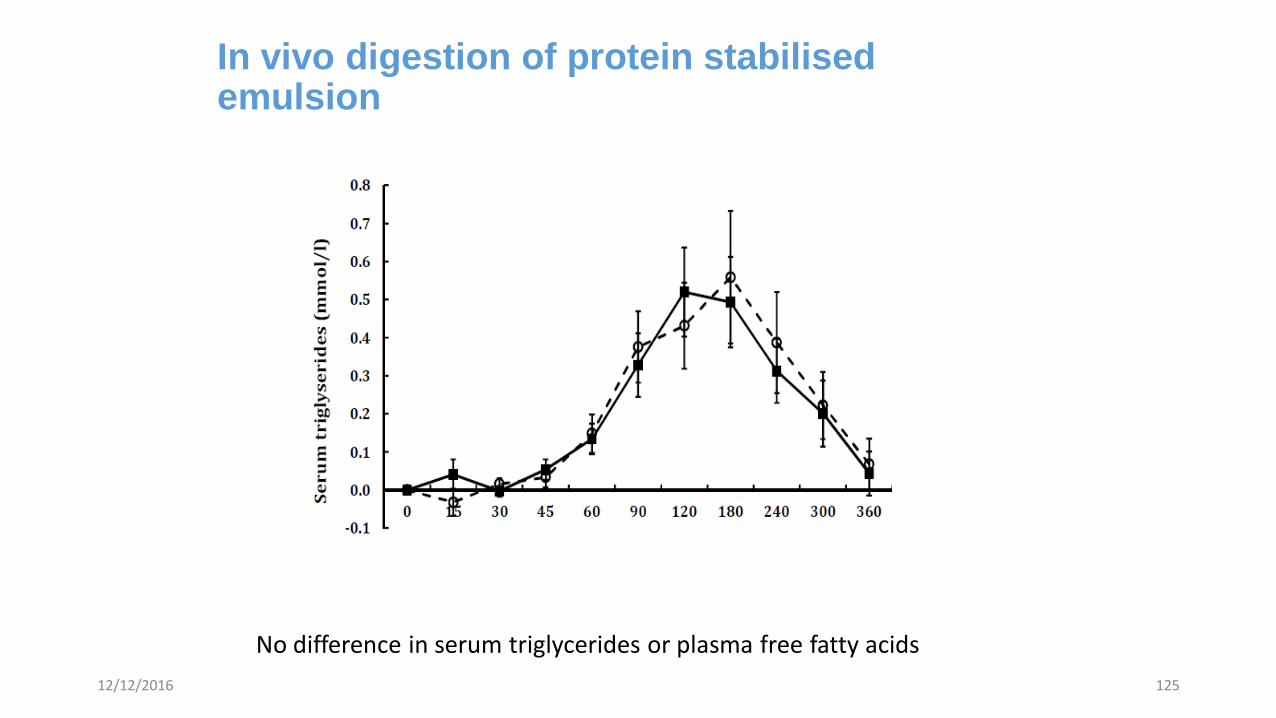
In vivo digestion of protein stabilised emulsion
No difference in serum triglycerides or plasma free fatty acids
12/12/2016 125
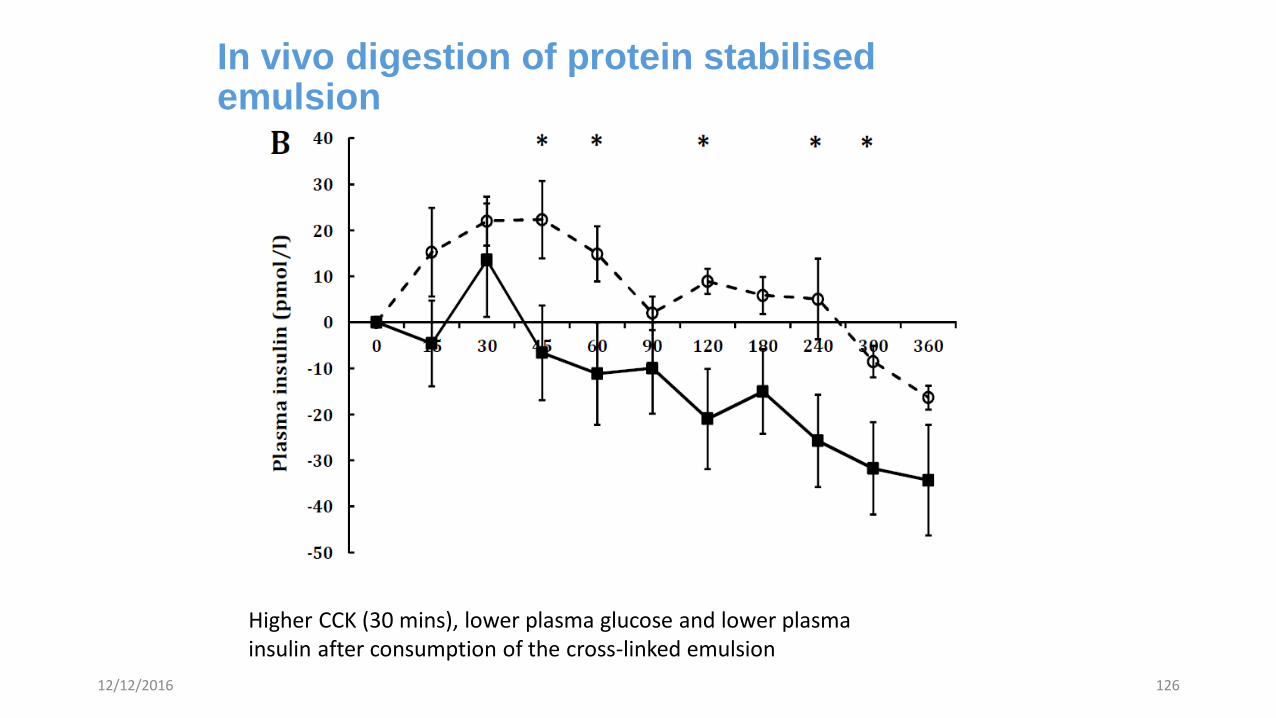
In vivo digestion of protein stabilised emulsion
Higher CCK (30 mins), lower plasma glucose and lower plasma insulin after consumption of the cross-linked emulsion
12/12/2016 126
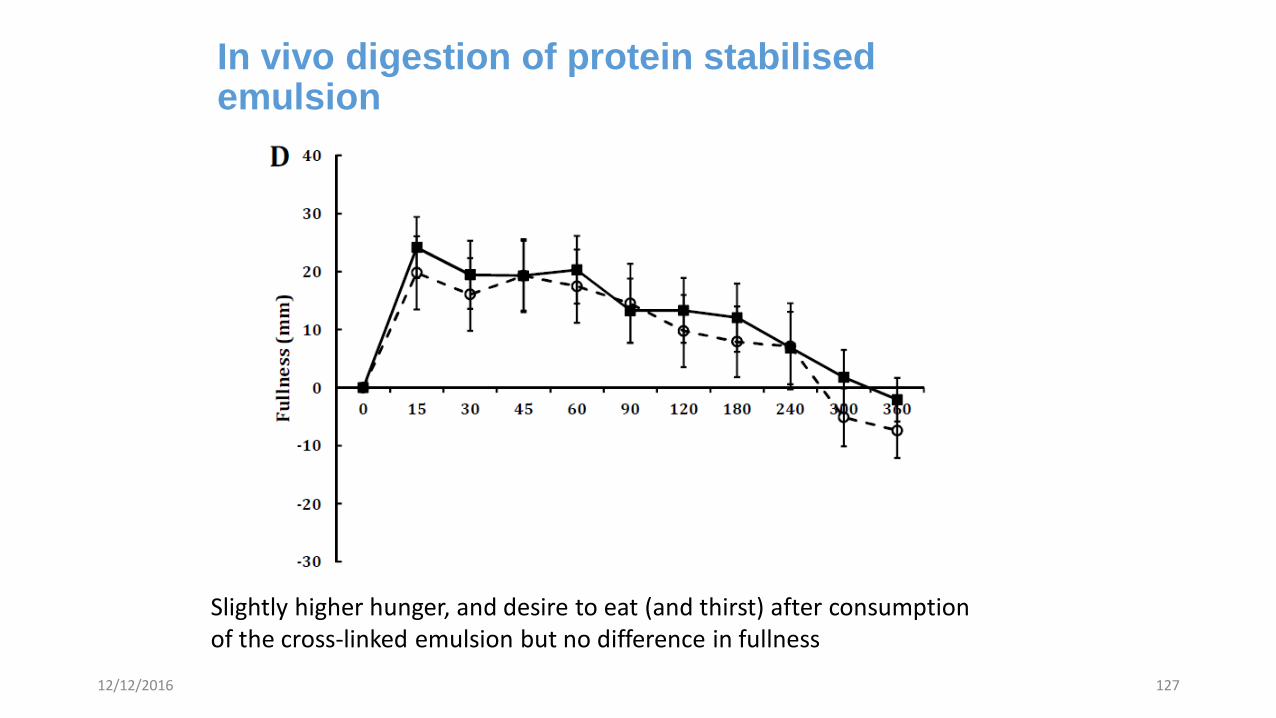
In vivo digestion of protein stabilised emulsion
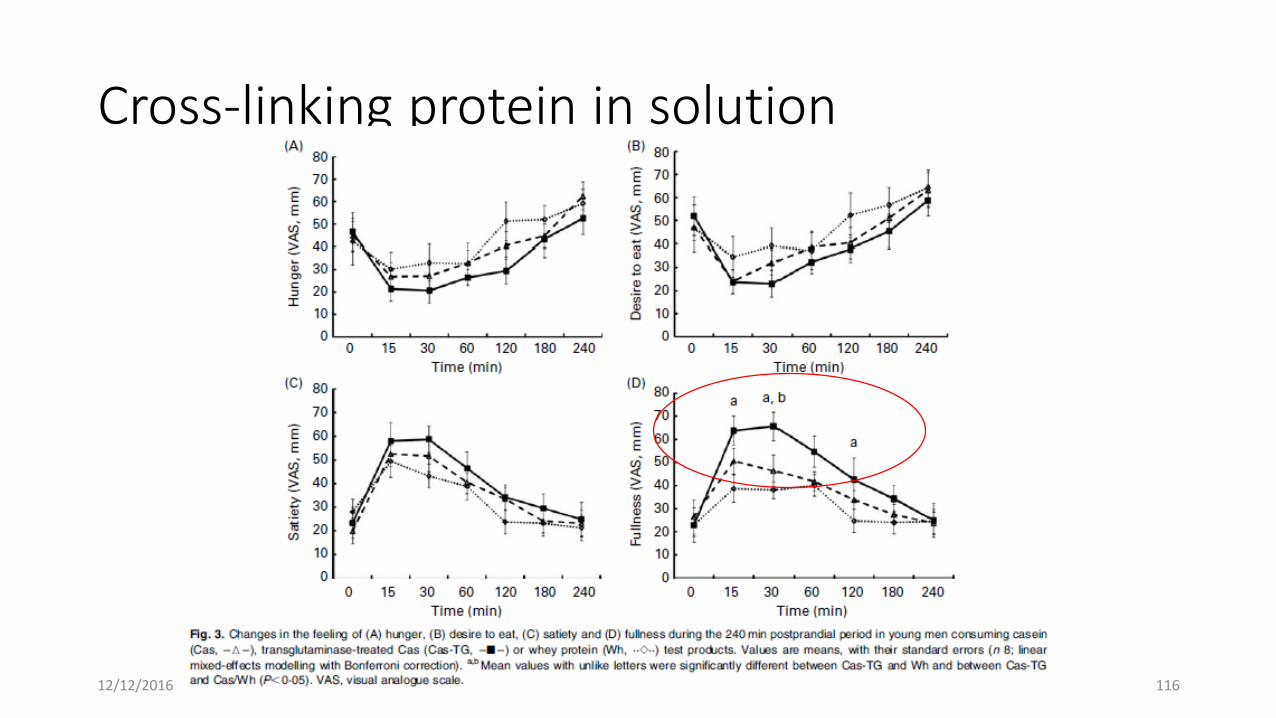
Slightly higher hunger, and desire to eat (and thirst) after consumption of the cross-linked emulsion but no difference in fullness
12/12/2016 127
Protein cross-linking: Summary
• In vitro digestion showed persistence of protein in the Ecas-TG compared to the control
• In vitro digestion showed no difference in lipid hydrolysis between the Ecas-TG and control
• In vivo there was no significant difference in gastric emptying
• In vivo there was no difference in plasma lipids
• In vivo there was lower plasma glucose and insulin after consumption of the Ecas-TG emulsion
• The Ecas-TG emulsion generated slightly higher hunger and desire to eat but there was no difference in fullness.
12/12/2016 128
Conclusions
• Layering of food in the stomach can be used to alter physiological responses
• Food structures can be used to control digestion and such tools may be useful in addressing metabolic diseases
• Emulsions can be tailored to change rates of digestion of lipid and protein
• Food structures can be tailored for producing functional foods
12/12/2016 129
12/12/2016 130
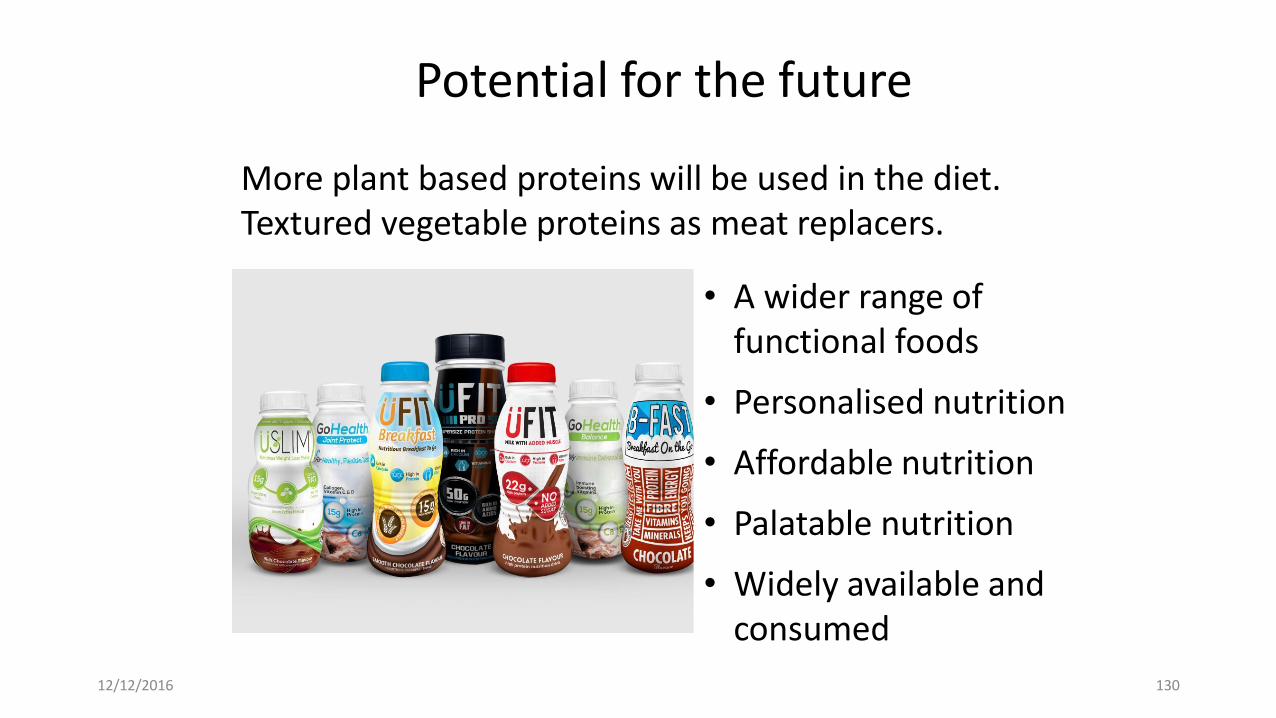
Potential for the future
More plant based proteins will be used in the diet. Textured vegetable proteins as meat replacers.
Pet food • A wider range of functional foods
• Personalised nutrition
• Affordable nutrition
• Palatable nutrition
• Widely available and consumed
12/12/2016 131
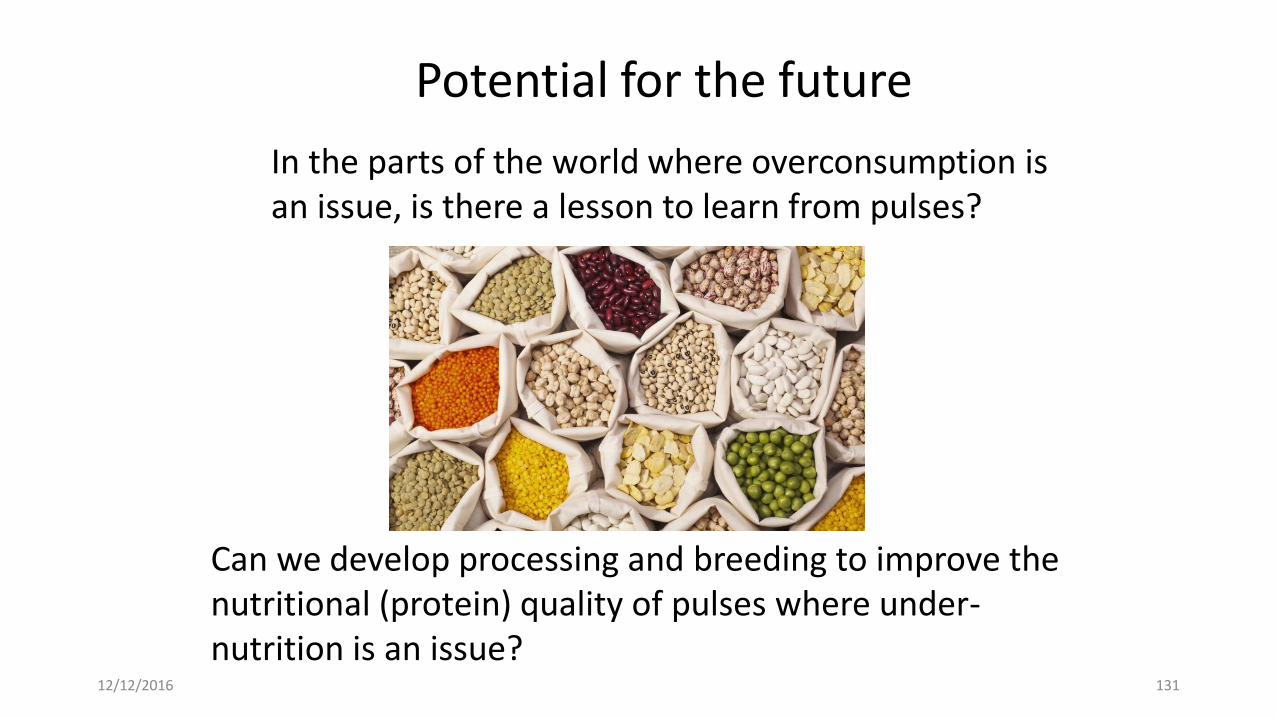
Potential for the future
In the parts of the world where overconsumption is an issue, is there a lesson to learn from pulses?
Can we develop processing and breeding to improve the nutritional (protein) quality of pulses where under-nutrition is an issue?
Acknowledgements
• Neil Rigby in Leeds• Pete Wilde, Balazs Bajka, Louise Salt, etc at IFR• Adam Macierzanka, University of Gdansk• Paul Malcolm and others at NNUH• Kaisa Poutanen and others at VTT and University of Eastern Finland• Didier Dupont and many others at INRA (STLO and BIA)• Andre Brodkorb, Anabel Mulet-Cabero at Teagasc Moorepark
12/12/2016 132

Sergio Salazar-Villanea
• Processing of rapeseed meal: effects on protein hydrolysis and digestibility
Processing of rapeseed meal:
Effects on protein hydrolysis
Sergio Salazar-Villanea
E.M.A.M. Bruininx, H. Gruppen, W.H. Hendriks, A.F.B. van der Poel
IP/OP Customised Nutrition
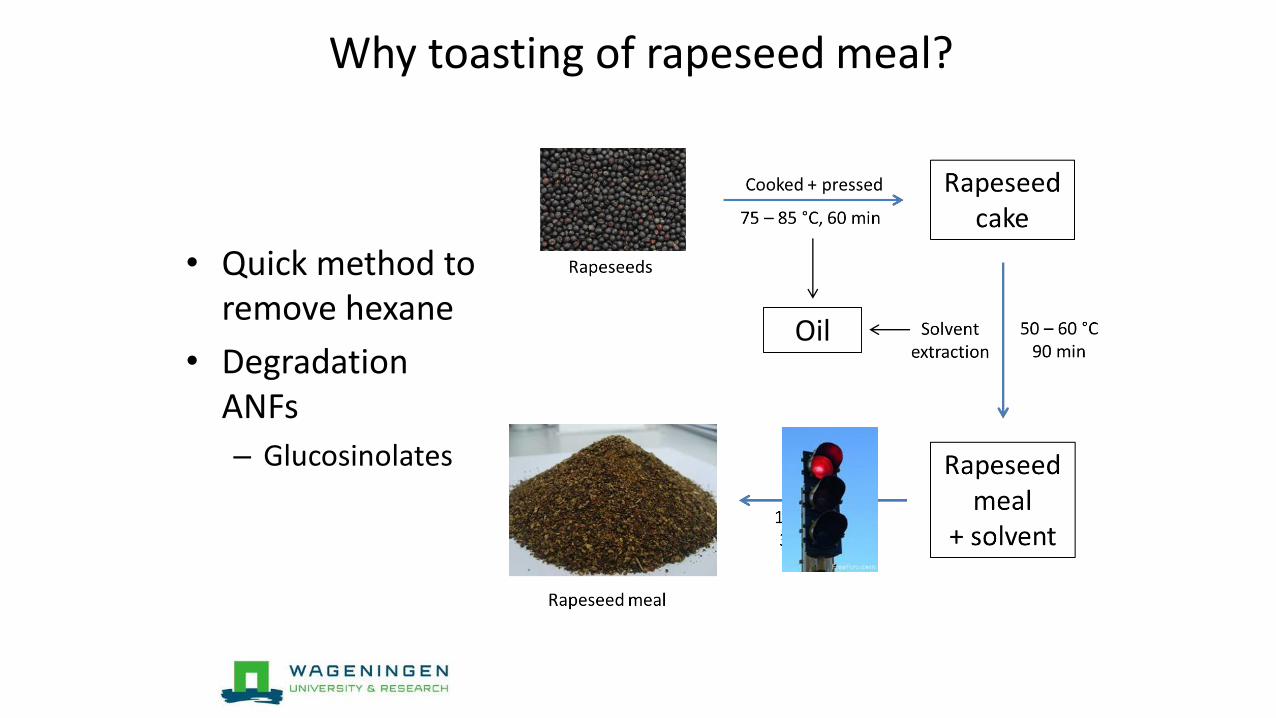
Why toasting of rapeseed meal?
• Quick method to remove hexane
• Degradation ANFs
– Glucosinolates
Oil
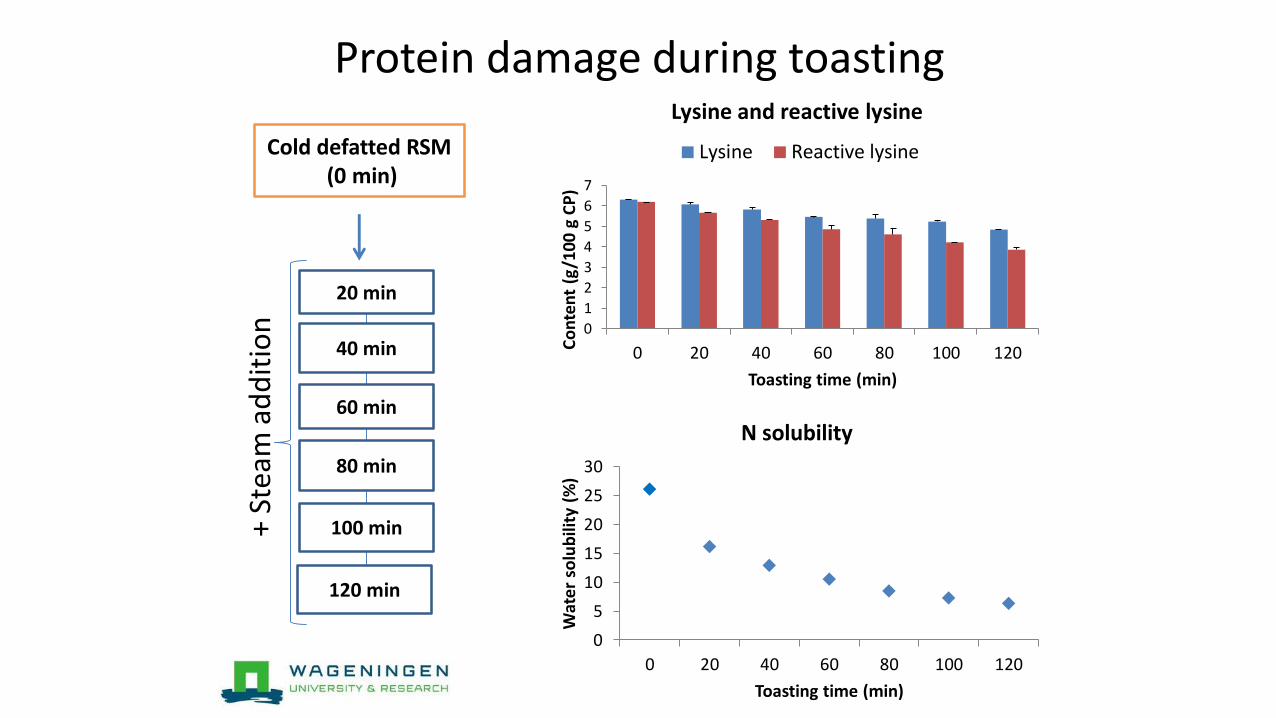
Protein damage during toasting
0
1
2
3
4
5
6
7
0 20 40 60 80 100 120Co
nte
nt
(g/1
00 g
CP
)
Toasting time (min)
Lysine and reactive lysine
Lysine Reactive lysine
0
5
10
15
20
25
30
0 20 40 60 80 100 120
Wat
er
solu
bili
ty (
%)
Toasting time (min)
N solubility
Cold defatted RSM(0 min)
20 min
40 min
60 min
80 min
100 min+ St
eam
ad
dit
ion
120 min
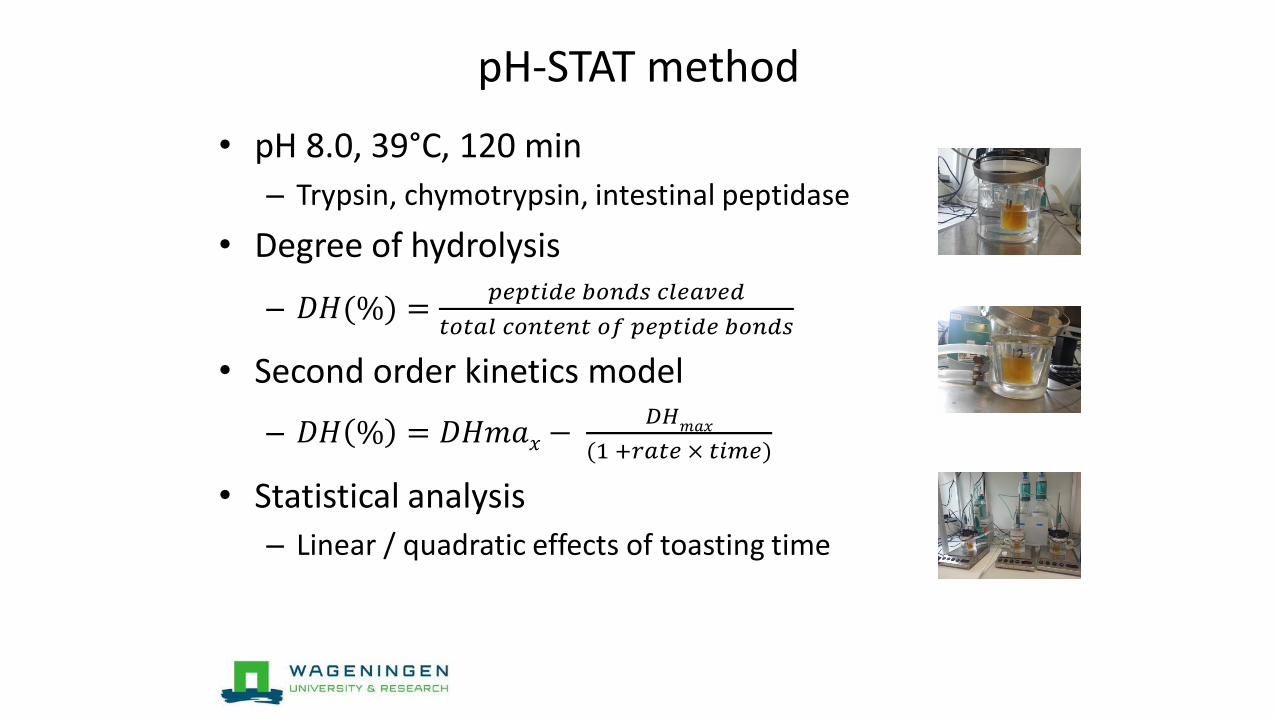
pH-STAT method
• pH 8.0, 39°C, 120 min
– Trypsin, chymotrypsin, intestinal peptidase
• Degree of hydrolysis
– 𝐷𝐻(%) =𝑝𝑒𝑝𝑡𝑖𝑑𝑒 𝑏𝑜𝑛𝑑𝑠 𝑐𝑙𝑒𝑎𝑣𝑒𝑑
𝑡𝑜𝑡𝑎𝑙 𝑐𝑜𝑛𝑡𝑒𝑛𝑡 𝑜𝑓 𝑝𝑒𝑝𝑡𝑖𝑑𝑒 𝑏𝑜𝑛𝑑𝑠
• Second order kinetics model
– 𝐷𝐻 % = 𝐷𝐻𝑚𝑎𝑥 −𝐷𝐻𝑚𝑎𝑥
(1 +𝑟𝑎𝑡𝑒 × 𝑡𝑖𝑚𝑒)
• Statistical analysis
– Linear / quadratic effects of toasting time
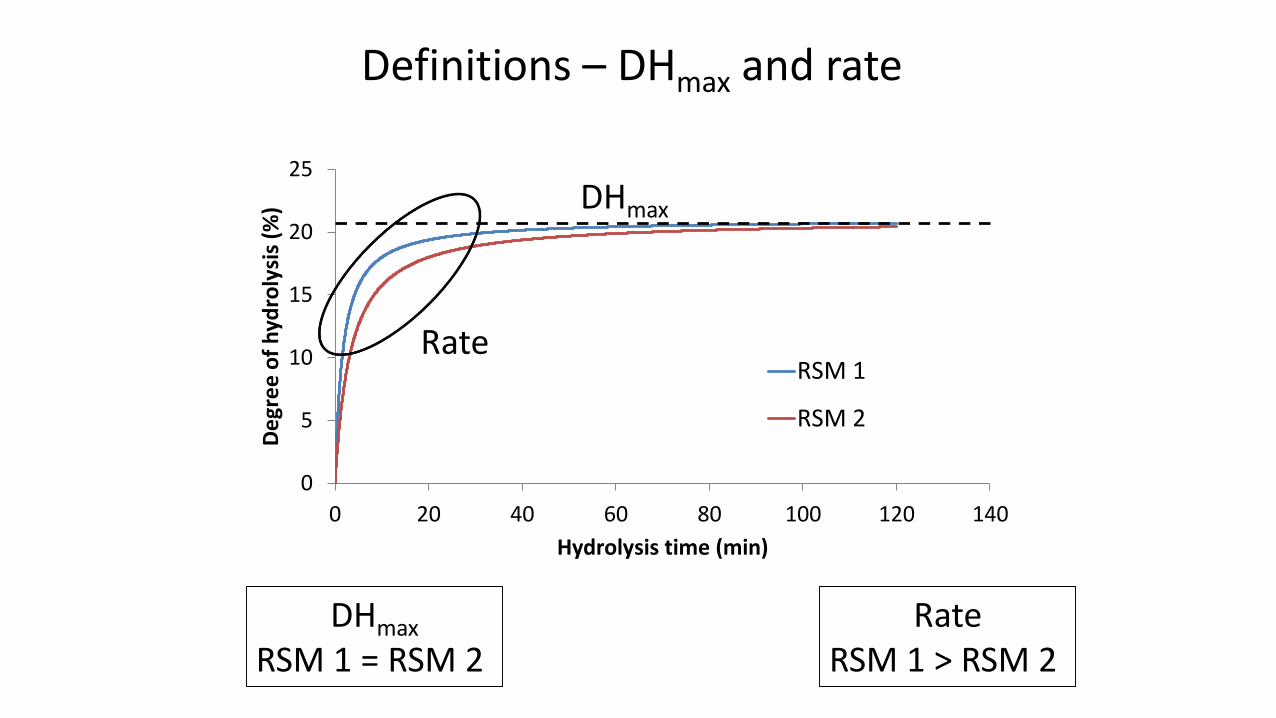
0
5
10
15
20
25
0 20 40 60 80 100 120 140
De
gre
e o
f h
ydro
lysi
s (%
)
Hydrolysis time (min)
RSM 1
RSM 2
Definitions – DHmax and rate
DHmax
Rate
DHmax
RSM 1 = RSM 2Rate
RSM 1 > RSM 2
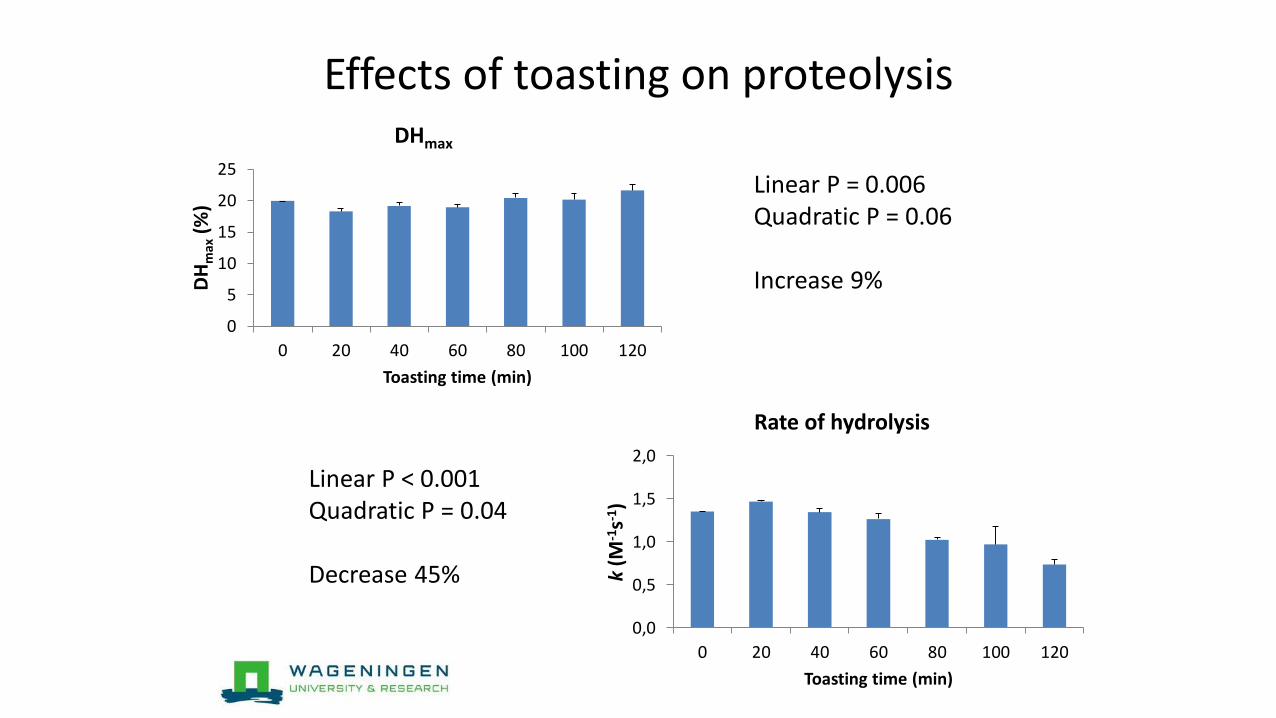
Effects of toasting on proteolysis
0
5
10
15
20
25
0 20 40 60 80 100 120
DH
max
(%)
Toasting time (min)
DHmax
0,0
0,5
1,0
1,5
2,0
0 20 40 60 80 100 120
k(M
-1s-1
)
Toasting time (min)
Rate of hydrolysis
Linear P = 0.006Quadratic P = 0.06
Increase 9%
Linear P < 0.001Quadratic P = 0.04
Decrease 45%
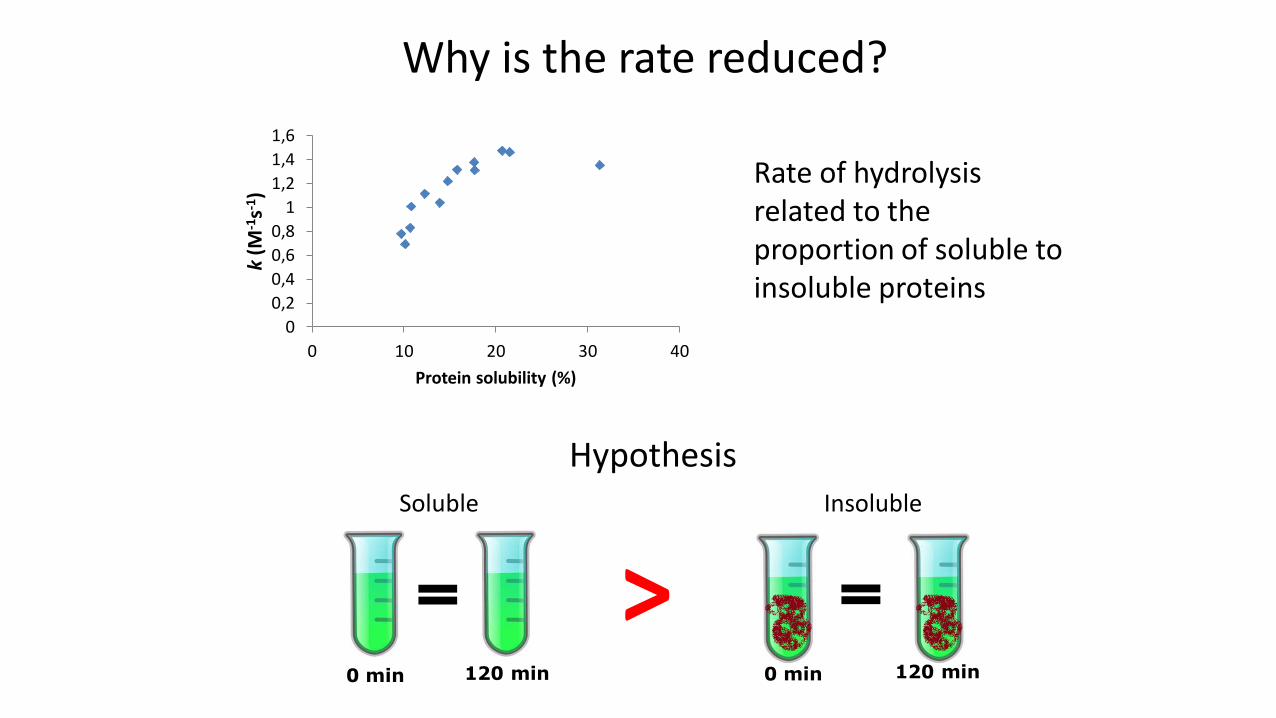
Why is the rate reduced?
0
0,2
0,4
0,6
0,8
1
1,2
1,4
1,6
0 10 20 30 40
k(M
-1s-1
)
Protein solubility (%)
0 min 120 min 0 min 120 min
Rate of hydrolysis related to the proportion of soluble to insoluble proteins
HypothesisSoluble Insoluble
>
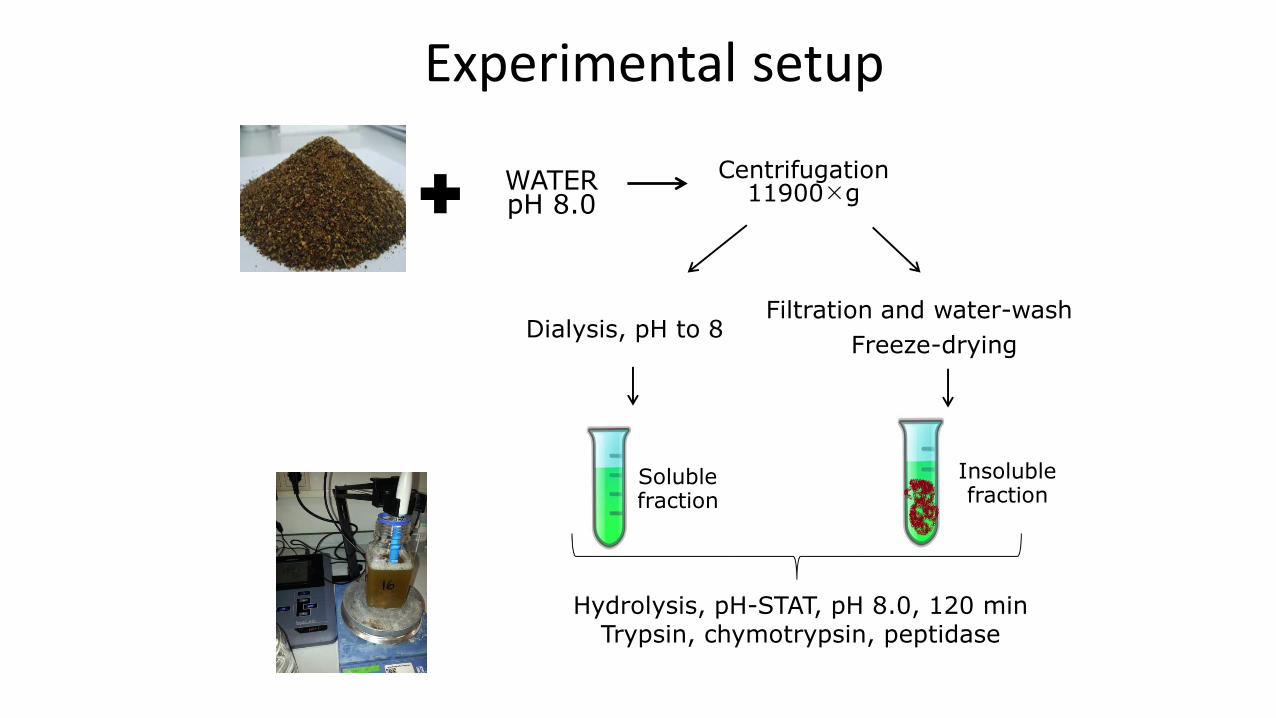
Experimental setup
WATER pH 8.0
Centrifugation 11900g
Soluble fraction
Filtration and water-washDialysis, pH to 8
Freeze-drying
Insoluble fraction
Hydrolysis, pH-STAT, pH 8.0, 120 minTrypsin, chymotrypsin, peptidase
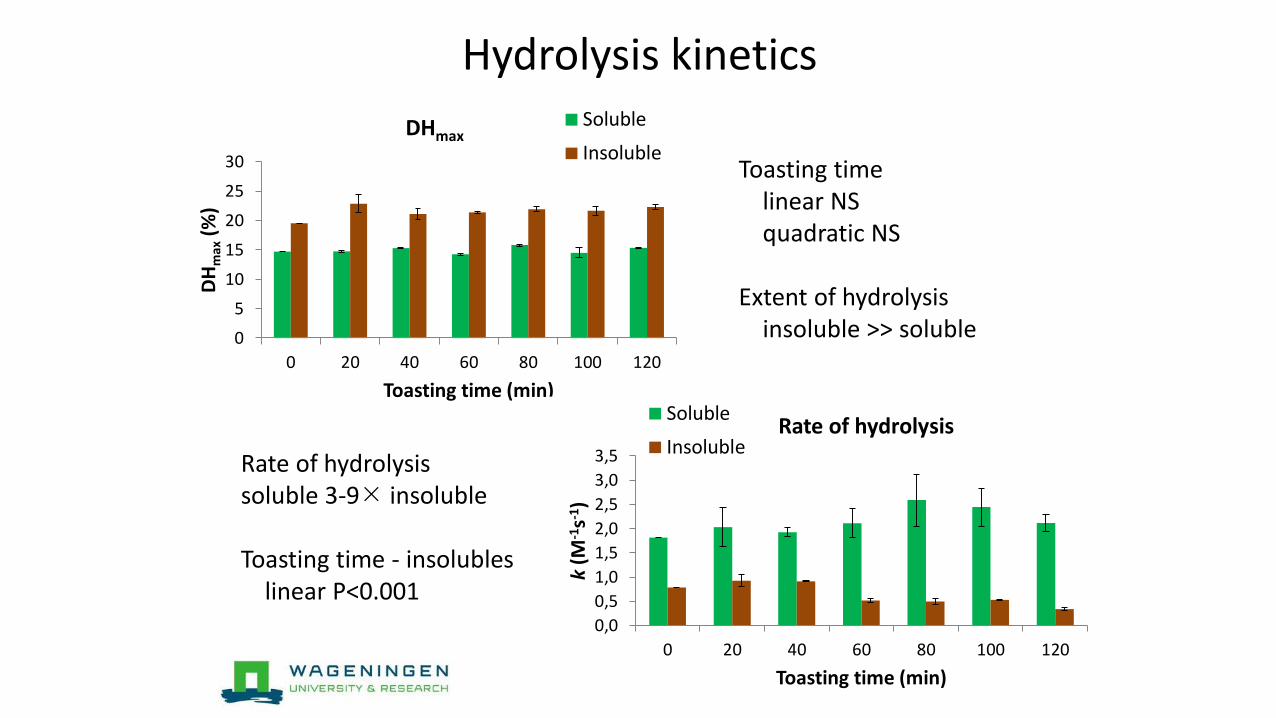
Hydrolysis kinetics
0
5
10
15
20
25
30
0 20 40 60 80 100 120
DH
max
(%)
Toasting time (min)
DHmaxSoluble
Insoluble
0,0
0,5
1,0
1,5
2,0
2,5
3,0
3,5
0 20 40 60 80 100 120
k(M
-1s-1
)
Toasting time (min)
Rate of hydrolysisSoluble
Insoluble
Toasting timelinear NSquadratic NS
Extent of hydrolysisinsoluble >> soluble
Rate of hydrolysissoluble 3-9 insoluble
Toasting time - insolubleslinear P<0.001
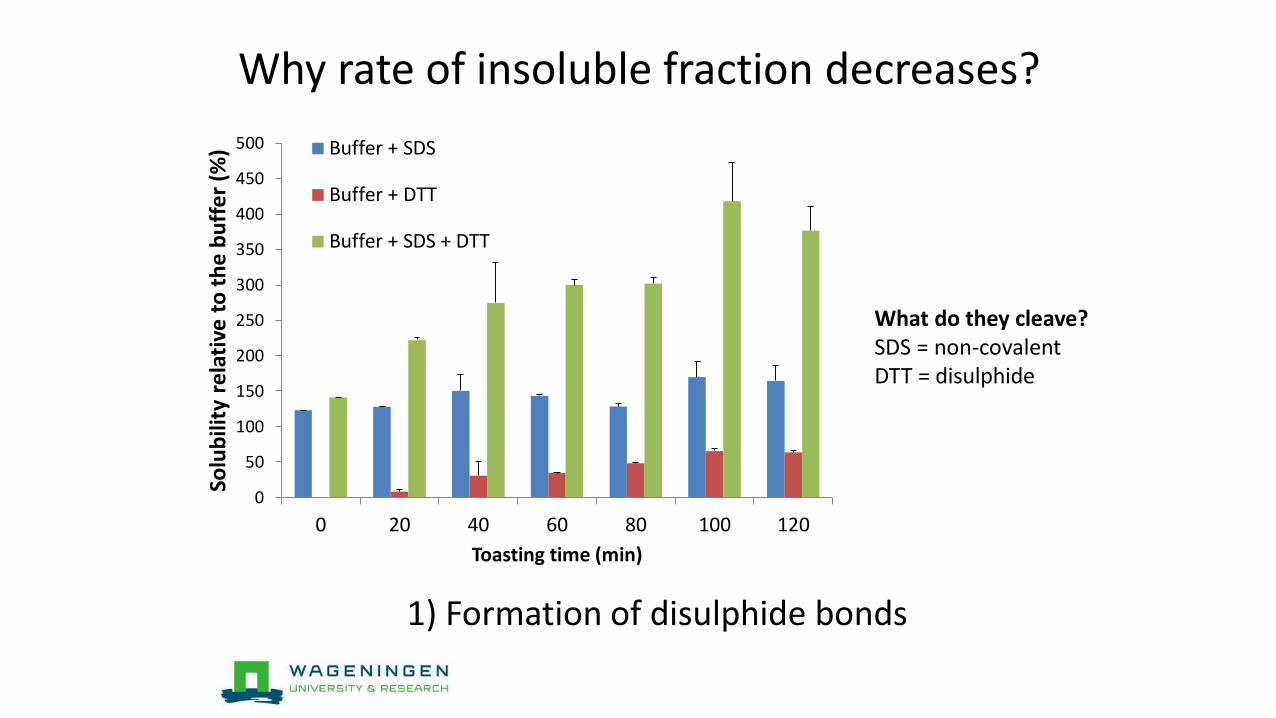
Why rate of insoluble fraction decreases?
0
50
100
150
200
250
300
350
400
450
500
0 20 40 60 80 100 120
Solu
bili
ty r
ela
tive
to
th
e b
uff
er
(%)
Toasting time (min)
Buffer + SDS
Buffer + DTT
Buffer + SDS + DTT
1) Formation of disulphide bonds
What do they cleave?SDS = non-covalentDTT = disulphide
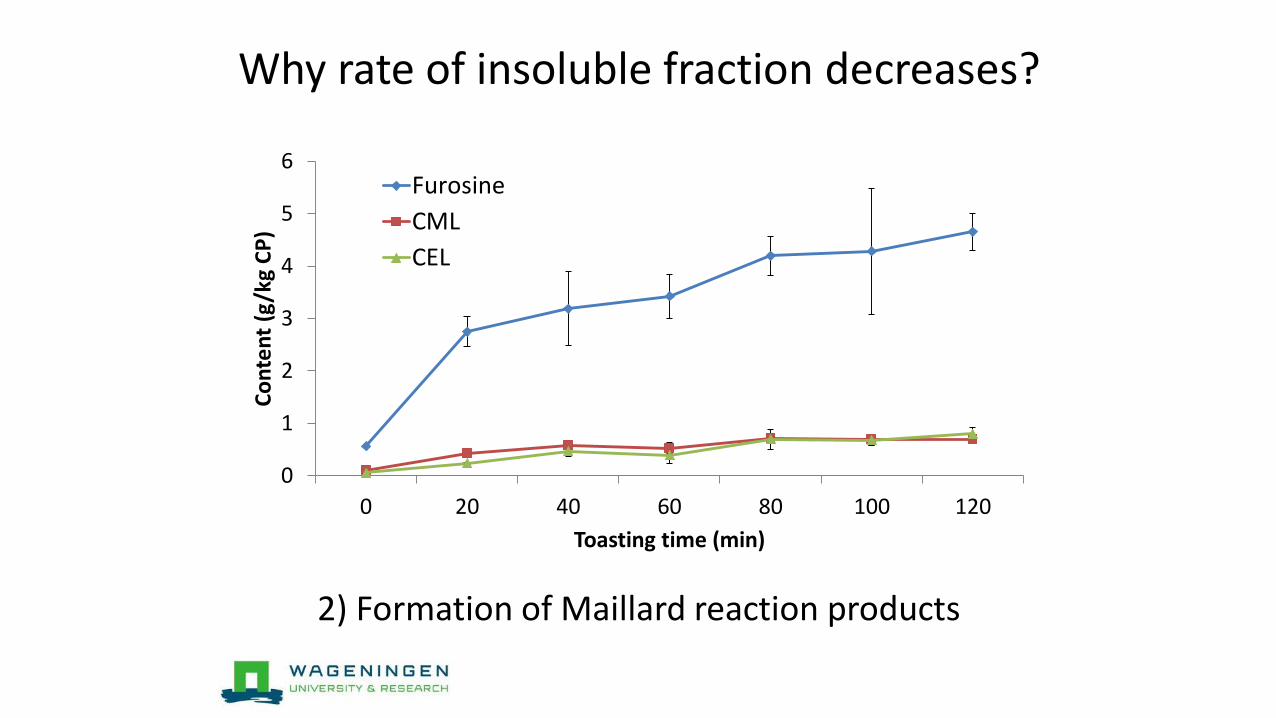
Why rate of insoluble fraction decreases?
2) Formation of Maillard reaction products
0
1
2
3
4
5
6
0 20 40 60 80 100 120
Co
nte
nt
(g/k
g C
P)
Toasting time (min)
Furosine
CML
CEL
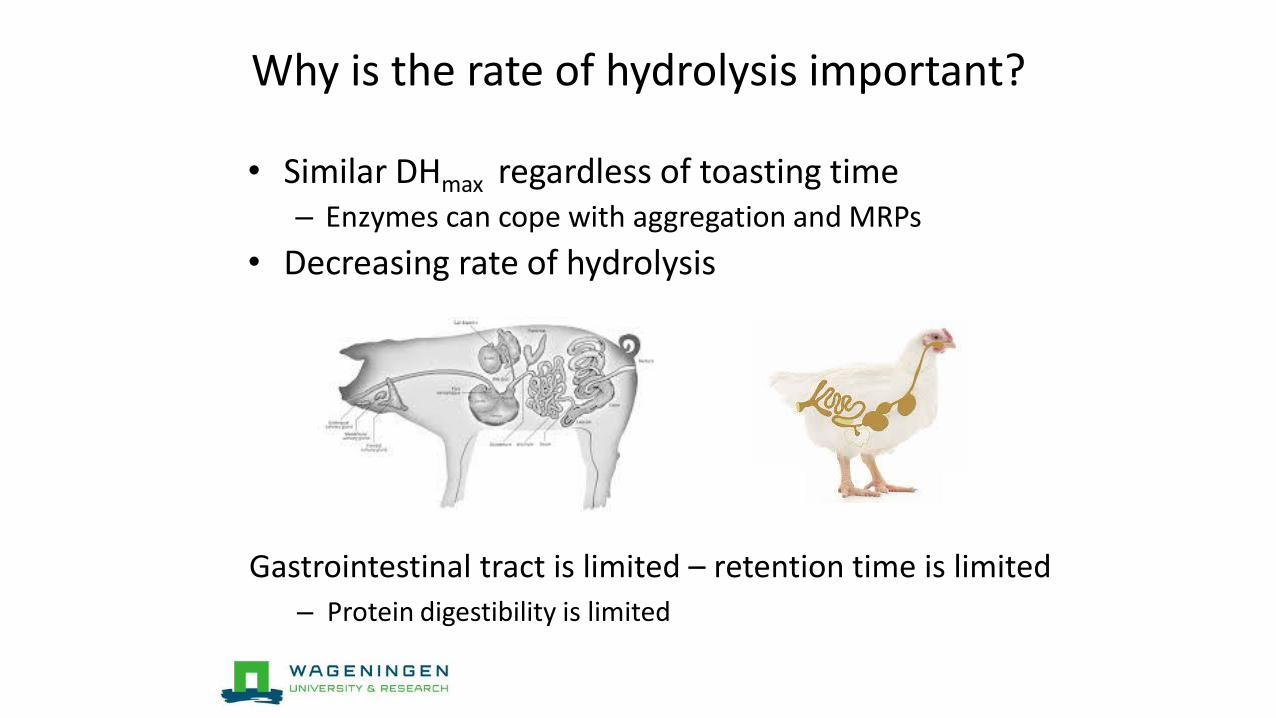
Why is the rate of hydrolysis important?
• Similar DHmax regardless of toasting time– Enzymes can cope with aggregation and MRPs
• Decreasing rate of hydrolysis
Gastrointestinal tract is limited – retention time is limited
– Protein digestibility is limited
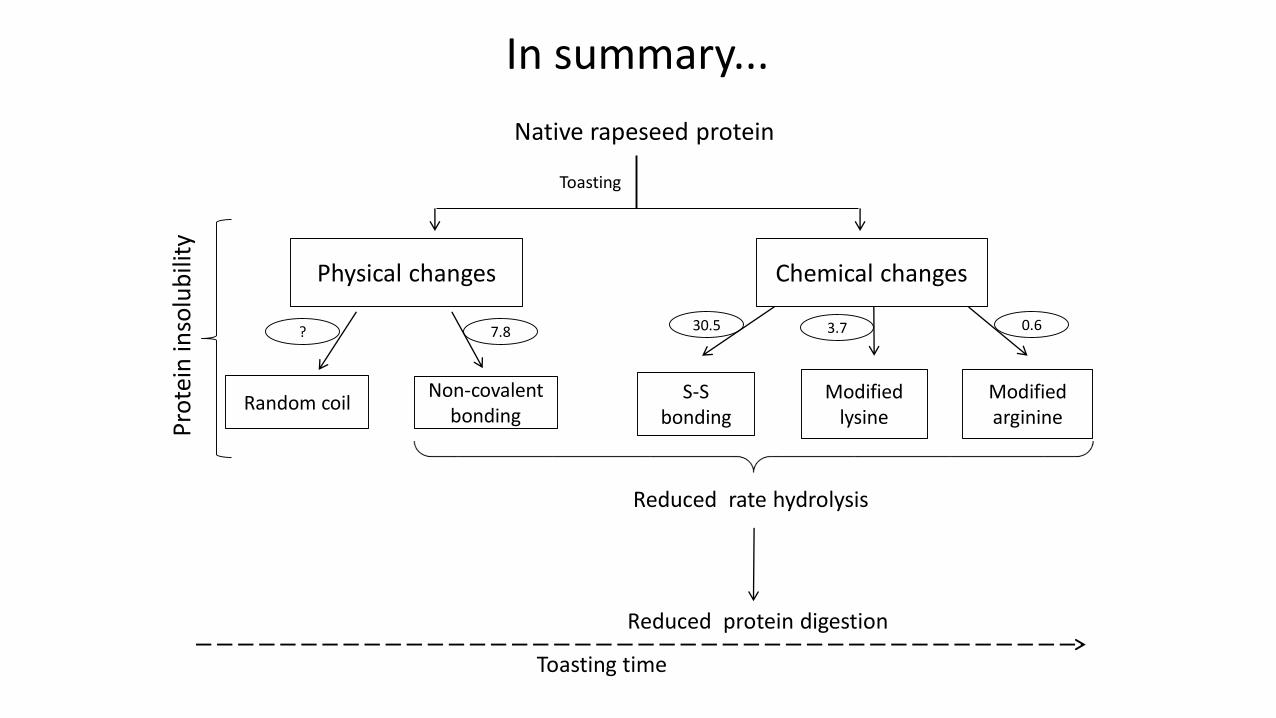
In summary...
Native rapeseed protein
Toasting
Physical changes Chemical changes
Random coilNon-covalent
bonding
?
Modified lysine
3.77.8 30.5
S-S bonding
Modified arginine
0.6
Reduced protein digestion
Toasting time
Pro
tein
inso
lub
ility
Reduced rate hydrolysis
IPOP Customised Nutrition
Acknowledgements
In conclusion
• Rates physical changes > chemical changes
• Extent of hydrolysis insoluble proteins 1.4-fold higher than soluble proteins
• Rate of hydrolysis soluble proteins 3-9 faster than insoluble proteins
• Linear decrease in rate of protein hydrolysis
– Formation of disulphide bonds
– Formation of Maillard reaction products
Tetske Hulshof
• Processing influence on protein digestion and post-absorptive amino acid utilization in growing pigs
Processing influence on protein digestion
and post-absorptive amino acid utilisation
in growing pigs
Protein for Life
October 24, 2016
Tetske Hulshof, Thomas van der Poel, Wouter Hendriks,
and Paul Bikker
Effects of processing
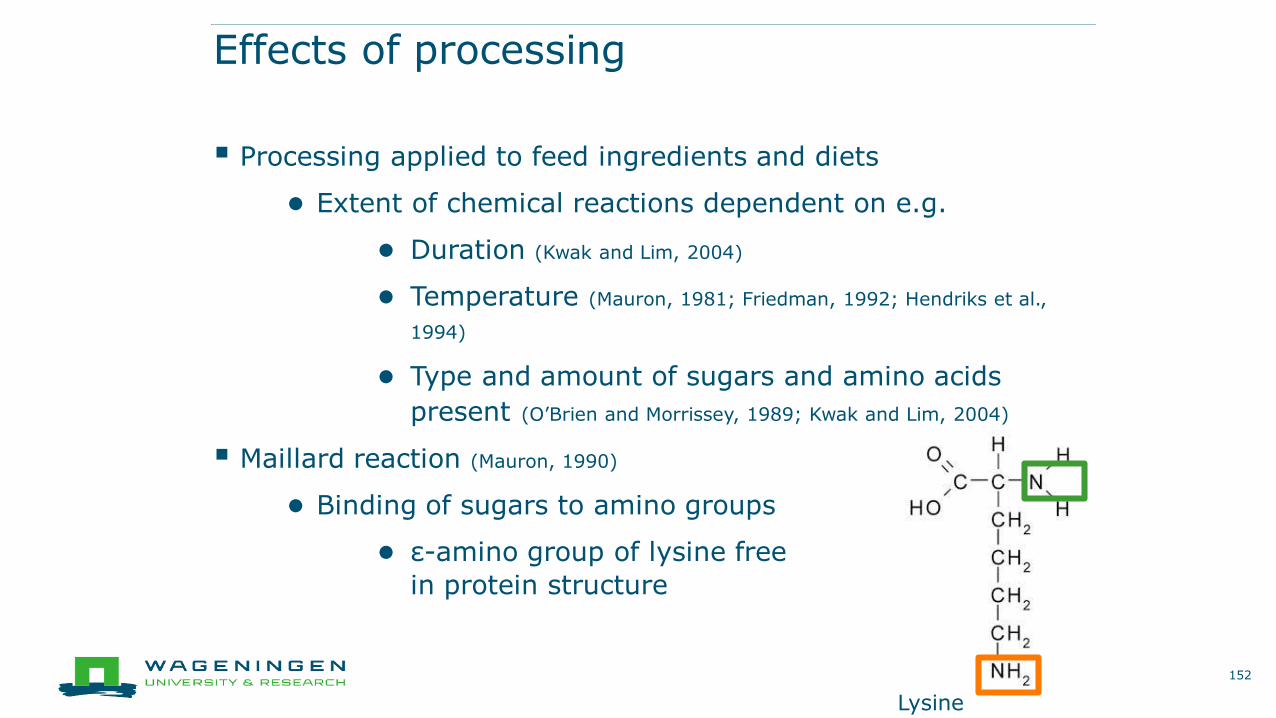
Processing applied to feed ingredients and diets
● Extent of chemical reactions dependent on e.g.
● Duration (Kwak and Lim, 2004)
● Temperature (Mauron, 1981; Friedman, 1992; Hendriks et al.,
1994)
● Type and amount of sugars and amino acids
present (O’Brien and Morrissey, 1989; Kwak and Lim, 2004)
Maillard reaction (Mauron, 1990)
● Binding of sugars to amino groups
● ε-amino group of lysine free
in protein structure
152
Lysine
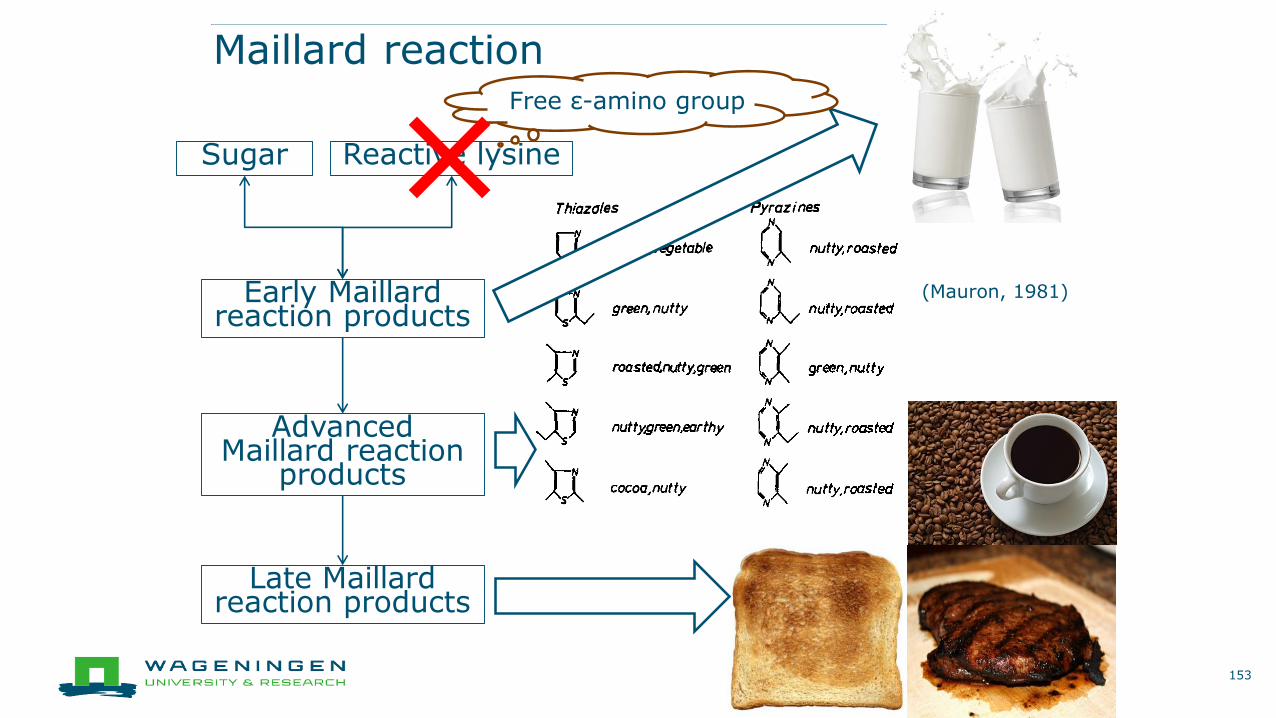
Maillard reaction
153
Reactive lysineSugar
Early Maillard reaction products
Advanced Maillard reaction
products
Late Maillard reaction products
(Mauron, 1981)
Free ε-amino group
×
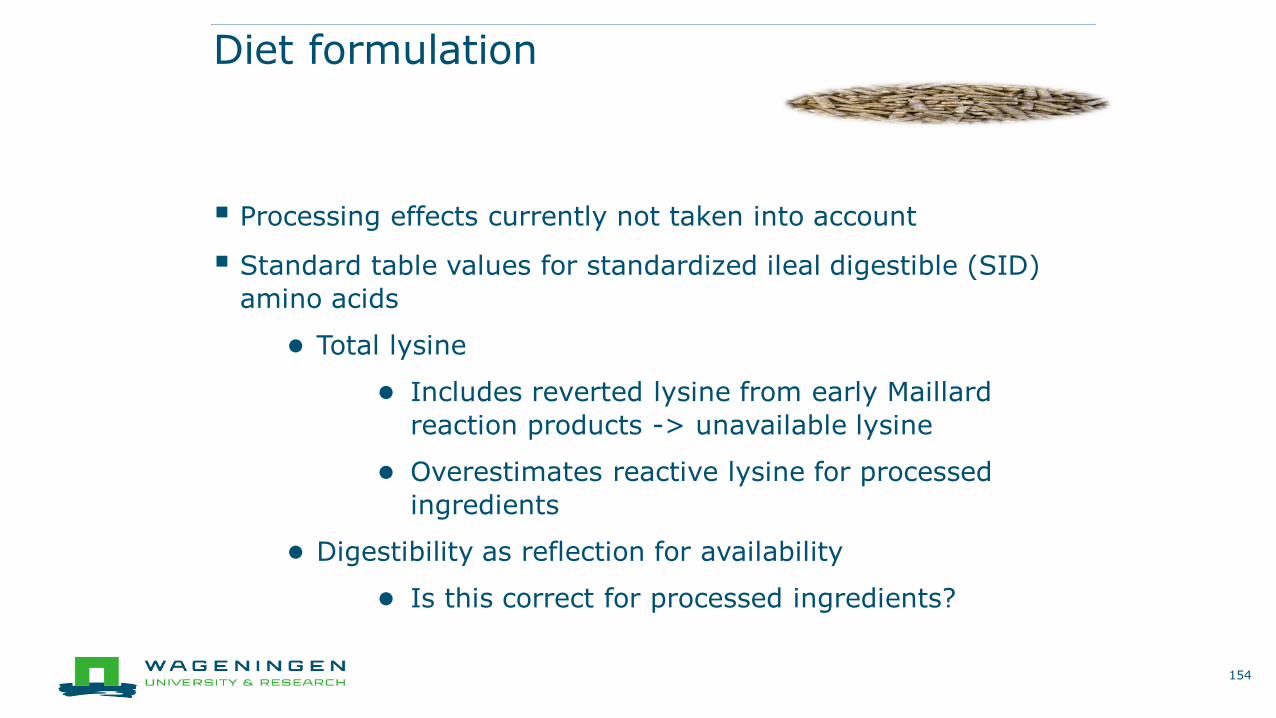
Diet formulation
Processing effects currently not taken into account
Standard table values for standardized ileal digestible (SID)
amino acids
● Total lysine
● Includes reverted lysine from early Maillard
reaction products -> unavailable lysine
● Overestimates reactive lysine for processed
ingredients
● Digestibility as reflection for availability
● Is this correct for processed ingredients?
154
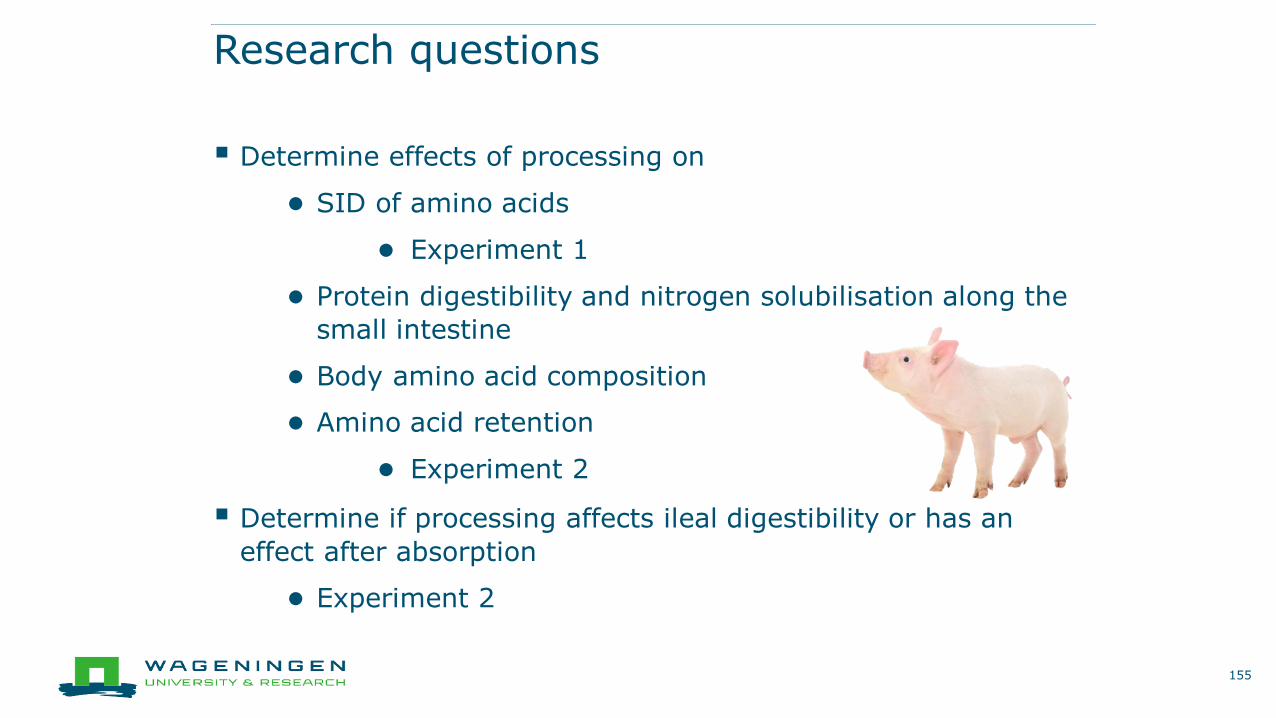
Research questions
Determine effects of processing on
● SID of amino acids
● Experiment 1
● Protein digestibility and nitrogen solubilisation along the
small intestine
● Body amino acid composition
● Amino acid retention
● Experiment 2
Determine if processing affects ileal digestibility or has an
effect after absorption
● Experiment 2
155
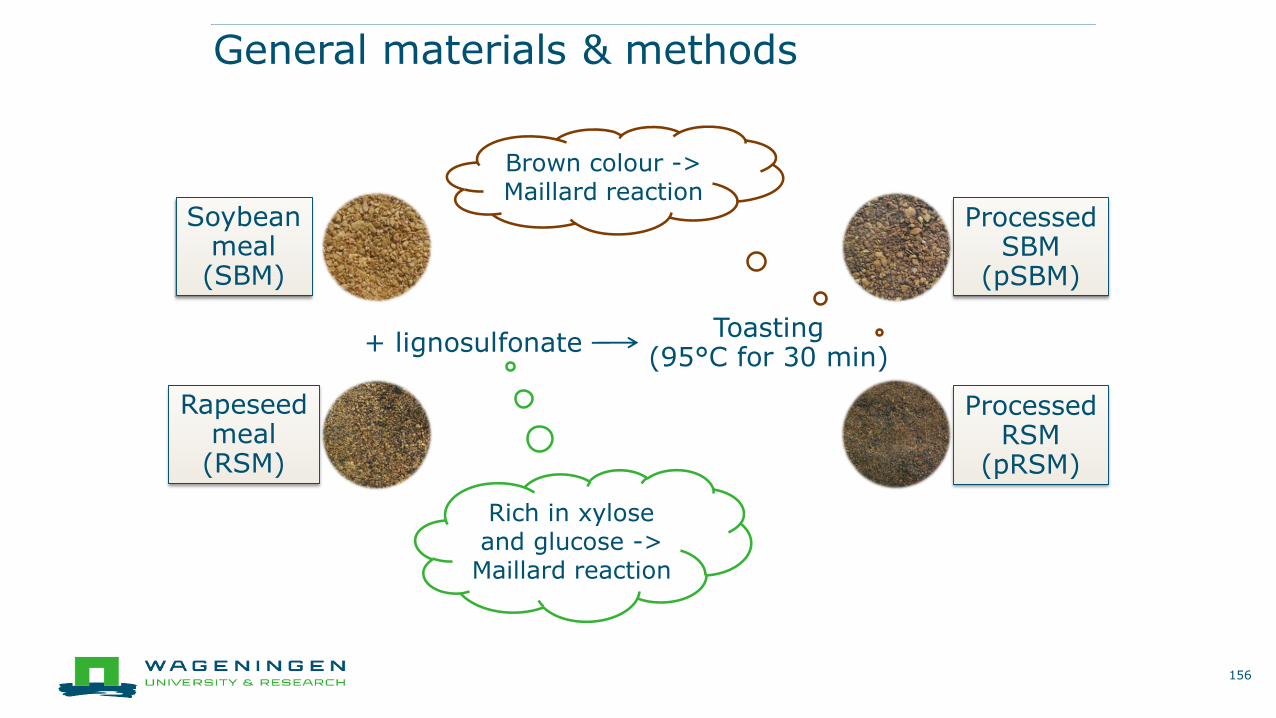
General materials & methods
156
Soybean meal(SBM)
Rapeseed meal(RSM)
+ lignosulfonateToasting
(95°C for 30 min)
Rich in xylose and glucose ->
Maillard reaction
Processed SBM
(pSBM)
Processed RSM
(pRSM)
Brown colour ->Maillard reaction
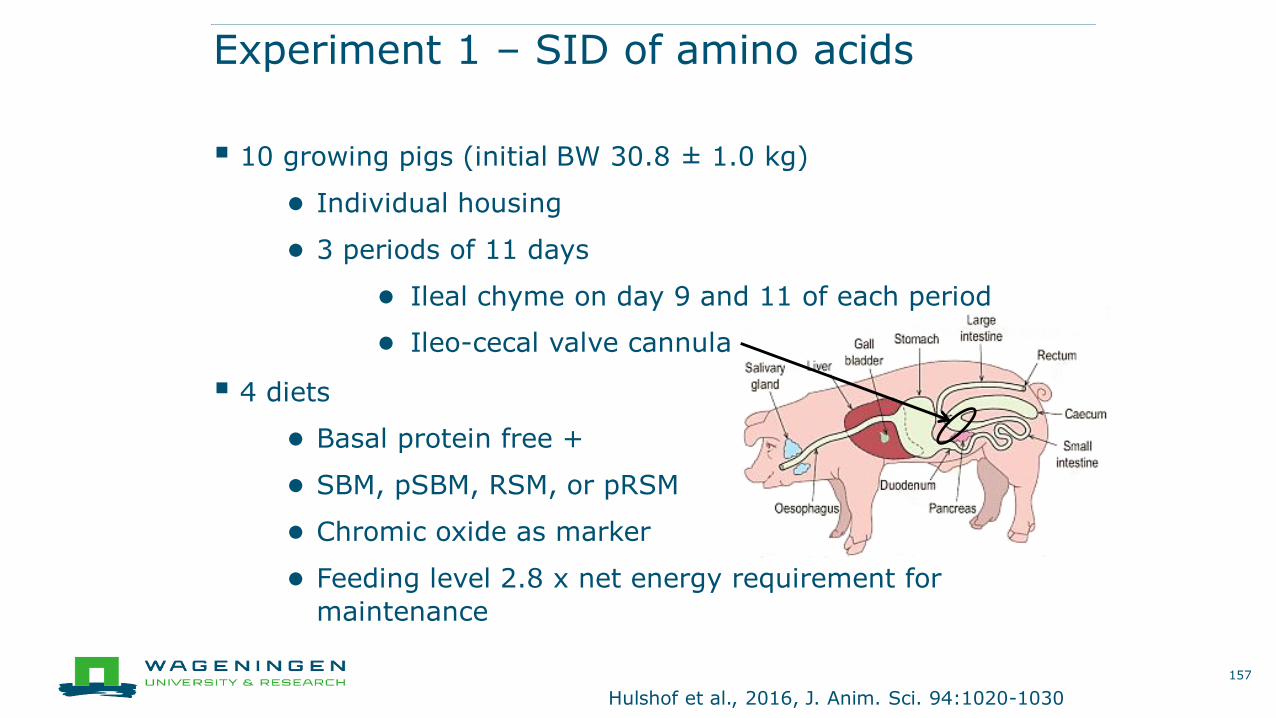
Experiment 1 – SID of amino acids
10 growing pigs (initial BW 30.8 ± 1.0 kg)
● Individual housing
● 3 periods of 11 days
● Ileal chyme on day 9 and 11 of each period
● Ileo-cecal valve cannula
4 diets
● Basal protein free +
● SBM, pSBM, RSM, or pRSM
● Chromic oxide as marker
● Feeding level 2.8 x net energy requirement for
maintenance
157
Hulshof et al., 2016, J. Anim. Sci. 94:1020-1030
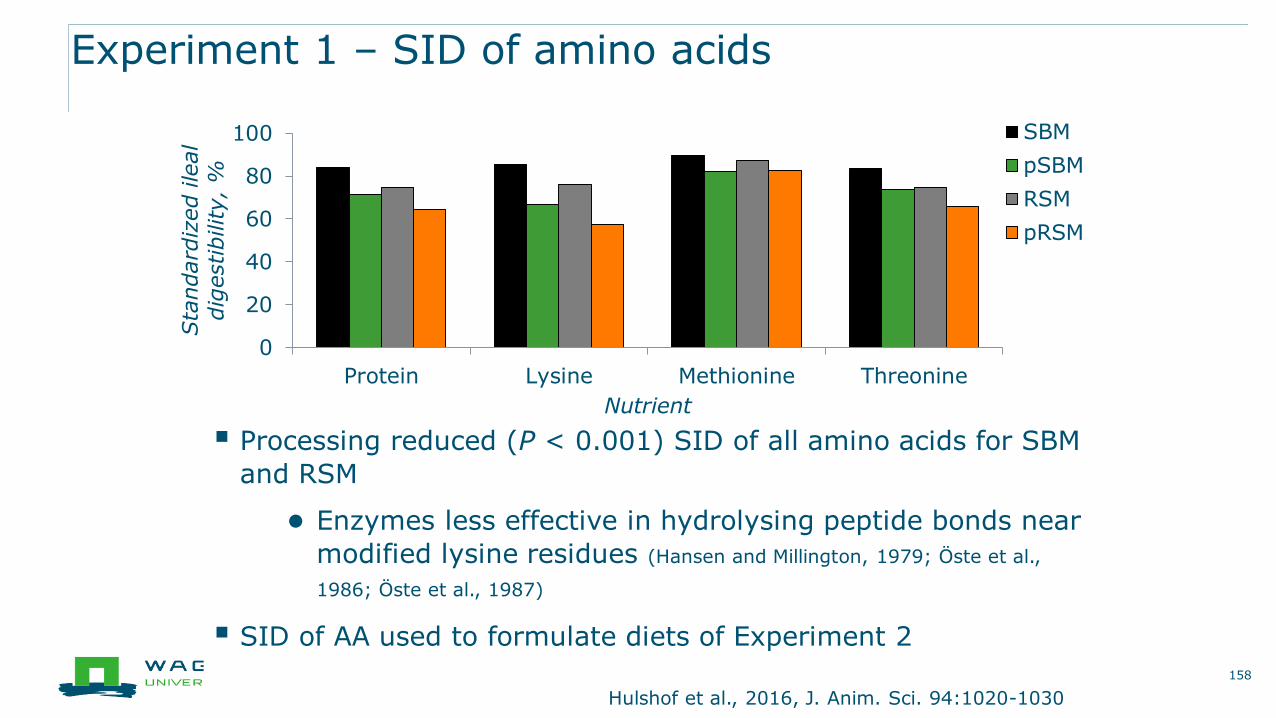
Experiment 1 – SID of amino acids
Processing reduced (P < 0.001) SID of all amino acids for SBM
and RSM
● Enzymes less effective in hydrolysing peptide bonds near
modified lysine residues (Hansen and Millington, 1979; Öste et al.,
1986; Öste et al., 1987)
SID of AA used to formulate diets of Experiment 2
158
0
20
40
60
80
100
Protein Lysine Methionine Threonine
Sta
ndard
ized ile
al
dig
estibility, %
Nutrient
SBM
pSBM
RSM
pRSM
Hulshof et al., 2016, J. Anim. Sci. 94:1020-1030
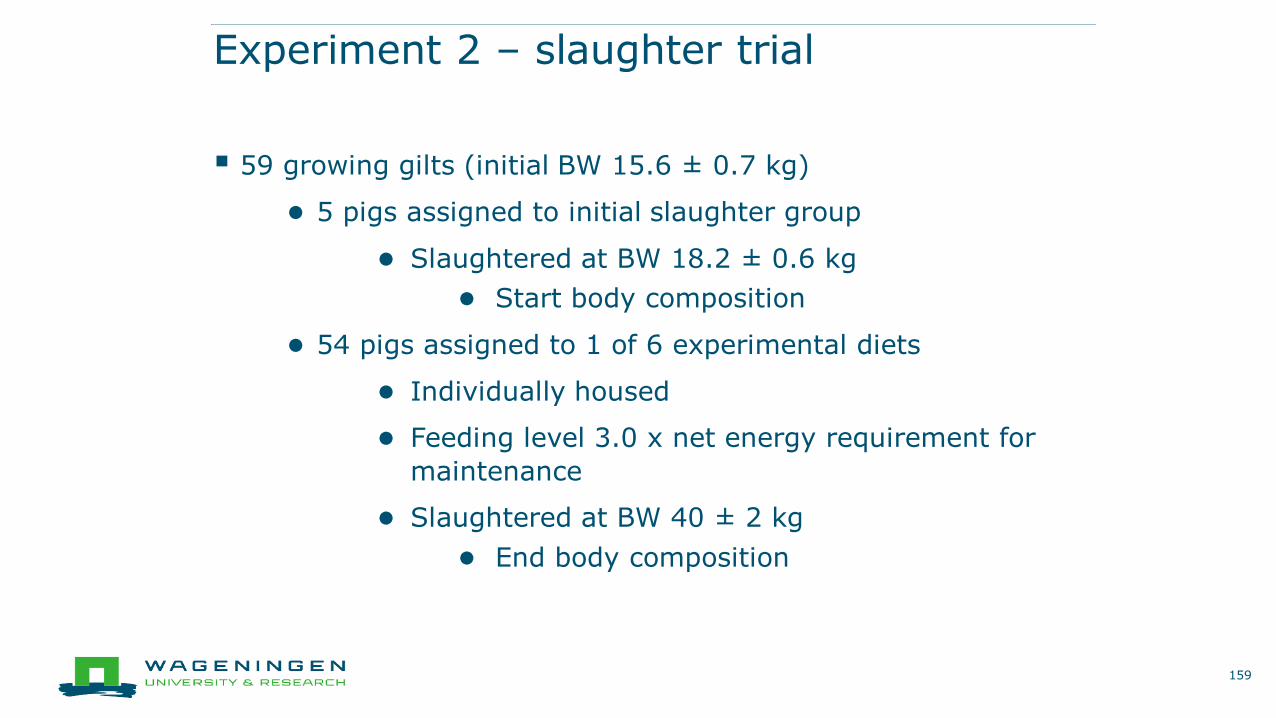
Experiment 2 – slaughter trial
59 growing gilts (initial BW 15.6 ± 0.7 kg)
● 5 pigs assigned to initial slaughter group
● Slaughtered at BW 18.2 ± 0.6 kg
● Start body composition
● 54 pigs assigned to 1 of 6 experimental diets
● Individually housed
● Feeding level 3.0 x net energy requirement for
maintenance
● Slaughtered at BW 40 ± 2 kg
● End body composition
159
Experiment 2 – slaughter trial
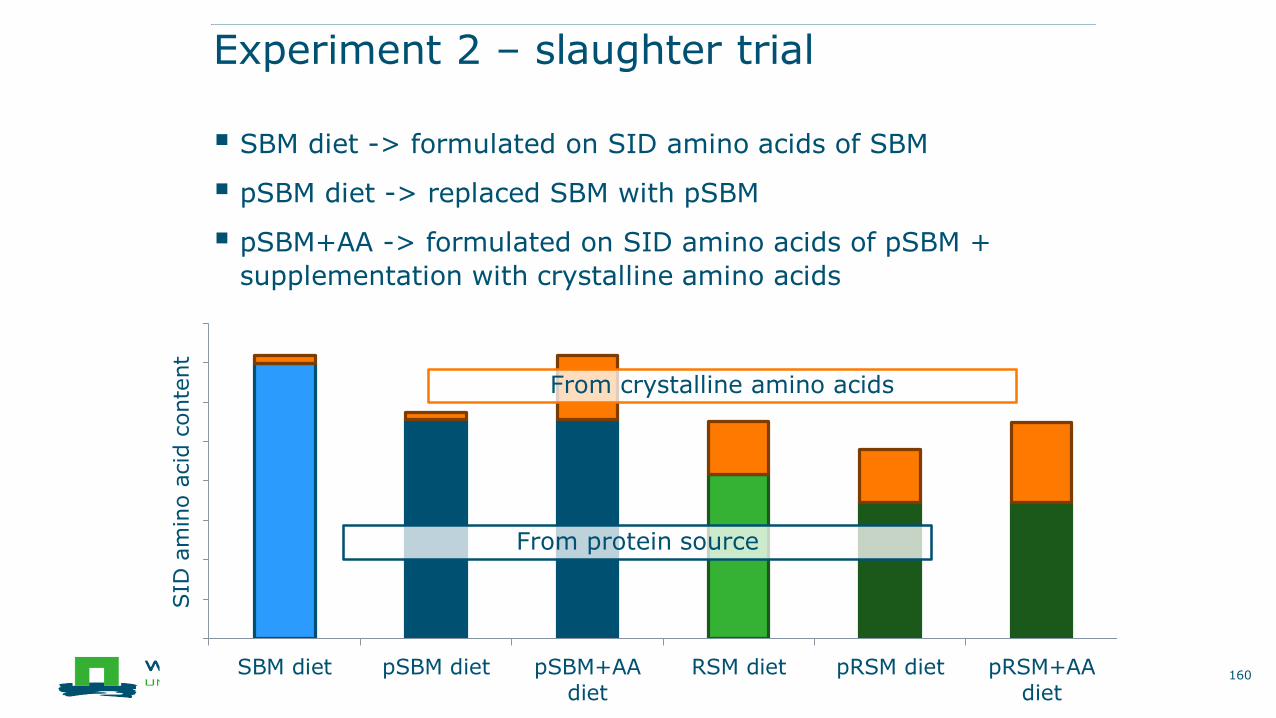
SBM diet -> formulated on SID amino acids of SBM
pSBM diet -> replaced SBM with pSBM
pSBM+AA -> formulated on SID amino acids of pSBM +
supplementation with crystalline amino acids
160
0
10
20
30
40
50
60
70
80
SBM diet pSBM diet pSBM+AAdiet
RSM diet pRSM diet pRSM+AAdiet
From crystalline amino acids
SID
am
ino a
cid
conte
nt
From protein source
Experiment 2 – slaughter trial
161
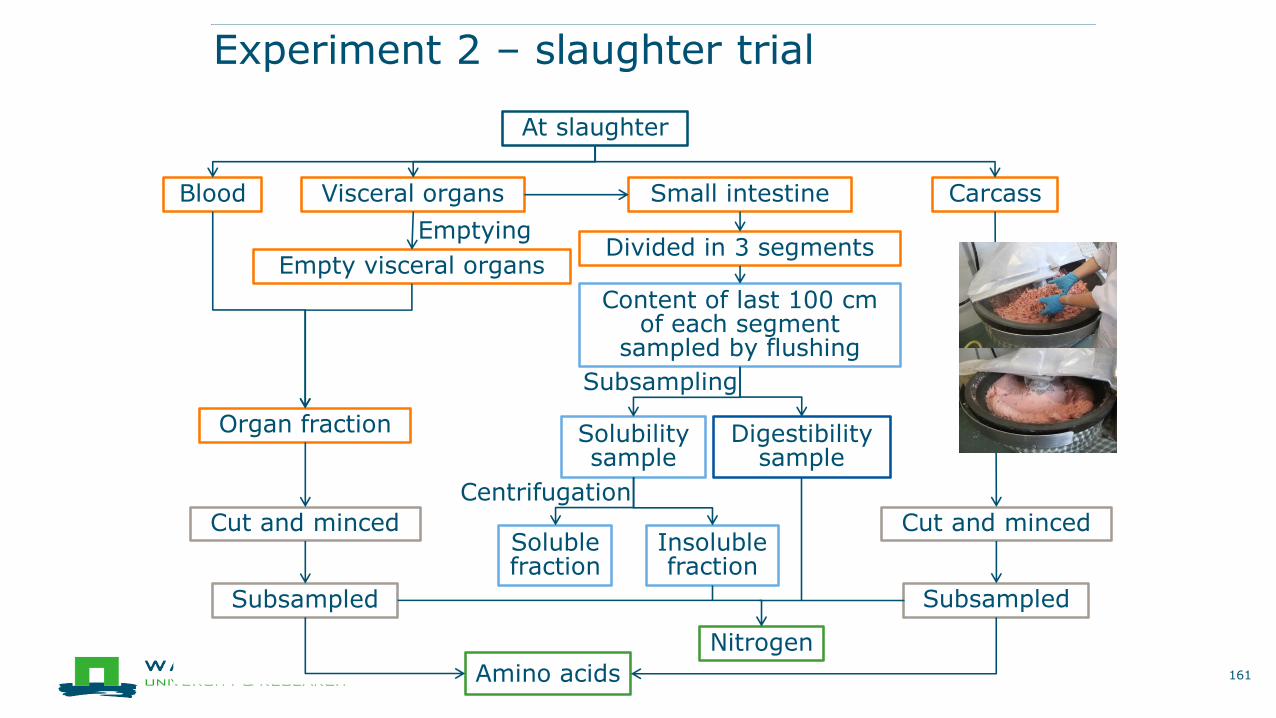
At slaughter
Blood Visceral organs
Emptying
Cut and minced
Subsampled
Organ fraction
Carcass
Empty visceral organs
Cut and minced
Subsampled
Amino acids
Nitrogen
Small intestine
Divided in 3 segments
Content of last 100 cm of each segment
sampled by flushing
Digestibility sample
Solubility sample
Subsampling
Centrifugation
Insoluble fraction
Soluble fraction
Experiment 2 – slaughter trial
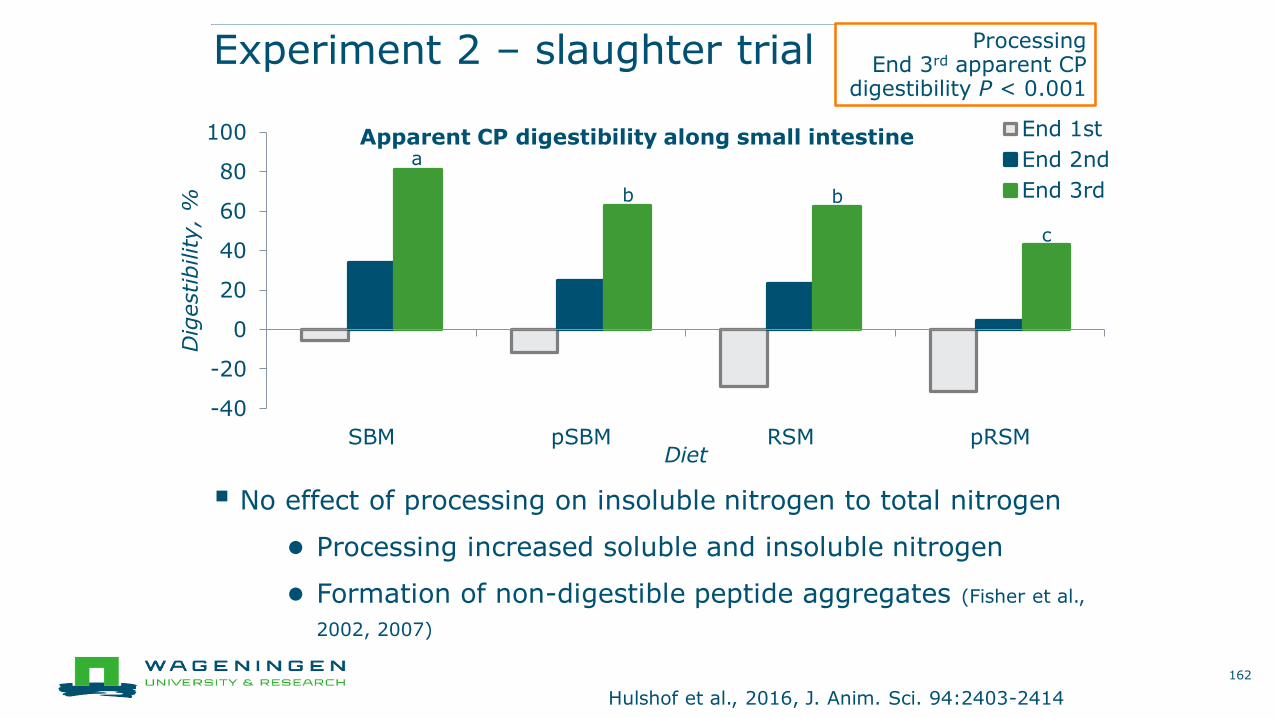
No effect of processing on insoluble nitrogen to total nitrogen
● Processing increased soluble and insoluble nitrogen
● Formation of non-digestible peptide aggregates (Fisher et al.,
2002, 2007)
162
-40
-20
0
20
40
60
80
100
SBM pSBM RSM pRSM
Dig
estibility,
%
Diet
Apparent CP digestibility along small intestine End 1st
End 2nd
End 3rd
a
b b
c
ProcessingEnd 3rd apparent CP
digestibility P < 0.001
Hulshof et al., 2016, J. Anim. Sci. 94:2403-2414
Experiment 2 – slaughter trial
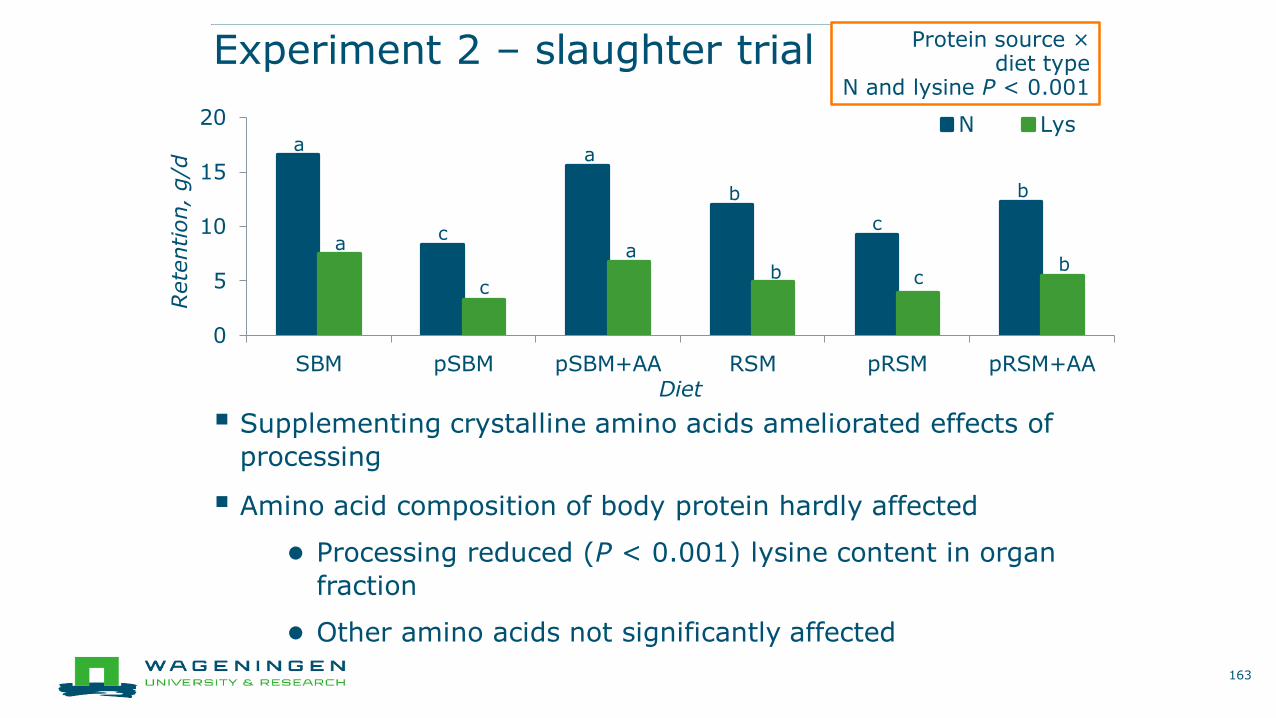
Supplementing crystalline amino acids ameliorated effects of
processing
Amino acid composition of body protein hardly affected
● Processing reduced (P < 0.001) lysine content in organ
fraction
● Other amino acids not significantly affected
163
0
5
10
15
20
SBM pSBM pSBM+AA RSM pRSM pRSM+AA
Rete
ntion, g/d
Diet
N Lys
Protein source ×diet type
N and lysine P < 0.001
a
c
a
b
c
b
a
c
ab c
b
Implications
Processing affects SID of all amino acids
● Especially lysine
● Lysine first limiting for growth
● If diets not adjusted
● Reduced performance -> reduced profit of farmer
Supplementing on SID amino acid basis ameliorated effects of
processing
● Application for practise
● Effects of processing on SID should be known
164
Take home message
Processing reduced
● SID of amino acids
● Protein digestibility along small intestine
● Not by affecting nitrogen solubility
● Amino acid retention
● Ameliorated by supplementing crystalline amino
acids
Body amino acid composition was hardly affected
Thank you for your attention!
165
Part of Wageningen UR IPOP Customized Nutrition program
Financially supported by