presentation to regents the john troprnan,...
TRANSCRIPT
Presentation to the Regents
The Committee for the Economic Status of the Faculty
John Troprnan, Chair
June 1993
Introduction
The Committee on the Economic Status of the faculty has focused on a number of issues this past year, including the periodic health appraisal exam, the question of health benefits for gay and lesbian partners, gain sharing, and flexible benefits, among others. CESF has aiso participated in a Budget Study Committee, in conjunction with AAUP. In this report, we will stress three issues: salary, flexibility in types and delivery of compensation, and the Ad Hoc Faculty/Administration Committee on New Pay.
Executive Summary
* Salary -- CESF urges implementation of an appropriate salary program for this year
Flexibility in Compensation - CESF endorses the concept of flexibility in the creation and dispensation of total compensation packages
* The Ad Hoc Faculty/Administration Committee on New Pay -- CESF has formed a joint faculty/staff/administration committee to look into the total compensation package.
Salary
CESF believes wholeheartedly that a salary program is needed this year. Discussions with a range of campus officials as well as faculty suggest that this perspective is widely shared. We urge the Regents to continue support of such efforts, as expressed to the Committee in our meeting with you last fall.
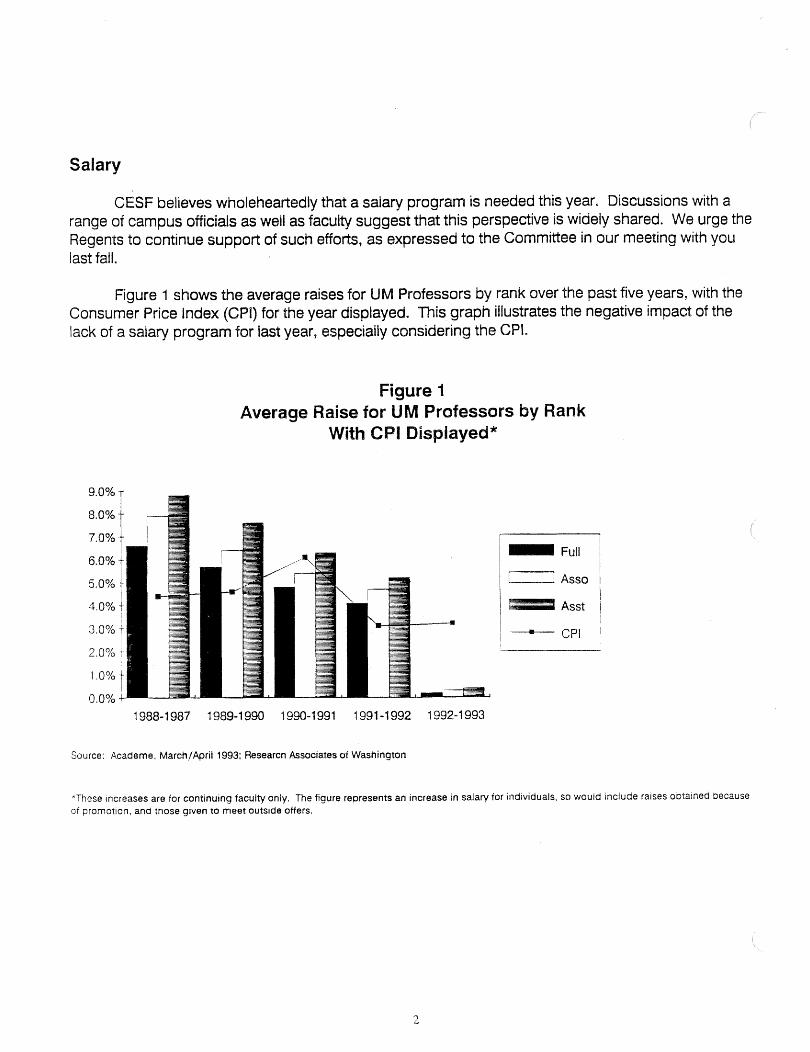
Figure 1 shows the average raises for UM Professors by rank over the past five years, with the Consumer Price Index (6PI) for the year displayed. This graph illustrates the negative impact of the lack of a salary program for last year, especially considering the CPI.
Figure 1 Average Raise for UM Professors by Rank
With CPI Displayed*
Source: Academe, March/&rii 1993; Research Associates sf Washington
Full 1
- CPI
"These Increases are for continuing faculty only. TRe figure represents an increase in salary for individuals, so would include raises obtained because of promotion, and those given to meet outside offers.
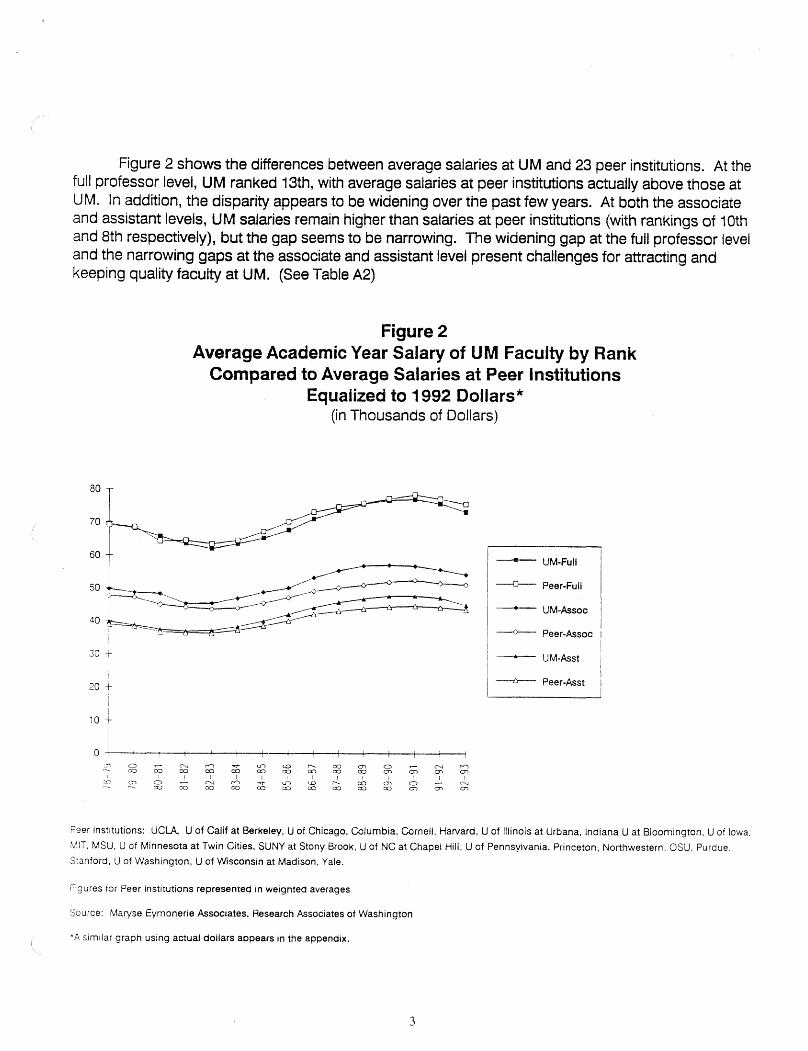
Figure 2 shows the differences between average salaries at UM and 23 peer institutions. At the full professor level, UM ranked 13th, with average salaries at peer institutions actually above those at UM. In addition, the disparity appears to be widening over the past few years. At both the associate and assistant levels, UM salaries remain higher than salaries at peer institutions (with rankings of 10th and 8th respectively), but the gap seems to be narrowing. The widening gap at the full professor level and the narrowing gaps at the associate and assistant level present challenges for attracting and keeping quality faculty at UM. (See Table A2)
Figure 2 Average Academic Year Salary of UM Faculty by Rank
Compared to Average Salaries at Peer institutions Equalized to 1992 Dollars*
(in Thousands of Dollars)
---- UM-FuII
--a-- Peer-Full
-- UM-Assoc
--+-- Peer-Assoe I I 1
Peer Institutions: UCLA, U of Calif at Berkeley, U of Chicago, Columbia, Cornell, Harvard, U of Illinois at Urbana, Indiana U at Bloorn~ngton, C1 of Iowa,
MIT, MSU, U of Minnesota at Twin Cities, SUNY at Stony Brook, U ~f NC at Chapel Hill. U of Pennsylvania, Princeton, Northwestern, OSU, Purdue.
Stanford. U of Washington, U of Wiscons~n at Madison, Yale.
Figures tor Peer Institutions represented in weighted averages
Source: Maryse Eymonerie Associates, Research Associates of Washington
"4 similar graph using actual dollars appears ~n the appendix.

Flexibility in Compensation
We support the idea of flexibility in the total compensation package. Several different plans are being considered, so flexibility may emerge as some type of flexible benefits plan, or take other forms. While we obviously will have no recommendation on any specific plan until we have a chance to review it, the idea of flexibility is seen as an important tool that will lead to a better and more individualized total compensation plan for faculty.
Over the next few years, there may be some experimentation with different types of pay vehicles by various units. CESF supports the idea of experimental pay plans, and has offered to make suggestions about individual plans while they are still at the planning stage, and as they move into implementation. We do, however, strongly feel that any experimental plan should include an evaluation component, and that information on the outcome of the experiment be ava~lable to other units, so that we can all learn from the experience.
Ad Hoc Faculty/Administration Committee on New Pay
We are pleased to announce that CESF has developed an ad hoc committee with the administration to discuss new types of pay and the total compensation package. The purpose of this commlhee is to review some of the newer thinking about pay, to consider how the Univers~ty actually pays people currently, and to make recommendations to faculty and administration about poss~ble new poiicies that may be appropriate for consideration.

Appendix
Figures and Tables in the Appendix are similar to those created in past years which compare UM faculty with those at peer institutions. This type of comparison has traditionally been part of CESF's mission.
Figures and Tables created for the Appendix incorporate the following information and sources:
Salaries and compensation for Peer Institutions represented in weighted averages.
Peer Institutions: UCLA, U of Calif at Berkeley, U of Chicago, Columbia, Cornell, Harvard, U of Illinois at Urbana, Indiana U at Bloomington, U of Iowa, MIT, MSU, U of Minnesota at Twin Cities, SUNY at Stony Brook, U of NC at Chapel Hill, U of Pennsylvania, Princeton, Northwestern, OSU, Purdue, Stanford, U of Washington, U of Wisconsin at Madison, Yale.
Sources: Maryse Eymonerie Associates Research Associates of Washington UM Faculty Salary Analysis
List of Figures and Tables:
Figure A-1 Average Salary of UM Faculty by Rank -- Actual Dollars
Figure A-2 1992-1 993 Salary Ranges for Full Professors
Figure A-3 1992-1 993 Salary Ranges for Associate Professors
Figure A-4 1992-1 993 Salary Ranges for Assistant Professors
Table A-I Average 1992-1 993 Salary and Total Compensation for UM and Peers
Table A-2 Average Salary in Descending Rank Order
Table A-3 Average Total Compensation in Descending Rank Order
Table A-4 UM Rank Among Peers by Professorial Category
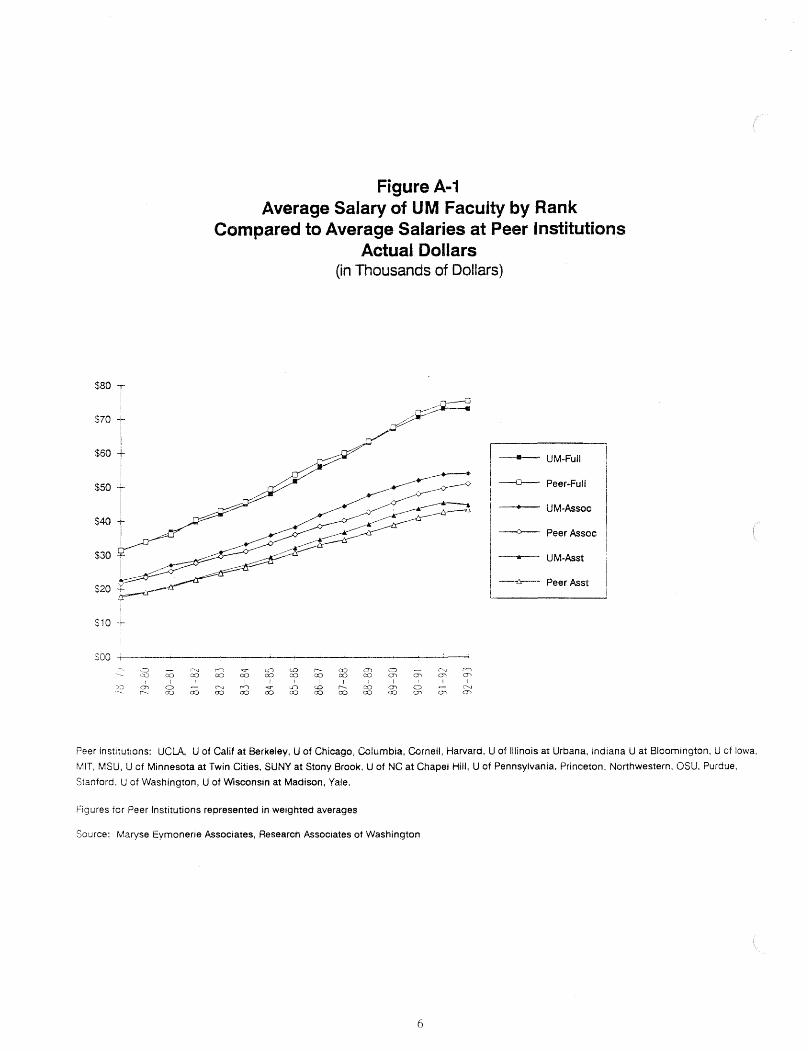
Figure A-1 Average Salary of UM Faculty by Rank
Compared to Average Salaries at Peer Institutions Actual Dollars
(in Thousands of Dollars)
1 ---+-- Peer-Full I
---+-- Peer Ass06 - UM-&st
1 - Peer Asst L
Peer Institutions: UCU, U of Calif at Berkeley, U of Chiago, Columbia, Gsrnell, Harvard, U of Illinois at Urbana, Indiana U at Bloomington, U of Iowa,
MIT, M S U , U of Minnesota at Twin Cities, SUNY at Stony Brook, U of NC at Chapel Hill, U of Pennsylvania, Princeton, Northwestern, OSU, Purdue,
Stanford, U of Washington, U of Wisconsin at Madison, Yale.
Figures for Peer Institutions represented in weighted averages
Source: Maryse Eymoner~e Associates, Research ksoc~ates of Washington

Figure A-2: 1992-1 993 Salary Ranges for Full Professors UM and Peer Institutions
9 Month Faculty Only
--c+-- Peer Full
Source: Maryse Eyrnsner~e Associates, LIM Faculty Salary halysis

Figure A-3: 1992-1 993 Salary Ranges for Associate Professors UM and Peer institutions
9 Month Faculty Only
1 - VM Assoc 1 I 1 -o-- Peer lirros 1
S ~ u r c e : Maryse Eymonerie Associates,, UM Faculty Salary Analysis;

Figure A-4: 1992-1 993 Salary Ranges for Assistant Professors UM and Peer institutions
9 Month Faculty Only
1 ii Peer h s t
s I 0', I m ' m I 0 ' m ' 0 7 ' m & O ' m s g- g-5- 85- g-5- g-5- g-5 g-5 8-5- g.2 2-E- E-E- z - 0'- O W OLD O W Or. o m o m r?
r?- -e-- cr)* 0- r-+ m e cn- 0 - '= ~2 - w 3 @ t;s - - - - *y*;3*-z*- a z a o
Source: Maryse Eymonerie Associates,, UM Faculty Salary Analysis
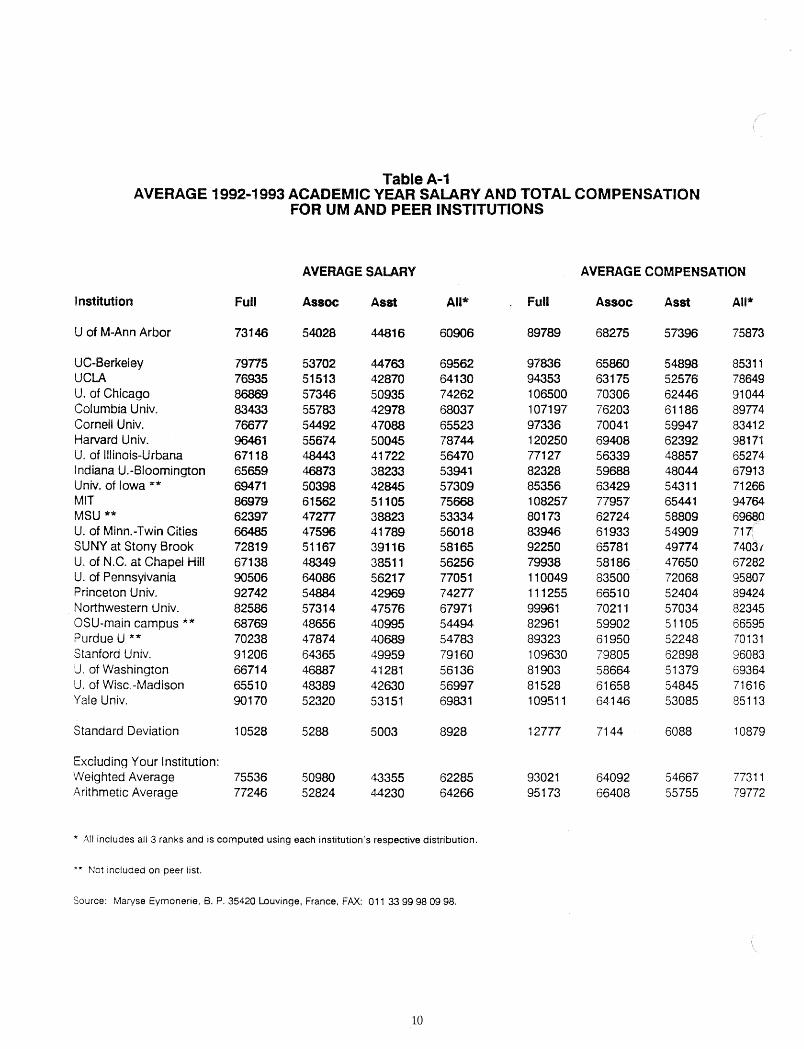
Table A-1 AVERAGE 1992-1993 ACADEMIC YEAR SALARY AND TOTAL COMPENSATION
FOR UM AND PEER INSTITUTIONS
N E M G E SAWRIB AVERAGE GOMPENSATIQN
Institution Full Assoc Asst All* Full Assoc Asst All*
U of M-Ann Arbor 731 46 5428 4-481 6 60906 89789 6827% 57396 75873
UG-Berkeley uc&A U. of Chicago Columbia Univ. Cornell Univ. Harvard Cdniv. U. of Illinois-Urbana Indiana C1.-Bloomiwgton Univ, of Iowa ** MIT MSU *" U. of Minn.-Twin Cities SUNM at Stony Brook U. of N.C. at Chapel Hill U. of Pennsyivania Princeton Univ. Northwestern Univ. OSU-main campus ** Purdue U ** Stanford Univ. U. of Washington U. of Wisc.-Madison Yale Univ.
Standard Deviation 10528 5288 5003 8928 12777 71 44 6088 1 0879
Excluding Your Institution: Weighted Average 75536 50980 43355 62285 93021 64092 54667 7731 9 Arithmetic Average 77246 52824 44230 64266 95 1 73 66408 55755 79772
* All includes all 3 ranks and is computed using each institution's respective distribution.
*" Not included on Deer list.
Source: Maryse Eymsner~e, 8. P. 35420 L~uvinge, France, FAX: 04 1 33 99 98 09 98.

Rank Full -
Table A-2 Average Salary in Descending Rank Order
for UM and 23 Selected Peers*
Assoc All Rank
'These figures are the same as those in Table A-1 for salary, but in descending rank order by professorial category. The figures at the full, associate and assistant level on any given line will, for the most part, be from several different universities represented in Table A-1 . For example, UM is 13th for full professors, 10th for associates, 8th for Assistants, and 13th overall.
Source: Maryse Eymonerre, 6. P. 35420 Louvinge, France, FAX: 01 I 33 99 98 09 98.
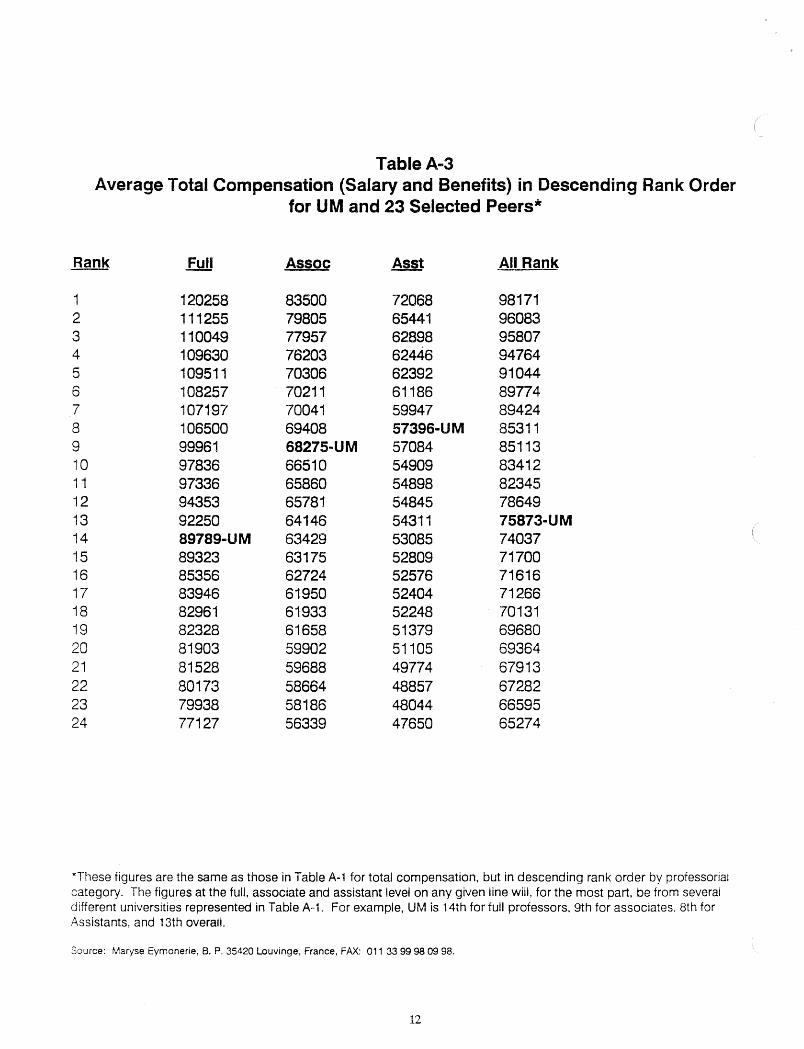
Table Am3 Average Total Compensation (Salary and Benefits) in Descending Rank Order
for UM and 23 Selected Peers*
Rank Full - Assoe All Rank
*These figures are the same as those in Table A-1 for total compensation, but in descending rank order by professorral category. The figures at the full, associate and assistant levei on any given line will, for the most part, be from several different universities represented in Table A-1. For example, UM is 14th for full professors, 9th for associates. 8th for Assistants, and 13th overall.
Source: Maryse Eymsnerie, €3, P. 35428 Louvinge, France, FAX: 01 1 33 99 98 09 98.

Table A 4 UM Ranking Compared to 23 Peers
Salary and Total Compensation for 1992-1 993
Fuii Professor Associate Professor Assistant Professor All Ranks
Salary Rank Total Compensation Rank
Source: Matyse Eymonene, 6. P. 35420 bouvinge, France, FAX: 01 9 33 99 98 09 98,