presentation to parks and environment committee · don’t include local effects of great lakes,...
TRANSCRIPT
Presentation to Parks and Environment CommitteeJanuary 29, 2013
Toronto’s Future Weather & Climate

Christopher Ll. Morgan, PhD
Program Manager, TEO
Justification for … and Purpose of the Study
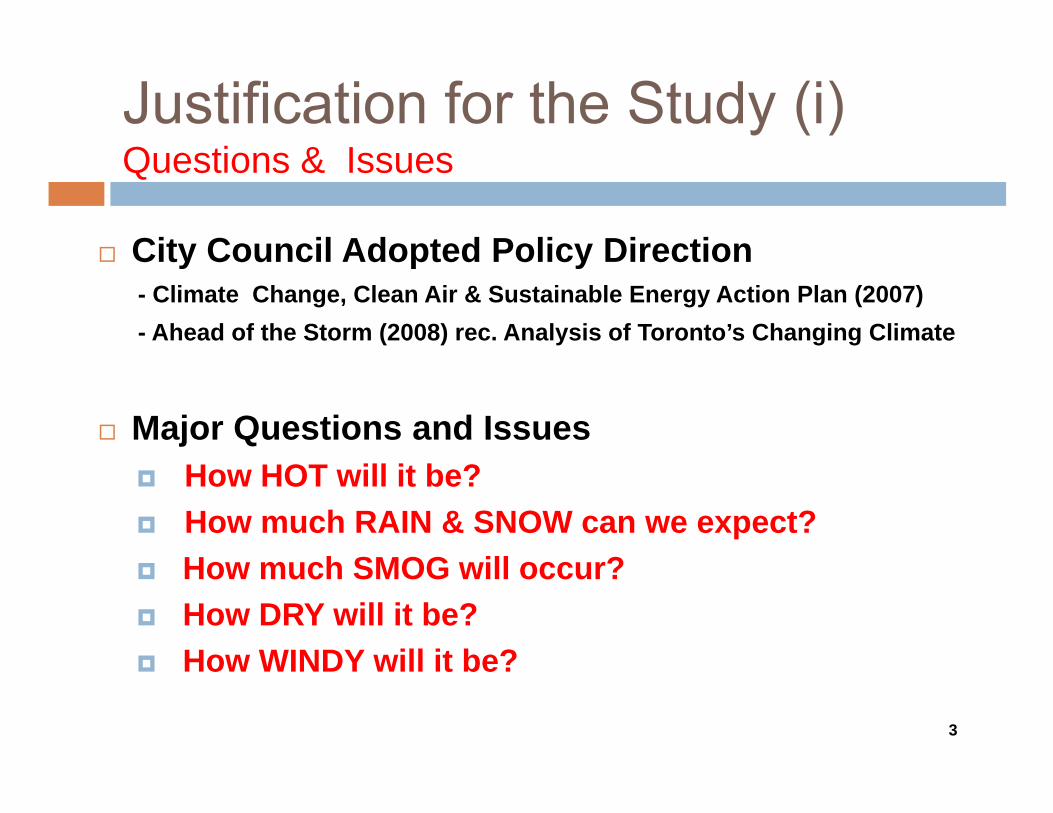
Questions & Issues
City Council Adopted Policy Direction- Climate Change, Clean Air & Sustainable Energy Action Plan (2007)
- Ahead of the Storm (2008) rec. Analysis of Toronto’s Changing Climate
Major Questions and IssuesHow HOT will it be?How much RAIN & SNOW can we expect?How much SMOG will occur?How DRY will it be?How WINDY will it be?
3
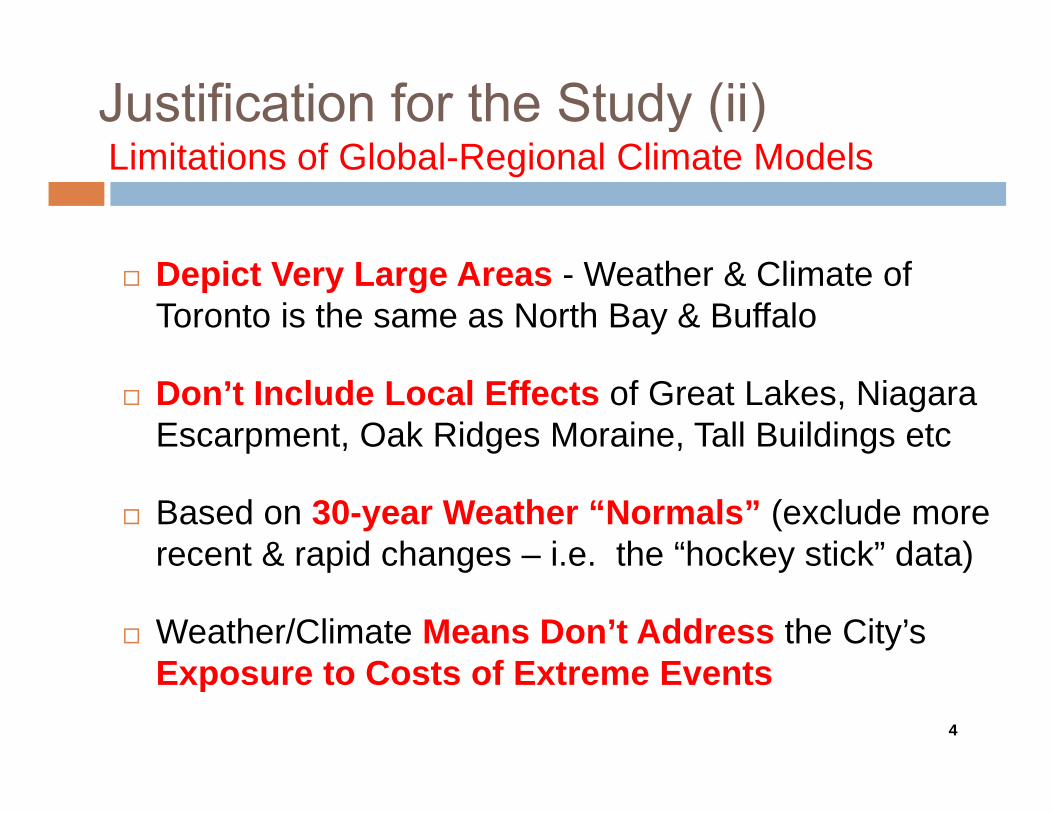
Limitations of Global-Regional Climate Models
Depict Very Large Areas - Weather & Climate of Toronto is the same as North Bay & Buffalo
Don’t Include Local Effects of Great Lakes, Niagara Escarpment, Oak Ridges Moraine, Tall Buildings etc
Based on 30-year Weather “Normals” (exclude more recent & rapid changes – i.e. the “hockey stick” data)
Weather/Climate Means Don’t Address the City’s Exposure to Costs of Extreme Events
4
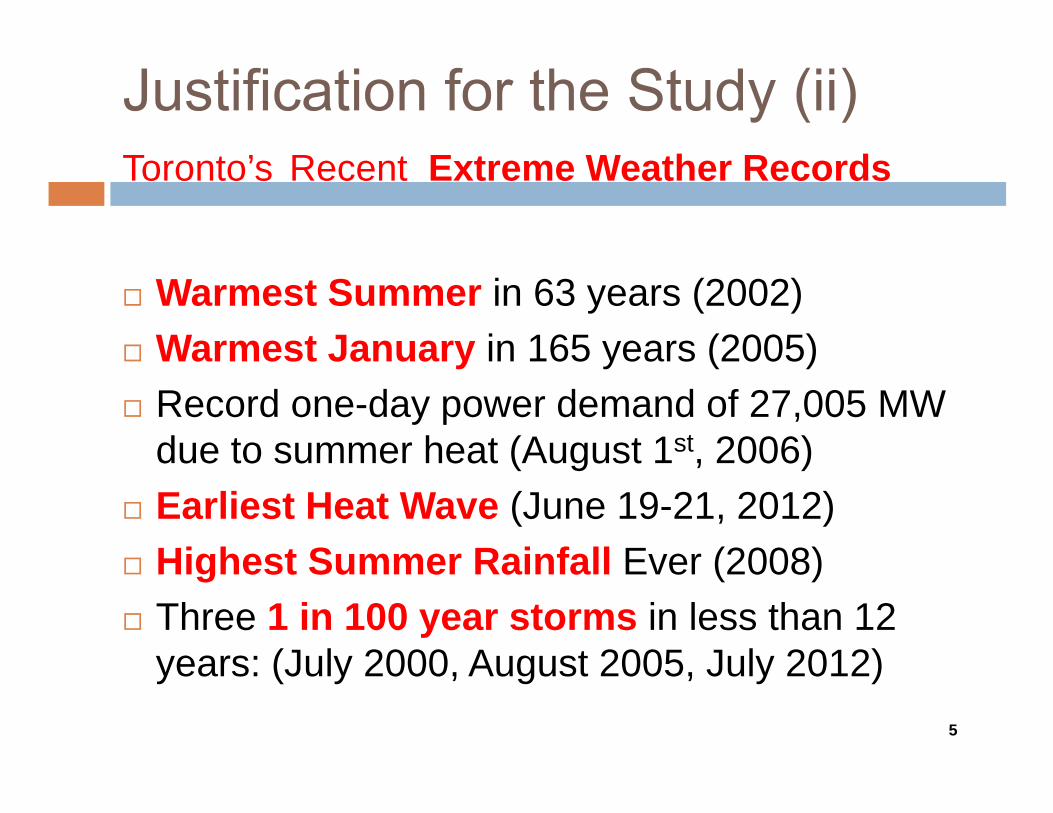
Warmest Summer in 63 years (2002)Warmest January in 165 years (2005)Record one-day power demand of 27,005 MW due to summer heat (August 1st, 2006)Earliest Heat Wave (June 19-21, 2012)Highest Summer Rainfall Ever (2008)Three 1 in 100 year storms in less than 12 years: (July 2000, August 2005, July 2012)
5
Toronto’s Recent Extreme Weather Records
New & Innovative Local Model Approach
Global Climate Models + Regional Climate Models + Local Weather Model (1km2 Cells)
SENES Consultants ran the computer models
ADVISORS & PEER REVIEW GROUP Environment Canada
Ontario Ministry of the Environment
Toronto Regional Conservation Authority
Approach adopted by US National Centre for Atmospheric Research + MOE + UofT (W.R.Pelltier)
6
New Elements
…. To Include: New InfluencesIncluded Influence of the Great Lakes, Niagara Escarpment and the Oak Ridges Moraine.
…. To Model : Two 10 Year PeriodsThe “Present” 10 Year Base Period 2000-2009A “Future” 10 Year Period 2040-2049
…. To Examine: Toronto within the GTA
7
New Questions
…. To Answer: New Questions
Focused on obtaining data concerning:
Future Extremes-of-Weather (e.g., Heat Waves & Torrential Storms)
rather than …
Future Averages-of-Climate (e.g., Average Temperature & Average Rainfall)
But examined such “Averages” to check model validity!8
James Young PhD, PEng, PMet.,
SENES Consultants 9
Obtained data output relevant to Ontario from combined Global Climate Models (Coarse km Resolution) and Regional Climate Models (Medium km Resolution) from the Hadley Meteorological Centre UK
Used that data as the starting point to run Toronto’s Local Weather Model (Fine km Resolution) regarding 2000-2009 (the “Present”) and regarding 2040-2049 (the “Future”)
Analyzed the Data Created and Analyzed the Results against rational Meteorological Science and Local Influences (the “Climate Drivers”)
10
Results: Warmer Temperatures (2040’s)
Average annual temperatures increase by 4.4oC
Projected average winter temp. increases by 5.7oC.
Projected average summer temp. increases by 3.8oC.
The extreme daily minimum temperature - “becomes less cold" by 13oC.
The extreme daily maximum temperature - "becomes warmer" by 7.6oC.
11

Confidence in Results: Temperature
Compared with Monitored Means (2000-2009)Monitored Data from Lester Pearson Airport = 8.7oCToronto’s Climate-Weather Model = 8.7oCEnvironment Canada’s Model = 6.7oCOur model approach is closer!
Compared with Other Models (2040-2049) for GTAComparing High Resolution (Toronto ) versus Low Resolution Models’ re: Delta Temperature Values Our 4.4oC compares favourably with Low Resolution Models showing changes from -2.7oC to 6.3oC 12
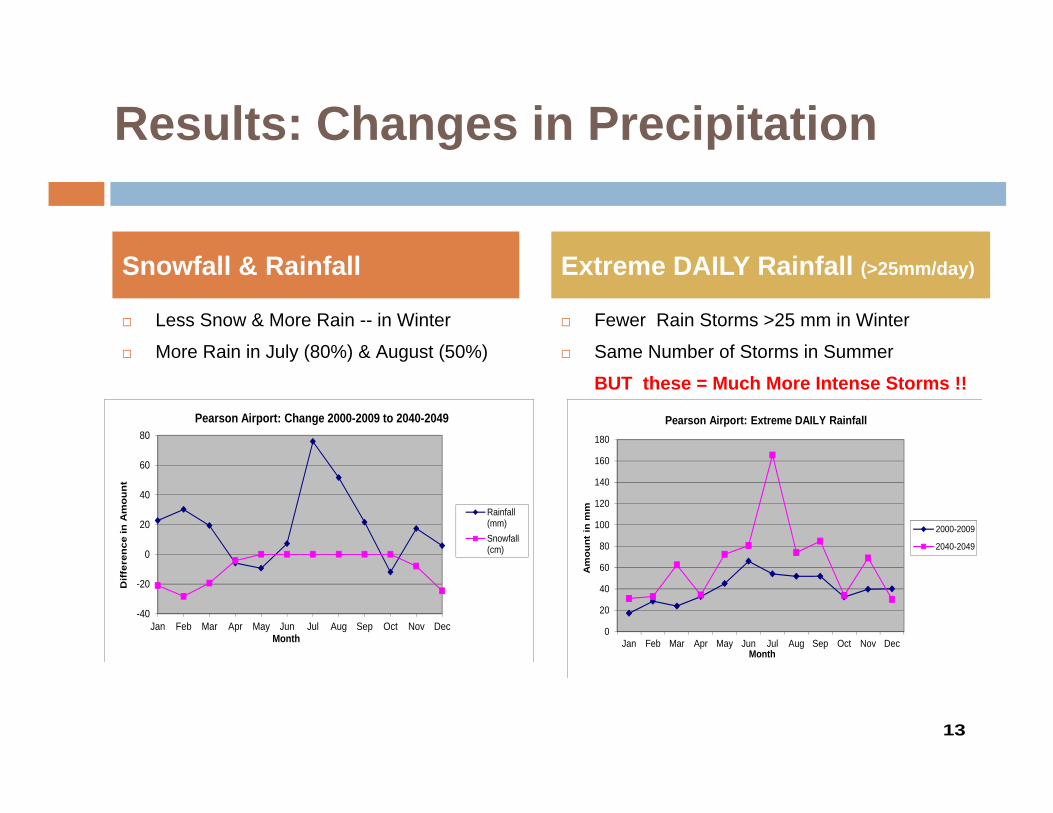
Results: Changes in Precipitation
Less Snow & More Rain -- in Winter
More Rain in July (80%) & August (50%)
Fewer Rain Storms >25 mm in Winter
Same Number of Storms in Summer
BUT these = Much More Intense Storms !!
Snowfall & Rainfall Extreme DAILY Rainfall (>25mm/day)
0
20
40
60
80
100
120
140
160
180
Jan Feb Mar Apr May Jun Jul Aug Sep Oct Nov Dec
Am
ou
nt
in m
m
Month
Pearson Airport: Extreme DAILY Rainfall
2000-2009
2040-2049
-40
-20
0
20
40
60
80
Jan Feb Mar Apr May Jun Jul Aug Sep Oct Nov Dec
Dif
fere
nc
e in
Am
ou
nt
Month
Pearson Airport: Change 2000-2009 to 2040-2049
Rainfall(mm)
Snowfall(cm)
13
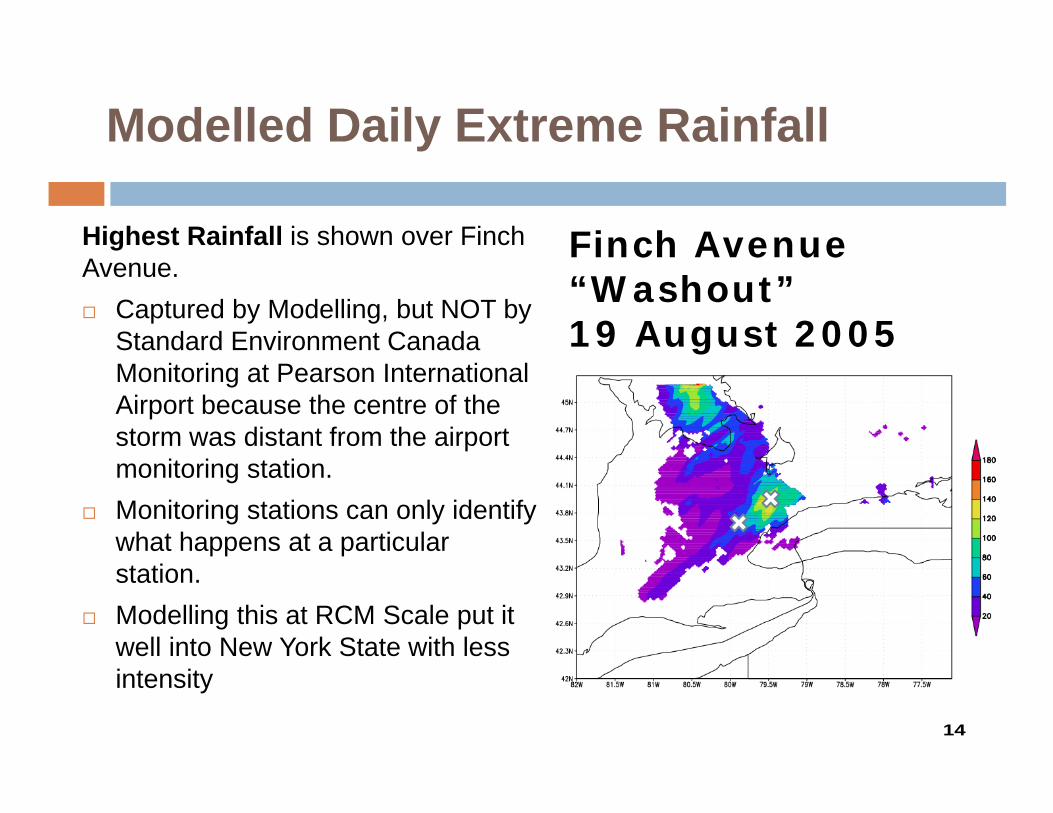
Modelled Daily Extreme Rainfall
Highest Rainfall is shown over Finch Avenue.
Captured by Modelling, but NOT by Standard Environment Canada Monitoring at Pearson International Airport because the centre of the storm was distant from the airport monitoring station.
Monitoring stations can only identify what happens at a particular station.
Modelling this at RCM Scale put it well into New York State with less intensity
Finch Avenue “W ashout”1 9 August 2 0 0 5
14

15
WEATHER EXTREMES PARAMETER UNITS
2000-2009
2040-2049
Extreme Rainfall
Maximum Amount in One Day mm 66 166
Number of Days with More Than 25mm
days 19 9
Mean Annual Daily Maximum mm 48 86
Extreme Heat
Maximum Daily (in oC) oC 33 44
Number of Days with Temperature greater than 30oC
days 20 66
Number of Heat Waves (3 or more Consecutive Days with Temperatures greater than 32OC)
3-day events
0.57 2.53
Expected Changes …. Som e Exam ples
Lawson J. Oates, MES
Director , Toronto Environment Office
Potential Implications of Study Projections … and Next Steps
16
Climate Adaptation & Infrastructure Management Approaches
Objectives
1. Cost effective pre-emptive adaptation measures
2. Minimize cost through adaptive design and construction
3. Build resilience and restoration capability into public infrastructure and services
4. Risk management analysis 17
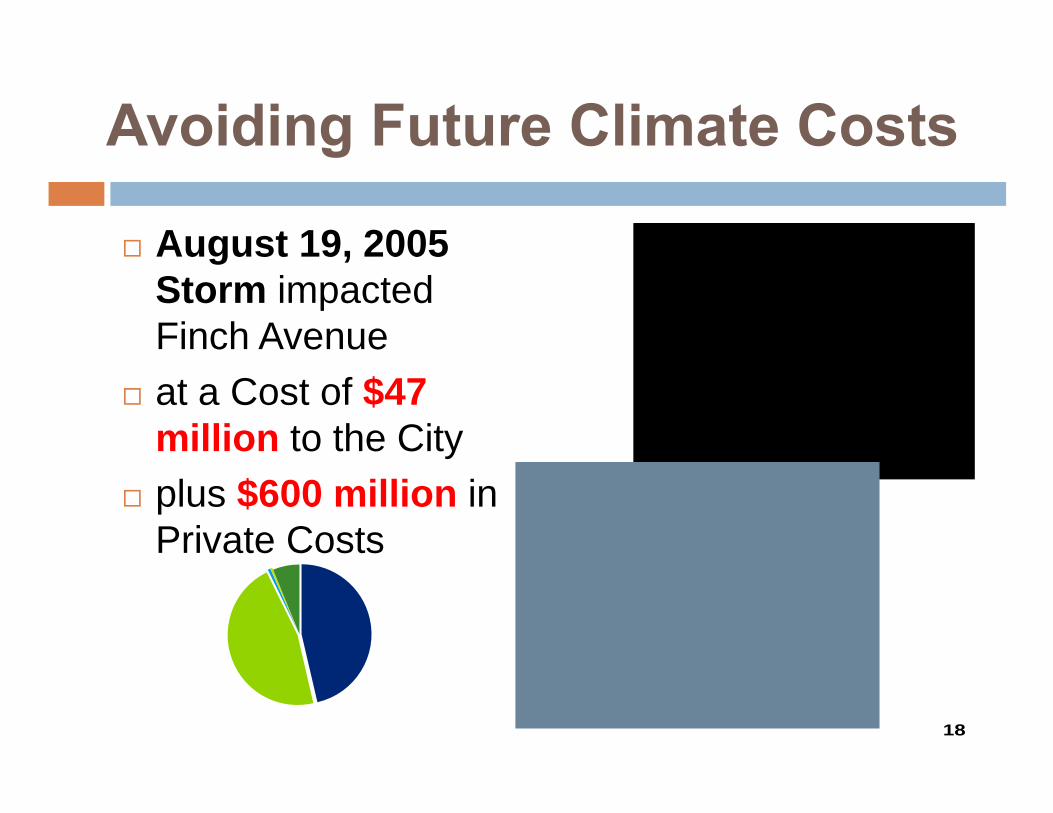
August 19, 2005 Storm impacted Finch Avenue at a Cost of $47 million to the City plus $600 million in Private Costs
18
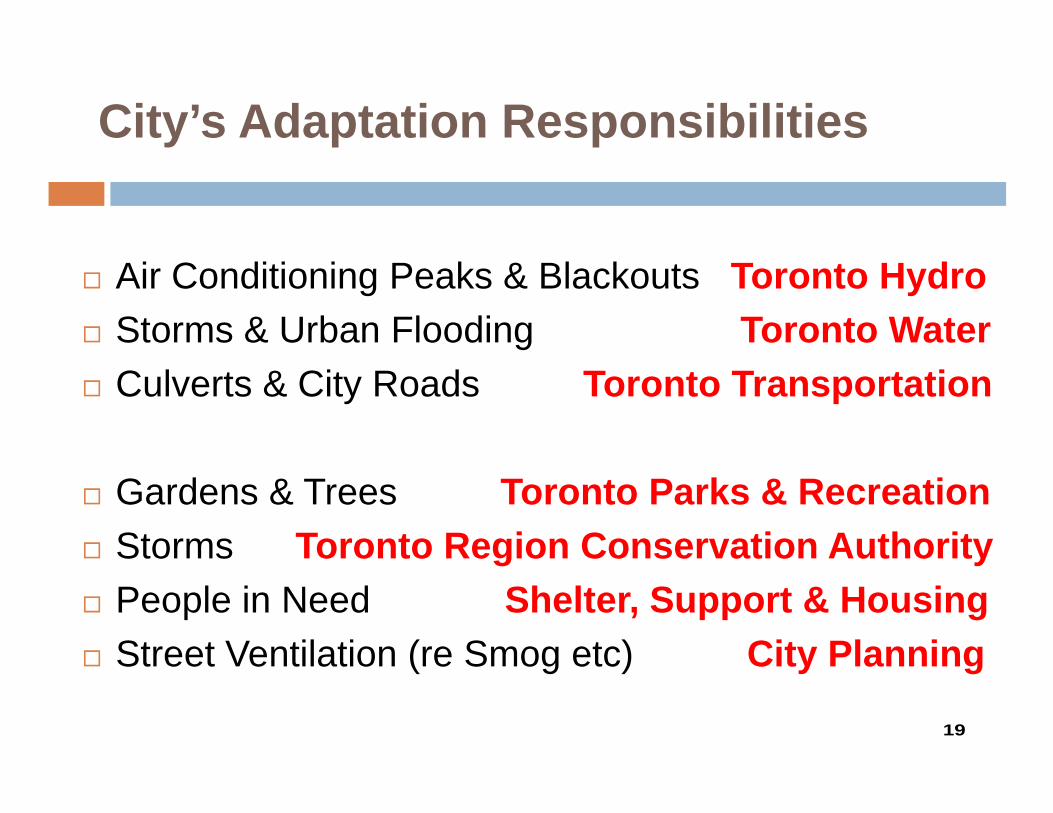
City’s Adaptation Responsibilities
Air Conditioning Peaks & Blackouts Toronto Hydro Storms & Urban Flooding Toronto WaterCulverts & City Roads Toronto Transportation
Gardens & Trees Toronto Parks & Recreation Storms Toronto Region Conservation AuthorityPeople in Need Shelter, Support & HousingStreet Ventilation (re Smog etc) City Planning
19
WeatherWise Partnership Participants
20
21
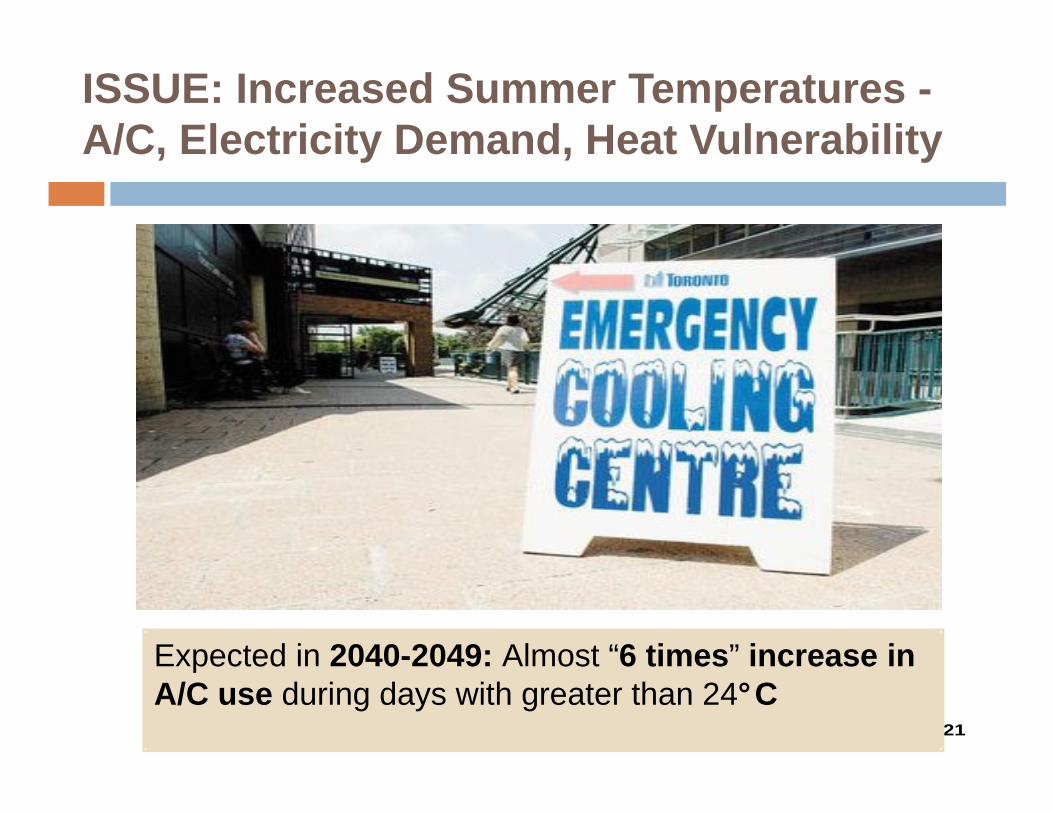
ISSUE: Increased Summer Temperatures -A/C, Electricity Demand, Heat Vulnerability
Expected in 2040-2049: Almost “6 times” increase in A/C use during days with greater than 24°C
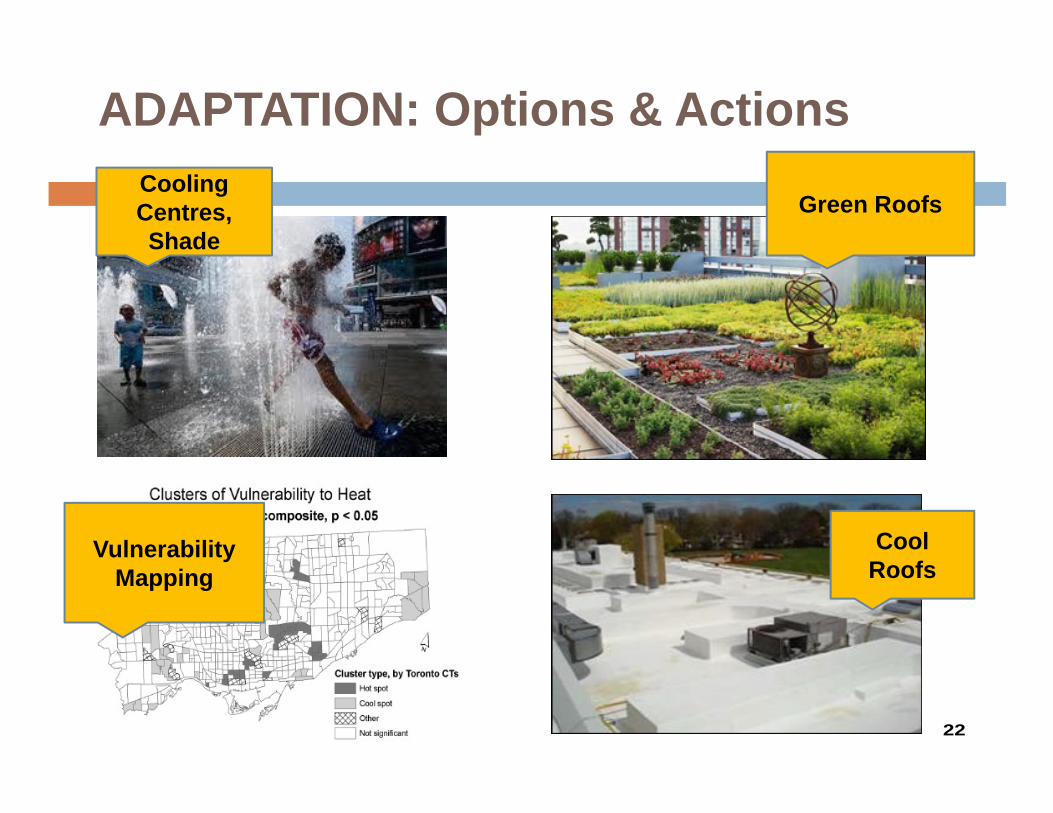
ADAPTATION: Options & Actions
22
Green Roofs
Cool Roofs
Vulnerability Mapping
Cooling Centres, Shade
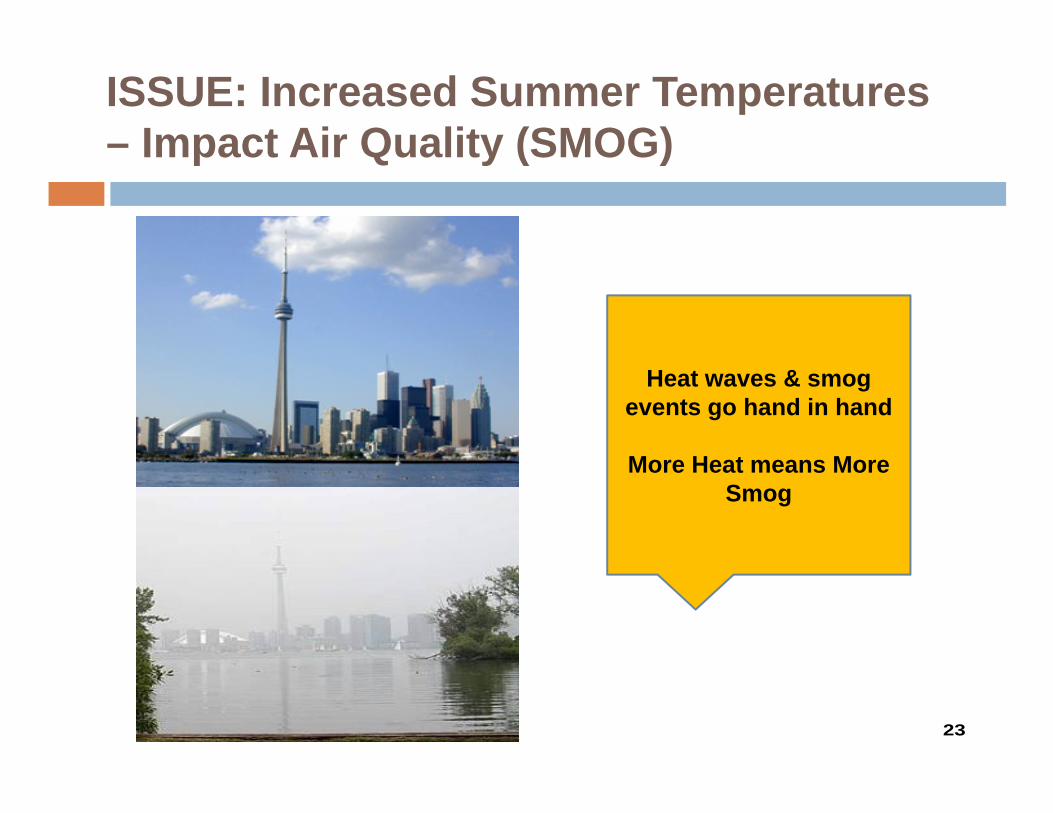
ISSUE: Increased Summer Temperatures – Impact Air Quality (SMOG)
23
Heat waves & smog events go hand in hand
More Heat means More Smog
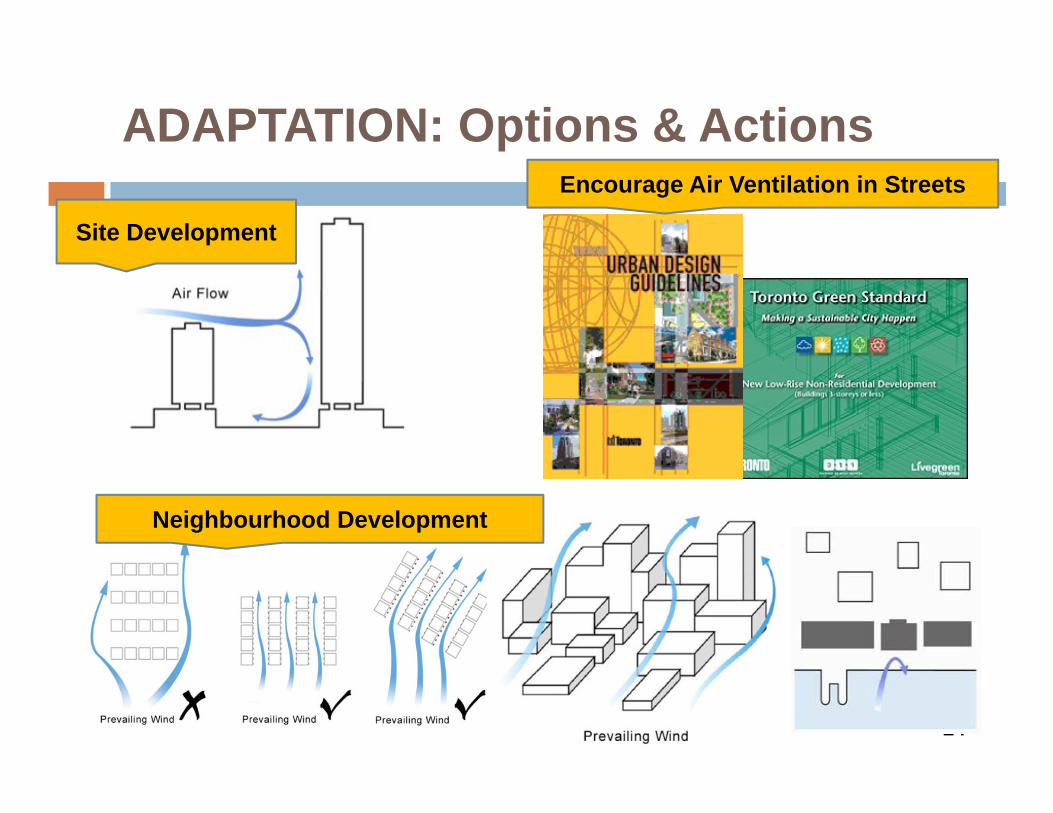
ADAPTATION: Options & Actions
24
Site Development
Neighbourhood Development
Encourage Air Ventilation in Streets
25
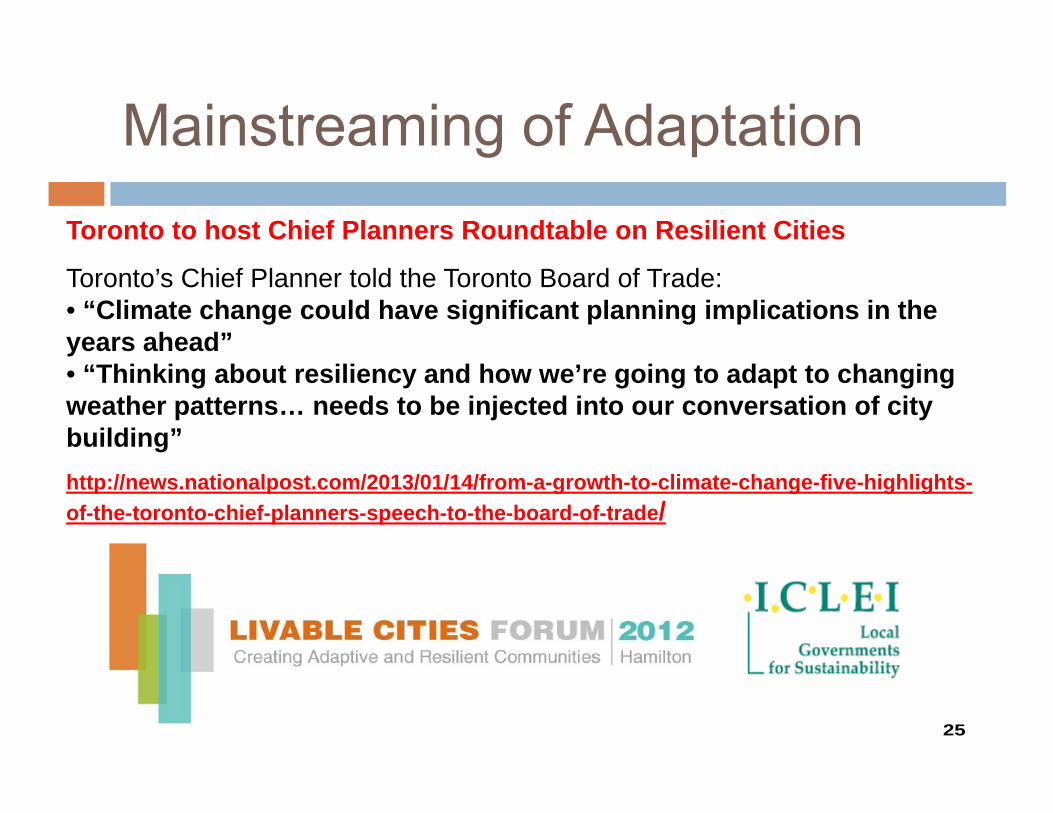
Toronto to host Chief Planners Roundtable on Resilient Cities
Toronto’s Chief Planner told the Toronto Board of Trade: • “Climate change could have significant planning implications in the years ahead” • “Thinking about resiliency and how we’re going to adapt to changing weather patterns… needs to be injected into our conversation of city building”
http://news.nationalpost.com/2013/01/14/from-a-growth-to-climate-change-five-highlights-of-the-toronto-chief-planners-speech-to-the-board-of-trade/
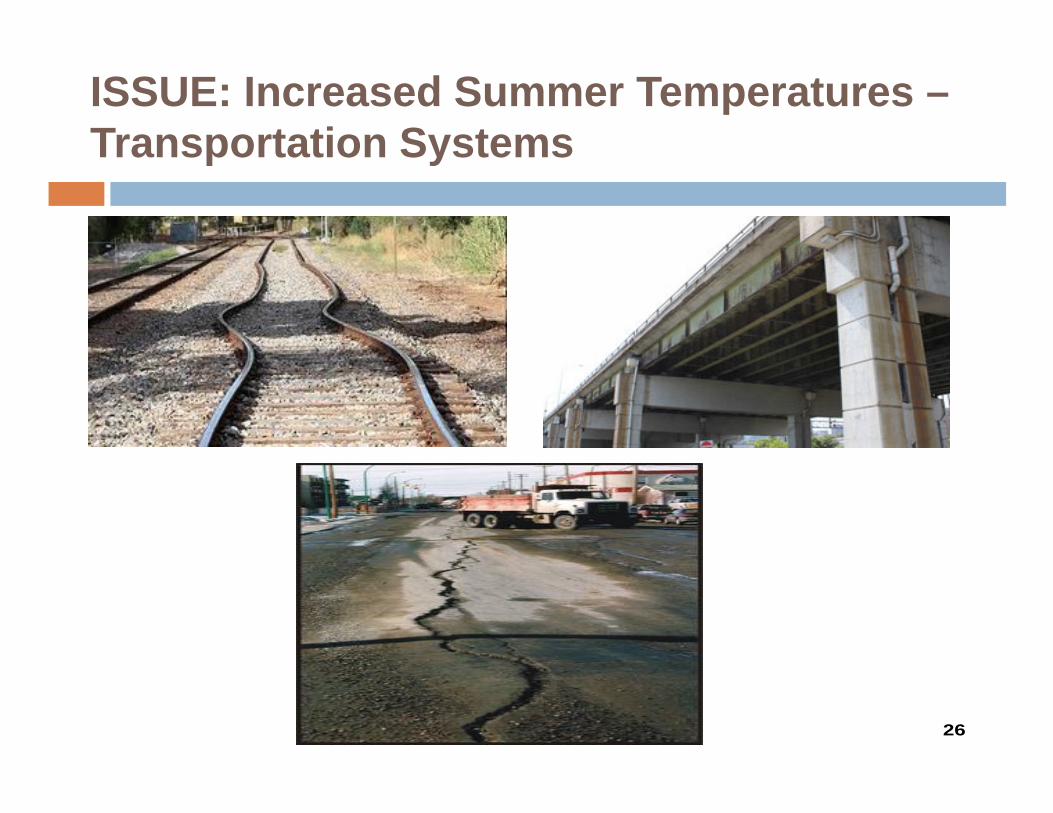
ISSUE: Increased Summer Temperatures –Transportation Systems
26
Learning from Others – Portland,
Oregon
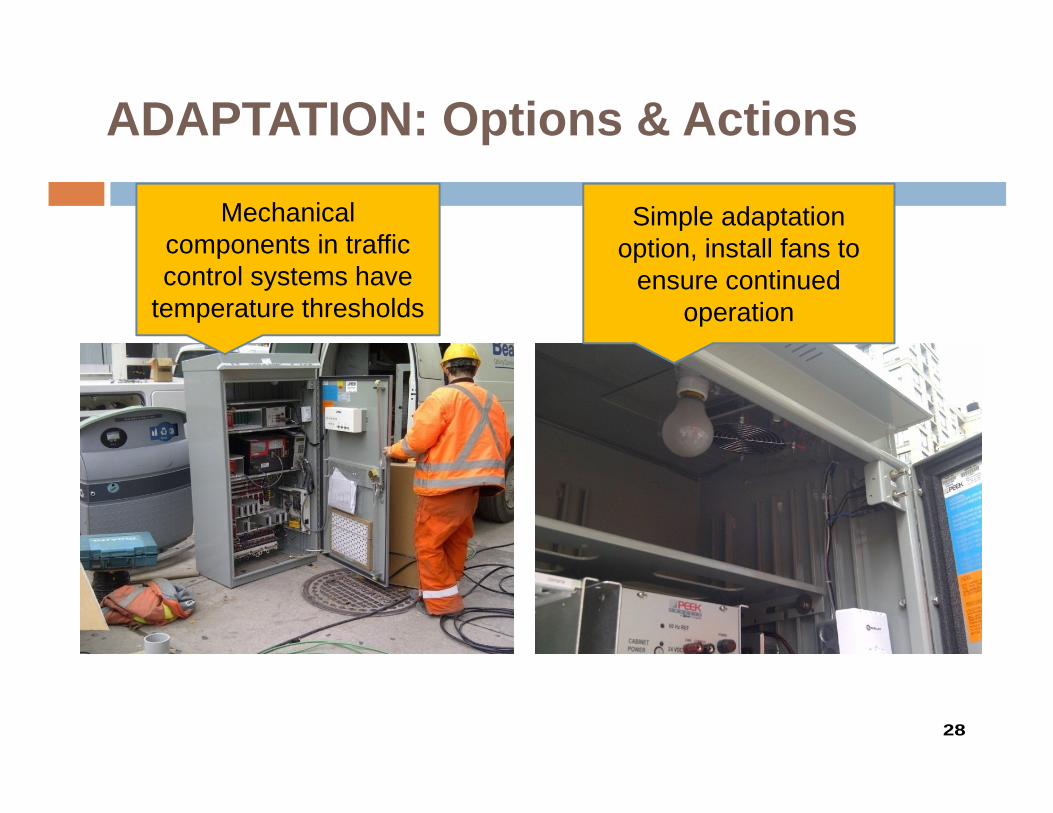
ADAPTATION: Options & Actions
28
Mechanical components in traffic control systems have
temperature thresholds
Simple adaptation option, install fans to
ensure continued operation
29
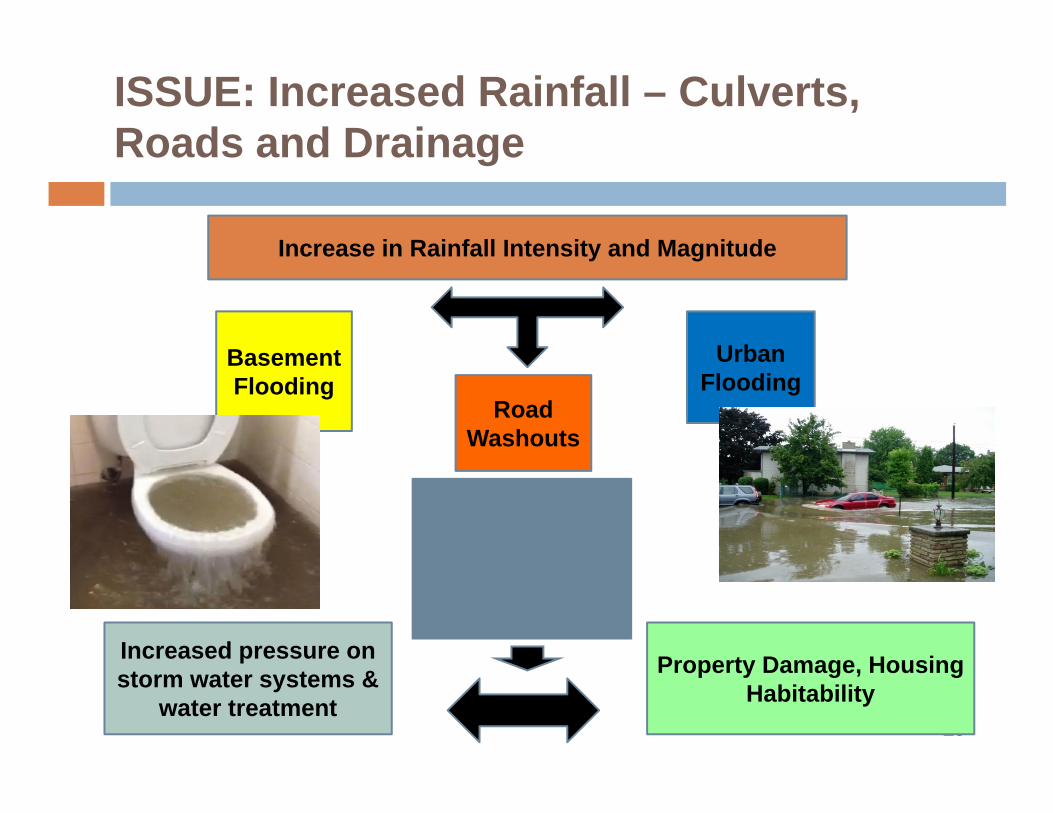
ISSUE: Increased Rainfall – Culverts, Roads and Drainage
Increase in Rainfall Intensity and Magnitude
Basement Flooding
Road Washouts
Urban Flooding
Property Damage, Housing Habitability
Increased pressure on storm water systems &
water treatment
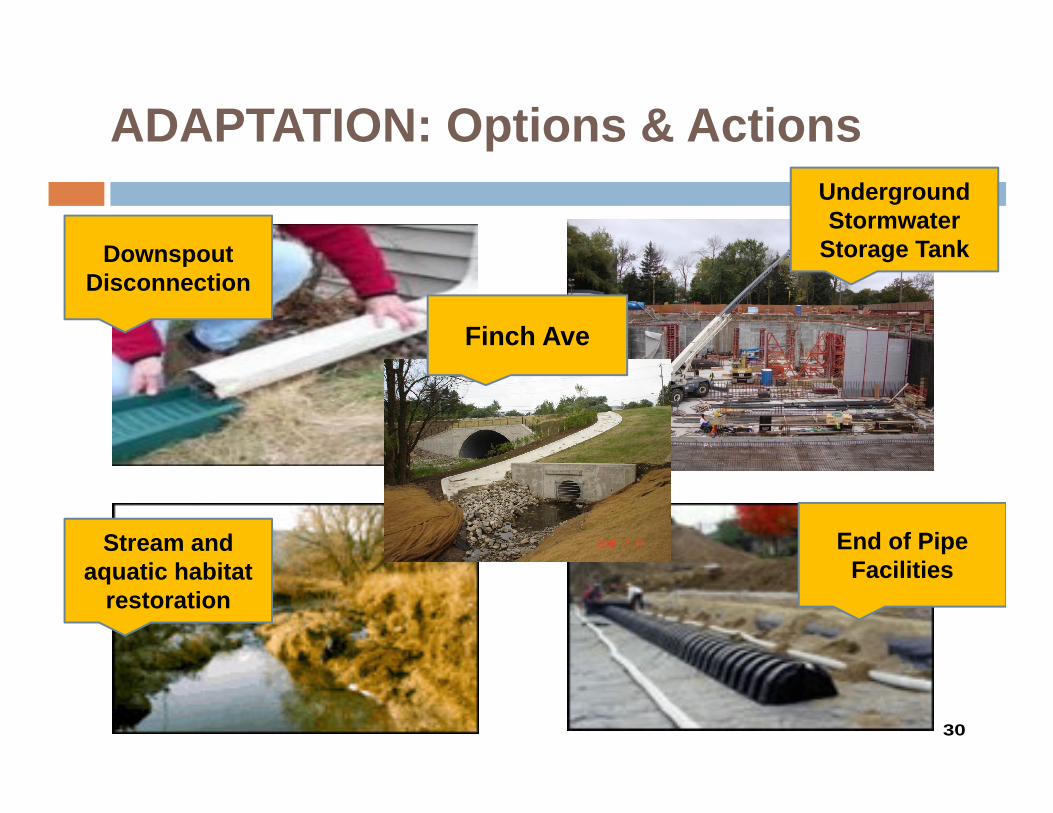
ADAPTATION: Options & Actions
30
Downspout Disconnection
Underground Stormwater
Storage Tank
Stream and aquatic habitat
restoration
End of Pipe Facilities
Finch Ave
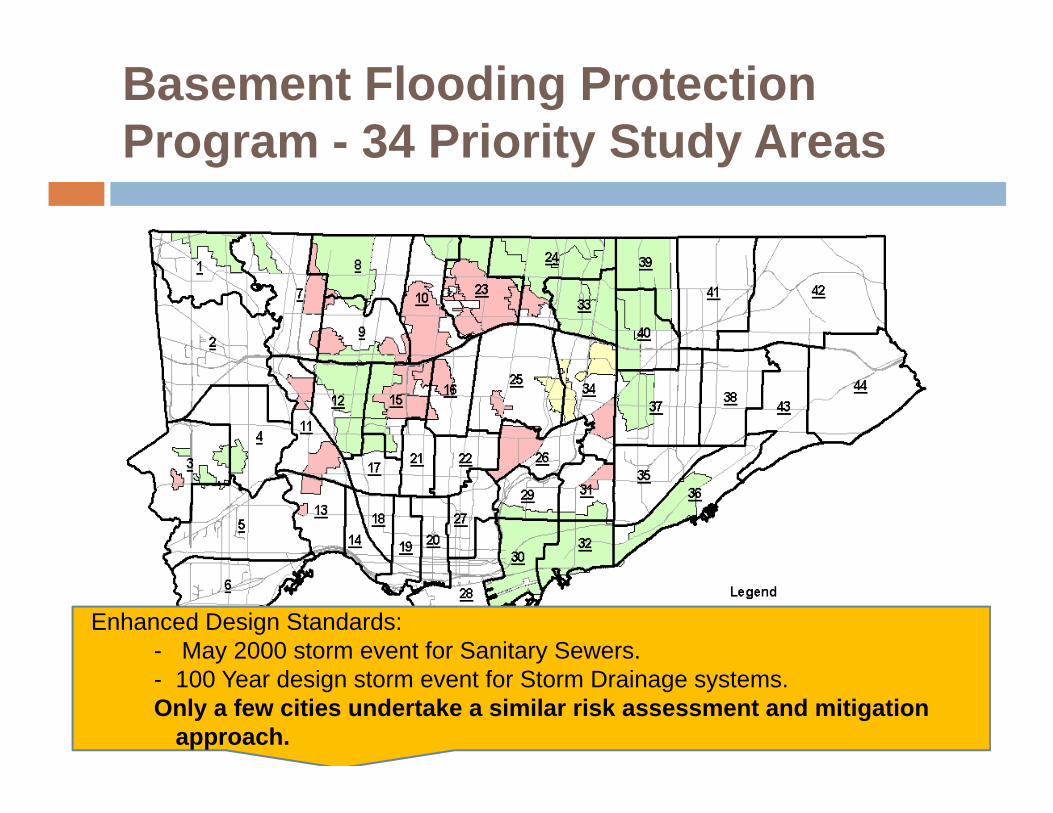
Basement Flooding Protection Program - 34 Priority Study Areas
Enhanced Design Standards:- May 2000 storm event for Sanitary Sewers.- 100 Year design storm event for Storm Drainage systems. Only a few cities undertake a similar risk assessment and mitigation
approach.
Toronto’s Future Weather Will Be Different with an increase in extreme weather events
We Must Continue to Adapt to the ChangesCity Divisions can now undertake individual Climate Change Risk Assessments (using City Risk Tool )
Monitor Situation & Update Study as Required 32
Lawson Oates,
Christopher Morgan,
James Young
33