presentation: the role of agriculture in the development process. maputo, mozambique
Upload: united-nations-university-world-institute-for-development-economics-research
Post on 13-Apr-2017
479 views
TRANSCRIPT

OMR Conference, 4 September 2013Maputo, Mozambique
The Role of Agriculture in the Development Process

Overview
• Perspectives from the development literature • International experiences: the last 25‐30 years• Current global context: three crises• Mozambique – experiences over the past decade• Concluding remarks

Traditional views (from theory and empirics)
• Ricardo and colleagues• The Lewis two‐sector model• The linkage literature• Falling relative share of agriculture• All this tended to suggest a passive and at best a supportive
role

The basis for a positive role• Classical paradigm of positive role of ag in development (1960s)• Agricultural growth in support of industrialization through the
agricultural transformation (ADLI) (Asian examples)• How the structural transformation works:
– Agricultural growth induces urban‐industrial growth through capital, labor, foreign exchange, and market contributions
• Industry (starting with agribusiness) grows faster than agriculture• As a consequence, the shares of agriculture in aggregate
employment and GDP decline due to success in triggering GDP growth, not due to failure to grow.

A powerful cross-country regularity (1990-2005 average) (de Janvry and Sadoulet 2008)

Successful transformation in Asia


But Africa experienced many challenges• Many implementation failures (1970s)• Import Substitution Industrialization failed• Many failures in agriculture‐based projects• Too complex, insufficient support• Integrated rural development to meet broadened development objectives (McNamara 1973) ineffective:– Underestimate emerging private sector roles– Overestimate state capacity to coordinate– Undermine cooperative producer organizations

And we also saw• 20 years of neglect under structural adjustment and Washington
Consensus (1985‐2005)• Adjust the macro‐fundamentals but no sectoral policy• Industrialize through open economy not agriculture• Plus for example:
– Descale the role of the state in agriculture, despite pervasive market failures
– Reduce rural poverty through transfers instead of autonomous incomes
– Investment in agriculture discouraged by low international commodity prices (OECD) & adverse environmental effects
– Sharp decline in public expenditures on agriculture– Sharp decline in overseas development assistance to agriculture
• So what was the outcome?

So failed transformation in Africa in general: Labour displaced from agriculture without associated growth in GDP per capita

Plus another type of failed transformation: Growth without transformation
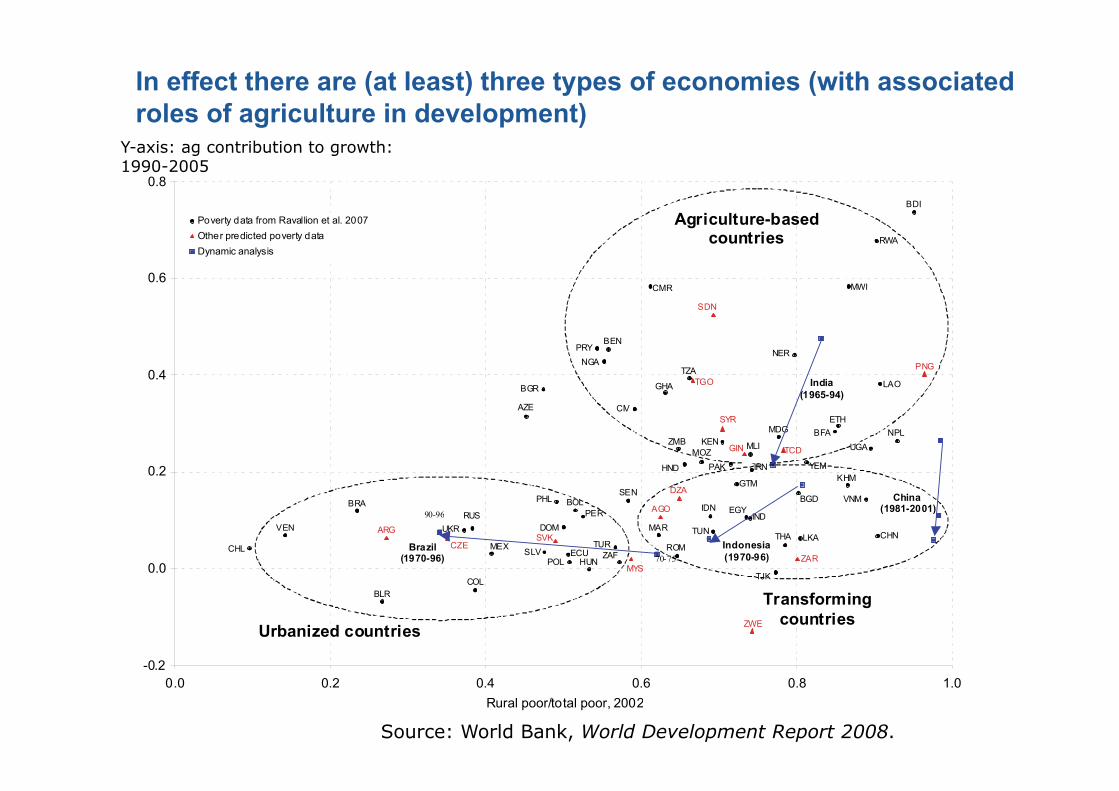
In effect there are (at least) three types of economies (with associated roles of agriculture in development)
AZE
BDI
BEN
BFA
BGD
BGR
BLR
BOLBRA
CHLCHN
CIV
CMR
COL
DOM
ECU
EGY
ETH
GHA
GTM
HND
HUN
IDNIND
IRN
KEN
KHM
LAO
LKAMAR
MDG
MEX
MLIMOZ
MWI
NERNGA
NPL
PAK
PERPHL
POL
PRY
ROM
RUS
RWA
SEN
SLV
THA
TJK
TUNTUR
TZA
UGA
UKRVEN
VNM
YEM
ZAF
ZMB
AGO
ARG
CZE
DZA
GIN
MYS
PNG
SDN
SVK
SYR
TCD
TGO
ZAR
ZWE
-0.2
0.0
0.2
0.4
0.6
0.8
0.0 0.2 0.4 0.6 0.8 1.0Rural poor/total poor, 2002
Poverty data from Ravallion et al. 2007Other predicted poverty dataDynamic analysis
Urbanized countries
Agriculture-based countries
Transforming countries
70-75
90-96
Indonesia (1970-96)
Brazil (1970-96)
India (1965-94)
China (1981-2001)
Source: World Bank, World Development Report 2008.
Y-axis: ag contribution to growth: 1990-2005

Role of agriculture fundamental but it differs …• Agriculture based economies: growth
– Agriculture essential for growth: large– Importance for food security and poverty
• Transforming countries: equality– Rapidly growing non‐ag– Agriculture key to reduce imbabalance + marginalization
• Urbanized economies: inclusion– Sub‐sectors with comparative advantage– Include small holdes as suppliers

Losses due to global trade policies

Agriculture exports highly taxed

Low public spending

Subsidies and public investment in Indian agriculture

Disaggregated project aid, 2002-2009

Foreign aid and poverty

Ag growth and the link to poverty

Examples of impressive successes
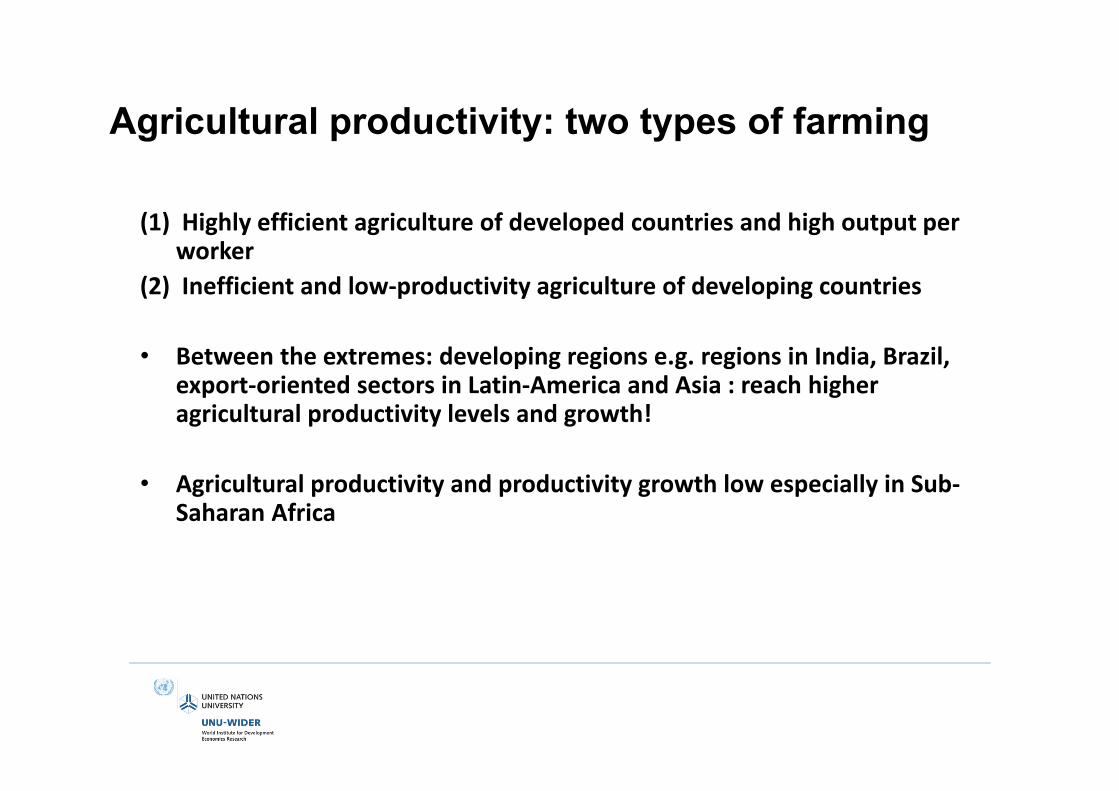
Agricultural productivity: two types of farming
(1) Highly efficient agriculture of developed countries and high output per worker
(2) Inefficient and low‐productivity agriculture of developing countries
• Between the extremes: developing regions e.g. regions in India, Brazil, export‐oriented sectors in Latin‐America and Asia : reach higher agricultural productivity levels and growth!
• Agricultural productivity and productivity growth low especially in Sub‐Saharan Africa

Agriculture value added
($ per agricultural worker)2003-05
Cereal productionYields
(in kilo per hectare)2003-05
Thailand 554 3,044Vietnam 182 4,641Indonesia 421 4,278Ethiopia 64 1,213Tanzania 167 1,403Mozambique 83 925Uganda 101 1,559Kenya 169 1,682Denmark 22,260 6,088Source: World Development Report 2008, selected indicators
Productivity examples
x 348x 40
labour productivity
land productivity

The risk averse peasant and technology choice
Not necessarily: uncertainties (e.g. weather, price), imperfect information, transactions costs, lack of access to credit and insurance
The peasant tries to maximise not income but the chance of the family’s survival => rational
Min. desirableconsump.
Minimum consump.
Pro
duct
ion/
cons
um.
Time
Technology A
Technology A: Low yield, little variation
Technology B
Technology B: High yield, big variation
Yield
Pro
babi
lity
Technology A
Technology B
Is resistance to technological innovation due to lack of rationality or incompetence?

What else causes low output growth in low-productivity subsistence farming
1) Large amounts of land sometimes available, only small parts can be cultivated: traditional tools (e.g. hoe, ax, knife, …). Use of animals sometimes impossible because of tsetse fly, lack of fodder in dry season => agriculture depends on applying human labour only to small plots of land.
2) Due to limited amount of land cultivated and tools used, small areas tend to be cultivated intensely => rapidly diminishing returns to labour. Best farming method is shifting cultivation (i.e. once minerals drawn from soil, new land cleared and cultivated while old land can recover and be used again later). If fallow time long enough, manure and chemical fertiliser would be unnecessary.
3) Seasonality: scarcity of labour in busy parts of the season (planting, weeding) while underemployed at other times.
Net result: constant level of agricultural output and labour productivity…as long as population size stable …

The global context: three crises
• Finance• Food • Climate change

CRISIS 1: FINANCE

IMF
Fore
cast
-4-2
02
46
8R
eal G
DP
Ann
ual G
row
th(%
)
1970 1975 1980 1985 1990 1995 2000 2005 2010 2015Year
World Advanced Economies
Emerging and Developing Economies
Source:IMF World Economic Outlook Database October (2009)
Real GDP Growth in World and Major Economic Groupings (1970-2014)
Present economic downturn deepest in 60 years, and no region untouched + a lot speculation as to recovery28

IMF
Fore
cast
-11.89
-2.66 -0.93 0.24
First Oil CrisisSecond Oil Crisis Dot Com Bubble
Financial Crisis
-15
-10
-50
510
15Tr
ade
Volu
me
(Ann
ual P
erce
ntag
e C
hang
e)
1970 1975 1980 1985 1990 1995 2000 2005 2010 2015Year
World Trade Volume
Source:IMF World Economic Outlook Database October (2009)
World Trade Volume (1970-2014)
World trade has experienced its sharpest decline in decades + uncertain future

2.98
-0.71
IMF
Fore
cast
-10
12
3N
et P
rivat
e C
apita
l Flo
ws
(% o
f GD
P)
1990 1995 2000 2005 2010 2015Year
Net Private Capital Flows
Source: IMF World Economic Outlook Data Base April (2009)
Net Private Capital Flows to Emerging and Developing Economies (1990-2014)
Net private capital flows to the South have fallen dramatically

CRISIS 2: FOOD

050
100
150
200
250
Indi
ces
of M
arke
t Pric
es (2
005=
100)
1955 1960 1965 1970 1975 1980 1985 1990 1995 2000 2005 2010Year
Rice Wheat
Maize Soybeans
Source : IMF Primary Commodity Price Data BaseNote: Rice:Thailand(Bangkok); Wheat:US Gulf ; Maize:US ; Soybeans: US
Cereal Prices in Indices of Market Prices (1957-2008)
Food prices soared in 2007‐2008 and then fell back: prospects?

Underlying factors
• Food price developments reflect:– Low priority to agriculture/food production– Shifting demand patterns– Biofuels (+ lack of research in alternative energysources)
• Underlying structural drivers behind 2007‐2008 spikeremain in place – if growth resumes food prices likelyto increase again
• Global food architecture not geared to deal withsupply shortages – governments may intensifyprotection to try to satisfy domestic consumers

Responses
• National responses to food crisis have varied• Africa: Macro‐policies main tool to limit impact of world price
shocks• Elsewhere: Greater focus on social protection• But too much social protection ad hoc, stop‐go, high cost – needs
to be systematic• A double bind:
– If recovery stalls: new trade and financial shocks– If recovery is sustained: food and energy prices will climb and hit
energy and food importers• Need for public action – but fiscal space limited in the smaller and
poorer economies

CRISIS 3: CLIMATE

Climate change (1)
• Present global growth model clearly unsustainable –the challenges are unprecedented
• To respond, the world must transform existing energy systems (mitigation) and simultaneously adapt to the climate change that is already built into global climate (adaptation)
• Failure in shifting from fossil‐fuel dependence evident in run‐up in oil price prior to the financial crisis (due to lack of investment in energy research)

020
4060
8010
012
014
0U
S $
Per B
arre
l
01jan1998 01jan2000 01jan2002 01jan2004 01jan2006 01jan2008 01jan2010Daily
Note:Oil prices refer to Brent; US dollars per barrelSource:US Department of Energy
Oil Prices ( January 1998 to October 2009)
Huge run‐up, then a fall as recession set in – but ...?

Climate change (2)
• If growth resumes energy prices will move back up• Places huge burdens on poor countries – a range of fiscal effects,
which make states more aid‐dependent, not less• Costs far exceed current level of aid:
– Per annum mitigation in developing countries by 2030: USD 140‐175 billion
– Per annum adaptation costs by 2050: USD 30‐109 billion– Aid is presently around USD 100 billion in total
• Climate change finance is as fragmented as traditional aid, will funding be additional, and who takes control of supply (how much voice for the South?)
• Climate change financing seen as compensation – but aidprocesses remain conditional

BACK TO MOZAMBIQUE

The Role of Agriculture in Mozambique
• The contribution of agriculture to GDP decreased significantly from 1997 to 2001, before immediately increasing again. Since recovery from the 2000 floods, the contribution of all sectors has stayed quite stable.
35 35 35 31 29 24 23 28 28 27 27 28 28 30 31 32 32
15 16 18 22 23 25 26 23 26 27 25 26 26 24 24 23 24
51 48 47 47 49 51 52 49 46 45 48 46 46 46 45 45 44
1995 1996 1997 1998 1999 2000 2001 2002 2003 2004 2005 2006 2007 2008 2009 2010 2011
Sectoral Contributions to GDPAgriculture, value added (% of GDP) Industry, value added (% of GDP) Services, etc., value added (% of GDP)
Source: World Bank Mozambique Metadata

Public expenditure in agriculture
• State support to agriculture has not achieved the 10% Maputo Declaration target– the average empirical value attained by ‘transforming’ economies over the last 30 years.
• Actual expenditure of budget increases have tended to remain unfulfilled• The large budgets in 2003 and 2004 can be attributed to the rehabilitation of the
Massingir Dam, and the Chokwe Irrigation Scheme in 2006 and 2007 – accounting for a large part of the budget
0.0%
2.0%
4.0%
6.0%
8.0%
10.0%
12.0%
14.0%
2001 2002 2003 2004 2005 2006 2007 2008 2009
Share of Agriculture in the Total Budget Share of Actual Agricultural Expenditure in Total
Maputo Declaration Target ‐ 10%
Source: Public expenditure review ‐MozSAKSS(2011)

Levels of staple crop production
• Maize continues to be most produced staple crop• Production levels have shown no signs of increase over the last 10 years• Rainfall and weather patterns continue to heavily influence staple crop production (2005 and 2006)
0
20
40
60
80
100
120
140
0
200
400
600
800
1000
1200
1400
1600
1800
2000
2002 2003 2005 2006 2007 2008 2012
Kg Per Cap
ita
'000
Ton
nes
Millet
Sorghum
Rice
Maize
Staple Production p/c
Staple Production p/c (Rural)
Source: TIA/IAI

Staple crop productivity (kg/ha)
• Maize productivity levels still fluctuating and much below potential• Rice productivity stagnation• Sorghum and millet productivity levels fluctuate with no trend of
improvement
0
100
200
300
400
500
600
700
800
900
2002 2005 2006 2007 2008 2012
Crop
Yield (K
g/Ha)
Maize
Rice
Sorghum
Millet
Source: TIA/IAI

Input use
• Extremely low utilisation of agricultural inputs• No evidence of improvement• Not uniformly distributed throughout the country...
0%
2%
4%
6%
8%
10%
12%
14%
2002 2003 2005 2006 2007 2008 2012
% of Inp
ut Use Improved Seed
Fertilisers
Pesticides
Animal traction
Irrigation
Source: TIA/IAI

Who uses inputs (%)?IMPROVED SEEDS FERTILISER PESTICIDE ANIMAL TRACTION IRRIGATION
2002‐06 2007‐12 2002‐06 2007‐12 2002‐06 2007‐12 2002‐06 2007‐12 2002‐06 2007‐12
Niassa 8.8 5.5 13.1 8.5 7.5 6.0 0.0 0.0 5.5 6.3
Cabo Delgado 1.6 5.0 1.8 1.4 11.7 14.4 0.0 0.1 2.0 2.4
Nampula 6.4 4.9 2.3 2.3 9.5 5.6 0.1 0.1 3.7 5.4
Zambézia 7.3 7.2 0.8 0.5 1.2 0.8 0.1 0.1 2.4 3.2
Tete 16.5 23.4 15.4 15.2 7.3 6.9 30.7 21.2 18.0 16.3
Manica 17.4 22.1 2.2 2.5 1.9 2.7 12.4 14.6 9.9 17.2
Sofala 8.4 11.4 1.1 1.3 7.0 3.4 1.8 3.2 4.8 9.0
Inhambane 7.9 6.1 1.7 3.4 1.8 2.6 47.4 42.8 18.7 20.5
Gaza 8.6 11.2 3.4 2.4 2.8 2.5 45.4 44.9 19.9 12.9
Maputo 13.7 10.1 4.7 6.2 4.1 5.0 13.5 14.0 22.8 22.4
Total 8.4 9.7 3.7 3.6 5.7 4.7 11.0 9.8 7.8 8.9
• Large use of improved seeds, fertilisers, pesticides and animal traction in Tete
• Evidence of increased adoption of improved seeds varieties in Tete, Manica, Sofala and Cabo Delgado
• Fertiliser, pesticide and animal traction has generally not changed much
• Extremely low use of animal traction above the Zambezi River
Increase > 5 %Increase 3 ‐ 5%Decrease 3 ‐ 5 %Decrease > 5 %
BOLD values show above 10% usage

Land use
• Average farm size falling in the South – labour shortages, rural to urban migration
• Increasing average farm size in Zambézia and Nampula• Low levels of land registration nationally. Improved vastly in Maputo
Province (25% in 2012) time, greater competition over land?
0
0.5
1
1.5
2
2.5
2002 2003 2005 2006 2007 2008 2012
Average size of a
rea cultivated (Ha)
Average Cultivated Area per Household
North
Centre
South
National
0.0%
1.0%
2.0%
3.0%
4.0%
5.0%
6.0%
7.0%
8.0%
9.0%
2002 2005 2008 2012
% of Farm
ers w
ith Registered Land
DUAT Registration
Source: TIA/IAI Source: TIA/IAI

Services (%)
• Large fall in farmers receiving extension advice throughout the country• Farmers receiving price information decreased in the north, but rose in
the centre and south• Association membership increased slightly nationally, yet fell drastically
in Maputo province• Emergency seed reception fell in the centre and south, and was already
initially very low in all other areas of the country
EXTENSION ADVICE RECEIVED PRICE INFO ASSOCIATION MEMBER RECEIVED CREDIT EMERGENCY SEEDS
2002‐06 2007‐12 2002‐06 2007‐12 2002‐06 2007‐12 2002‐06 2007‐12 2002‐06 2007‐12
Niassa 14.5 9.4 40.7 34.3 6.7 5.9 7.5 3.3 3.0 3.7
Cabo Delgado 14.9 6.3 43.4 35.8 4.5 4.7 2.9 2.5 2.2 2.0
Nampula 15.2 9.1 62.7 43.5 6.4 7.8 3.6 3.8 2.4 1.2
Zambézia 9.5 7.4 26.1 37.7 3.8 7.6 0.9 1.6 4.1 3.2
Tete 16.3 11.9 37.5 46.3 5.0 4.9 7.7 6.6 4.8 5.5
Manica 12.6 7.2 43.3 46.1 4.7 5.8 1.3 3.4 5.4 2.3
Sofala 20.4 11.2 46.2 50.4 3.2 4.8 4.5 3.1 9.8 6.3
Inhambane 7.2 6.5 23.3 29.9 2.6 6.2 1.1 3.1 3.7 2.4
Gaza 16.7 6.5 24.8 31.3 9.3 8.0 2.5 2.4 12.0 5.7
Maputo 11.6 7.2 21.5 32.8 15.2 8.0 2.9 2.0 18.5 2.7
Total 13.4 8.3 39.6 39.6 5.3 6.6 3.1 3.1 4.8 3.2
Increase > 5 %Increase 3 ‐ 5%Decrease 3 ‐ 5 %Decrease > 5 %
BOLD values show usage above national average
Source: TIA/IAI

Cash crop producers
• Overall fall in farmers cultivating tobacco, whilst soybean is emerging as a viable cash crop
• No major identifiable trends• National level statistics disguise important provincial level trends...
0.0%
1.0%
2.0%
3.0%
4.0%
5.0%
6.0%
7.0%
8.0%
9.0%
2002 2003 2005 2006 2007 2008 2012
% of Farmers C
ultiv
ating Crop
Cotton
Tobacco
Sunflower
Sesame
Soybean
Source: TIA/IAI

Cash crop producers (%)
• Increase in cotton farmers in Niassa and Cabo Delgado, large fall in Nampula
• Tobacco slightly falling throughout the country
COTTON TOBACCO SUNFLOWER SESAME SOYBEAN
2002‐06 2007‐12 2002‐06 2007‐12 2002‐06 2007‐12 2002‐06 2007‐12 2002‐06 2007‐12
Niassa 0.6 3.9 15.8 12.4 7.3 2.2 5.7 3.4 0.3 0.2
Cabo Delgado 13.7 17.1 1.1 0.3 0.5 0.2 14.5 15.6 0.0 0.0
Nampula 12.0 6.3 1.8 0.8 0.6 0.1 11.3 10.4 0.1 0.1
Zambezia 3.2 2.0 2.5 2.0 1.8 1.6 2.6 3.8 0.1 0.4
Tete 8.5 7.0 11.7 8.1 0.8 1.1 3.7 5.0 5.7 7.7
Manica 2.2 3.5 3.8 0.6 3.5 3.9 12.9 10.5 0.0 0.2
Sofala 9.4 7.7 1.5 0.4 0.5 0.1 15.5 20.9 0.0 0.0
Inhambane 0.1 0.3 0.4 0.1 0.0 0.2 0.3 0.3 0.0 0.0
Gaza 0.0 0.0 0.4 0.0 0.2 0.0 0.0 0.0 0.0 0.0
Maputo 0.0 0.0 1.3 0.2 0.1 0.0 0.3 0.4 0.0 0.0
Total 6.3 5.1 3.4 2.2 1.4 0.9 7.1 7.4 0.5 0.9
Increase > 5 %Increase 3 ‐ 5%Decrease 3 ‐ 5 %Decrease > 5 %
BOLD values show above 10%
Source: TIA/IAI

Cash crop production
• Soybean growth enormous between 2002 and 2012 ( >700%); 59% of the total production was in Tete in 2012, 24% in Zambézia
• Sesame production has more than doubled; 25% of production in Sofala in 2012, 23% in Nampula• Large fall in tobacco production from 2006 peak; 49% of production in Tete in 2012, 38% in Niassa• Cotton has remained relatively stable; 27% of production in both Tete and Nampula in 2012
0
100
200
300
400
500
600
700
2002 2003 2005 2006 2007 2008 2012
Inde
x = 10
0
Cotton
Tobacco
Sunflower
Sesame
Soybean
Index = 100
Source: TIA/IAI

Characteristics of productive maize farmers (2002-12)
• The top 20% productive maize farmers are much more productive than other maize farmers
• Inverse relationship between maize productivity and the area cultivated (maize area and total area)
• Farmers who use fertiliser and pesticides are more productive• Hired workers and cash crops are associated with higher maize productivity
MaizeProductivity Quintiles
Maize Yield (Kg/Ha)
Maize Area (Ha)
Total Cultivated Area (Ha)
Fertiliser Use(%)
Pesticide Use (%)
Hire Worker? (%)
Cultivate Cash Crop? (%)
1 – LowestYield 73 0.8 1.8 1.8 3.3 16.1 42.2
2 272 0.8 1.8 3.1 4.6 19.2 45.6
3 514 0.7 1.7 3.9 6.7 20.6 48.8
4 912 0.6 1.6 5.9 7.0 24.5 51.4
5 – Highest Yield 2981 0.4 1.4 7.5 7.9 30.3 57.9
Source: TIA/IAI

Looking closer at the most productive 20%
• The most productive farmers have generally become less concentrated in Niassa and Nampula, with Tete and Manica possessing a higher proportion. The share in Maputo province has increased dramatically.
• The most productive farmers in Tete and Manica use more improved seeds and sell increasing amounts of maize.
• The total area farmed by the most productive farmers decreased significantly nationwide, except in Nampula, Zambézia and Sofala.
• The percentage of the most productive farmers selling maize has fallen in most parts of the country – significantly in Manica, yet increased in Nampula and Inhambane. This implies that those who do sell maize are selling much more of it.
PROVINCIAL DISTRIBUTIONOF TOP 20% MAIZE FARMERS (%) IMPROVED SEEDS (%) TOTAL AREA (ha) FARMER SELLS MAIZE
(%) MAIZE SOLD (KGS)
2002‐06 2007‐12 2002‐06 2007‐12 2002‐06 2007‐12 2002‐06 2007‐12 2002‐06 2007‐12
Niassa 32 24 11 7 1.70 1.61 35 34 175 447
Cabo Delgado 19 17 3 8 1.51 1.26 32 30 158 259
Nampula 25 17 10 10 1.17 1.33 34 40 150 474
Zambézia 20 22 11 11 1.39 1.43 52 49 227 442
Tete 22 27 22 26 2.07 1.64 27 21 471 1050
Manica 25 26 19 26 1.68 1.46 59 36 433 1119
Sofala 20 19 11 11 1.54 1.67 39 33 279 504
Inhambane 5 7 9 9 1.02 0.92 9 18 50 311
Gaza 9 13 12 16 1.17 0.93 13 5 85 169
Maputo 14 25 25 14 0.80 0.42 16 11 116 395
Total 20 20 13 15 1.48 1.39 38 33 239 586
Increase > 5 %Increase 3 ‐ 5%Decrease 3 ‐ 5 %Decrease > 5 %
BOLD values show above average
Source: TIA/IAI

Comparing the top 20% with the rest
• In general, the most productive maize farmers produce and sell significantly more maize, using less land.
• This is particularly apparent in Tete (where higher levels of fertiliser use is found) and in Manica.
• The difference in the quantity of maize produced did not change much over time, yet the quantity of maize sold more than doubled, especially in Tete and Manica.
• More farmers with higher maize yields sell their produce and cash crops than others
DIFFERENCES BETWEEN THE TOP 20% PRODUCTIVE MAIZE FARMERS AND THE BOTTOM 80%, OVER TIME
AVERAGE MAIZE PRODUCTION (KGS) AV. MAIZE SOLD (KGS) FARMER SOLD MAIZE (%) SELLS CASH CROP (%) USE FERTILISER (%)
2002‐06 2007‐12 2002‐06 2007‐12 2002‐06 2007‐12 2002‐06 2007‐12 2002‐06 2007‐12
Niassa + 1233 + 828 + 73 + 238 + 11 + 14 + 6 + 7 + 4 + 3
Cabo Delgado + 489 + 479 + 104 + 124 + 12 + 16 + 1 + 11 0 + 1
Nampula + 327 + 421 + 85 + 316 + 12 + 20 + 6 + 5 + 1 + 4
Zambézia + 511 + 515 + 136 + 278 + 17 + 15 + 9 + 4 + 2 + 1
Tete + 1340 + 1055 + 385 + 730 + 12 + 13 + 14 + 8 + 13 + 11
Manica + 1154 + 1195 + 299 + 851 + 32 + 19 + 7 + 5 + 1 ‐ 1
Sofala + 704 + 813 + 221 + 327 + 21 + 18 + 10 + 12 ‐ 1 + 2
Inhambane + 255 + 404 + 43 + 227 + 6 + 12 + 2 + 1 ‐ 1 + 3
Gaza + 976 + 673 + 73 + 16 + 9 + 2 0 + 1 + 4 + 6
Maputo + 910 + 319 + 97 + 125 + 12 + 8 + 3 + 7 0 + 4
Total + 777 + 744 + 167 + 406 + 18 + 16 + 9 + 7 + 3 + 4
BOLD values show above average
differences
Source: TIA/IAI

CONCLUDING REMARKS

What can we say about jobs?
• Diagnosis and analysis based on existing quantitative evidence
• Four nationally representative micro-surveys: 1996/97, 2002/03, 2008/09 living standards household
surveys 2004/05 labour force survey
• National accounts: value added by sector

Informal jobs dominate
25
4
45
25
21
11
46
22
25
7
49
19
28
5
46
21
31
51
46
32
52
43
41
57
37
41
53
42
020
4060
8010
0
96/97 02/03 04/05 08/09 96/97 02/03 04/05 08/09
Urban Rural
Regular wage Irregular wageInformal / self employed Family worker
% w
orki
ng p
op.

Why is the jobs and ag. agendas important?
• Demographic dynamics unavoidable c. 300,000 new entrants/year to labour market, many unskilled
• Growth of higher productivity firms (e.g., mining) good for aggregate macro/fiscal indicators BUT will have minimal direct positive effect on poverty reduction
without employment growth
• Raising productivity in household agriculture a powerful lever for reducing poverty BUT not so far transformative in itself on aggregate

Strategic policy priorities• Leverage natural resources to stimulate pro-jobs
structural transformation (an opportunity) -> time to scale up
• Specifically aim for: Emp loyment g rowth i n h i ghe r va l ue s econda ry
and t e r t i a r y i ndu s t r i e s S tep - i n c rea se i n a g r i cu l t u ra l p roduc t i v i t yBOTH commerc i a l and sma l lho lder
ag r i cu l tu re encourag ing l i nk s be tween them
Expo r t pu sh ( ou t s i de o f na tu ra l r e sou r ce s )• NOT an agenda of neutral or marginal improvements –
decisive transformation required

www.wider.unu.eduHelsinki, Finland