presentation (slides) - bebr.ufl.edu reports/ri3...understanding racial inequity in alachua county...
TRANSCRIPT
Understanding Racial Inequity in Alachua County
(January, 2018)
Hector H. SandovalBureau of Economic and Business Research (BEBR)
Department of Economics
College of Liberal Arts and SciencesUniversity of Florida
Racial Inequity in Alachua County

Understanding Racial Inequity in Alachua County
Racial inequity is a long-standing issue in every community across the United States, compromising
the opportunities of minority individuals and families
The purpose of this study is to provide a picture of racial inequity in Alachua County on several dimensions of human well-being
Bureau of Economic and Business Research
IntroductionRacial Inequity in Alachua County
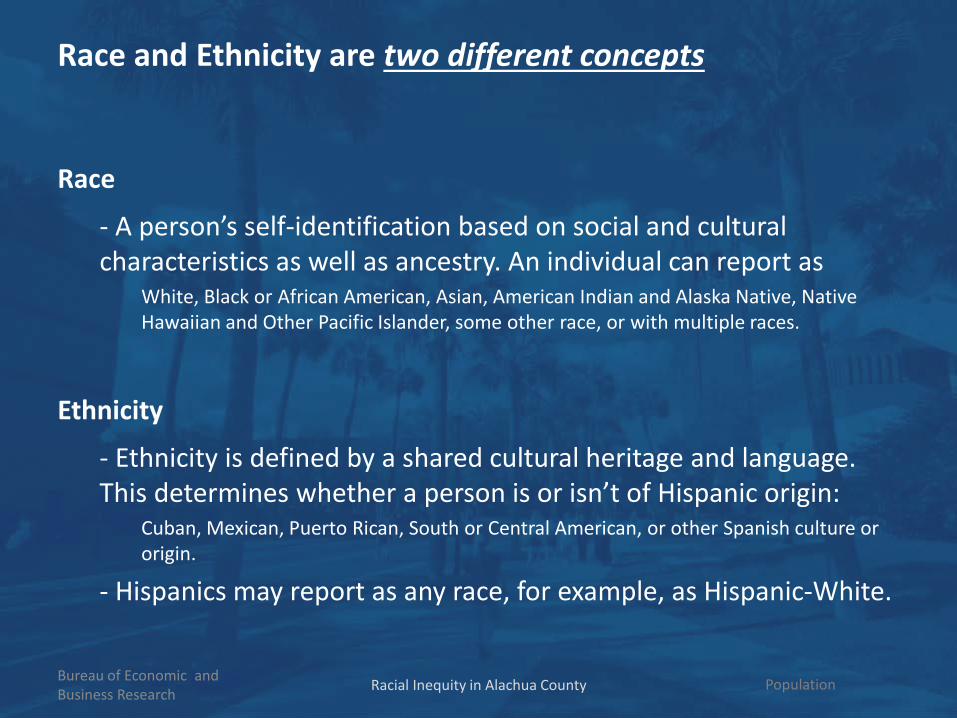
Race and Ethnicity are two different concepts
Race
- A person’s self-identification based on social and cultural characteristics as well as ancestry. An individual can report as
White, Black or African American, Asian, American Indian and Alaska Native, Native Hawaiian and Other Pacific Islander, some other race, or with multiple races.
Ethnicity
- Ethnicity is defined by a shared cultural heritage and language. This determines whether a person is or isn’t of Hispanic origin:
Cuban, Mexican, Puerto Rican, South or Central American, or other Spanish culture or origin.
- Hispanics may report as any race, for example, as Hispanic-White.
Bureau of Economic and Business Research Racial Inequity in Alachua County Population
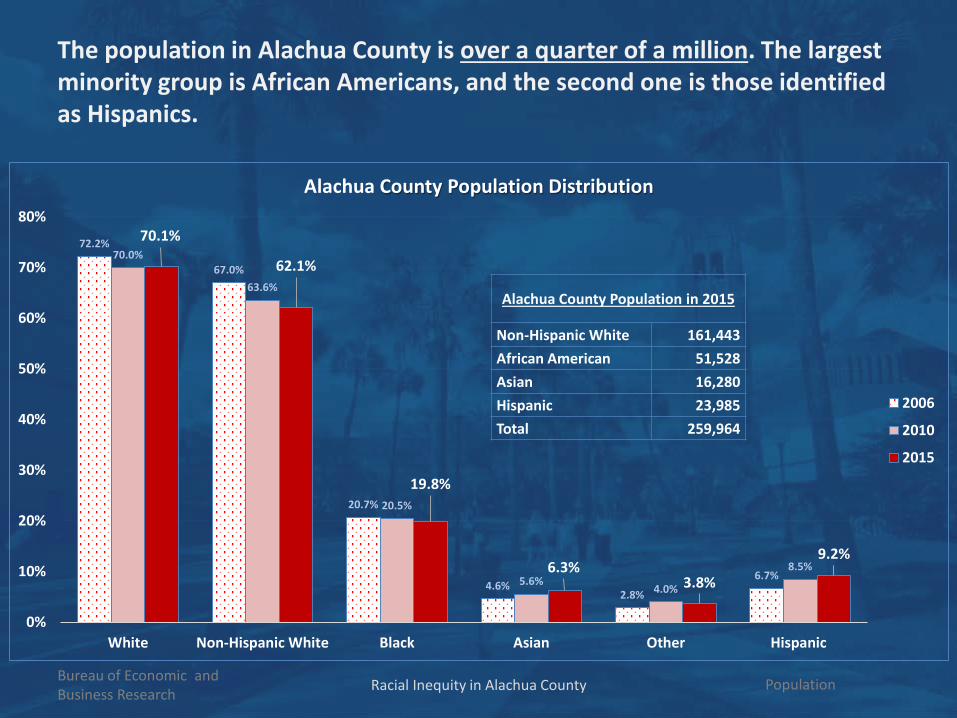
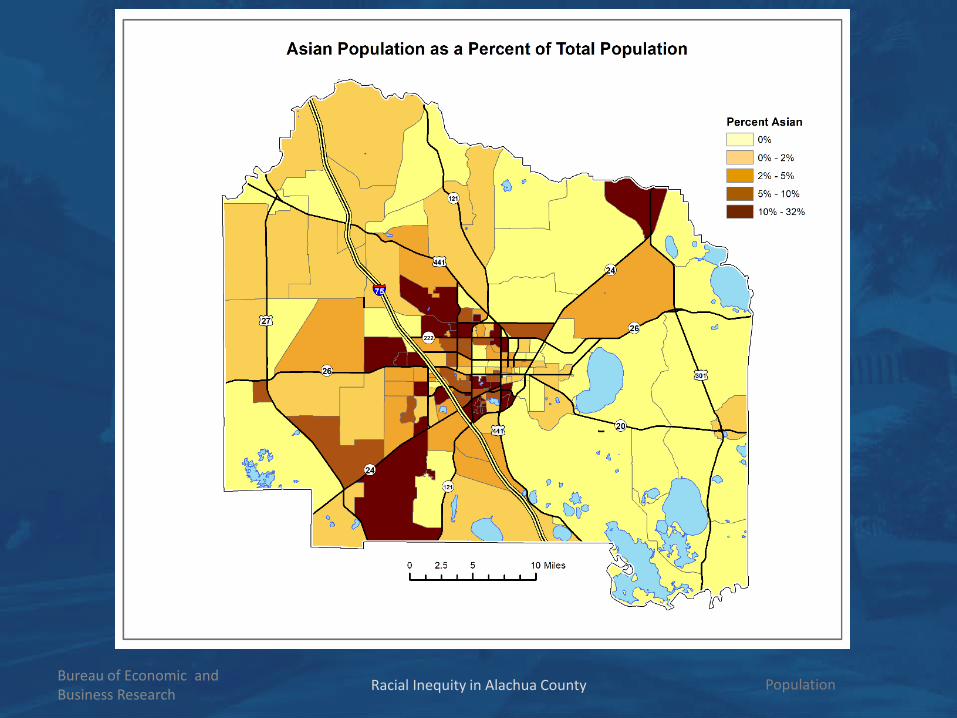
The population in Alachua County is over a quarter of a million. The largest minority group is African Americans, and the second one is those identified as Hispanics.
Bureau of Economic and Business Research Racial Inequity in Alachua County Population
Alachua County Population in 2015
Non-Hispanic White 161,443African American 51,528Asian 16,280Hispanic 23,985Total 259,964
72.2%
67.0%
20.7%
4.6%2.8%
6.7%
70.0%
63.6%
20.5%
5.6%4.0%
8.5%
70.1%
62.1%
19.8%
6.3%3.8%
9.2%
0%
10%
20%
30%
40%
50%
60%
70%
80%
White Non-Hispanic White Black Asian Other Hispanic
Alachua County Population Distribution
2006
2010
2015

Bureau of Economic and Business Research Racial Inequity in Alachua County Population
Bureau of Economic and Business Research Racial Inequity in Alachua County Population
Bureau of Economic and Business Research Racial Inequity in Alachua County Population

Bureau of Economic and Business Research Racial Inequity in Alachua County Population
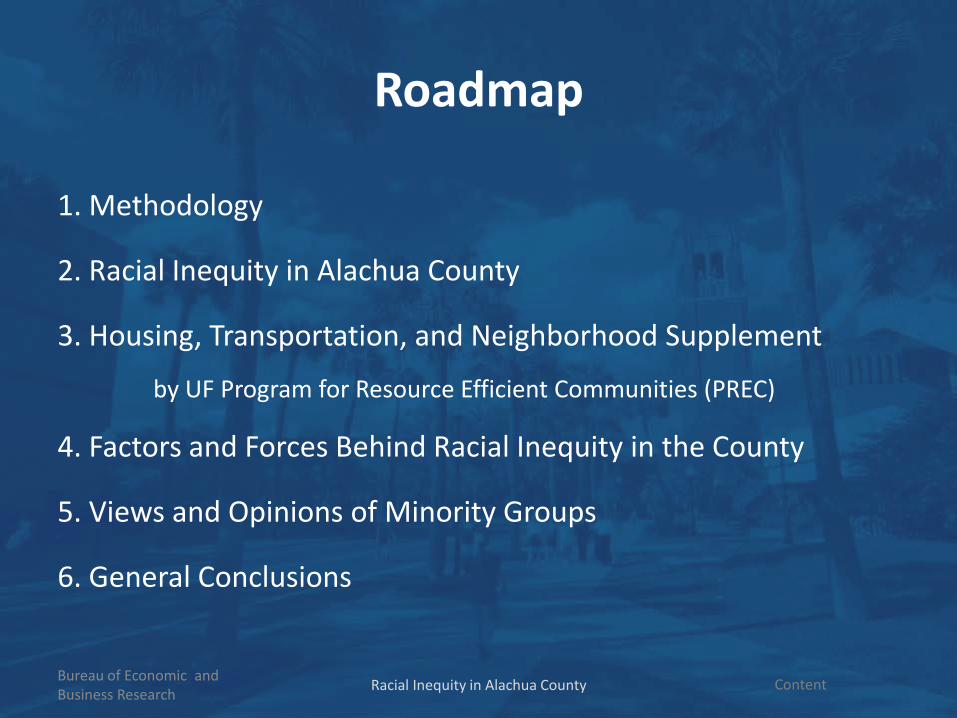
Roadmap
1. Methodology
2. Racial Inequity in Alachua County
3. Housing, Transportation, and Neighborhood Supplement
by UF Program for Resource Efficient Communities (PREC)
4. Factors and Forces Behind Racial Inequity in the County
5. Views and Opinions of Minority Groups
6. General Conclusions
Bureau of Economic and Business Research Racial Inequity in Alachua County Content
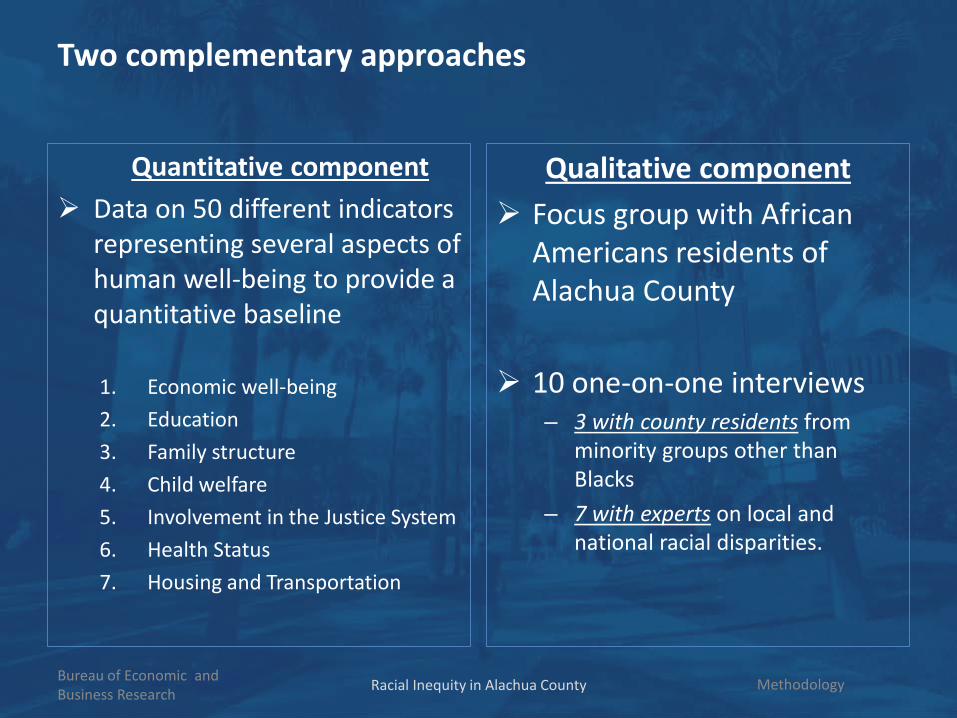
Two complementary approaches
Quantitative component Data on 50 different indicators
representing several aspects of human well-being to provide a quantitative baseline
1. Economic well-being2. Education3. Family structure4. Child welfare5. Involvement in the Justice System 6. Health Status7. Housing and Transportation
Qualitative component Focus group with African
Americans residents of Alachua County
10 one-on-one interviews– 3 with county residents from
minority groups other than Blacks
– 7 with experts on local and national racial disparities.
Bureau of Economic and Business Research Racial Inequity in Alachua County Methodology

Roadmap
1. Methodology
2. Racial Inequity in Alachua County
3. Housing, Transportation, and Neighborhood Supplement
by UF Program for Resource Efficient Communities (PREC)
4. Factors and Forces Behind Racial Inequity in the County
5. Views and Opinions of Minority Groups
6. General Conclusions
Bureau of Economic and Business Research Racial Inequity in Alachua County Content

For almost all households, the sale of their labor services constitutes a major source of income. Losing or not being able to find a job can harm a family’s economic well-being.
Bureau of Economic and Business Research
Racial Disparities
5.8%
8.1%
6.7%
14.7%15.6%
14.8%
8.5%
6.3% 6.4%
7.8%
9.6% 9.8%
0%
2%
4%
6%
8%
10%
12%
14%
16%
18%
Alachua Florida USA
Unemployment Rate in 2015
Non-Hispanic White
Black
Asian
Hispanic
Racial Inequity in Alachua County
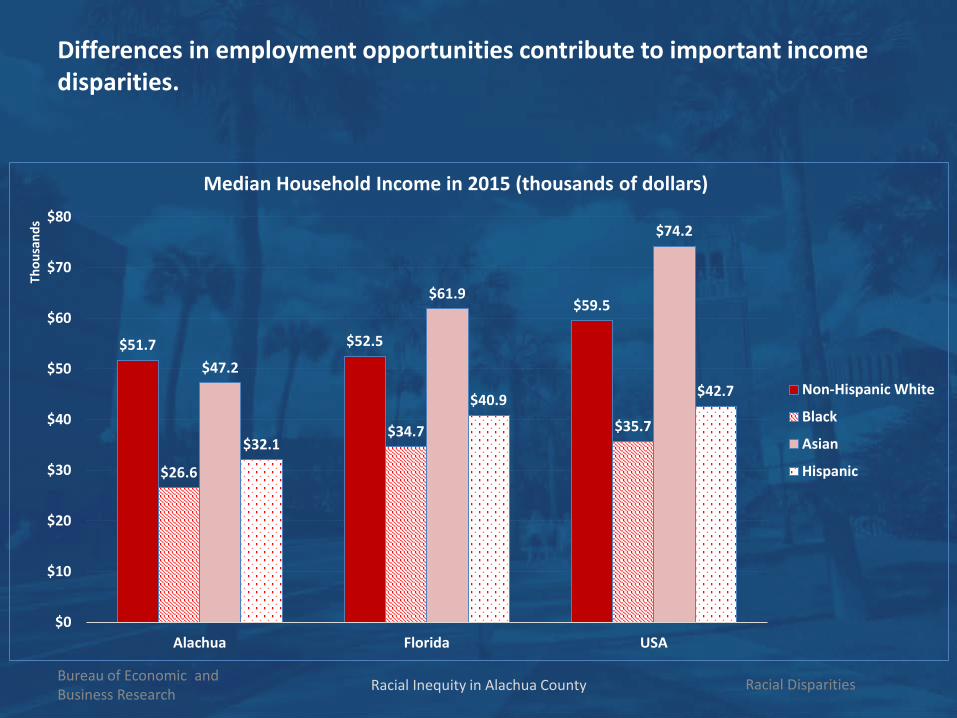
Differences in employment opportunities contribute to important income disparities.
Bureau of Economic and Business Research Racial Inequity in Alachua County
$51.7 $52.5
$59.5
$26.6
$34.7 $35.7
$47.2
$61.9
$74.2
$32.1
$40.9 $42.7
$0
$10
$20
$30
$40
$50
$60
$70
$80
Alachua Florida USA
Thou
sand
s
Median Household Income in 2015 (thousands of dollars)
Non-Hispanic White
Black
Asian
Hispanic
Racial Disparities

Racial Inequity in Alachua County
Unemployment
Unemployment rate is highest for Blacks/African Americans
Blacks in the county are 2.5 times more likely to be unemployed compared to non-Hispanic Whites.
Asians and Hispanics are 1.5 times more likely
Income
Median household income for Blacks is equivalent to 51% of non-Hispanic Whites.
For Hispanics is equivalent to 62%
Income greater than $50,000 25.7% of Black households 34.3% of Hispanic households 47.4% of Asian 51.6 % of Non-Hispanic White
Bureau of Economic and Business Research
Racial DisparitiesRacial Inequity in Alachua County
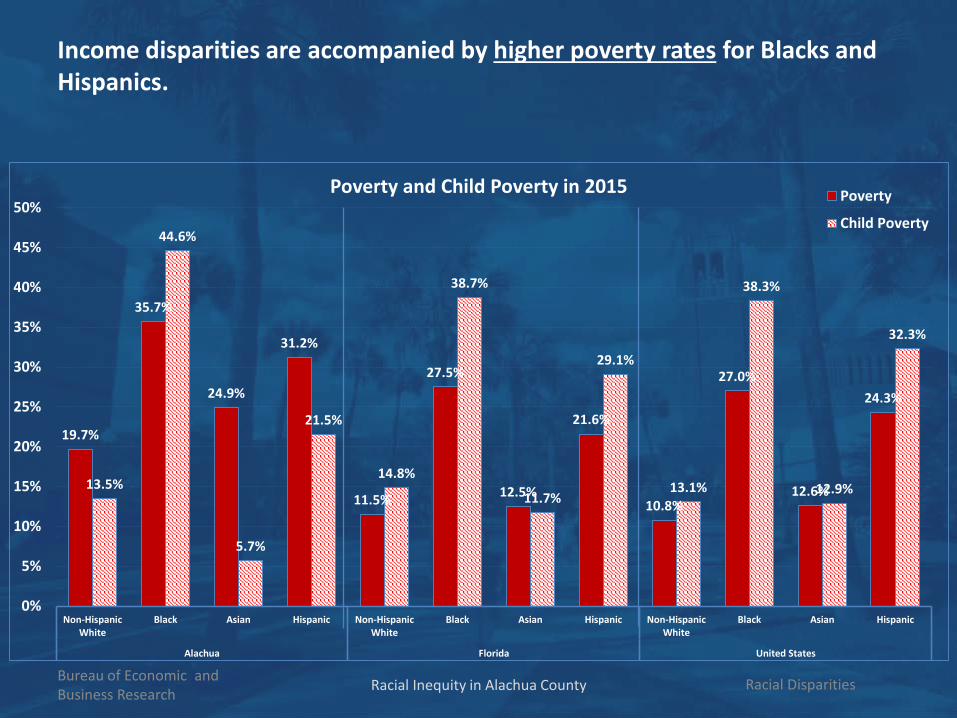
Income disparities are accompanied by higher poverty rates for Blacks and Hispanics.
Bureau of Economic and Business Research
19.7%
35.7%
24.9%
31.2%
11.5%
27.5%
12.5%
21.6%
10.8%
27.0%
12.6%
24.3%
13.5%
44.6%
5.7%
21.5%
14.8%
38.7%
11.7%
29.1%
13.1%
38.3%
12.9%
32.3%
0%
5%
10%
15%
20%
25%
30%
35%
40%
45%
50%
Non-HispanicWhite
Black Asian Hispanic Non-HispanicWhite
Black Asian Hispanic Non-HispanicWhite
Black Asian Hispanic
Alachua Florida United States
Poverty and Child Poverty in 2015 Poverty
Child Poverty
Racial DisparitiesRacial Inequity in Alachua County

Racial Inequity in Alachua County
Poverty
Alachua County’s poverty rate is higher than that in Florida and the U.S.
In Alachua County, 35.7% of Blacks are considered
in poverty 31.2% of Hispanics are
considered in poverty
e.g. for a family of four with two children under age 18, the poverty line was $24,036 in 2015.
Child Poverty
Starker differences for Blacks/African Americans:
Overall, 44.6% of Black children are in poverty
Black children are 3.3 times more likely to be in poverty than non-Hispanic White children
Bureau of Economic and Business Research
Racial DisparitiesRacial Inequity in Alachua County
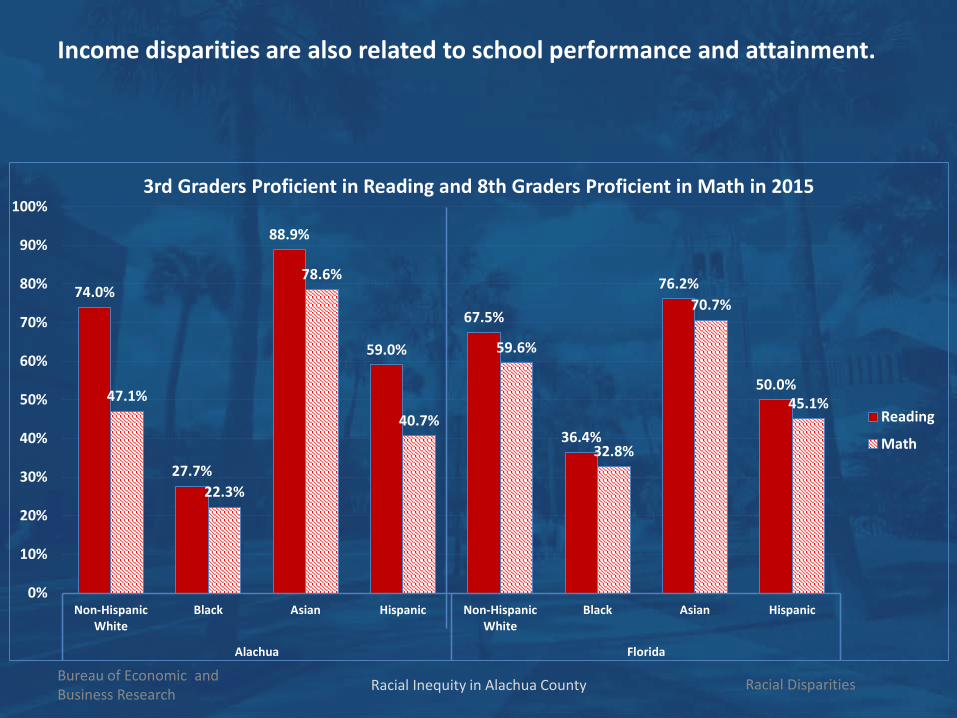
Income disparities are also related to school performance and attainment.
Bureau of Economic and Business Research
74.0%
27.7%
88.9%
59.0%
67.5%
36.4%
76.2%
50.0%47.1%
22.3%
78.6%
40.7%
59.6%
32.8%
70.7%
45.1%
0%
10%
20%
30%
40%
50%
60%
70%
80%
90%
100%
Non-HispanicWhite
Black Asian Hispanic Non-HispanicWhite
Black Asian Hispanic
Alachua Florida
3rd Graders Proficient in Reading and 8th Graders Proficient in Math in 2015
Reading
Math
Racial DisparitiesRacial Inequity in Alachua County

Disparities in education not only appear in performance, but also in achievement.
Bureau of Economic and Business Research
77.2%
54.8%
95.8%
63.7%
79.5%
63.7%
88.5%
73.0%
85.0%
66.8%
92.4%
82.1% 85.1%
72.3%
91.9%
74.5%
0%
20%
40%
60%
80%
100%
120%
Non-HispanicWhite
Black Asian Hispanic Non-HispanicWhite
Black Asian Hispanic
Alachua Florida
High School Graduation Rate
2011
2015
Racial DisparitiesRacial Inequity in Alachua County

Racial Inequity in Alachua County
Performance
Black 3rd graders have the lowest proficiency in reading in Alachua County, and are lower than their peers in the state.
Similarly, Black 8th graders have the lowest proficiency in math
Achievement
Blacks are less likely to complete high school than other racial groups
More than 50% of those who drop out of high school in Alachua County are Black
Bureau of Economic and Business Research
Racial DisparitiesRacial Inequity in Alachua County
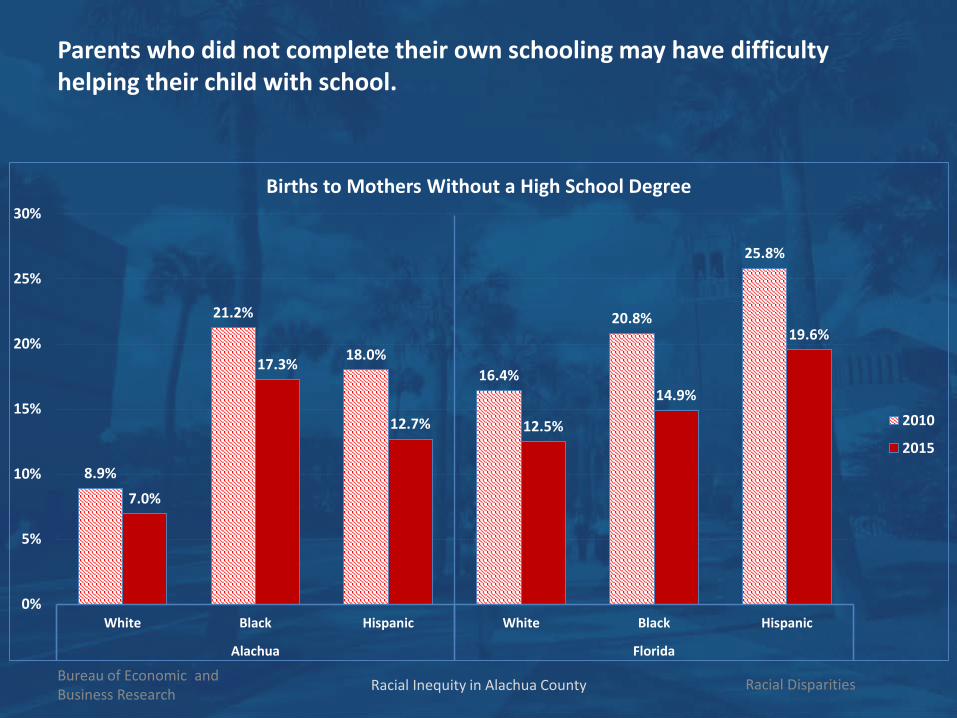
Parents who did not complete their own schooling may have difficulty helping their child with school.
Bureau of Economic and Business Research
8.9%
21.2%
18.0%16.4%
20.8%
25.8%
7.0%
17.3%
12.7% 12.5%
14.9%
19.6%
0%
5%
10%
15%
20%
25%
30%
White Black Hispanic White Black Hispanic
Alachua Florida
Births to Mothers Without a High School Degree
2010
2015
Racial DisparitiesRacial Inequity in Alachua County
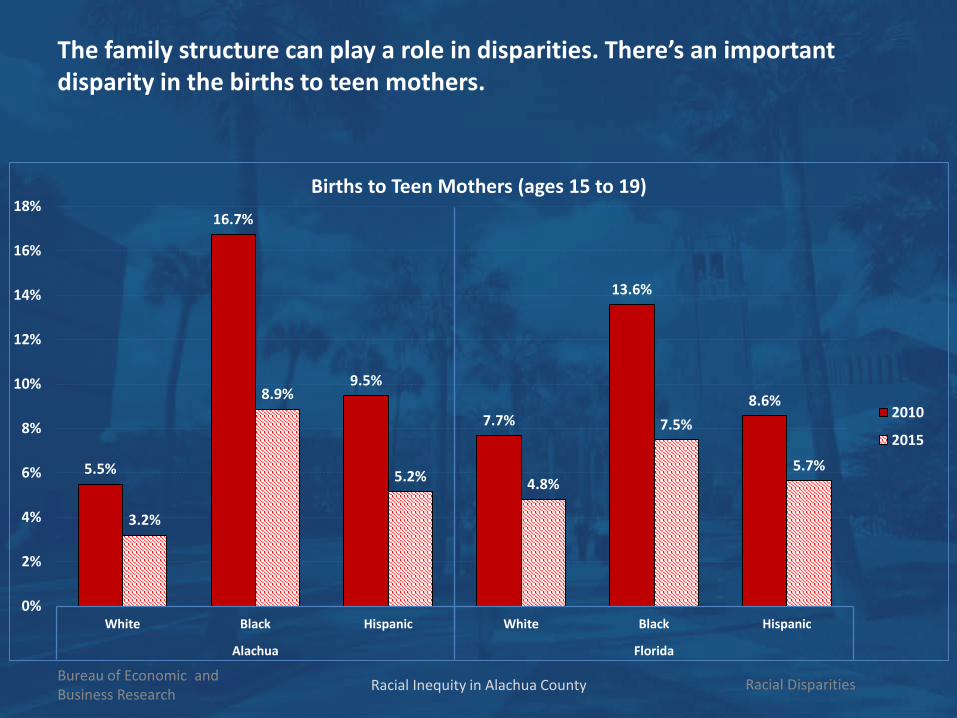
The family structure can play a role in disparities. There’s an important disparity in the births to teen mothers.
Bureau of Economic and Business Research
5.5%
16.7%
9.5%
7.7%
13.6%
8.6%
3.2%
8.9%
5.2% 4.8%
7.5%
5.7%
0%
2%
4%
6%
8%
10%
12%
14%
16%
18%
White Black Hispanic White Black Hispanic
Alachua Florida
Births to Teen Mothers (ages 15 to 19)
2010
2015
Racial DisparitiesRacial Inequity in Alachua County

Another important issue is disparities in out of school suspension.
Bureau of Economic and Business Research
Racial Disparities
2.8%
14.3%
0.1%
3.5%2.5%
13.1%
0.0%
3.4%
0%
2%
4%
6%
8%
10%
12%
14%
16%
White Black Asian Hispanic
Alachua
Out of School Suspension
2013-14
2014-15
Racial Inequity in Alachua County

The economic and educational disparities contribute to a pipeline of accumulating factors that results in a starker difference when considering the justice system.
Bureau of Economic and Business Research
0.4%
3.7%
0.3%0.5%
2.5%
0.4%
0.0%
0.5%
1.0%
1.5%
2.0%
2.5%
3.0%
3.5%
4.0%
White Black Hispanic White Black Hispanic
Alachua Florida
Juvenile Detention Rate in 2015 (incidents per 100 residents)
2.5%
16.8%
2.4%3.1%
9.7%
2.1%
0%
2%
4%
6%
8%
10%
12%
14%
16%
18%
White Black Hispanic White Black Hispanic
Alachua Florida
Juvenile Arrest Rate in 2015 (incidents per 100 residents)
Racial DisparitiesRacial Inequity in Alachua County

Racial Inequity in Alachua County
Juvenile Justice
Black teens are 9.9 times more likely to be detained
Black teens are 6.9 times more likely to get arrested
Blacks are also more likely to be transferred to adult court
Justice System
Overall, Black adults are 3.9 times mores likely to be arrested
A disproportional number of Blacks incarcerated 2.4% of total Blacks have
been incarcerated in Alachua County in 2015
Around 70.8% of the total inmate population in Alachua County is Black
Bureau of Economic and Business Research
Racial DisparitiesRacial Inequity in Alachua County

There are also important disparities related to healthcare and health status.
Bureau of Economic and Business Research
Racial Disparities
11.5%12.8%
9.0%
17.5%
21.7%
15.3%
11.6%
18.9%
12.5%
18.6%
28.0%
25.8%
0%
5%
10%
15%
20%
25%
30%
Alachua Florida USA
Uninsured Rate in 2015
Non-Hispanic White
Black
Asian
Hispanic
Racial Inequity in Alachua County
Roadmap
1. Methodology
2. Racial Inequity in Alachua County
3. Housing, Transportation, and Neighborhood Supplement
by UF Program for Resource Efficient Communities (PREC)
4. Factors and Forces Behind Racial Inequity in the County
5. Views and Opinions of Minority Groups
6. General Conclusions
Bureau of Economic and Business Research
ContentRacial Inequity in Alachua County

Bureau of Economic and Business Research
PopulationRacial Inequity in Alachua County
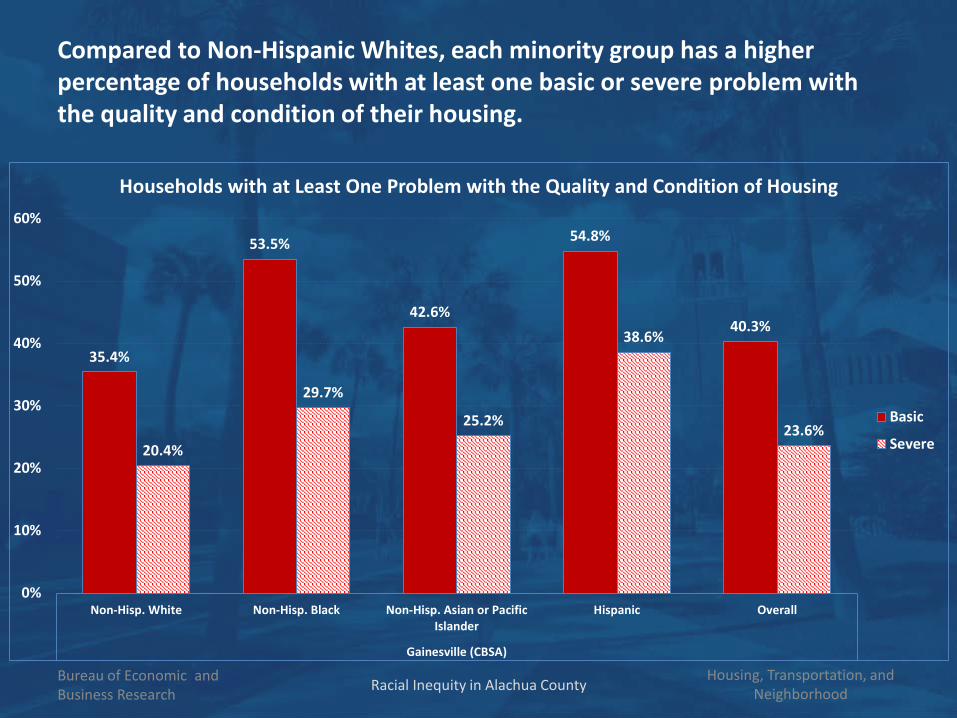
Compared to Non-Hispanic Whites, each minority group has a higher percentage of households with at least one basic or severe problem with the quality and condition of their housing.
Bureau of Economic and Business Research
Housing, Transportation, and Neighborhood
35.4%
53.5%
42.6%
54.8%
40.3%
20.4%
29.7%
25.2%
38.6%
23.6%
0%
10%
20%
30%
40%
50%
60%
Non-Hisp. White Non-Hisp. Black Non-Hisp. Asian or PacificIslander
Hispanic Overall
Gainesville (CBSA)
Households with at Least One Problem with the Quality and Condition of Housing
Basic
Severe
Racial Inequity in Alachua County

Energy consumption adjusted for home size shows differences by race.
Bureau of Economic and Business Research
Housing, Transportation, and Neighborhood
9.610.1 9.9
10.2
11.110.4
7.5
9.49.1
9.49.8 10.0
0.0
2.0
4.0
6.0
8.0
10.0
12.0
Clay GRU Newberry
Energy Use (ekWh) per square foot of Home Areas in Alachua County
White
Black
Asian
Hispanic
Racial Inequity in Alachua County
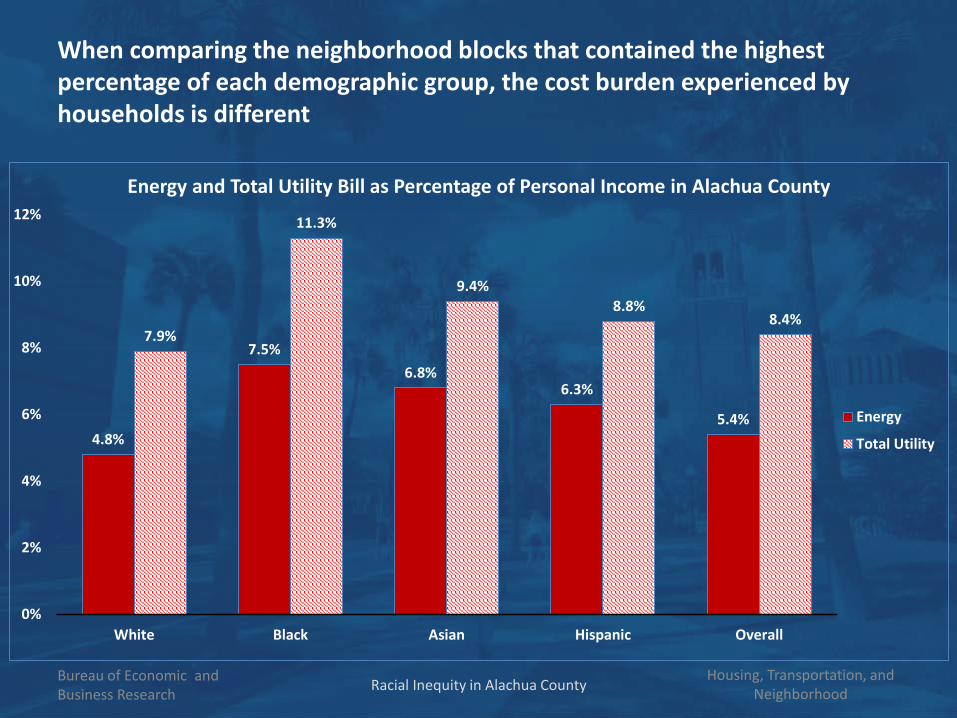
When comparing the neighborhood blocks that contained the highest percentage of each demographic group, the cost burden experienced by households is different
Bureau of Economic and Business Research
Housing, Transportation, and Neighborhood
4.8%
7.5%6.8%
6.3%
5.4%
7.9%
11.3%
9.4%8.8%
8.4%
0%
2%
4%
6%
8%
10%
12%
White Black Asian Hispanic Overall
Energy and Total Utility Bill as Percentage of Personal Income in Alachua County
Energy
Total Utility
Racial Inequity in Alachua County
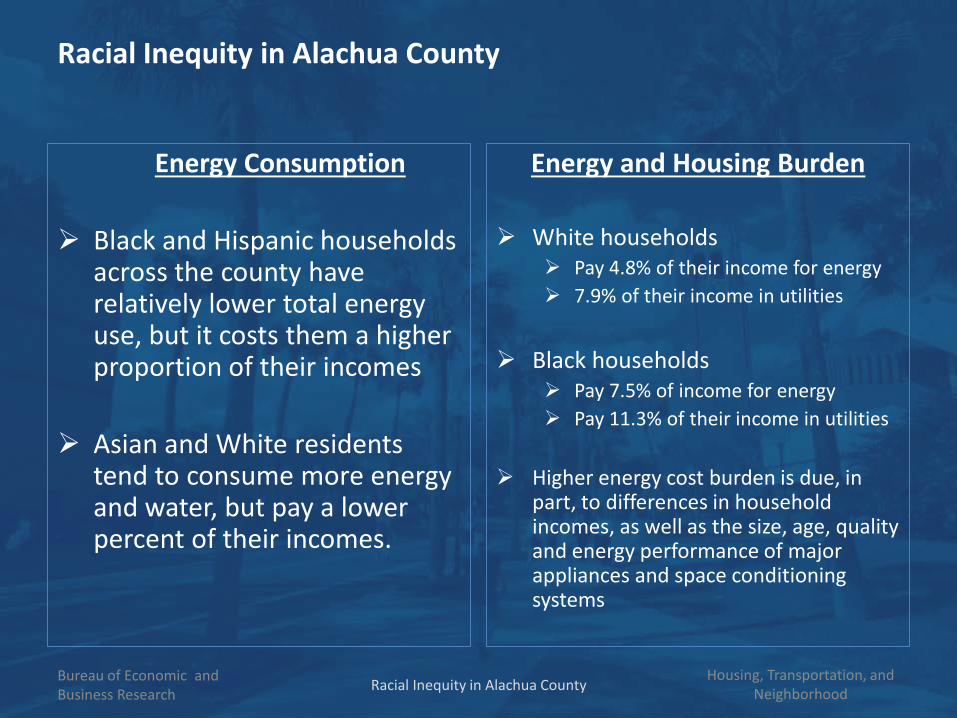
Racial Inequity in Alachua County
Energy Consumption
Black and Hispanic households across the county have relatively lower total energy use, but it costs them a higher proportion of their incomes
Asian and White residents tend to consume more energy and water, but pay a lower percent of their incomes.
Energy and Housing Burden
White households Pay 4.8% of their income for energy 7.9% of their income in utilities
Black households Pay 7.5% of income for energy Pay 11.3% of their income in utilities
Higher energy cost burden is due, in part, to differences in household incomes, as well as the size, age, quality and energy performance of major appliances and space conditioning systems
Bureau of Economic and Business Research
Housing, Transportation, and NeighborhoodRacial Inequity in Alachua County
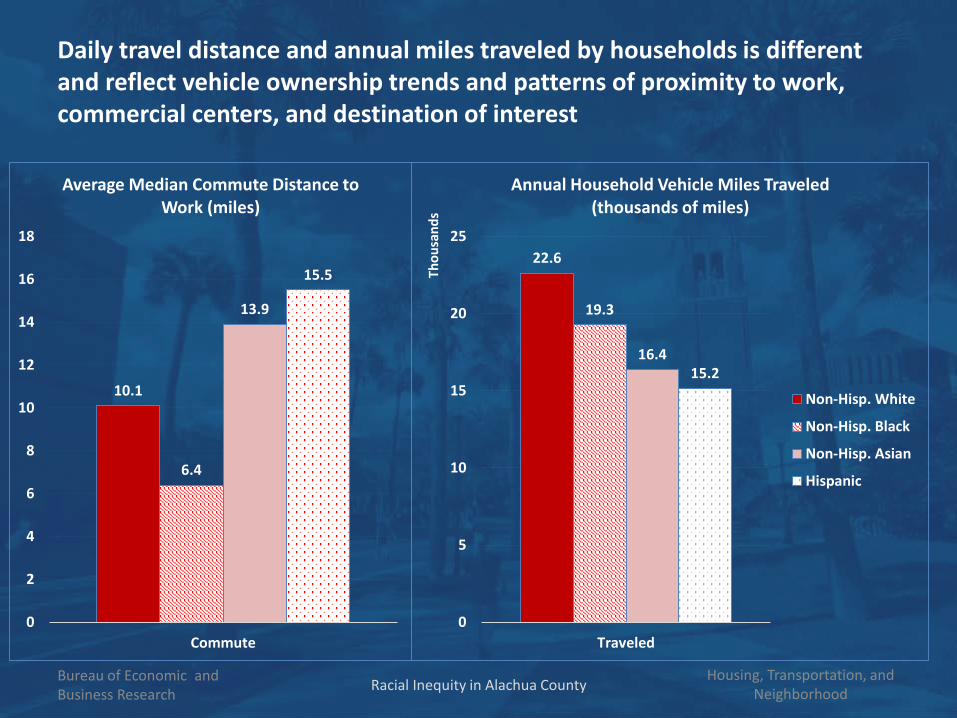
Daily travel distance and annual miles traveled by households is different and reflect vehicle ownership trends and patterns of proximity to work, commercial centers, and destination of interest
Bureau of Economic and Business Research
Housing, Transportation, and Neighborhood
10.1
6.4
13.9
15.5
0
2
4
6
8
10
12
14
16
18
Commute
Average Median Commute Distance to Work (miles)
22.6
19.3
16.415.2
0
5
10
15
20
25
Traveled
Thou
sand
s
Annual Household Vehicle Miles Traveled (thousands of miles)
Non-Hisp. White
Non-Hisp. Black
Non-Hisp. Asian
Hispanic
Racial Inequity in Alachua County
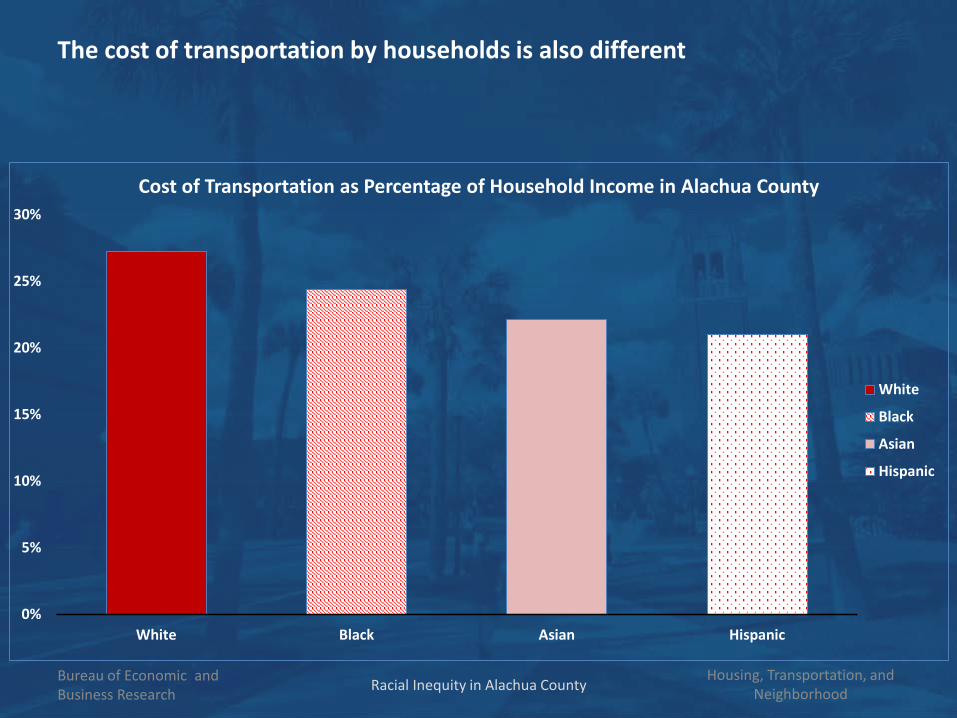
The cost of transportation by households is also different
Bureau of Economic and Business Research
Housing, Transportation, and Neighborhood
0%
5%
10%
15%
20%
25%
30%
White Black Asian Hispanic
Cost of Transportation as Percentage of Household Income in Alachua County
White
Black
Asian
Hispanic
Racial Inequity in Alachua County
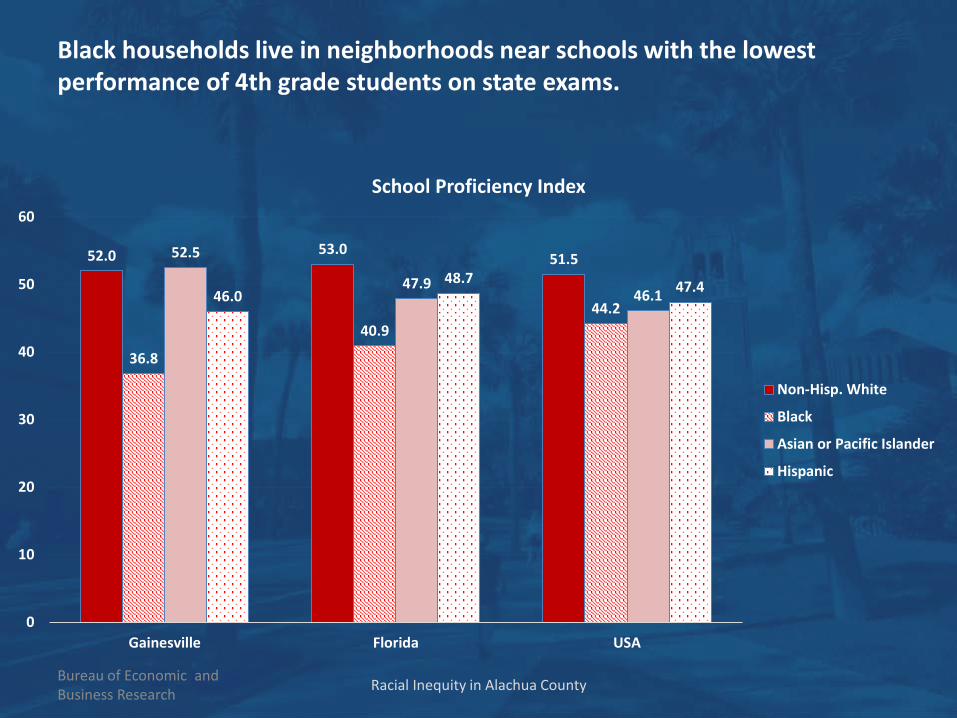
Black households live in neighborhoods near schools with the lowest performance of 4th grade students on state exams.
Bureau of Economic and Business Research
52.0 53.051.5
36.8
40.944.2
52.5
47.946.146.0
48.7 47.4
0
10
20
30
40
50
60
Gainesville Florida USA
School Proficiency Index
Non-Hisp. White
Black
Asian or Pacific Islander
Hispanic
Racial Inequity in Alachua County
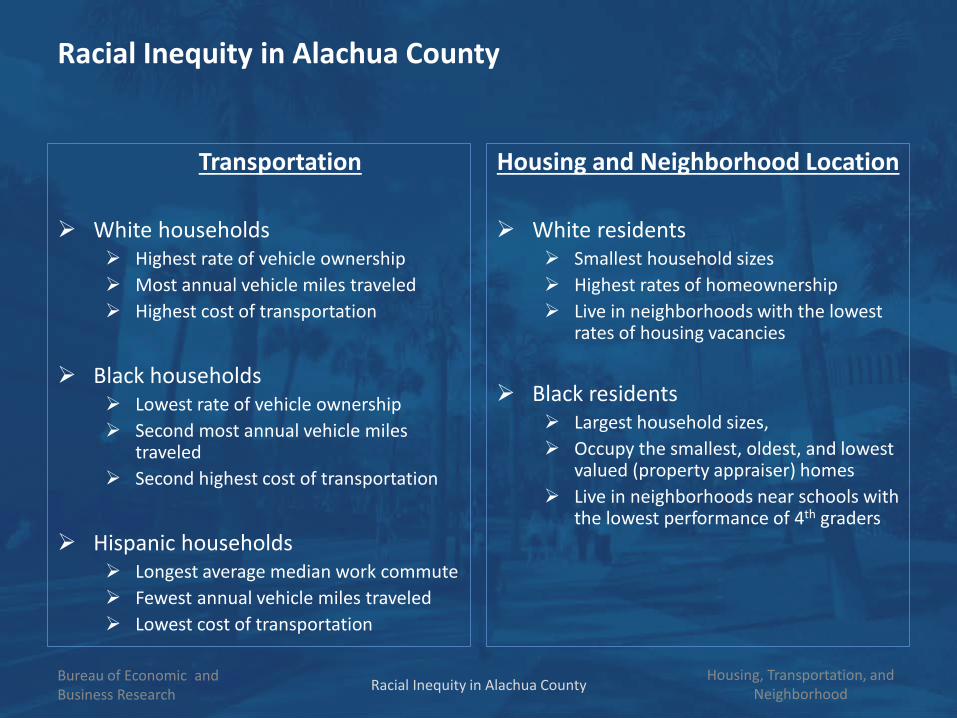
Racial Inequity in Alachua County
Transportation
White households Highest rate of vehicle ownership Most annual vehicle miles traveled Highest cost of transportation
Black households Lowest rate of vehicle ownership Second most annual vehicle miles
traveled Second highest cost of transportation
Hispanic households Longest average median work commute Fewest annual vehicle miles traveled Lowest cost of transportation
Housing and Neighborhood Location
White residents Smallest household sizes Highest rates of homeownership Live in neighborhoods with the lowest
rates of housing vacancies
Black residents Largest household sizes, Occupy the smallest, oldest, and lowest
valued (property appraiser) homes Live in neighborhoods near schools with
the lowest performance of 4th graders
Bureau of Economic and Business Research
Housing, Transportation, and NeighborhoodRacial Inequity in Alachua County
Roadmap
1. Methodology
2. Racial Inequity in Alachua County
3. Housing, Transportation, and Neighborhood Supplement
by UF Program for Resource Efficient Communities (PREC)
4. Factors and Forces Behind Racial Inequity in the County
5. Views and Opinions of Minority Groups
6. General Conclusions
Bureau of Economic and Business Research
ContentRacial Inequity in Alachua County

Issues that contribute to racial inequity in Alachua County
1. Geography of Alachua County
2. Limited provision of services (affecting education)
3. Education system
4. Lack of wealth accumulation
5. Issues in the local labor market
6. The justice system vis-à-vis minorities
Bureau of Economic and Business Research
Factors and ForcesRacial Inequity in Alachua County

1. Geography of Alachua County
East side of Gainesville is home to a large percent of minorities. These residents tend to purchase lower-priced homes
Economic development is focused on the West side1) East side tends to have more sensitive wetlands, making development difficult and more costly2) East side does not attract developers who tend to look for customers with ample disposable income
The ability of an area to attract development is critical to creating jobs and services, including schools.
Bureau of Economic and Business Research
Factors and ForcesRacial Inequity in Alachua County
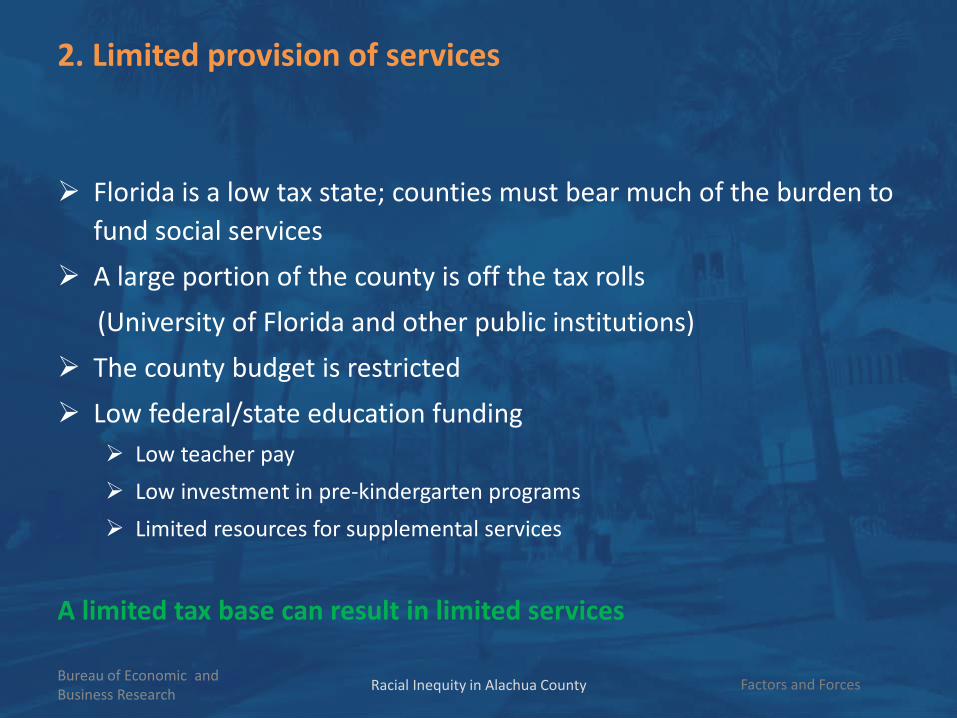
2. Limited provision of services
Florida is a low tax state; counties must bear much of the burden to fund social services
A large portion of the county is off the tax rolls (University of Florida and other public institutions)
The county budget is restricted Low federal/state education funding
Low teacher pay Low investment in pre-kindergarten programs Limited resources for supplemental services
A limited tax base can result in limited services
Bureau of Economic and Business Research
Factors and ForcesRacial Inequity in Alachua County

3. Education system
In minority neighborhoods, the student body can be largely composed of minorities Alachua County magnet schools
Minority’s perceptions might be unintentionally reinforced as these minorities perform at lower levels than the high performing students
School zero tolerance policies When a student is suspended,
They fall behind and may also develop resentment They are likely to be at home alone and might create a difficult situation
for the family and/or other problems that might get reported to the police
Bureau of Economic and Business Research
Factors and ForcesRacial Inequity in Alachua County

4. Lack of wealth accumulation
Bureau of Economic and Business Research
61.0%
42.0% 39.6%
36.5%
76.9%
50.1%
69.5%
57.0%60.9%
37.6%39.5%
34.3%
73.4%
45.1%
68.7%
51.7%
0%
10%
20%
30%
40%
50%
60%
70%
80%
90%
Non-HispanicWhite
Black Asian Hispanic Non-HispanicWhite
Black Asian Hispanic
Alachua Florida
Homeownership Rate
2010
2015
Factors and ForcesRacial Inequity in Alachua County

4. Lack of wealth accumulation
Bureau of Economic and Business Research
$155
$117 $113$121
$65
$83
$186
$95
$121
$161
$86
$115
$152
$102$108
$0
$20
$40
$60
$80
$100
$120
$140
$160
$180
$200
Clay GRU Newberry
Thou
sand
s
Average Property Values in Alachua County (thousands of dollars)
White
Black
Asian
Hispanic
Overall
Factors and ForcesRacial Inequity in Alachua County

5. Local labor market
Mismatch between the skills acquired and skills needed Disproportionately higher percentage of minorities with lower educational
levels and skills Most of the jobs require postsecondary vocational training, an associate’s or
higher college degree While jobs exist for both higher and lower skill workers, the unemployment
rate is higher for lower skill workers
College students can crowd out the job opportunities for local minorities Employers see college students as a very attractive employees:
• Highly flexible schedules• Advanced knowledge of technology
Bureau of Economic and Business Research
Factors and ForcesRacial Inequity in Alachua County

6. The justice system vis-à-vis minorities
Employment for anyone with a criminal conviction is difficult because having a criminal record is a strike against them for most employers
African-American men are disproportionally affected because there is a larger percentage of African-American men incarcerated
Bureau of Economic and Business Research
Factors and ForcesRacial Inequity in Alachua County

Roadmap
1. Methodology
2. Racial Inequity in Alachua County
3. Housing, Transportation, and Neighborhood Supplement
by UF Program for Resource Efficient Communities (PREC)
4. Factors and Forces Behind Racial Inequity in the County
5. Views and Opinions of Minority Groups
6. General Conclusions
Bureau of Economic and Business Research
ContentRacial Inequity in Alachua County

Focus group participants perceptions
Acknowledge that they live with inequality on a daily basis
Perceive a tradition of racism and unequal treatment based on race
Believe racism exists in African American interactions with both the justice and educational systems.
Believe finding a job is difficult, especially with a criminal record
“They should have a program for Black men when they come out of prison to help them get a job.”
(Participant in the focus group)
Bureau of Economic and Business Research
Minorities’ Point of ViewRacial Inequity in Alachua County

Focus group participants perceptions
Recognize that the primary solution to the problem is education
Children should be encouraged and helped to complete high school education at minimum
Zero tolerance policies
A child may be having problems for reasons related to the child’s home environment Lack of proper food and clothing Problems within the family or absence of a family member
Bureau of Economic and Business Research
Minorities’ Point of ViewRacial Inequity in Alachua County

Other minorities perceptions
Understand that children need to focus on education Take responsibility for their child’s education, but teachers
play an important role Feel schools are not getting the resources they need Aware of the difficulty of getting jobs in the county
“It’s very hard getting a job because more of the college students are coming in. They would rather give the job to a college student than to have the people who
live here working.” (Participant in the one-on-one interviews)
Bureau of Economic and Business Research
Minorities’ Point of ViewRacial Inequity in Alachua County
Roadmap
1. Methodology
2. Racial Inequity in Alachua County
3. Housing, Transportation, and Neighborhood Supplement
by UF Program for Resource Efficient Communities (PREC)
4. Factors and Forces Behind Racial Inequity in the County
5. Views and Opinions of Minority Groups
6. General Conclusions
Bureau of Economic and Business Research
ContentRacial Inequity in Alachua County

General Conclusions
Racial inequity is a massive tangle of issues that are deeply connected.
Improvement in one area might be possible, but it may draw resources away from others.
Focusing community efforts in two areas could have a positive long-term impact on all aspects of well-being:
Education
Employment
Bureau of Economic and Business Research
Policy RecommendationsRacial Inequity in Alachua County

General Conclusions
Provide a high quality educational experience
A successfully educated resident will have a higher lifetime income, more and better employment opportunities, and is
less likely to become involved with the criminal justice system
High school diploma is perceived to be the baseline College is not necessary to get a good job, but getting good skills training is
essential
Bureau of Economic and Business Research
Policy RecommendationsRacial Inequity in Alachua County

General Conclusions
Finally, more jobs paying a living wage with a wider diversity of skills and educational requirements are needed
Jobs are essential to lift people out of poverty, improve educational outcomes, and reduce crime
Bureau of Economic and Business Research
Policy RecommendationsRacial Inequity in Alachua County
Understanding Racial Inequity in Alachua County
Report will be available:
https://www.bebr.ufl.edu/economics/racial-inequity
Please let us know how you are using the information contained in this report by
emailing United Way of North Central Florida
Racial Inequity in Alachua County