presentation semperit april2008 · pdf file · 2009-02-257/28 division semperflex...
TRANSCRIPT

1/28

2/28
SEMPERIT AT GLANCESEMPERIT AT GLANCE
Worldwide leading manufacturer of rubber products with four divisions
Top market positions in all divisions
Synergies in:
Production
R&D
Purchasing
Sales
17 years of uninterrupted record earnings

3/28
CORPORATE STRATEGYCORPORATE STRATEGY
FOCUS To concentrate on four core business areas and be a dominant player in each sector
INTERNATIONALISATION To consistently internationalize operations by setting up new production sites and developing new markets.
COST LEADERSHIPTo pursue rigorous cost management combined with major increases in productivity.
4/28
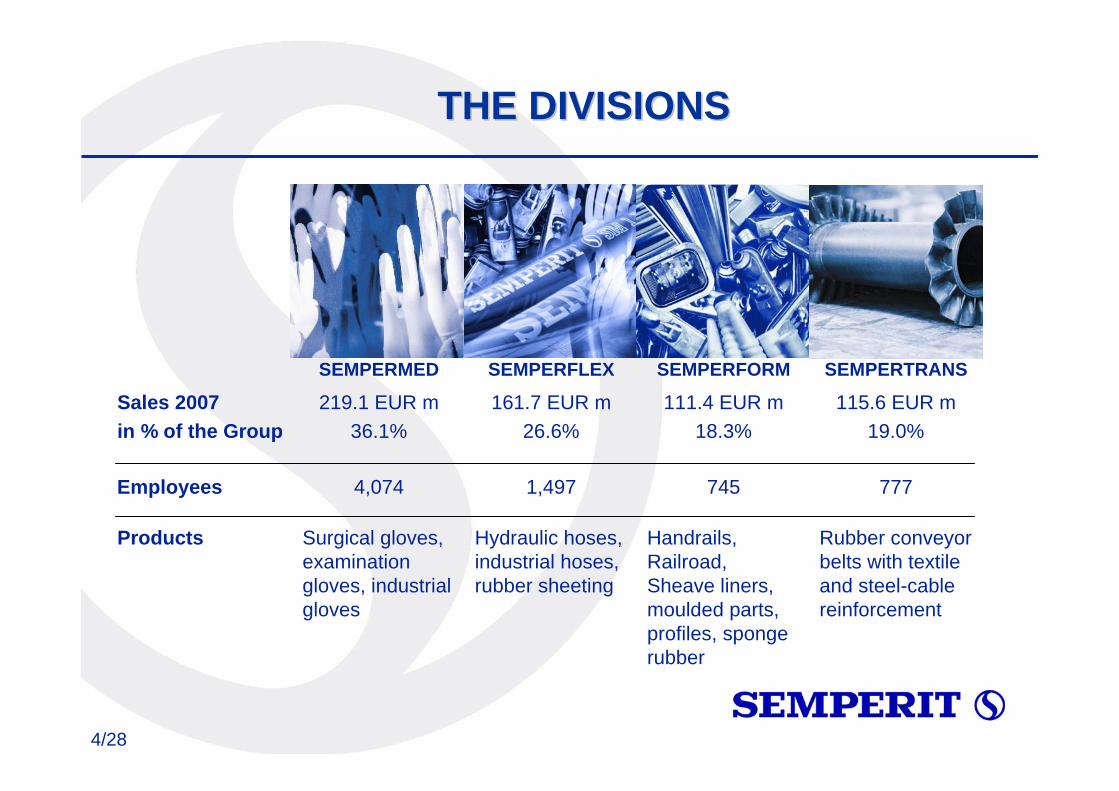
SEMPERTRANSSEMPERFORMSEMPERFLEXSEMPERMED
Rubber conveyorbelts with textile and steel-cablereinforcement
Handrails, Railroad, Sheave liners, moulded parts, profiles, spongerubber
Hydraulic hoses, industrial hoses, rubber sheeting
Surgical gloves, examinationgloves, industrialgloves
Products
7777451,4974,074Employees
115.6 EUR m19.0%
111.4 EUR m18.3%
161.7 EUR m26.6%
219.1 EUR m36.1%
Sales 2007in % of the Group
THE DIVISIONSTHE DIVISIONS
5/28
DIVISION SEMPERMEDDIVISION SEMPERMED
• SURGICAL GLOVES:20-25% market share in Europe (market leader)worldwide market share: > 10%
• EXAMINATION GLOVES:15% market share in Europe, 12-14% in USA and 10-15% worldwide
• PRODUCTION SITES:Austria, Thailand, China, Hungary
• TARGET INDUSTRIES: Medical supply, food processing, lab & chemical industry
• COMPETITORS:Ansell, Cardinal Health, Kimberly-Clark Safeskin

6/28
EUR million
Sales 1996 - 2007
DIVISION SEMPERMEDDIVISION SEMPERMED
0
50
100
150
200
250
1996 1997 1998 1999 2000 2001 2002 2003 2004 2005 2006 2007
75.085.0
111.7
130.1 135.8
155.3
180.8 179.1 177.4186.4
209.9219.1

7/28
DIVISION SEMPERFLEXDIVISION SEMPERFLEX
• HYDRAULIC HOSES:Approx. 15% market share in Europe
• INDUSTRIAL HOSES:Top 3-5 in Europe with approx. 10% market share
• RUBBER SHEETING:Most important markets are Germany, France, UK, Austria
• PRODUCTION SITES:Austria, Czech Republic, Thailand, Italy, China
• TARGET INDUSTRIES: Machinery/construction equipment, mining, industrial applications
• COMPETITORS:ITR Parker, Gates, Manuli, Alfagomma, Rapisarda, Aeroquip, Trelleborg, Hutchinson

8/28
EUR million
Sales 1996 - 2007
DIVISION SEMPERFLEXDIVISION SEMPERFLEX
0
20
40
60
80
100
120
140
160
180
1996 1997 1998 1999 2000 2001 2002 2003 2004 2005 2006 2007
45.852.5
58.4
81.387.3
93.7
108.3114.2
123.7
139.1145.7
161.7

9/28
DIVISION SEMPERFORMDIVISION SEMPERFORM
• PROFILES: Semperit is a prominent supplier of rubber profiles and seals for doors,windows and building construction in Europe
• MOULDED PARTS: Products range from automotive and industrial moulded parts to sanitary and pipe fittings
• HANDRAILS: Approx. 30% market share worldwide• SHEAVE LINERS: Approx. 85% market share worldwide• SKIS FOILES: Approx. 90% market share worldwide• PRODUCTION SITES:
Austria, Germany, Hungary, China, Thailand, USA • TARGET INDUSTRIES:
Construction, public transport, equipment and machinery manufacturers• COMPETITORS:
EHC, Trelleborg, Continental/Phoenix, Hutchinson

10/28
EUR million
Sales 1996 - 2007
DIVISION SEMPERFORMDIVISION SEMPERFORM
0
20
40
60
80
100
120
1996 1997 1998 1999 2000 2001 2002 2003 2004 2005 2006 2007
60.364.0 66.5
72.5
45,8
76.4 79.4 81.285.5
90.694.9
108.6 111.4

11/28
DIVISION SEMPERTRANSDIVISION SEMPERTRANS
• CONVEYOR BELTS:Market share of approx. 20% in Europe with conveyor belts enforcedwith textiles or steel ropes; Export worldwide
• PRODUCTION SITES:France, Poland, India
• TARGET INDUSTRIES: Mining, material handling
• COMPETITORS:Fenner, Continental/Phoenix, Goodyear, Bridgestone

12/28
EUR million
Sales 1996 - 2007
DIVISION SEMPERTRANSDIVISION SEMPERTRANS
0
20
40
60
80
100
120
1996 1997 1998 1999 2000 2001 2002 2003 2004 2005 2006 2007
46.8 46.0 47.7 46.0
64.5
80.4 80.884.3 85.4
94.5
109.2115.6

13/28
PRICE FOR NATURAL RUBBERPRICE FOR NATURAL RUBBER
Source: Weber & Schaer

14/28
SEMPERITSEMPERIT’’S WORLDS WORLD--WIDE WIDE PRESENCEPRESENCE
Singapore

15/28
GLOBAL PRESENCEGLOBAL PRESENCE
Wimpassing, Austria Sempermed/-flex/-formDeggendorf, Germany SemperformWaldböckelheim, Germany SemperflexParis-Argenteuil, France SempertransRovigo, Italy SemperflexSopron, Hungary Sempermed/-formHatyai, Thailand Sempermed/- flex/-formShanghai, China Sempermed/-flex/-formOdry, Czech Republic SemperflexNew Jersey, USA SemperformBelchatow, Poland SempertransRoha, India Sempertrans
PRODUCTION SITES

16/28
FINANCIAL OVERVIEWFINANCIAL OVERVIEW

17/28
CONTINUALLY SALES GROWTHCONTINUALLY SALES GROWTH
0
100
200
300
400
500
600
700
1996 1997 1998 1999 2000 2001 2002 2003 2004 2005 2006 2007
EUR million
Sales 1996 - 2007
227.9247.5
284.4329.9
363.9
409.1451.2 463.5 477.4
515.0
574.1607.8
18/28
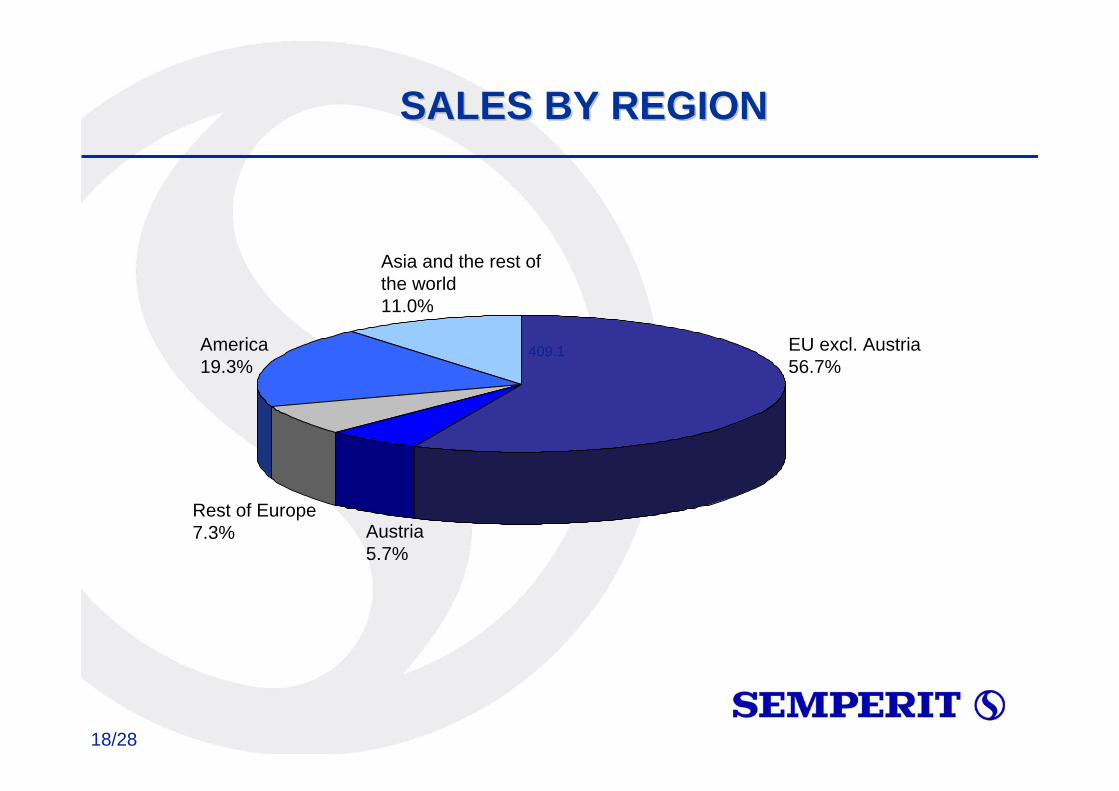
SALES BY REGIONSALES BY REGION
409.1 EU excl. Austria56.7%
Austria5.7%
Rest of Europe7.3%
America19.3%
Asia and the rest of the world11.0%

19/28
RISING EARNINGS BEFORE TAXRISING EARNINGS BEFORE TAX
0
10
20
30
40
50
60
1996 1997 1998 1999 2000 2001 2002 2003 2004 2005 2006 2007
EUR million
Earnings before tax 1996 - 2007
11.8
19.9
29.432.7
36.938.3
41.644.3
52.053.6 54.3
59.6

20/28
THE SEMPERIT WORKFORCETHE SEMPERIT WORKFORCE
0
1000
2000
3000
4000
5000
6000
7000
8000
1996 1997 1998 1999 2000 2001 2002 2003 2004 2005 2006 2007
Increase in employees since 1996 and a steady level of employment in Austria
Total on average
In Austria5,065
3,758
4,9505,283 5,073 5,284
5,6915,886
5,710
6,1856,689
7,118

21/28
FOCUS PRODUCTIVITYFOCUS PRODUCTIVITY
0
5
10
15
20
25
30
1996 1997 1998 1999 2000 2001 2002 2003 2004 2005 2006 2007
26.6
29.027.4
25.2
22.8 22.321.4 21.1
19.8
18.116.8
Decline in personnel costs as a % of sales
16.7

22/28
BUSINESS DEVELOPMENT 2007BUSINESS DEVELOPMENT 2007
• Consolidated sales increased by 6% to EUR 608 m • EBIT up 26% to EUR 64 million• Favourable market environment, particularly in Europe and Asia• High capacity utilization in all factories• Started with the production of synthetic surgical gloves in Wimpassing• Further growth in all divisions
– Sempermed +4.4 %– Semperflex +11.0 %– Semperform +2.6 %– Sempertrans +5.9 %
• Price rises for raw materials successfully offset by productivity improvements, material savings and increases in Semperit’s selling prices
• EBIT margin rose to 10.5%• Unfavourable development of important exchange rates (EUR/USD, BAHT/USD)

23/28
KEY FIGURESKEY FIGURES
6,185
38.8
1.79
36.7
53.6
515.0
2005
7,1186,6895,7105,8865,6915,2845,0735,283Employees on average
25.050.825.015.226.138.227.225.4Investments in EUR million
2.171.951.511.321.181.101.070.80Earnings/sharein EUR
44.640.030.826.923.922.321.916.0Net profit afterminorities in EUR million
59.654.352.044.341.638.336.932.7EBT in EUR million
607.8574.1477.4463.5451.2409.1363.9329.9Sales in EUR million
20072006200420032002200120001999

24/28
OUTLOOK 2008OUTLOOK 2008
• Further improvements in sales and profits
• Efficiency improvements through further optimization of the production processes
• Capacity expansion in selected production plants
• High volatility for raw material prices
• Unfavourable development of important currencies

25/28
PERFORMANCE OF THE SEMPERIT SHAREPERFORMANCE OF THE SEMPERIT SHARE
26/28
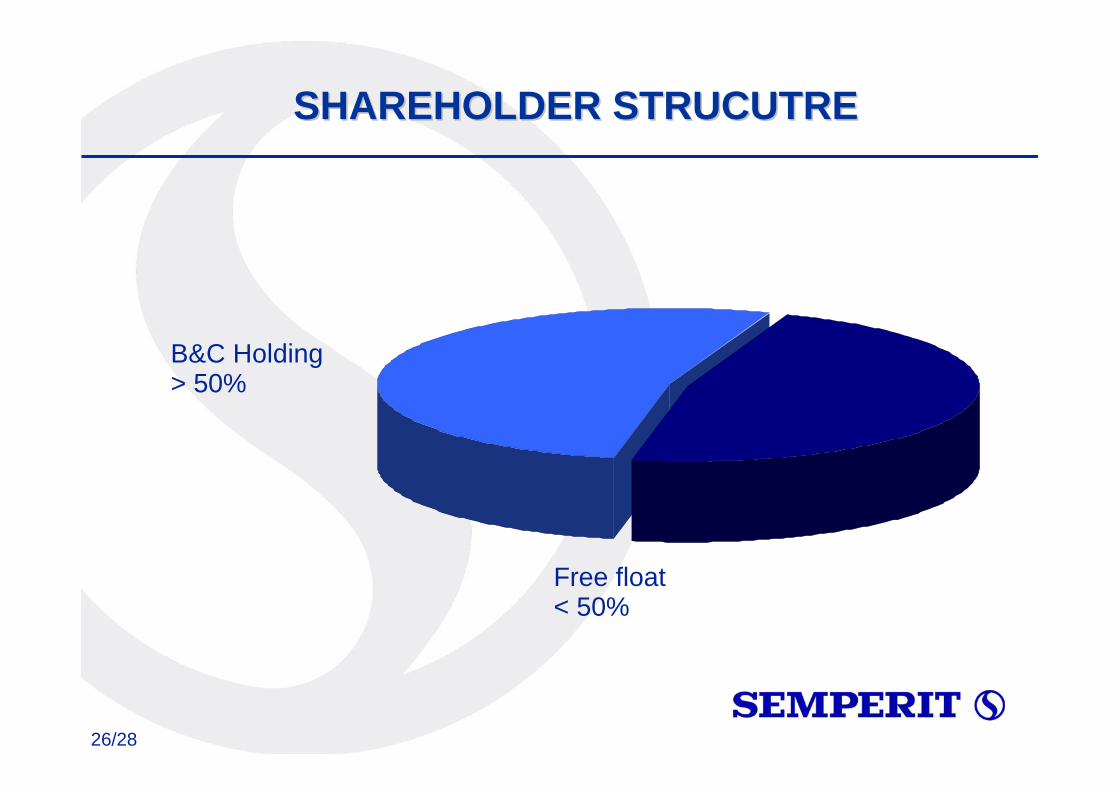
Free float < 50%
B&C Holding> 50%
SHAREHOLDER STRUCUTRESHAREHOLDER STRUCUTRE
27/28
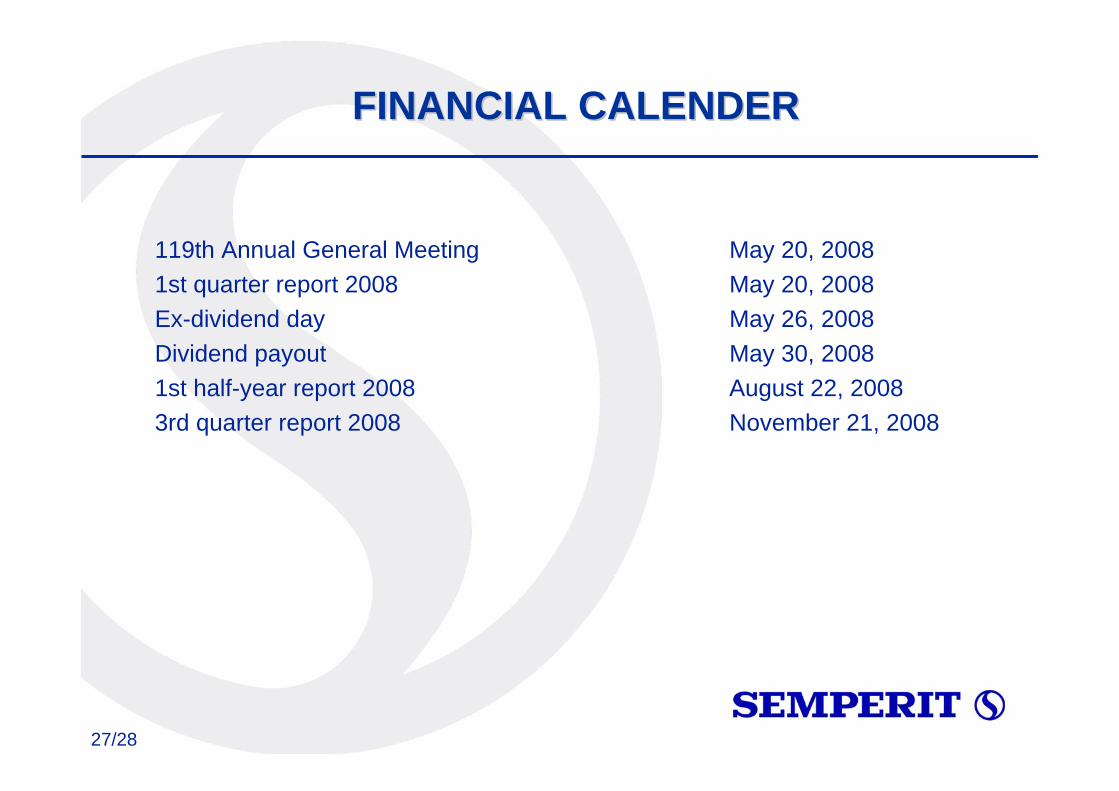
FINANCIAL CALENDERFINANCIAL CALENDER
119th Annual General Meeting May 20, 20081st quarter report 2008 May 20, 2008Ex-dividend day May 26, 2008Dividend payout May 30, 20081st half-year report 2008 August 22, 20083rd quarter report 2008 November 21, 2008

28/28
Thank you for your attentionThank you for your attention