présentation powerpoint - bvnbvn-sbn.be/downloads/peritoneal dialysis_e goffin.pdf · 20/03/2013 3...
TRANSCRIPT

20/03/2013
1
Cliniques Universitaires St-Luc
Université Catholique de Louvain
Bruxelles
Prof Eric Goffin
Peritoneal dialysis : principles, techniques,
materials and quality control
UCL
March 23rd, 2013 Cliniques St Luc, Brussels
CONTENT
• General Principles of PD
• The Peritoneal Membrane : Anatomy
• Physiology of Peritoneal Dialysis : Diffusion,
Convection, UF and PD prescription
• Take home messages
Schematic Principles of Peritoneal dialysis

20/03/2013
2
Overview : how to start a PD patient
• Having a PD program
• Select patients for PD
• Pre-ESRD education program
• Pro/con evaluation of suitability of an individual
patient
• Catheter placement
• How to start ?
Overview : Having a PD program
Overview : Having a PD program
Courtesy of L Van Overmeire

20/03/2013
3
Objectives of a Pre-dialysis education Program
Decrease mystique around dialysis
Provide objective information
Help make treatment choice
Promote self care
Pre-dialysis education Program at St Luc
Information provided by nurses in charge of self-care
Individual
In-house DVD
Brochures
Contact with experienced patients
Pre-dialysis education Program at St Luc
All incident patients (n = 242) – 185 informed (57
not informed in-centre HD)
First RRT modality
Inclusion period : 12/94 – 3/00 (64 months)
Exclusion criteria :
Transfer
Graft failure
Goovaerts T et al Nephrol Dial Transplant 2005

20/03/2013
4
Our Pre-dialysis education program
Goovaerts T et al Nephrol Dial Transplant 2005
31%
16%
9%
4%
40%
Contra-indications to PD
- Stomias
- Enormous ADPKD kidneys
- Loss of integrity of the peritoneal membrane
The PD catheter
Courtesy of L Van Overmeire

20/03/2013
5
The PD catheter
Right parietal access is preferable
PD catheter migration
The PD catheter
No evidence for superiority of one single type of
catheter
Use of cuffed catheters to be preferred ; no
difference single vs double cuff
Use of Swann neck to be preferred
No preference for straight line or curled
Surgical or bed-site placement

20/03/2013
6
Pre-sternal PD catheter in obese patients
Continuous Ambulatory Peritoneal Dialysis
Vidange
Glucose
Infusion
Glucose
Déconnection Connection
Glucose
sac vide
Continuous Ambulatory Peritoneal Dialysis

20/03/2013
7
Automated Peritoneal Dialysis
Automated Peritoneal Dialysis
Automated Peritoneal Dialysis

20/03/2013
8
Anatomy of the Peritoneal Membrane
The Peritoneal Membrane
• Mesothelium
• Interstitium - MPS hydrogel + collagen
• Capillary network - endothelial barrier
Peritoneal cavity – Reflections of the
peritoneum
C 1999 Wesley Norman
Virtual cavity (<100 ml of viscous fluid)
between visceral and parietal sheets

20/03/2013
9
Nature of the Peritoneal Membrane
Serous membrane : reduces friction between moving organs
Components : Monolayer of mesothelial cells
Connective tissue : matrix of collagen
- Blood vessels - capillaries
- Lymphatics
- Cells : leukocytes, mastocytes
- Nerve fibers
Thin membrane : 30-40 m omentum (thicker in PP – VP)
1.0 – 1.3 square-meter
Contribution to transport : PP >> VP
Peritoneal membrane : the mesothelium
• Flat cells that form a monolayer : 2.5 - 3 m thick (mesentery)
• Transitional mesothelium (parietal peritoneum) : 10 - 15 m thick
• Discontinuous basement membrane : type IV collagen
• Ultrastructure : Intercellular junctions (tight - gap)
Basolateral invaginations
Microvilli and primary cilium
Rich in organelles
Peritoneal membrane : the Mesothelium

20/03/2013
10
Role of the Mesothelium
• Not a barrier for water and solutes transport
• Protection, host-defense mechanisms
• Regulation of inflammation, angiogenesis, healing - fibrosis
• Secretion of lipids : surfactant - phosphatidylcholine
• Secretion of cytokines, growth factors, PGs
• Secretion of collagen, fibronectin, elastin
• Marker : CA125
Mesothelial cell mass and CA 125
The submesothelial layer
• Matrix of collagen (bundles) and elastic fibers
• Many different cell types :
Mast cells, macrophages, leukocytes
Fibroblasts
Adipocytes
Blood vessels
Lymphatics
Nerve fibers

20/03/2013
11
Vascularization of the Peritoneum
• Visceral peritoneum :
• Upper mesenteric artery
• Venous return via the portal system
• Parietal peritoneum :
• Intercostal, epigastric and lumbar
arteries
• Venous return via vena cava system
• Lymphatic network (fluid reabsorption)
Miller FN, Peritoneal Dialysis 1981
The capillary network in the PM
Blood Flow to the Peritoneal Membrane
• Splanchnic blood flow rate : 25% of cardiac output
1200 ml/min
• Peritoneal blood flow rate: 70-80 ml/min

20/03/2013
12
Lymphatics in the peritoneal Membrane
Gokal et al. Textbook of PD 2000
Changes in the Peritoneal Membrane
Exposed to Peritoneal Dialysis
Structure of the Peritoneal Membrane
Factor VIII
staining
Control
m
Submesothelial fibrosis Vascular proliferation
Long-term PD
m
m

20/03/2013
13
Laparoscopy : 7 years of peritoneal dialysis
Loss of mesothelial cells after 40 days of PD
CA 125 and long-term (conventional) PD

20/03/2013
14
The Peritoneal Membrane in the long-term PD
Submesothelial
fibrosis
Vascular
proliferation
Combet et al. JASN 11, 2000 Factor VIII staining
Biopsy Registry : submesothelial Fibrosis
Th
ickn
ess
su
bm
eso
the
lial z
on
e (
mm
)
0-24 25-48 49-72 73-96 96+
Peritoneal Dialysis (months)
Williams JD et al. JASN 13 : 470-9, 2002
Mateijsen et al. PDI 19, 1999
Correlation between Vascular Proliferation
and Fibrosis in Long-term PD
0
10
20
30
40
50
60
70
80
Num
ber
of
ves
sels
/fie
ld
0 0-25 > 25 Peritoneal
Sclerosis Months CAPD
p=0.00002
p=0.00009
p=0.01

20/03/2013
15
Simple peritoneal sclerosis
Modest sclerosis - restricted to submesothelial area
No involvement of abdominal viscera and vessels
Sometimes inflammatory infiltrate
Sclerosing peritonitis
Sclerosis of the whole peritoneum
Involves abdominal viscera and affecting large vessels
Fibroblasts proliferation - collagen hyperplasia - inflammation
VEGF distribution in the peritoneum
Control
Long-term PD
Combet S et al. JASN 11, 2000
Monoclonal
anti-VEGF 165

20/03/2013
16
Deposition of AGE’s (pentosidine staining)
Combet S et al. JASN 11, 2000
Accumulation in mesothelium and endothelium
Changes in the Peritoneal Membrane
during an Acute Peritonitis
Acute peritonitis : structural changes
Combet et al. JASN 10: 2185-96, 1999
Inflammatory infiltrate Vascular proliferation
Control
Peritonitis
Control
Peritonitis
Rat model - Catheter-induced peritonitis - 5 days
20/03/2013
17
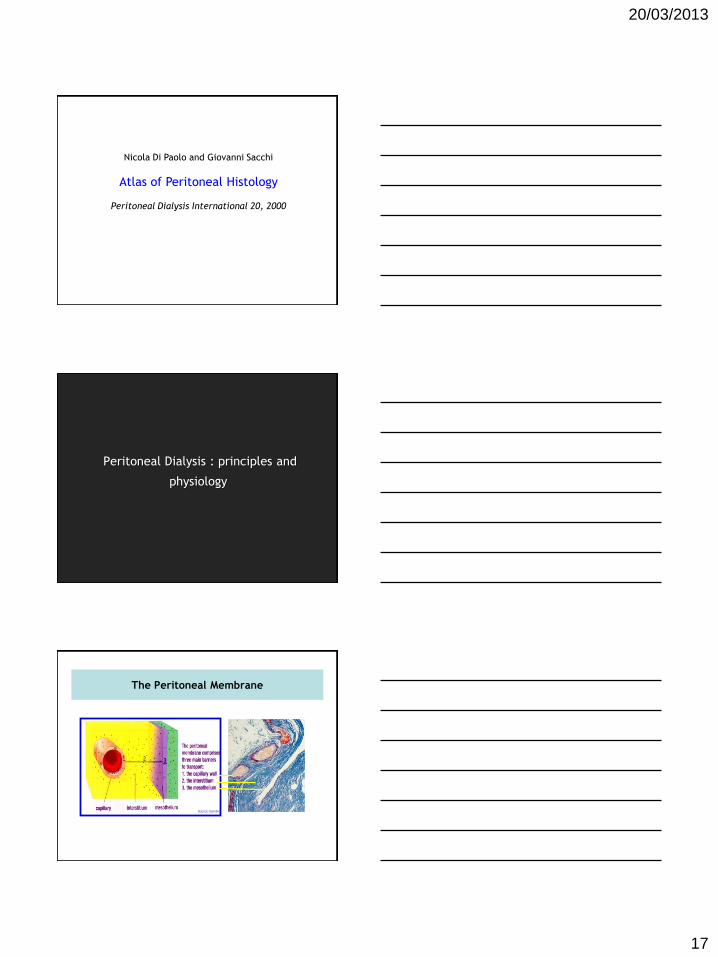
Nicola Di Paolo and Giovanni Sacchi
Atlas of Peritoneal Histology
Peritoneal Dialysis International 20, 2000
Peritoneal Dialysis : principles and
physiology
The Peritoneal Membrane
Source: Gambro

20/03/2013
18
The Peritoneal Membrane
Source : Gambro
The Peritoneal Membrane
the three-pore model
water
small
solutes
macro
molecules
capillary lumen
interstitium
Ultrasmall pores
r < 3Å
Small pores
r 30- 50 Å
Large pores
r > 150 Å
Rippe B et al. Kidney Int 40, 1991
endothelium
Mechanisms of Solute and Water Transport
across the Peritoneal Membrane
1. Diffusion : passive movement along the concentration gradient
2. Solvent drag : convective transport of solutes with water
3. Net ultrafiltration : results of starling forces:
- transcapillary ultrafiltration
- backfiltration into capillaries + uptake by lymphatics

20/03/2013
19
Diffusion across the Peritoneal Membrane
Diffusion: passive movement along the concentration gradient
Rate of solute transfer (Js) depends from
- Diffusive permeability of the PM to that solute (Df/x)
Df : free diffusion coefficient
x : diffusion distance
- Surface area (A)
- Concentration gradient (C = P - D)
MTAC: diffusive permeability x surface area
Js = Df/ x x A x C
MTAC = Df/ x x A
Js = MTAC x (P - D)
Convective transport across the Peritoneal
Membrane
Convection: Solvent drag, transport of solutes with water
Rate of solute transfer (Js) depends from :
- Water flux (Jv)
- Solute concentration in the membrane (C)
- Solute reflection coefficient ()
Js = Jv x C x (1 - )
varies between 0 : no resistance of the PM to transport
1 : ideal semi-permeable membrane
Relationship between MW and MTAC
Log Molecular weight 100 1000 10000
Log MTAC . Urea
Creatinine. Urate.
.Inulin
.beta 2 - M

20/03/2013
20
Relationship between MW and MTAC
Kabanda et al Kidney Int 1995
Relationship between MW and MTAC
- Small solutes (urea, glucose, creatinine) diffuse freely
across the PM
- Maximal transport determined by the surface area
- Notion of Effective Peritoneal Surface Area (EPSA)
Number of perfused capillaries - pores
Basal state only 25 % capillaries perfused
The MTAC of small solutes = functional measurement of
EPSA
Transport of Macromolecules (e.g. Albumin)
- Much lower rate than LMW solutes and sodium
- Size-selective restriction
- Depends from surface area and size-selective pores
- Convection/restricted diffusion + large pores
- Increased during acute peritonitis : vasoactive mediators

20/03/2013
21
Evaluation of the diffusive properties of
the Peritoneal Membrane : the Peritoneal
Equilibration Test
The Peritoneal Equilibration Test Twardowski
0 30 60 120 240 0.00
0.25
0.50
Dwell Time (min)
0.75
D/P
cre
at
The Peritoneal Equilibration Test
0 30 60 120 240 0.00
0.25
0.50
Dwell Time (min)
0.75
D/P
cre
at
0 30 60 120 240 0.0
0.5
1.0
Dwell Time (min)
D/D
0 G
luco
se

20/03/2013
22
The Peritoneal Equilibration Test
0 30 60 120 240 0.00
0.25
0.50
Dwell Time (min)
D/P
cre
at
0 30 60 120 240 0.0
0.5
1.0
Dwell Time (min)
D/D
0 G
luco
se
0.75
Hyperpermeability-Fast transporte status:
good clearances
poor UF
Use APD & icodextrin
The Peritoneal Equilibration Test
0 30 60 120 240 0.00
0.25
0.50
Dwell Time (min)
D/P
cre
at
0 30 60 120 240 0.0
0.5
1.0
Dwell Time (min)
D/D
0 G
luco
se
0.75
Hypopermeability-Low transporter status:
low clearances
high UF
The Peritoneal Equilibration Test

20/03/2013
23
Inverse Correlation between Ultrafiltration and
Blood Vessels (Chronic Infusion Rodent Models)
Margetts et al. JASN 13: 721-8, 2002
0 5 10 15 20 25 30
-15
-10
-5
0
5
10
Peritoneal-associated blood vessels (vessels/mm)
Factor VIII staining
r : -0.61
P < 0.001
What would be your preferred type of
Peritoneal Membrane ?
The problem of the Fast Transporters
Churchill et al CANUSA Study JASN 1998
0 6 12 18 24
High
High Average
Low Average
Low
40
100
90
80
70
60
50
Time in Months
Per
cen
t S
urv
ivin
g

20/03/2013
24
The problem of the Fast Transporters
Early glucose absorption; i.e. rapid dissipation of the
osmotic gradient and, fluid retention.
Important protein loss within the dialysate.
Association with markers of inflammation, diabetes and
co-morbid conditions.
Inherent Fast Transport Status
Patients with older age, diabetes, higher BMI and comorbid conditions are more
likely to be fast transporters:
- Rumpsfeld et al; Am J Kid Dis 2004
ANZDATA registry (n: 3188)
- Davies Kidney Int; 2004 (n: 574)
- Gillerot et al Kidney Int 2005 (n: 152)
- Clerbaux et al NDT 2006 (n: 72)
- …
ANOVA, P = 0.003
Comorbidity grade
Low Medium High 1 0
1 1
1 2
1 3
1 4
1 5
0 1 2 3 4 5 6
0
1 0
2 0
3 0
4 0
MTA
Cc
rea
t
(ml/m
in/1
.73
m2)
Serum albumin (g/dl) Pearson r = -0.22
P = 0.005 Gillerot et al Kidney Int 2005
Inherent Fast Transport Status
Gillerot et al Kidney Int 2005
MTA
Ccre
at
(ml/m
in/1
.73m
2)
IL-6 genotype
ANOVA, P = 0.006
CC
N = 20 GC
N = 72
GG
N = 60
1 0
1 1
1 2
1 3
1 4
N=152
Polymorphism IL-6 G-174C

20/03/2013
25
Ultrafiltration in Peritoneal Dialysis
Ultrafiltration in Peritoneal Dialysis
Net UF = Cumulative TCUF – fluid uptake by lymphatics
Starling Forces and Fluid Transport
Transcapillary ultrafiltration rate = UFC (P - + O)
UFC : peritoneal UF coefficient
P : hydrostatic pressure gradient
: colloid pressure gradient
: reflection coefficient : index of osmotic effectiveness (0 to 1)
O : crystalloid osmolality gradient
Glucose = 0.02 – 0.05
(ultrasmall pores = 1 large pores = 0)

20/03/2013
26
Water Transport across the Peritoneal
Membrane
Small pores : radius 30 – 50 A° (water + small solutes)
Paracellular pathway (interendothelial clefts)
50 % UF : hydrostatic + colloid forces
Ultrasmall pores : radius < 3 A° (selectivity for water)
Transcellular pathway : endothelial cell
50 % UF : crystalloid osmosis
Predicted to mediate sodium sieving
Rippe et al Kidney Int 40; 1991
The Sodium Sieving
m
Free-water movement : fall in dialysate sodium
Zweers et al; PDI 1999; 15: 65-72
Aquaporin-1 distribution in the PM
m
lumen
Am J Physiol 275, 1998 ; Kidney Int 67, 2005
Structure : narrow pore 3.0 Å
Specificity for water only (no
urea, glucose)
Distribution in endothelium

20/03/2013
27
The role of Aquaporin-1 in the PM
0.75
0.80
0.85
0.90
0.95
1.00
Aqp1 (+/+) (n=6) Aqp1 (+/-) (n=6)
0 30 60 90 120
Aqp1 (-/-) (n=6)
*#
*#
*#
Dwell Time (min)
D/P
So
diu
m
Aqp1 (+/+) (n=6)
Aqp1 (+/-) (n=6)
Aqp1 (-/-) (n=6)
58
± 3.1 57
± 2.0 *#
27
± 1.8
(+/+) (-/-) Ni et al; Kidney Int 2006
Crystalloid vs Colloid Osmosis
or
Glucose-based dialysates vs Icodextrin
The Osmotic Gradient across the PM
Courtesy of Dr J Morelle

20/03/2013
28
Courtesy of Dr J Morelle
The Osmotic Gradient across the PM
Courtesy of Dr J Morelle
The Osmotic Gradient across the PM
Courtesy of Dr J Morelle

20/03/2013
29
The Osmotic Gradient across the PM
Courtesy of Dr J Morelle

20/03/2013
30
Physiopathological evolution of the
Peritoneal Membrane with time on PD
Khosla S and Melton L. N Engl J Med 2007;356:2293-2300
Lifestyle Measures Recommended for Patients with Osteopenia
Peritoneal cavity
TGF-
FGF
Invading MC
VEGF
MC released
to PD effluent
- Peritonitis
- Hemoperitoneum
- PD Fluids:
- Glucose (AGEs, - GDPs)
- Lactate, low pH
VEGF
Angiogenesis
Myofibroblasts
ECM
Accumulation
Peritoneal membrane
Adapted from Lopez-Cabrea et al. (2006)
UF
FAILURE
EMT
Solute Transport increases with Time on PD
Davies et al. Kidney Int 54 : 2207-17, 1998
Combet et al J Am Soc Nephrol 2000
Clerbaux et al Nephrol Dial Transplant 2006
0.8
Solu
te tra
nsp
ort
(D
/P C
r)
* *
1 6 12 18 24 30 36 42 48 54 60
0.7
0.6
0.5
Time on peritoneal dialysis (months)
* *

20/03/2013
31
Peritonitis induce functional and structural
peritoneal membrane alterations
Davies et al Nephrol Dial Transplant 1996 Williams et al Kidney Int 2003
Peritoneal alterations with time on PD :
Ultrafiltration failure
Increased vascularization – EPSA
Deficit – dysfunction in AQP1 (nb ? Quality ?)
Both together
Ultrafiltration failure : Aquaporin dysfunction
Walz T et al. Nature 1997
Murata et al Nature 2OOO

20/03/2013
32
The role of Aquaporin-1 in the PM
Loss of sodium sieving AQP1 dysfonction
(normal expression)
Goffin et al Am J Kidney Dis 1999
Peritoneal alterations with time on PD :
Ultrafiltration failure
Increased vascularization – EPSA
Deficit – dysfunction in AQP1 (nb ? Quality ?) :
Both together
Increased lymphatic absorption
Changes in extracellular matrix : alteration of glucose
conductance

20/03/2013
33
How to monitor the Peritoneal Membrane
Properties
How to monitor the Peritoneal Membrane
Properties ?
Peritoneal Equilibration Test
Using 3.86 % glucose-based dialysate for UF volume and
sodium sieving determinations
At PD onset
Yearly
After a « bad » peritonitis
How to monitor the Peritoneal Membrane
Properties ? The mini-PET
How ?
Idem PET 3,86% with dialysate samplings at 0 et 60
min
Advantages
Calculation :
Free Water Transport (FWT) within the total UF
at 60 min
Na removal
D/P creat and D/D0 glucose
Length : 60 min

20/03/2013
34
How to monitor the Peritoneal Membrane
Properties ? The mini-PET
La Milia et al: Mini-peritoneal equilibration test Kidney Int, Vol. 68
(2005), pp. 840–846
How to monitor the Peritoneal Membrane
Properties ? The Osmotic conductance
Determine the power of glucose to generate an UF
2 successive Mini-PET :
1° glucose 1.36%
2° glucose 3.86%
How to monitor the Dialysis efficacy
Ademex study

20/03/2013
35
How to monitor the Dialysis efficacy
Ademex study
How to monitor the Dialysis efficacy
Ademex study
How to monitor the Dialysis efficacy
Lo WK et al Kidney Int 2003
Total Kt/V targets (randomized !!!)
A : 1.5 to 1.7
B : 1.7 to 2.0
C : > 2.0
20/03/2013
36
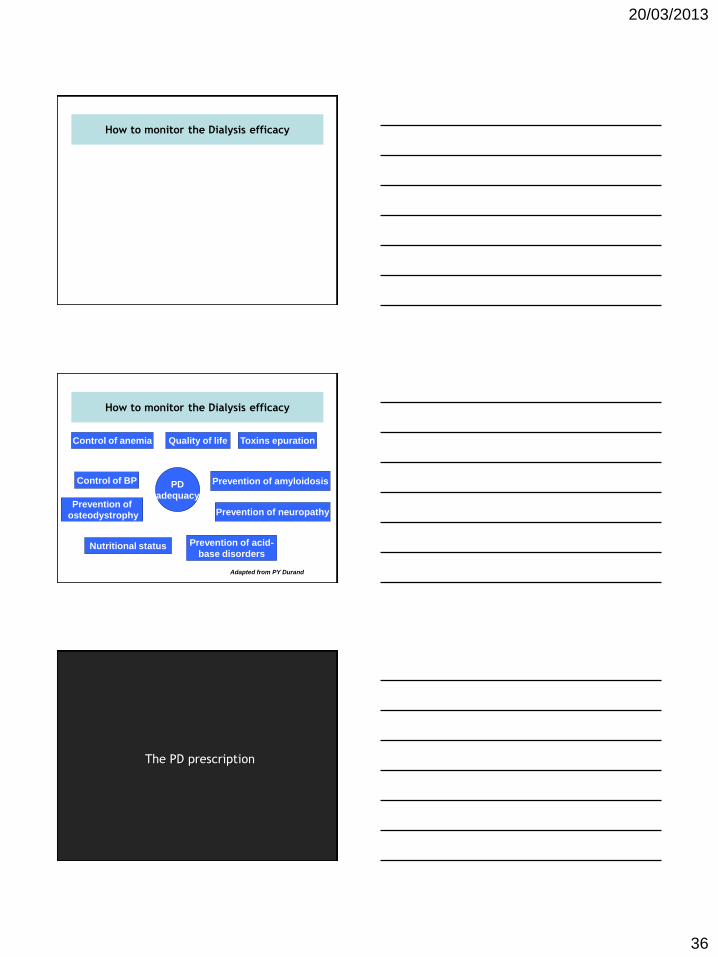
How to monitor the Dialysis efficacy
How to monitor the Dialysis efficacy
PD
adequacy
Nutritional status
Prevention of osteodystrophy
Control of BP
Control of anemia Toxins epuration
Prevention of amyloidosis
Prevention of neuropathy
Prevention of acid-
base disorders
Quality of life
Adapted from PY Durand
The PD prescription

20/03/2013
37
The PD prescription
Residual renal function ?
CAPD vs APD ?
Number of dwells ? Length of dwells ? Tonicity of dwells ?
Volume of dialysate ?
Use of icodextrin from the start ?
Residual renal function
Provides endocrine functions - Erythropoietin production
- Ca++, phosphorus and vitamin D
homeostasis
Contributes to total solute
cearance (1 ml/min CrCl = 10 liter
CrCl/week)
Reduces
Mortality
Improves
QOL
Increases
nutritional
status
Allows for more
liberal diet and
fluid intake
Facilities
volume control
Improves
2-microglobulin
and middle
molecule clearance
Courtesy of B Bammens
The Peritoneal Equilibration Test
0 30 60 120 240 0.00
0.25
0.50
Dwell Time (min)
D/P
cre
at
0 30 60 120 240 0.0
0.5
1.0
Dwell Time (min)
D/D
0 G
luco
se
0.75
Hyperpermeability-Fast transporte status:
good clearances
poor UF
Use APD & icodextrin

20/03/2013
38
The Peritoneal Equilibration Test
0 30 60 120 240 0.00
0.25
0.50
Dwell Time (min)
D/P
cre
at
0 30 60 120 240 0.0
0.5
1.0
Dwell Time (min)
D/D
0 G
luco
se
0.75
Hypopermeability-Low transporter status:
low clearances
high UF
The Intra Peritoneal Pressure
Midaxillary line
IPP (cmH2O)
0
Dialysat
PD catheter
0.68
13.1 ± 2.6
13.5 ± 3.5
9
52
Diabetes +
–
0.87
13.2 ± 3.8
13.7 ± 3.3
12.5 ± 2.1
14.2 ± 1.9
23
31
2
5
Surgery –
light
heavy
hernia
p IPP 2000ml n
0.44
0.16
0.10
0.18
61 Age (yrs)
61 Weight (kg)
0.57 -0.07 61 Height (CM)
0.92
13.5 ± 3.1
13.5 ± 4.0
46
15
Gender M
F
0.38 0.11 61 BSA (m²)
0.03 0.28 61 BMI (kg/m²)
Relationship between IPP and IPV
0
5
10
15
20
25
0 1000 2000 3000
IPV (ml)
IPP
(cm
H20
)
The Intra Peritoneal Pressure
Kaplan-Meier estimation of survival free
of peritonitis when IPP day < or ≥ 13 cm
H2O
months
60 50 40 30 20 10 0
Cu
mu
lative
Su
rviv
al
1.1
1.0
.9
.8
.7
.6
.5
.4
Kaplan-Meier estimation of survival
free of peritonitis when IPP night <
or ≥ 14 cm H2O
months
60 50 40 30 20 10 0
1.1
1.0
.9
.8
.7
.6
.5
.4
IPP >14 cm H2O
IPP <14 cm H2O
p=0.03
Dejardin A et al Nephrol Dial Transplant 2007

20/03/2013
39
The Intra Peritoneal Pressure
Avoid > 17 cm H2O !!!
(at rest)
Use of icodextrin from the start ?
Fluid control: icodextrin vs
glucose based dialysates
Davies J Am Soc Nephrol 2003
Preservation of the peritoneal
membrane: the EAPOS study :
icodextrin vs no icodextrin
By using APD, it is possible to achieve sufficient small
solute clearance and UF to treat successfully even anuric
patients.
Use of icodextrin from the start ?