presentation on milk - miet.ac.in · sales of different chocolate brands . ... there is no...
TRANSCRIPT

PRESENTATION ON
MILK SUBMITTED BY
NAINA KAUSHIK
PRERNA
POOJA
REENU
SHAARIB ANSARI

OBJECTIVES • To analyse the consumer brand
preferences of milk.
• To evaluate consumers attitude
towards the usage of milk.
• To evaluate consumers perception
about the important factors
pertaining to milk purchase decision.
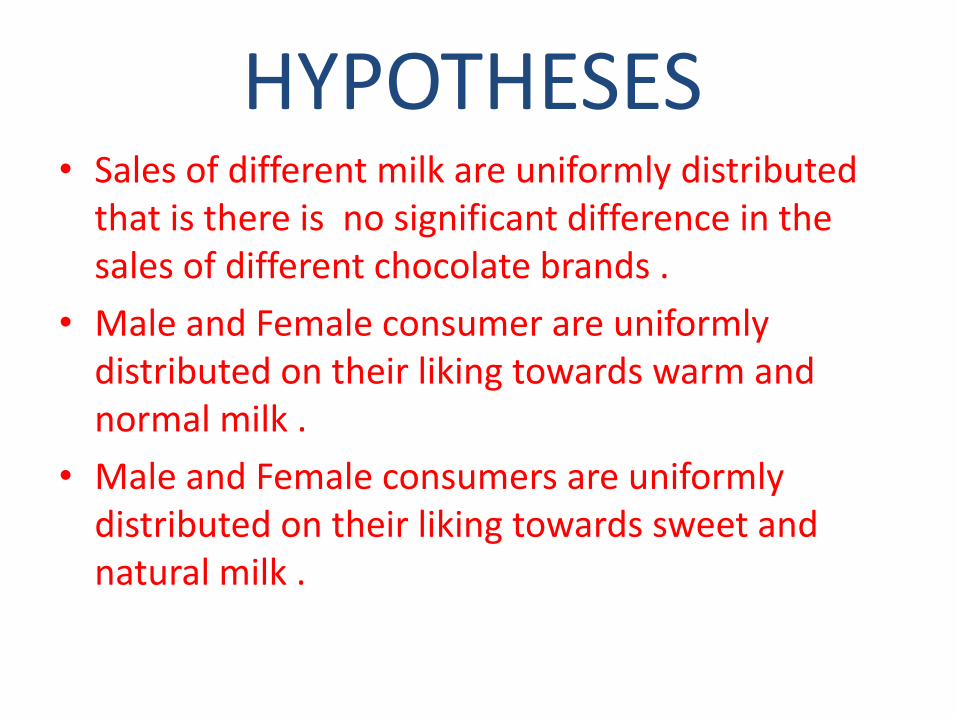
HYPOTHESES • Sales of different milk are uniformly distributed
that is there is no significant difference in the
sales of different chocolate brands .
• Male and Female consumer are uniformly
distributed on their liking towards warm and
normal milk .
• Male and Female consumers are uniformly
distributed on their liking towards sweet and
natural milk .

• Consumers of different age group are
uniformly distributed on their liking towards
warm and normal milk.
• Male and female are uniformly distributed on
their liking about how they should purchase
milk.
• There is no significant difference among the
consumers of milk on the factors like age,
gender etc towards their attitude about the
consumption of milk .
• Different factors which are important in the
purchase decision of milk for consumers do
not differ significantly.

HYPOTHESIS 1
• Chi Square value [calculated] =34.9
• Critical Chi Square value [0.05,5]
=11.07
• Chi Square value [calculated] is
greater than critical chi square value
, hence hypothesis 1is rejected and it
can be concluded that sales of
different brand of milk are not
uniformly distributed.
BRAND COUNT
AMUL 30
PARAG 11
MOTHER 13
DAIRY
LOCAL 38
VENDOR
OTHER 8

HYPOTHESIS 2 Male and female consumers are uniformly distributed on their
liking towards warm and normal milk
To test hypothesis . Chi square was
applied
HOT COLD
Male 31 17
Female 38 14
• Chi Square value [calculated] =.84
• Critical Chi Square value [0.05, 1]
=3.84
• Chi Square value calculated is
greater than critical chi square
value, hence hypothesis 1 is
rejected and it can be conducted
that sales of different brand of
milk are not uniformly distributed.

HYPOTHESIS 3 Male and Female consumers are uniformly distributed on
their liking towards sweet and natural milk
• To test hypothesis, chi
square test was applied
• SUGAR NATURAL
Male 34 14
Female 36 16
• Chi Square value
[calculated] =.03
• Critical Chi Square value
[0.05, 1] = 3.84
• Chi Square value calculated
is less than the critical chi
square value ,hence
hypothesis is accepted and
it can be concluded that
male and female consumers
are uniformly distributed on
their liking towards sweet
and natural milk .

HYPOTHESIS 4 Consumers of different age group are uniformly distributed on
their liking toward sweet and natural milk
• To test hypothesis chi square test was applied.
• SUGAR NATURAL Under 43 25
18
26-35 15 4
36-45 9 1
46-55 3 0
• Chi Square value [calculated] =5.39
• Critical Chi Square value [0.05, 3] = 7.81
• Chi Square value calculated is less than critical chi square value ,hence hypothesis is accepted and it can be concluded that consumers of different age groups are uniformly distributed on their liking towards sweet and natural milk .

HYPOTHESIS 5 Male and female consumers are uniformly distributed on
their liking about how they should purchase milk
• To test hypothesis , chi
square is applied.
• You go Vendor
come
• out to buy to deliver
Male 28 20
Female 27 25
• Chi Square value [calculated]= .41
• Critical CHI Square value [0.05, 1]
=3.84
• Chi Square value calculated is less
than critical chi square value,
hence hypothesis is accepted and
it can be concluded that male and
female consumers are uniformly
distributed on their thinking
about how they should purchase
milk.

HYPOTHESIS 6 [a]
There is no significant difference among the consumers of different age
groups about their liking towards the consumption of milk.
To test this ANNOVA test was applied with following results.
ANNOVA SINGLE FACTOR
SUMMARY
GROUP COUNT SUM AVERAGE VARIANCE
Under18-25 68 2070 30.44118 15.08604
26-35 19 594 31.26316 6.315789
More than 35 13 409 31.46154 9.269231

ANNOVA
Source of df ms f p value f
crit
Variation
Between group 18.03031 2 9.015157 0.707684
3.090187
Within groups 1235.68 97 12.73897
Total 1253.71 99
Since F calculated is less than F critical at 95 significant level hence
null hypothesis is accepted . So it can be concluded that
consumers of different age group do not differ significantly on
their attitude towards consumption of milk .

HYPOTHESIS 6 [B]
There is no significant difference among the male and female consumers on
their liking toward the consumption of milk .
O test hypothesis Z test was applied with following results.
MEAN N Z VALUE Z value critical SIGNIFICANT
AT 0.5 AND 125 df
MALE 30.03 4 8 -1.79 1.95 insignificant
FEMALE 31.32 52 accept the null
hypothesis
Since the calculated z value is less than z critical [two tailed test] at.05
significance level , hence null hypothesis is accepted and it can be said that
there is no significant difference in the attitude of male and female
consumers on their liking towards consumption of milk.

HYPOTHESIS 6 [C]
There is no significant difference among married and unmarried
consumers on their liking towards the consumption of milk.
To test this hypothesis z test was applied
mean n z value z value critical result
MARRIED 31.12 33 .83 1.95 insignificant
UNMARRIED 30.53 67 accept the
null hypothesis
Since the calculated Z value is less than Z critical [two tailed] at
.05 significance level ,hence null hypothesis is accepted and it
can be said that there is no significant difference in the attitude
of married and unmarried consumers on their liking for milk.

HYPOTHESIS 6 [D]
There is no significant difference among the consumer of
different income groups about their liking toward consumption
of milk.
To test this analysis ANNOVA test was applied
ANNOVA ;SINGLE FACTOR
GROUPS COUNT SUM AVERAGE VARIANCE
Below 20000 24 739 30.79167 12.25906
20000-40000 41 1282 31.26829 11.75122
40000-60000 13 411 31.61538 18.25641
Above 60000 22 641 29.13636 9.742424

ANNOVA
Source of SS DF MS F P VALUE F CRIT
VARIATION
Between group 78.03505 3 26.01168 2.12399 .10222 2.699393
Within groups 1175.675 96 12.24661
TOTAL 1253.71 99
Since F value calculated is less than F critical at 95 significance level, hence
null hypothesis is accepted.
So it can be concluded that consumers of the different income group do not
differ significantly on their attitude towards consumption of milk.

HYPOTHESIS 7
• Different factors which are important in the purchase decision
of milk for consumers do differ significantly.
To test this ANNOVA test was applied
ANNOVA ;SINGLE FACTOR
GROUPS COUNT SUM AVERAGE VARIANCE
PRICE 97 277 2.85567 1.853952
BELIEVE ON 97 349 3.597938 1.534579
PURITY
AVAILABILITY 97 205 2.113402 0.705756
CONVENIENCE 97 139 1.43299 0.914734

ANNOVA
Source of SS Df ms f P VALUE F CRIT
Variation
Between group 254.134 3 84.71134 67.64703 3.87E-35 2.62814
Within group 480.866 384 1.252255
TOTAL 735 387
Since F calculated is greater than F Critical at 95 significance level ,hence null
hypothesis is rejected.
So ,it can be concluded that different factors hold different importance in the
milk purchase decision.

POPULAR BRAND
31%
11%
13%
39%
6%
POPULARITY
AMUL parag MOTHER DAIRY LOCAL VENDOR OTHER

MILK VARIETY PREFERED
64%
25%
11%
0%
PREFERENCE
COW PRODUCED 36 BUFFALO PRODUCED 41 PACKAGED MILK 23

BUYING DECISIONS
55%
45%
0% 0%
BUYING DECISION
YOU GO TO BUY VENDOR COMES 3rd Qtr

TIME WHEN YOU PROCURE MILK
50%
36%
14%
0%
TIME
MORNING TIME EVENING TIME ANY TIME

FAMILY CONSUMPTION 0F MILK PER
DAY
1st Qtr
11%
2 LTRS
42%
3 LTRS
35%
4 LTRS
10%
MORE THAN 4
LT
2%
CONSUMPTION

PREFER MILK OR NOT
96%
4%
0% 0%
PREFER OR NOT
YES NO

MILK PREFERED IN A DAY
57% 30%
13%
0% 0%
CHOICE
1 GLASS ADAY 2 GLASSES A DAY MORE THAN 2 GLASSES
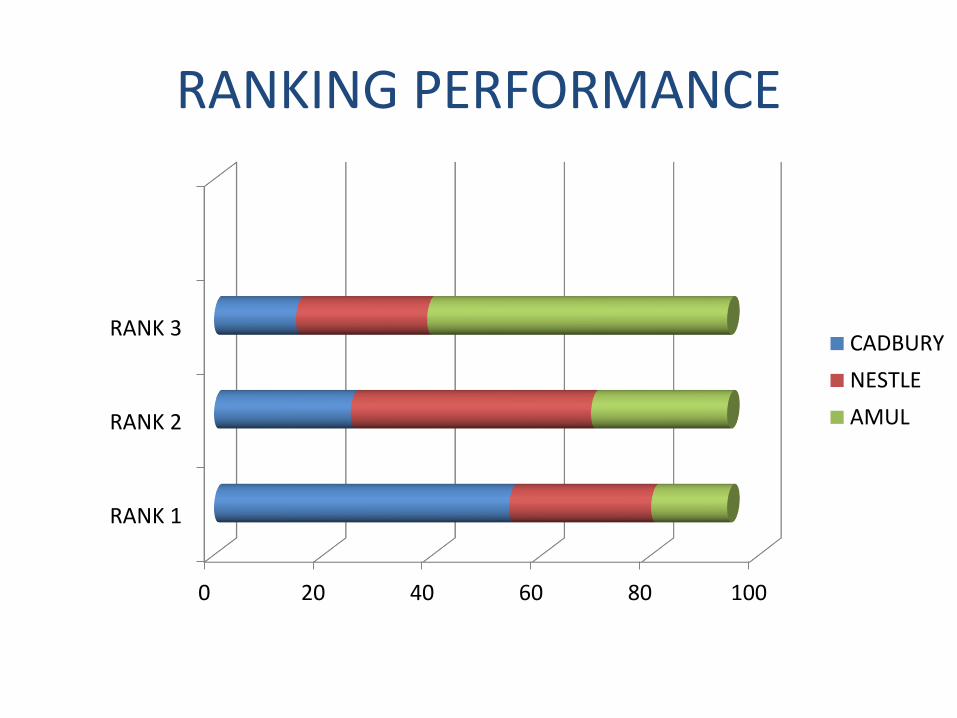
RANKING PERFORMANCE
0 20 40 60 80 100
RANK 1
RANK 2
RANK 3CADBURY
NESTLE
AMUL

CONSUMER PROFILE
68%
19%
10%
3%
CONSUMERS
UNDER 18-25 26-35 36-45 46-55

GENDER
53%
47%
0% 0%
GENDER
MALE FEMALE
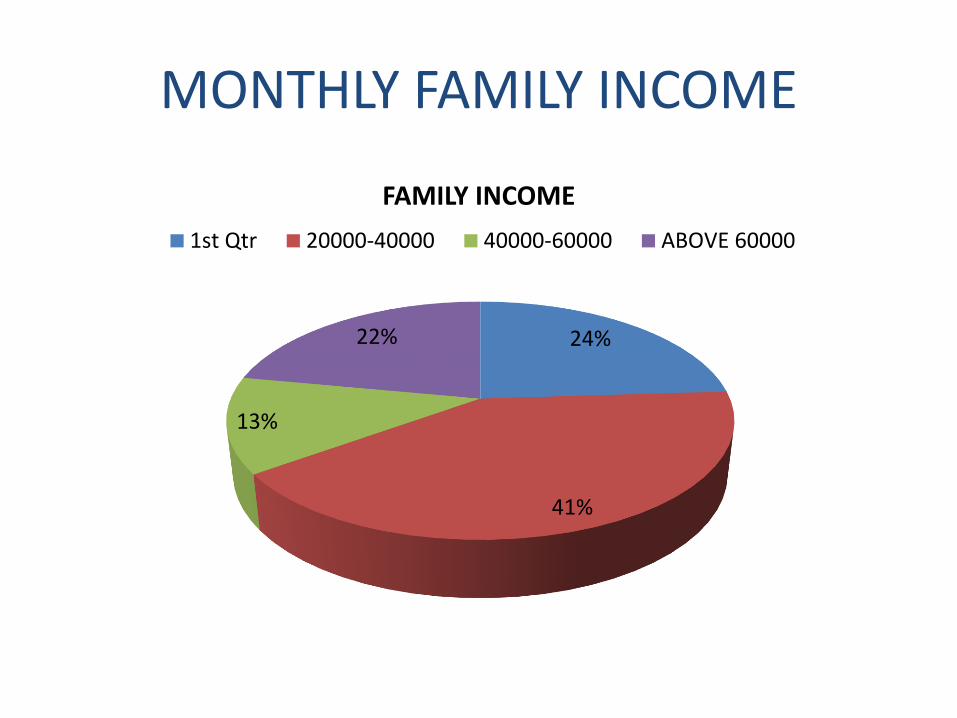
MONTHLY FAMILY INCOME
24%
41%
13%
22%
FAMILY INCOME
1st Qtr 20000-40000 40000-60000 ABOVE 60000

EDUCATIONAL QUALIFICATION
26%
44%
19%
11%
QUALIFICATION
1st Qtr GRADUATE POST GRADUATE OTHERS

OCCUPATION
67%
19%
5% 8%
1%
OCCUPATION
1st Qtr SERVICE BUSINESS PROFESSIONALS OTHERS