presentation on financial performance for the quarter · pdf file% share in gr. non-food cr....
TRANSCRIPT

Presentation on Financial Performance
for the
Quarter ended June 2015
1

2
Performance Highlights
Top Line –Milestones:
�Global Assets- Rs. 6.18 Lac cr.
�Global Deposit- Rs. 5.18 Lac cr.
� Saving Deposit- Rs. 1.50 Lac cr.
� Overseas Business- Rs. 1.07 Lac cr.
Key performance indicators:
�CRAR (BASEL III): 12.08%
� Net Interest Margin: 2.90%
�Cost of Deposit: 5.99%
� Cost to Income Ratio: 43.05%
YoY Growth (%):-
� MSME Credit: 21.8%
� Retail Credit: 25.3%
� Housing Loan: 26.6%
Bottom Line –Achievements (Q1 FY16)
�Operating Profit-Rs. 3132 cr.
�Total Income- Rs. 13432 cr.
(Rs. Crore)

3
Overview of Performance
3
Particulars Rs. Crore YOY Growth %
Operating Profit : 3132 0.2
Net profit : 721 -48.7
Global Business : 898613 13.4
Global Assets : 617760 13.0
Global Deposits : 517733 16.4
Global Credit : 380880 9.6

4
Profitability:
Performance of The Bank

Profit (Rs. Crore)
5
Sl. Parameters Q1’
FY 15
Q1’
FY 16
Q4’
FY 15
Variation (Q1'16
over Q1'15)
Amt. (%)
1 Interest Income 11589 12035 11651 446 3.8
2 Interest Expenses 7209 7932 7859 723 10.0
3 NII (Spread) (1-2) 4380 4102 3792 -277 -6.3
4 Other Income 1236 1397 1805 161 13.0
5 Operating Expenses 2491 2368 2394 -123 -4.9
6 Contribution (4-5) -1254 -970 -589 284
7 Operating Profit (3+6) 3125 3132 3203 7 0.2
8 Provisions 1720 2411 2896 691 40.2
9 Net Profit 1405 721 307 -684 -48.7

Provisions (Rs. Crore)
6
Sl. ParticularsQ1’
FY 15
Q1’
FY 16
Q4’
FY 15
Variation (Q1'16
over Q1'15)
Amt. %
1Provision towards NPAs
(Net of floating provisions) 1336 1291 3281 -46 -3.4
2Standard Advances incl.
Standard Restructured-88 70 324 157 -179.1
4 Depreciation on Investment -381 375 286 756 -198.2
5 Income Tax 793 600 -938 -193 -24.3
6 Others 61 77 -57 16 26.7
7 Total Provision 1720 2411 2896 691 40.2

Break-up : Income (Rs. Crore)
7
Sl. Parameters Q1’
FY 15
Q1’
FY 16
Q4’
FY 15
Variation (Q1'16
over Q1'15)
Amt. (%)
1 Interest on Advances 8836 8908 8569 72 0.8
2 Interest on Investments 2599 2906 2781 307 11.8
3 Other Interest Income 154 221 301 66 43.0
4 Interest Income (1+2+3) 11589 12035 11651 446 3.8
5 Other Income 1236 1397 1805 161 13.0
of which
6 Fee Based Income 925 943 850 19 2.0
7 Recovery in Written off a/cs 91 217 335 126 139.1
8 Trading Profit 149 163 538 13 8.9
9 Dividend from Liquid MF 70 74 85 4 5.5
10 Residual (incl. Derivative inc) 2 1 -2 -1 -64.3
11 Total Income (4+5) 12825 13432 13456 607 4.7

Fee Based Income-Qtr (Rs. Crore)
8
Sl. Particulars Q1’
FY 15
Q1’
FY 16
Q4’
FY 15
Variation (Q1'16
over Q1'15)
Amt. (%)
1 Processing Fees 274 285 124 12 4.3
2 LC/LG Income 196 172 198 -25 -12.6
3 Bills & Remittance 119 117 120 -2 -2.0
4 Incidental Charges 47 42 52 -5 -10.9
5 Inc from ATM operations 86 88 93 2 2.1
6 Income from Ins & MF 13 17 30 4 34.0
7 Misc. Income 92 128 135 36 39.5
8 Exchange Profit 97 94 98 -3 -3.3
Total 925 943 850 19 2.0

Break-up : Expenditure(Rs. Crore)
9
Sl. Parameters Q1’
FY 15
Q1’
FY 16
Q4’
FY 15
Variation (Q1'16
over Q1'15)
Amt. (%)
1 Intt. Paid on Deposits 6603 7368 7161 765 11.6
2 Intt. Paid on Borrowings 295 95 81 -200 -67.8
3 Others 311 469 617 158 50.8
4 Total Interest Paid (1+2+3) 7209 7932 7859 723 10.0
5 Estab. Expenses 1767 1550 1507 -218 -12.3
Of Which
5a Employee Benefits (AS-15) 663 419 850 -244 -36.8
6 Other Operating Expenses 723 818 887 95 13.1
7 Operating Expenses (5+6) 2491 2368 2394 -123 -4.9
8 Total Expenses (4+7) 9700 10300 10253 600 6.2

Cost & Yield Ratios (Annualized)
10
Sl. Particulars Q 1
FY 15
Q 1
FY 16
Q 4
FY 15
1 Cost of Deposit [%] 6.11 5.99 6.04
2 Cost of Fund [%] 5.14 5.07 5.22
3 Yield on Advances [%] 10.28 9.56 9.51
4 Yield on Investment [%] 7.97 7.94 7.93
5 Yield on Fund [%] 8.26 7.69 7.73
6 Net Interest Margin [%] 3.42 2.90 2.79

Net Interest Margin (%)
11
(Annualized)3.52 3.52 3.49 3.52 3.44 3.423.30 3.27
3.15
0.00
0.50
1.00
1.50
2.00
2.50
3.00
3.50
4.00
Mar'13 Jun'13 Sep'13 Dec'13 Mar'14 Jun'14 Sep'14 Dec'14 Mar'15
Q4 FY15 Q1 FY 16
2.79% 2.90%
Domestic NIM Q4 FY 15 : 3.14% Q1 FY 16: 3.29%

Profitability Ratios (Annualized)
12
Sl. Particulars Q 1
FY 15
Q 1
FY 16
Q 4
FY 15
1 Return on Assets [%] 1.00 0.46 0.20
2 Return on Net worth [%] 15.66 7.50 3.25
3 Opt. Profit to AWF [%] 2.23 2.00 2.13
4 Cost to Income Ratio [%] 44.35 43.05 42.78
5 Estb. Exp. To Total Exp. [%] 18.22 15.05 14.70
6 Opt. Exp. To AWF [%] 1.78 1.51 1.59
7 *Book Value per Share [Rs] 198.27 207.14 203.24
8 *Earnings per share [Rs] 31.05 15.54 6.77
* Face Value of Share after splitting is Rs. 2/-

13
Business:
Performance of the Bank

Business (Rs. Crore)
14
Sl. Parameters Jun'14 Mar'15 Jun'15 Variation % Over
Jun'14 Mar'15
1 Total Business 792405 881913 898613 13.4 1.9
Out of Which
Overseas Business 76363 100785 106925 40.0 6.1
Overseas Business (USD Mio) 12711 16161 16830 32.4 4.1
Share of Overseas Business [%] 9.64% 11.43% 11.90%
2 Total Deposit 444920 501379 517733 16.4 3.3
3 Total Advances 347485 380534 380880 9.6 0.1
4 CD Ratio [%] 78.10% 75.90% 73.57%

Deposit (Rs. Crore)
15
Sl. Parameters Jun'14 Mar'15 Jun'15Variation % Over
Jun'14 Mar'15
1 Global Deposit 444920 501379 517733 16.4 3.3
2 Overseas Deposit 34333 48350 51684 50.5 6.9
Overseas Deposit (USD Mio) 5705 7736 8121 42.3 5.0
3 Domestic Deposit 410588 453029 466048 13.5 2.9
4 Current Deposit 27057 33581 31938 18.0 -4.9
5 SB Deposit 136586 150200 149555 9.5 -0.4
6 CASA Deposit 163642 183780 181494 10.9 -1.2
Share of CASA To Dom. Dep. (%) 39.86 40.57 38.94 -2.3 -4.0
7 Term Deposit 281278 317598 336239 19.5 5.9
8 Differential Rate Dep. Incl. CD 25805 12123 6223 -75.9 -48.7
Share of DRI Dep. to Total % 5.80 2.42 1.20 -79.3 -50.3
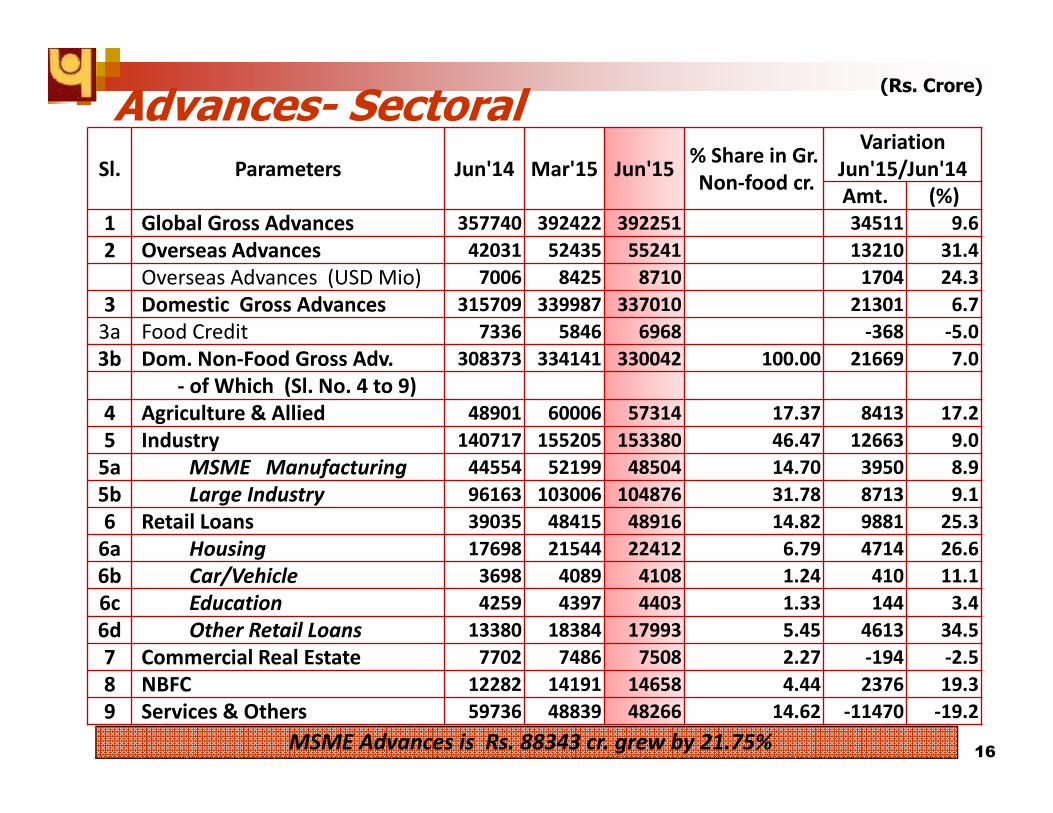
Advances- Sectoral(Rs. Crore)
16MSME Advances is Rs. 88343 cr. grew by 21.75%
Sl. Parameters Jun'14 Mar'15 Jun'15% Share in Gr.
Non-food cr.
Variation
Jun'15/Jun'14
Amt. (%)
1 Global Gross Advances 357740 392422 392251 34511 9.6
2 Overseas Advances 42031 52435 55241 13210 31.4
Overseas Advances (USD Mio) 7006 8425 8710 1704 24.3
3 Domestic Gross Advances 315709 339987 337010 21301 6.7
3a Food Credit 7336 5846 6968 -368 -5.0
3b Dom. Non-Food Gross Adv. 308373 334141 330042 100.00 21669 7.0
- of Which (Sl. No. 4 to 9)
4 Agriculture & Allied 48901 60006 57314 17.37 8413 17.2
5 Industry 140717 155205 153380 46.47 12663 9.0
5a MSME Manufacturing 44554 52199 48504 14.70 3950 8.9
5b Large Industry 96163 103006 104876 31.78 8713 9.1
6 Retail Loans 39035 48415 48916 14.82 9881 25.3
6a Housing 17698 21544 22412 6.79 4714 26.6
6b Car/Vehicle 3698 4089 4108 1.24 410 11.1
6c Education 4259 4397 4403 1.33 144 3.4
6d Other Retail Loans 13380 18384 17993 5.45 4613 34.5
7 Commercial Real Estate 7702 7486 7508 2.27 -194 -2.5
8 NBFC 12282 14191 14658 4.44 2376 19.3
9 Services & Others 59736 48839 48266 14.62 -11470 -19.2

Advances –Industry wise Breakup (Rs. Crore)
17
Major Industry wise
Deployment
Jun'14 Mar'15 Jun'15Variation
Jun'15/Jun'14
Amt. Share %
to NFCAmt.
Share %
to NFCAmt.
Share %
to NFCAmt. (%)
Food Processing 9202 3.4 14986 4.5 13442 4.1 4240 46.1
Textiles 10838 4.0 11646 3.5 11646 3.5 808 7.5
Chemical & Chemical Products 4176 1.5 5745 1.7 5917 1.8 1741 41.7
Cement & Cement Products 2461 0.9 2537 0.8 2479 0.8 18 0.7
Basic Metal & Metal Products 20770 7.7 25538 7.6 26692 8.1 5922 28.5
-Iron & Steel 19917 7.3 23701 7.1 24823 7.5 4906 24.6
Paper & paper products 1580 0.6 1604 0.5 1585 0.5 5 0.3
Petroleum 1194 0.4 1812 0.5 1174 0.4 -20 -1.7
All Engineering Products 5469 2.0 6104 1.8 5712 1.7 243 4.4
Vehicles & Vehicle parts 801 0.3 712 0.2 681 0.2 -120 -15.0
Construction 1976 0.7 2775 0.8 2683 0.8 707 35.8
Infrastructure 59903 22.1 63724 19.1 63836 19.4 3933 6.6
-Power 33874 12.5 37109 11.1 37175 11.3 3301 9.7
-Tele-Communication 6261 2.3 5938 1.8 4889 1.5 -1372 -21.9
- Roads & Ports 12979 4.8 13161 3.9 13982 4.2 1003 7.7
- Others 6789 2.5 7516 2.2 7789 2.4 1000 14.7
Residual 22347 8.2 18022 5.4 17533 5.3 -4814 -21.5
Industry 140717 51.9 155205 46.4 153380 46.5 12663 9.0

Investment (Rs. Crore)
18
Sl. Particulars Jun'14 Mar'15 Jun'15
A Gross Investment by Treasury 134249 149266 154498
1 Held To Maturity (HTM) 95456 106969 102085
2 Available For Sale (AFS) 38050 39116 50174
3 Held For trading (HFT) 743 3181 2239
4 Duration (AFS) 4.49 4.97 4.61
5 Modified Duration (AFS) 4.24 4.73 4.38
6 Duration Total Portfolio 4.91 5.09 4.94
7 Modified Duration Total Portfolio 4.69 4.89 4.73
8 Net demand & time Liabilities 420116 455134 459485
9 SLR (%) 25.35 27.19 27.47
10 SLR HTM to Total SLR (%) 83.75 84.97 78.90
11 HTM To Gross Investment (%) 71.10 71.66 66.08
12 Total SLR 111399 123133 126496
13 Total Non SLR 22850 26133 28002
B Investment by overseas branches 447 1215 1592
D Total Gross Investment (A+B+C) 134696 149877 156090

19
Break up of Gross Credit as per Asset Class (Rs. Crore)
01.04.2015 to 30.06.2015
*This includes restructured NPA amounting to Rs. 3665 cr. as on June 15.
Standard Adv.
(Excl. Std.
Restructured)
Restructured Standard
(O/S) Cumulative
(As on 30.06.15)
*NPAGross
Advances
Upto 2008-09 153758 203 2507 156468
FY 2009-10 184889 203 3214 188306
FY 2010-11 239417 203 4379 243999
FY 2011-12 280726 8447 8720 297893
FY 2012-13 285354 16423 13466 315243
FY 2013-14 316958 23808 18880 359646
FY 2014-15 327435 39293 25695 392422
June'2015 326885 39969 25397 392251
Sl. Standard Restructured
A/cs (O/s) No. Amt. O/S DFV
1 Under CDR 1 37 3
2 Under SME 7 101 4
3 Others (Non-CDR) 14 538 6
Total 22 676 13

Sector wise O/S Restructured Accounts(Rs. Crore)
01.04.2015 to 30.06.2015
Cumulative Cumulative
20
Sl.
Standard
Restructured
A/cs (O/s)
No.Amt.
O/s
1 Under CDR 77 14346
2 Under SME 331 1196
3 Others (Non-CDR) 221 24427
Total 629 39969
SlRestructured
A/CsNo.
Amt.
O/s
Diminution
in Fair
Value
1Standard
Adv. 22 676 13
2 NPA 1 14 1
Total 23 690 14
Sl. Sector O/S Amt %age Share
A Agriculture 202 0.5
B Housing 0 0.0
C Real Estate 369 0.9
D Industry 36263 90.7
E Others 3134 7.8
Total 39969 100.0
Out of the Above Major Industries/Sectors
1 Iron & Steel 5676 14.2
2 Infrastructure 18613 46.6
Out of which
Power 15624 39.1
Telecom 387 1.0
3 Drilling 595 1.5
4 Textiles 1308 3.3
5 Aviation 65 0.2
6 Sugar 1402 3.5
7 Paper/Printing 197 0.5
8 Chemical/Fertiliser/Drugs 1899 4.8
9 Cement 564 1.4
10 Manufacturing 1082 2.7
11 Engineering 189 0.5
12 Auto parts 170 0.4
13 Hotel 683 1.7
14 Education 423 1.1
15 Finance 107 0.3

Non-Performing Assets ( Rs. Crore)
21
Sl. Parameters Qtr
Jun'14
FY
Mar'15
Qtr
Jun'15
1 NPA as at the beginning of Yr. 18880 18880 25695
2 Cash Recovery 749 2925 1143
3 Up-gradation 264 1000 1214
4 Write Off 1221 5920 1323
5 Total Reduction (2+3+4) 2235 9845 3680
6 Fresh Addition 2958 16660 3382
-Fresh slippages 2655 15692 2802
-Debits in existing NPA A/cs 303 968 581
7 Gross NPAs end period 19603 25695 25397
8 Eligible Deductions incl. Provisions 9139 10298 10004
9 Net NPAs 10464 15396 15394
10 Recovery in written-off debt A/Cs 91 1017 217
Particulars Jun'14 Mar'15 Jun'15
Gross NPA% 5.48% 6.55% 6.47%
Net NPA% 3.02% 4.06% 4.05%
NPA Coverage Ratio 60.00% 58.21% 59.32%

Capital Adequacy (Basel III)(Rs. Crore)
22
Sl. Particulars Jun'14 Mar'15 Jun'15
Capital Fund
1 Tier I 33295 36991 36945
Of Which
Common Equity 32084 34745 34708
Additional Tier I 1211 2246 2237
2 Tier II 10197 11555 11685
3 Total (Tier I+II) 43492 48546 48630
4 Risk-weighted Assets 377406 397581 402439
5 Capital Adequacy Ratio 11.52% 12.21% 12.08%
6 Tier I 8.82% 9.30% 9.18%
Of Which
Common Equity 8.50% 8.74% 8.62%
Additional Tier I 0.32% 0.56% 0.56%
7 Tier II 2.70% 2.91% 2.90%

Market Share & Productivity
23
Sl. Parameters Jun’14 Mar’15 Jun’15
1 Deposit Market Share (%) 4.92 4.89 4.95
2 Credit Market Share (%) 4.95 4.80 4.79
3 Business Per Branch (Rs. Cr.) 122.26 127.42 128.22
4 Business Per Employee (Rs. Cr.) 12.90 13.19 13.26

Shareholding Pattern (%) (June’15)
24
Govt., 59.9FIIs, 15.0
Insurance, 14.0
Non-
Institutions,
5.6
MF & UTI, 5.5FIs/Banks, 0.1
Govt.
FIIs
Insurance
Non-
Institutions
MF & UTI
FIs/Banks

Capacity Building – Expanding Network
25
Population Group wise Branches
(Jun’15)
Metro UrbanSemi-
UrbanRural
1033 1361 1587 2613
15.67 20.64 24.07 39.63
ATM Network
Jun’13 Jun’14 Jun’15
6460 7717 84375500
5600
5700
5800
5900
6000
6100
6200
6300
6400
6500
6600
Jun'13 Jun'14 Jun'15
5929
6340
6594
Total Domestic Branches
Number of BC as on 30.06.15 is 8258

26
Geographic Distribution of Domestic Branches
26
Branch Network –June’15
Population group wise Distribution of Domestic Branches
37%
1%
17%
30%
6%8%
NORTHERN NORTH-EASTERN
EASTERN CENTRAL
WESTERN SOUTHERN
2,613
1,587
1,361
1,033
RURAL SEMI-URBAN
URBAN METRO

27