presentation on brand india promotion€¦ · presentation on brand india promotion by ashutosh...
TRANSCRIPT

PRESENTATION ON BRAND INDIA PROMOTIONPROMOTION
BBy
Ashutosh Gupta
COA Member -Pharmexcil
Executive Director -Medicamen Biotech Ltd.
Email : [email protected]
INTRODUCTION TO SME’S
1 G C it l B l 5 C1. Gross Capital Below 5 Crores.
2. Top Management comprises of 2-3 individuals in most cases.
3 Limited resources3.Limited resources.
4.Lack of protection and minimal chances of Bailout.
5 Good source for employment5.Good source for employment.
6.Lack of automation.
7.Generic Sales / Lack of profitability./ p y

IMPORTANCE OF BRAND
INDIA
1.Goes a long way to help SME’S for better exports.
2. Better acceptability of Products & Companies.
3. Better Margins.
4. Better Brand Positioning w.r.t. CHINA.
5.More investments and JV’S.
6.Big opportunity awaiting in 2012 in terms of patents expiring.

BRAND INDIA PROMOTION
1. Special programes to upgrade the industry image abroad as well as inside the country.well as inside the country.
2. Pharmacopeal leverage.
3 I di ’ Ph i I di ll b d3. India’s own Pharma expo in India as well as abroad.
4. Cooperative agreements with FDA’s.
5. Provision of easy finance.
6. Incentive to SME’s for entry into regulated markets.
7. Task should be shared with indians abroad.
8. Need for comprehensive package for the industry.p p g y

1. SPECIAL PROGRAMMES TO
UPGRADE THE INDUSTRY IMAGE
Trust building of our Government towards our Industry.g y
Road shows abroad.
Specific Ministerial delegations.
Special diplomatic task force.p p
Designated technical official in important markets in embassies.embassies.

2 PHARMACOPEAL LEVERAGE2. PHARMACOPEAL LEVERAGE
• IP is today at par with BP.y p• COPP’s• Brand image of Pharmacopia• Brand image of Pharmacopia.• Leap jump ahead of china.• Cost effectiveness.• Better Documentation.• Better Product Range.
3 INDIA’S OWN PHARMA EXPO3. INDIA S OWN PHARMA EXPO
• Show of strength.• We will come at par with other industries• We will come at par with other industries.• We reach all parts of the world.• Better exposure.• International Participations.
4. COOPERATIVE AGREEMENTSwith FDA’s
• Better Brand image.Ti i• Time saving.
• Cost effective• Makes way for FDI’S and JV’S.• Pharmacopeal leverage.Pharmacopeal leverage.• Increase in exports.

5 PROVISION OF EASY FINANCE5 PROVISION OF EASY FINANCE
SME’S l t l d t l k f• SME’S always struggle due to lack of finance.
• If finance is available more exports can be attained.
• Easy upgradation towards CGMP/GLP.• Concentrated effort on exports.Concentrated effort on exports.• Brand building of products.
B tt i f I di i d t• Better image of Indian industry.

6. INCENTIVES TO SME’S FOR ENTRY INTO REGULATED MARKETS
• Huge finance required.Bioequivalence– Bioequivalence
– Validations.– CTD Dossiers.– Trained regualatory staff.
• Huge gestation period.• Scope of profitability• Scope of profitability.• Better number in US and EUROPE.• Jump in exports.p p• Better brand image.• Long lasting effects.

7 TASK SHOULD BE7.TASK SHOULD BESHARED WITH INDIANS ABROAD
• Enrolment as associate members.• Most of Indians are well established• Most of Indians are well established .• They will feel more attatched.• Broad vision from the markets perspective.p p• First hand information.• Provides vast scope for improvement.
ff• More Effective Buyer seller meet in India and abroad.
• Better representation in terms of brand IndiaBetter representation in terms of brand India.• We meet good buyers resulting in growth of
exports.

8. COMPREHENSIVE PACKAGE
• NEED• NEED• International conditions are very volatile.• Regulatory authorities becoming more stricter• Regulatory authorities becoming more stricter
day by day.• More Documentations coming into view• More Documentations coming into view.• More infrastructural requirements.• Global Opportunities awaiting us• Global Opportunities awaiting us.• India gaining image of Best source for low cost
good quality genericsgood quality generics.

CHALLENGES TODAYCHALLENGES TODAY
H I Bi i l di ANDA d• Huge Investments- Bioequivalence studies, ANDA and DMF, Validations, stability studies etc
• Dying API industry.COPP’ ( C ifi f h i l d )• COPP’s ( Certificate of pharmaceutical product )
• Pollution norms in API industry• Yearly updations.• Implementation of GLP• Lack of Automation• Presence in regulated markets dominated by big pharmaPresence in regulated markets dominated by big pharma• Lack of Brand development.• Non availablity of easy bank finance.• Lack of trained and specialised manpower• Lack of trained and specialised manpower• Lack of confidence of government in Pharma SME’s

SUGGESTIONSSUGGESTIONS• Reimbursement of bioequivalence cost atleast 50%.• Subsidised API/ ingredient units preferably PSU’s• Agreements with FDAs internationally to promote IP• Relaxation of pollution norms for the API industry• Special Incentive / subsidy for the industry on lines of tuf
scheme to take care of yearly Updations• GLP upgradation subsidy shall be provided to the industry• Automation subsidy shall be provided to compete
internationally.• Incentive to enter regulated markets
M k ti b d h ld b t d f b d• Marketing coops abroad should be promoted for brand development.
• Banking Suggestions ( meeting with secy commerce on 13th)More research centres like NIPER for trained manpower• More research centres like NIPER for trained manpower availaibility
• Provision of a technical person in embassies

OTHER SUGGESTIONOTHER SUGGESTION
• Development of clusters instead of SEZsDevelopment of clusters instead of SEZs• Plant approval cost reimbursement to be
included in MAI schemeincluded in MAI scheme• Better incentive to bulk drugs under focus
k t hmarket scheme• Subsidy to units for upgradation from
schedule M to CGMP.

LET THELET THE VOICEVOICE BEGIN

L/O/G/OL/O/G/O
Thank You!Thank You!

EXPORT OPPORTUNITIES AND MDA/MAI SCHEMES/
I i S iInteractive Session
06th May, 2011
P t ti bPresentation by:Abhay Kumar Sinha, Assistant Regional Director
PHARMACEUTICALS EXPORT PROMOTION COUNCIL(Set up by Ministry of Commerce, Govt., of India)
Regional Office, 305 Padma TowerII, 22, Rajendra Place, New Delhi8Email: [email protected]

AGENDAAGENDAAGENDAAGENDA
1 GlobalGlobal PharmaceuticalPharmaceutical IndustryIndustry –– OverviewOverview
IndianIndian PharmaceuticalPharmaceutical IndustryIndustry –– OverviewOverview
O t itiO t iti ff I diI di PhPh I d tI d t
2
3 OpportunitiesOpportunities forfor IndianIndian PharmaPharma IndustryIndustry3
MDA/MAIMDA/MAI SchemesSchemes ofof DepartmentDepartment ofof CommerceCommerce4
RoleRole ofof PharmexcilPharmexcil5
2

1 GlobalGlobal PharmaceuticalPharmaceutical IndustryIndustry –– OverviewOverview
The global pharmaceutical markets are estimated atThe global pharmaceutical markets are estimated atUS$773.1bn (2008) growing at 4.8% percent over theprevious year.
A th l t t t ti ti il bl f U it d N tiAs per the latest statistics available from United Nations‘Comtrade’ the Global exports of Bulk Drugs andPharmaceuticals in the year 2008 stood at US$ 404.2bngrowing by 10.37 over the previous year.
Global Exports of Pharmaceuticals stood at US$374.69bn.growing by 10.38%.
Bulk drugs have a meager share of 7.3% in the total trade atUS$29.5bn.

Top Exporting Countries of Bulk Drugs & Pharmaceuticals p p g g(figs. in US$mn.)
Rank Country (Exports) 2007 2008 % share1 Germany 55,520.78 67,438.88 16.682 B l i 47 377 79 50 665 56 12 532 Belgium 47,377.79 50,665.56 12.533 Switzerland 36,232.92 44,145.34 10.924 USA 33,379.84 38,076.67 9.425 France 28,291.37 33,189.47 8.21, ,6 United Kingdom 28,975.58 31,342.25 7.757 Ireland 18,749.69 22,546.15 5.588 Netherlands 15,361.05 17,231.52 4.269 Italy 15,646.15 16,595.01 4.1110 Sweden 8,719.60 9,167.87 2.2711 China 6,093.35 8,117.00 2.0112 Denmark 7,237.12 8,076.41 2.0012 Denmark 7,237.12 8,076.41 2.0013 Austria 6,303.99 7,382.23 1.8314 Canada 6,188.93 6,191.10 1.5315 India 4,475.95 5,822.45 1.44
Source: UN trade database ‘Comtrade’, Pharmexcil

Top Importing Countries of Bulk Drugs & Pharmaceuticals (figs. in US$mn.)
Rank Country 2007 2008 % share
1 USA 53,954.01 59,868.18 15.38
2 Germany 40,934.01 46,669.00 11.99
3 Belgium 41,602.36 44,332.86 11.39g , ,
4 France 22,068.56 24,820.57 6.37
5 United Kingdom 20,418.65 20,658.26 5.31
6 Italy 18 176 71 19 974 99 5 136 Italy 18,176.71 19,974.99 5.13
7 Switzerland 16,693.44 17,777.67 4.57
8 Netherlands 16,353.47 12,981.00 3.33
9 Japan 9 145 98 10 998 52 2 829 Japan 9,145.98 10,998.52 2.82
10 Canada 10,315.06 10,770.32 2.77
Source: UN trade database ‘Comtrade’, Pharmexcil
5

Region-wise Imports of Formulations (figs in US$ mn.)Region 2004 2005 2006 2007 2008 CAGR
(2004-05 to 2008-
09)
% Share
09)
EU 136,646.37 150,930.08 165,865.34 198,076.04 219,722.57 12.61% 57.82%
North America 38,148.73 43,075.37 51,539.68 58,999.89 63,054.17 13.39% 16.59%
Other European C t i
12,919.97 14,291.89 16,394.10 18,889.73 20,317.85 11.98% 5.35%Countries
Asia (Excluding Middle East)
10,075.43 11,803.01 13,293.29 15,869.83 19,442.41 17.86% 5.12%
LAC 7,829.30 9,220.21 10,909.13 16,137.70 15,711.52 19.02% 4.13%
CIS 4 374 39 6 330 61 8 768 74 10 129 35 13 229 05 31 87 3 48%CIS 4,374.39 6,330.61 8,768.74 10,129.35 13,229.05 31.87%
3.48%
Middle East 7,129.95 8,384.63 8,490.05 11,104.89 9,383.53 7.11% 2.47%
Oceania 5,137.06 5,931.11 5,963.17 7,195.15 7,704.82 10.67% 2.03%
Af i 3 677 62 4 191 28 4 737 33 5 712 55 4 964 89 7 79% 1 31%Africa 3,677.62 4,191.28 4,737.33 5,712.55 4,964.89 7.79% 1.31%Asean 2,730.36 3,455.16 4,183.43 4,692.09 4,511.31 13.38
%1.19%
South Asia 659.90 822.85 1,058.40 1,395.46 1,526.66 23.33% 0.40%
6
Other America 256.11 321.87 331.55 365.76 443.91 14.74% 0.12%
Grand Total 229,585.17 258,758.09 291,534.21 348,568.44 380,012.71 13.43% 100.00%
Source: UN Trade Statistics Database ‘Comtrade’

Region-wise Imports of Bulk Drugs (figs in US$ mn.)
Rank Region 2004 2005 2006 2007 2008 CAGR % Share
1 EU 8,417.18 9,059.21 9,598.95 10,631.82 10,942.03 6.78% 47.76%
2 North America 2,981.26 3,125.03 2,926.99 3,155.24 3,822.54 6.41% 16.68%
3 Asia (Excluding Middle East)
1,518.39 1,600.15 1,659.63 1,818.84 2,193.67 9.63% 9.57%
4 LAC 984.74 1,021.29 1,108.10 1,201.14 1,599.77 12.90% 6.98%
5 South Asia 498.70 646.90 711.38 1,005.66 999.85 18.99% 4.36%
6 Asean 715.29 979.91 881.89 1,112.83 995.17 8.61% 4.34%7 Other European
Countries810.22 791.49 707.29 675.53 854.27 1.33% 3.73%
8 Middle East 665.67 710.41 580.70 730.07 636.15 -1.13% 2.78%
9 Africa 195.79 228.04 232.50 292.86 336.65 14.51%
1.47%
10 Oceania 327.89 320.37 267.51 271.55 294.37 -2.66% 1.28%
11 CIS 125.49 144.41 176.68 212.79 231.95 16.60%
1.01%
12 Other America 3.33 4.12 3.15 3.29 4.13 5.54% 0.02%
Grand Total 17,243.97 18,631.35 18,854.79 21,111.62 22,910.57 7.36% 100.00%
7
Source: UN Trade Statistics Database ‘Comtrade’

IndianIndian PharmaceuticalPharmaceutical IndustryIndustry –– OverviewOverview2
The Indian domestic pharmaceutical market size isThe Indian domestic pharmaceutical market size isestimated at US$12.2bn (Rs.55,454 crores) in the year2008 growing by health 10%. (Source: IMS)
India’s Healthcare Expenditure in the year 2008 isIndia s Healthcare Expenditure in the year 2008 isestimated at US$68.6bn (as per Espicom Reports).
Pharmaceuticals expenditure occupies a share 17.78%i h lth dit d 0 8% i GDPin health care expenditure and 0.8% in GDP.
The per capita Pharmaceutical expenditure in thecountry is approximately US$10 (compared withy pp y ( pUS$1,154 of USA).
8

Indian pharmaceutical industry is among the world’s largestand most developed.
15th largest exporter of Bulk Drugs & Formulations in value terms15th largest exporter of Bulk Drugs & Formulations in value termswith a share of 1.44% during 2008.
It ranked 14th in value terms and 3rd in volume terms.
The country is 9th largest exporter of APIs/Bulk Drugs and
Ranked 8th in terms of export volumesRanked 8th in terms of export volumes.
9

EXPORTS FROM INDIA
Exports for the year 2009-10 are estimated atUS$8.88bn.
CAGR (2005-06 to 2009-10) was 17.46%
Pharmaceutical exports occupied a share of aroundPharmaceutical exports occupied a share of around5% in India’s total exports over the last 5 years.
10

11

Country‐wise Exports of India’s Drugs, Pharmaceuticals & fine chemicals (figs. in Rs. Crores)
Rank Importing Country 2007‐08 2008‐09 2009‐10 CAGRYoY
Growth % ShareCumulativ
Rank Importing Country 2007‐08 2008‐09 2009‐10 CAGR Growth Rate
% Sharee % Share
1 USA 5,839.35 7,177.06 9,121.25 30.26% 27.09% 21.67% 21.67%2 UK 1,146.52 1,235.83 1,636.70 18.45% 32.44% 3.89% 25.56%3 Germany 1,448.01 1,530.49 1,502.44 7.61% -1.83% 3.57% 29.13%4 R i 1 243 81 1 529 60 1 301 64 4 89% 14 90% 3 09% 32 22%4 Russia 1,243.81 1,529.60 1,301.64 4.89% -14.90% 3.09% 32.22%5 South Africa 684.27 1,127.38 1,164.32 27.02% 3.28% 2.77% 34.99%6 Brazil 771.61 1,167.64 987.58 12.27% -15.42% 2.35% 37.33%7 Nigeria 671.24 1,040.75 904.17 14.53% -13.12% 2.15% 39.48%8 Canada 789.15 1,096.04 767.06 9.94% -30.02% 1.82% 41.30%9 Vi t N 483 56 536 73 707 84 14 62% 31 88% 1 68% 42 98%9 Viet Nam 483.56 536.73 707.84 14.62% 31.88% 1.68% 42.98%
10 Netherlands 522.69 683.28 685.15 14.35% 0.27% 1.63% 44.61%11 Turkey 502.10 627.99 661.42 10.63% 5.32% 1.57% 46.18%12 China 879.42 564.81 643.20 -4.83% 13.88% 1.53% 47.71%13 UAE 426.11 478.14 577.79 13.26% 20.84% 1.37% 49.08%14 Thailand 352.48 461.08 573.12 24.95% 24.30% 1.36% 50.45%15 Ukraine 497.14 687.45 569.13 7.37% -17.21% 1.35% 51.80%16 Spain 501.42 622.89 564.36 12.64% -9.40% 1.34% 53.14%17 Italy 471.28 633.87 563.21 7.47% -11.15% 1.34% 54.48%18 Kenya 366.60 544.08 551.26 30.69% 1.32% 1.31% 55.79%
12
19 Iran 379.11 485.64 532.23 15.31% 9.59% 1.26% 57.05%20 Ghana 296.44 332.22 522.03 34.46% 57.13% 1.24% 58.29%

Current Status of India in Global Pharma MarketsCurrent Status of India in Global Pharma Markets
Global Pharmacy forGeneric Medicines
1 Manufacturing Hub of theWorld
2 Emerging Flagship Industryof India
3
Finished generics supplied from India account for 20% of the global generics market.Source: PricewaterhouseCoopers, The changing dynamics of pharma outsourcing in Asia
11
It is estimated that 70% of the patients belonging to 87 developing countries received medicineprocured from India by
More Than 90% of WHO Prequalified API [ARVs, Anti-tubercular & Anti-malarials ] are sourced fromIndia.22
p yThe United Nations Children’s Fund (UNICEF)International Dispensary Association (IDA)the Global Fund andthe Clinton Foundation.
33
Indian generic ARVs approved by the US Food and Drug Administration (US FDA) also resulted in cost-
Medicine Sans Frontiers also purchases 80% of its ARVs, for its projects in over 30 countries, fromIndia.
Source: Ellen F.M. ’t Hoen, LL.M., The Global Politics of Pharmaceutical Monopoly Power, AMB 2009
44
55 savings of an over 90% of the ARVs for PEPFAR.55

The largest number of US FDA approved facilities outside USare in India.
1/3rd of all DMFs & 30% of all approved ANDAs in US are fromIndia, ranking next only to USA.
450
Year‐wise No. of DMFs filed by Top 5 countries with U.S. FDA (as 11.6.2010)
250
Prescription ANDA approvals of Major Countries with U.S. FDA (As on 31.12.2009)
200
250
300
350
400
150
200
250
0
50
100
150
1999 2000 2001 2002 2003 2004 2005 2006 2007 2008 2009June, 2010
0
50
100
1999 2000 2001 2002 2003 2004 2005 2006 2007 2008 2009
14
,
INDIA USA ITALY CHINA JAPAN ROW USA Israel India Switzerland Canada ROW

India’s CompetenceIndia’s Competence
India’s Presence in Regulated Markets
1. USA*
Over 30% of DMFs, ANDAs, Tentative Approvals in USA are fromIndia
India accounts for one out of every four Abbreviated New DrugApplication (ANDA) approvals in the years 2007 & 2008Application (ANDA) approvals in the years 2007 & 2008
Ranks first in total Type II active Drug Master Files (DMFs) with U.S.FDA
Received 31% of all tentative approvals (as on 11.12.2008).
The country currently has 1,735 Type-II active DMFs filings with USFDA of all 6,482 DMFs filed which is 26.76% of all DMFs filed with thatcountry.
- Source: U.S. FDA, Pharmexcil Research* All figs as at the end of Sep 08
15
All figs. as at the end of Sep. 08

2. Europe*
Hi h b f C ifi f S i bili (CEP ) i dHighest number of Certificate of Suitability (CEPs) is granted toIndia.
India has 539 CEPs (21 47%) of the total 2 511 granted by EDQMIndia has 539 CEPs (21.47%) of the total 2,511 granted by EDQM.
The country has 153 EDQM approved facilities for 195 moleculesout of the total 693molecules approved by EDQMout of the total 693molecules approved by EDQM.
* Source: European Directorate of Quality Medicine
EDQM) (As on July, 2009)
16

Registration SummaryRegistration Summary
Table 5: Approvals Received by Indian Pharma Companies from Various Regulatory Agencies of the World (As on Sep. 2009)Name of Regulatory Agency No. of Companies
Approved from Approved from India
DMFs filed with U.S. FDA (companies) 136DMFs filed with U.S. FDA (facilities) 169Number of molecules filed for which DMFs have beenfiled
464
Formulation Plants approved by U.S. FDA 23EDQM (European Directorate of Quality Medicine) 153EDQM (European Directorate of Quality Medicine)(Bulk drug facilities)
153
Number of CEPs received 539Number of Molecules for which CEPs have been filed 195with EDQMWHOGMP Certified Plants Over 1,000DACA (Drug Administration and Control Authority),Ethiopia
50
17
Ethiopia(TFDA) Tanzania Food and Drugs Authority 75Source: FDA sites of respective countries, Pharmexcil Research

OpportunitiesOpportunities forfor IndianIndian PharmaPharma IndustryIndustry3
Generic Opportunity: 450 molecules worth US$350 bn are going off patent in the coming years1
The contract manufacturing opportunity of prescription drugs is estimated to increase from a value of$26.2 billion to $43.9 bn. in the next 5years.2
There are many important categories such as monoclonal antibodies, Peptides, biotech, etc., which arenot filed by India forgoing a global opportunity of approx. US$ 90bn.
3
$ $ y
Several technologies such as sustained release/controlled /modified release LyophilizedPharmaceuticals, bio-pharmaceuticals, Specialty generics, Drug Intermediates, NIP basedAPIs/Formulations, regulatory compliant infrastructure are not attempted in India. There are more than285 drug in this category with an opportunity of US$50bn.
4
In the drug research value chain, there are certain key strengths such as:• Significant valid population to participate in clinical trials• Significant capabilities in medical skills, hospital beds and IT.
5
There exists an opportunity to capture the market share in global clinical R&D market such as clinical6 pp y p gtrials, data management, testing, etc.6
4 By 2012, nearly half of all newly approved prescription drug products will be biologics7
4 By the end of 2010, patents will expire on brand biologics with $15bn in annual sales.Source: GPhA.
8

MDA/MAIMDA/MAI SchemesSchemes ofof DepartmentDepartment ofof CommerceCommerce4
Govt of India extends financial assistance through Export Promotion
Special Export Promotion Schemes for ExportersSpecial Export Promotion Schemes for Exporters
Govt. of India extends financial assistance, through Export PromotionCouncils, for the promotion of Pharma industry, under the following twoschemes:
Market Development Assistance (MDA) Schemep ( )Market Access Initiative (MAI) Scheme
Market Development Scheme:The Objectives of the MDA Scheme is basically to assist the SMEs toypromote exports of their products andExplore new markets for their productFocus areas have been identified by the Government of India viz:
Focus CISFocus AfricaFocus Asean +2 (i.e. Australia & New Zealand.)Focus LAC
19

The Objectives of the MDA Scheme is basically to assist the SMEs to
MDA SCHEMES
j ypromote exports of their products
Explore new markets for their product
Company applying for MDA shall not be under investigation/charged /prosecuted / debarred / black listed under the Foreign Trade Policy ofIndia or any other law relating to export and import business.
Maximum MDA assistance shall be inclusive of MDA assistance receivedMaximum MDA assistance shall be inclusive of MDA assistance receivedfrom all Govt. bodies / EPCs/ FIEO / ITPO etc.
Member exporters of EPCs etc would also be eligible for MDA assistancefor participation in events organized by ITPO abroad. Their applications /p p g y ppclaims would be routed / reimbursed through the concerned EPC etc.
A maximum of 3(three) participations in a particular trade fair / exhibitionwould be eligible for MDA assistance.

Exporting companies with an FOB value of exports of up toRs 15 00 crores in the preceding year are eligible for MDARs.15.00 crores in the preceding year are eligible for MDAscheme.
Assistance for Travel (economy excursion class) + built upfurnished stall in Focus Areas (Assistance Amount subject tofurnished stall in Focus Areas (Assistance Amount subject toceiling – Shown in separate slide).
Assistance available for participation through Council sponsoredactivitiesactivities.
Assistance permissible to one regular employee/director/partner/proprietor of the company. Exporter of foreign nationalityor holding foreign passport will not be eligibleor holding foreign passport will not be eligible.
Intimation application must be received in any of the offices ofPharmexcil with a minimum of 14 days advance notice excludingthe date of receipt of application in Pharmexcil & the date ofthe date of receipt of application in Pharmexcil & the date ofdeparture from the Country. (Application available for downloadfrom our Website).

Companies participating for more than 3 times including past casesfor a particular fair/exhibition have to participate in that fair on selffi i b ifinancing basis.
MDA Amount Ceilings & Visits in each areas permitted
S N f M i fi i lS. No. Area / Sector No. of
VisitsMaximum financial Ceiling per event
1 Focus LAC 1 Rs.1,80,000Foc s Africa (incl ding2 Focus Africa (including WANA Countries) 1 Rs.1,50,000
3 Focus CIS 1 Rs.1,50,0004 Focus ASEAN + 2 1 Rs 1 50 0004 Focus ASEAN + 2 1 Rs.1,50,0005 General Areas 1 Rs. 80,000
Total Visits 5
The participation of individual companies in the above activities shall besubject to the following conditions:
(1) For EPC etc. led Trade Delegations/BSMs only air-fare by Economy Excursion class upto a maximum of Rs 70 000 (Rs 1 00 000 in case of Focus LAC) shallclass upto a maximum of Rs. 70,000 (Rs. 1,00,000 in case of Focus LAC) shall be permissible.
(2) Maximum number of permissible participations shall be five in a financial year as indicated in above table (No travel grant is \permissible for visit to General Areas).permissible for visit to General Areas).
(3) Assistance shall be permissible to one regular employee/director/ partner/proprietor of the company. Assistance would not be
il bl t t f f i ti lit h ldi f iavailable to exporter of foreign nationality or holding foreign passport.

After completion of the activity, the exporters have to file theirclaims with Pharmexcil along with the following simpledocuments:
Claim form as per Annexure – VII (downloadable from ourp (website) duly signed by the Chartered Account
Claims must be filed immediately upon return to India aftercompletion of activity but positively within 45 days from theirreturn to Indiareturn to India.
Market Access Initiatives (MAI) Scheme is an Export Promotion
MAI SCHEME
Market Access Initiatives (MAI) Scheme is an Export PromotionScheme envisaged to act as a catalyst to promote India’s exporton a sustained basis.
The scheme is formulated on focus product – focus countryThe scheme is formulated on focus product focus countryapproach to evolve specific market and specific product throughmarket studies / survey.
Assistance provided to EPCs / TPOs etc for enhancement ofAssistance provided to EPCs / TPOs etc for enhancement ofexport through accessing new markets or through increasing theshare in the existing markets.
Level of assistance for each eligible activity is fixedLevel of assistance for each eligible activity is fixed.

Marketing Projects Level of AssistanceMarketing Projectsabroad:
Level of Assistance
Leasing/rental charges of Showroom/warehouses
75%, 50% and 33% in the first, second and third year respectively
Ceiling of Rs 100 00 lakhs for each market/product per annumCeiling of Rs. 100.00 lakhs for each market/product per annum.
In cases of multi product showroom/warehouse-Rs.500.00 lakhs
Participation & Organising Trade Festival of India etc
Ceiling of Rs. 500.00 lakhs. 65% f th t t l t d bli it t l t l tiTrade Festival of India etc
abroad65% of the total expenses towards venue, publicity, catalogues, translation and interpreter and any other component as approved by EC.
Displays in International Departmental store
50% of rental charges subject to a ceiling of Rs.100.00lakhs per annum/each product
Publication of World class Catalogues
50% for a particular market subject to a ceiling of Rs.10.00 lakhs per market per annum. Can be again considered after 3 years for updation.
Publicity Campaign and Brand Promotion
50% for two years subject to a ceiling of Rs.100.00 lakhs per annum per marketPromotion market
Research and Product Development
65%. Ceiling Rs.100 lakhs for each product.
Industrial Clusters 75% subject to ceiling of Rs.100 lakhs.
RBSM 65% of total expenses. 100% of the travel cost(economy) of foreign delegates. Hotel charges – up to Rs75000/-. Rs 1lakhs in case of American continent

Capacity Building Level of Assistance
Imparting training 65% subject to ceiling of Rs.10 lakhs. (study material, venue cost, faculty h i icharges, organising expenses
Upto 90% of the cost of developing study material for trainers and exporters subject to ceiling of Rs.25 lakhs may be considered.
Up-gradation of lab, universities Research
75% of the approved expenditure subject to ceiling of Rs.50 lakhs per organisation for creating hardware and software neaded for creating theseuniversities, Research
institutions, national level institutions for fulfilling SPS measures, related testing
organisation, for creating hardware and software neaded for creating these facilities
Capacity building for up gradation of quality
66% subject to a ceiling of Rs.25 lakhs per annum towards organising training prog for skill imrovement for quality up gradation productgradation of quality training prog for skill imrovement for quality up-gradation, product improvement etc.
Developing Common facility centres, packaging etc.
65% subject to a ceiling of Rs. 50 lakhs. Funds may be provided for engaging experts/consultants. ( Amount up to10 lakhs in each case)
Hiring of consultants in the prospective/buyer country
65% subject to a condition that an exporter can apply for maximum two reimbursements in a year and the total ceiling for each exporter would be Rs.5 lakhs per annum.

Statutory Compliances
Level of Assistance
Charges/expenses for fulfilling statutory requirements in the buyer country including product Registration charges
50% subject to ceiling of Rs.50 lakhs per annum for each exporter.
Anti dumping Anti money Support up to 50% of the actual expenditure subject to a celing of Rs 200Anti-dumping, Anti money laundering and other investigations/ compliances
Support up to 50% of the actual expenditure subject to a celing of Rs. 200 lakhs in each case. Nature of litigation and extent of support shall be decided by EC on case to case basis

Studies Level of Assistance
Market Study 75% subject to a ceiling of Rs. 100 lakhs per study. 100% in case of studies assigned by Department of Commerce for the cause of export promotion.
Ceiling of Rs. 100.00 lakhs for each market/product per annum.
E t P t ti l f th Th i ti f t t t ld b th di ti fExport Potential survey of the states
The organisation of state government would be the co-ordinating agency for the survey. 65% of the cost of survey subject to a ceiling of Rs 100 lakhs.
Project/Study which further the objective of the scheme
Financial assistance to any project/study.65% subject to ceiling of Rs 50 lakhsobjective of the scheme 65% subject to ceiling of Rs. 50 lakhs.
Studies on WTO related matters and JSG/FTA/RTA
Assistance may also be provided for preparation of projects through reputed professional institutions.Upto 100% of the cost.

Miscellaneous Level of AssistanceDeveloping Foreign Trade P t l
100% upto a maximum of Rs 2 crore.Portal

Out of the above, individual exporters are eligible to apply for the following incentives:
Reimbursement of 50% of registration chargesR & D projectsHiring of Consultants at abroadLitigation expenses in the buyer country on anti dumping duties etc
Reimbursement of Product Registration Charges overseas-50% of registration fees upto Rs 50 lacs( subject to MAI Guidelines)
31
RoleRole ofof PharmexcilPharmexcil5
Pharmexcil is an autonomous export promotion council (EPC)set up by by Ministry of Commerce & industry, Government ofIndia setup on 12 May, 2004India setup on 12 May, 2004
With the objective of focusing on healthcare and pharmaceuticalproducts in the global arena

Pharmexcil is the designated authority for drugs &pharmaceutical sector dealing in the following products/pharmaceutical sector dealing in the following products/services from India:
Bulk drugs (APIs) Drug intermediatesD f l ti Bi t h lDrug formulations BiotechnologyBiological products Herbal productsMedicinal plants HomeopathyDiagnostics Nutraceuticals & PhytochemicalsC t t h C t t f t iContract research Contract manufacturingClinical research Surgical dressingsCollaborative research Pharma industry related servicesTechnologies/consultancy
33

In the duty of export promotion, Pharmexcil provides the followingservices to Indian pharmaceutical companies:services to Indian pharmaceutical companies:
Dissemination of trade enquiries
Organizing trade delegations from India to overseasO ga g t ade de egat o s o d a to o e seasmarkets as also reverse delegations
Organizing buyers-sellers meets
Organizing participation in international trade fairs
Providing policy inputs to the government of India onIndia’s bilateral trade in pharmaceuticals
Dissemination of India’s pharmaceutical trade statistics
Preparing technical publications, exporters’ directory, etc.
34

Resolving grievances of pharmaceutical importers ande portersexporters
Organizing national & international seminars on areasrelated to pharmaceutical industry.
Certificate of origin
35

Other services from Pharmexcil:
Country reportsW ld Ph R tWorld Pharma ReportsPatents Facilitation CenterSeparate Cell for Ayush products
36

Offices of PharmexcilOffices of Pharmexcil
H d Offi Ph 91 40 23735462/66Head Office:Pharmexcil101, Aditya Trade CentreAmeerpetH d b d 500 034
Phone: 91 – 40 – 23735462/66Fax: 91 – 40 – 23735464Email: [email protected]
Hyderabad – 500 034.
Regional Office, MumbaiPharmexcilT.V. Industrial Estate, Unit No.
Phone: 91 22 24938750 / 51Fax: 91 22 24938822Email: [email protected]
2111st Floor,248A, S.K. Ahire MargWorli, Mumbai 400 030.
Regional Office, DelhiPharmexcil305, Padma Tower II22 Rajendra Place
Phone: 91 11 41536654 / 45062550 Fax: 91 11 41536658Email: rodelhi@pharmexcil com
37
22, Rajendra PlaceNew Delhi 110008
Email: [email protected]

THANK YOU
38

Role of SME’s and Role of SME’s and I i i i k bI i i i k bInitiatives taken by Initiatives taken by
PHARMEXCILPHARMEXCILPHARMEXCILPHARMEXCIL
By yMr. Nipun JainChairman SME Panel PHARMEXCILMD, M/s PHARMCHEM

SME SME PharmaPharma Industry Industry --OverviewOverview
There are 10 563 licensed drugThere are 10 563 licensed drugThere are 10,563 licensed drug There are 10,563 licensed drug manufacturers in India. The combined manufacturers in India. The combined
h f h ih f h istrength of SME pharma sector is 9,456 strength of SME pharma sector is 9,456 unitsunitsSME share is 87% in production by SME share is 87% in production by
l d 40% h b l i thl d 40% h b l i thvolume and 40% share by value in the volume and 40% share by value in the marketmarket

Current SituationCurrent SituationCurrent SituationCurrent Situation
SME’s remain neglected, even after providingSME’s remain neglected, even after providingSME s remain neglected, even after providing SME s remain neglected, even after providing quality medicines at competitive prices. quality medicines at competitive prices.
Myth: medicines at lower prices cannot be of Myth: medicines at lower prices cannot be of good qualitygood qualitygood qualitygood quality
Distorted Media reports are planted byDistorted Media reports are planted byDistorted Media reports are planted by Distorted Media reports are planted by multinationals.multinationals.

Is Quality an Issue with SME ?Is Quality an Issue with SME ?Is Quality an Issue with SME ?Is Quality an Issue with SME ?No unit is licensed to manufacture drugs and No unit is licensed to manufacture drugs and ggmedicines without being GMP compliantmedicines without being GMP compliant
Indian GMP standards are more stringent than most Indian GMP standards are more stringent than most developed countriesdeveloped countries
No facts in Media reports that India is source of 40% No facts in Media reports that India is source of 40% spurious medicines in the worldspurious medicines in the worldspurious medicines in the worldspurious medicines in the world
In reply to Question No 68 DT 17 10 2008 ofIn reply to Question No 68 DT 17 10 2008 of LokLokIn reply to Question No. 68 DT 17.10.2008 of In reply to Question No. 68 DT 17.10.2008 of LokLokSabhaSabha only 0.29% samples were found to be spuriousonly 0.29% samples were found to be spurious

SME Pharma Sector SME Pharma Sector ––Export PotentialExport Potential
India is exporter of Drugs & Pharmaceuticals for USD 8 India is exporter of Drugs & Pharmaceuticals for USD 8 p gp gbillion every year and the export market has a potential to billion every year and the export market has a potential to grow from 15 grow from 15 –– 30% every year if there is right 30% every year if there is right synchronization of the various departments of Government ofsynchronization of the various departments of Government ofsynchronization of the various departments of Government of synchronization of the various departments of Government of IndiaIndiaTotal production of Drugs in India is Rs 85,000 Total production of Drugs in India is Rs 85,000 CroresCrores. The . The SME SME PharmaPharma sector produces 87% of the drugs in volume and sector produces 87% of the drugs in volume and has 40% share value wisehas 40% share value wiseThe Ministry of Commerce is specially promoting exports ofThe Ministry of Commerce is specially promoting exports ofThe Ministry of Commerce is specially promoting exports of The Ministry of Commerce is specially promoting exports of Drugs to focus countries of Africa, Latin America and CIS. Drugs to focus countries of Africa, Latin America and CIS. And the Ministry of Finance is giving a stimulus of 3% And the Ministry of Finance is giving a stimulus of 3% incentive in Focus Market Scheme or Focus Product Market incentive in Focus Market Scheme or Focus Product Market SchemeScheme

Problems of SME Pharma Sector Problems of SME Pharma Sector with Public Sector Bankswith Public Sector Banks
The public sector banks are refusing refinancing of L/C D/A The public sector banks are refusing refinancing of L/C D/A p g gp g gand ECGC covered D/A exports specially to SME sectors on and ECGC covered D/A exports specially to SME sectors on the ground of the ground of “High risk category of the country and “High risk category of the country and volatile international situation”volatile international situation”volatile international situation . volatile international situation . PSU Banks agree to give export credit to SME only if they PSU Banks agree to give export credit to SME only if they provide extra collateral security and are harassing SME units provide extra collateral security and are harassing SME units by delaying proposals of export finance and making fictitious by delaying proposals of export finance and making fictitious barriers.barriers.The SMEThe SME PharmaPharma Exporters thenExporters then have to export throughhave to export throughThe SME The SME PharmaPharma Exporters then Exporters then have to export through have to export through Multinational Companies or International Trading Houses Multinational Companies or International Trading Houses which makes our Exports costly and uncompetitivewhich makes our Exports costly and uncompetitive..

Problems of SME Pharma Sector Problems of SME Pharma Sector with Public Sector Banks (Contd.)with Public Sector Banks (Contd.)In reply to starred question no. 164 on DT 9In reply to starred question no. 164 on DT 9thth March 2007 the March 2007 the p y qp y qHonorable Minister for Finance has stated in Honorable Minister for Finance has stated in LokLok SabhaSabha that that “No export refinancing will be denied and any such case “No export refinancing will be denied and any such case has to brought to the Chief Executive of the Bank and havehas to brought to the Chief Executive of the Bank and havehas to brought to the Chief Executive of the Bank and have has to brought to the Chief Executive of the Bank and have instructed Banks to be liberal and very helpful in instructed Banks to be liberal and very helpful in providing export credit.”providing export credit.”
EximExim Bank Bank –– When contacted their standard reply is that Line When contacted their standard reply is that Line of Credit is fully utilized and nothing is left for SME sector.of Credit is fully utilized and nothing is left for SME sector.TheThe GovtGovt.. shouldshould reservereserve 5050%% ofof thethe LineLine ofof CreditCredit ofof EveryEveryCountryCountry forfor SMESME ExportersExportersCountryCountry forfor SMESME ExportersExporters

Problems of SME Pharma Sector Problems of SME Pharma Sector with Public Sector Banks (Contd.)with Public Sector Banks (Contd.)We want the Government to remove this policy difference with We want the Government to remove this policy difference with p yp ythe RBI and banks, so that SME the RBI and banks, so that SME PharmaPharma exports are not denied exports are not denied export credit to all developing & focus countries identified by export credit to all developing & focus countries identified by the government and can grow to the full potential of 30%the government and can grow to the full potential of 30%the government. and can grow to the full potential of 30% the government. and can grow to the full potential of 30% annually.annually.The banks have a policy of debt equity ratio of 4:1. In this the export The banks have a policy of debt equity ratio of 4:1. In this the export
fi /C /A ( ) d /A CGC dfi /C /A ( ) d /A CGC drefinance to L/C D/A (FBN) and FBP D/A ECGC covered exports are refinance to L/C D/A (FBN) and FBP D/A ECGC covered exports are included. This policy restricts exports specially of SME sector, which has included. This policy restricts exports specially of SME sector, which has low equity base. low equity base. The government should remove this inclusion of FBN, The government should remove this inclusion of FBN, FBP refinancing covered by ECGC from its exposure to boost exportsFBP refinancing covered by ECGC from its exposure to boost exportsFBP refinancing covered by ECGC from its exposure to boost exportsFBP refinancing covered by ECGC from its exposure to boost exports
The CCLS Scheme gives only 15 The CCLS Scheme gives only 15 lacslacs as maximum subsidy as maximum subsidy where as it needs minimum Rs 10 where as it needs minimum Rs 10 crorescrores today to set up a today to set up a Viable SME Viable SME PharmaPharma Unit.Unit.

Problems of SME Pharma Sector Problems of SME Pharma Sector with Public Sector Banks (Contd.)with Public Sector Banks (Contd.)The CCLS Scheme only gives Subsidy for Plant and The CCLS Scheme only gives Subsidy for Plant and y g yy g yMachinery and where as WHO GMP requires substantial Machinery and where as WHO GMP requires substantial investment in the infrastructure changes. investment in the infrastructure changes. The PSU Banks The PSU Banks should give soft Loans for Infrastructure changes @should give soft Loans for Infrastructure changes @should give soft Loans for Infrastructure changes @ should give soft Loans for Infrastructure changes @ 6%p.a. Or better give Dollar Denominated Loans at Libor 6%p.a. Or better give Dollar Denominated Loans at Libor Rates + 200 basis pointRates + 200 basis point
The credit in PCL is not available in USD and the rate of The credit in PCL is not available in USD and the rate of interest is very highinterest is very high i ei e is 8% in PCL Whereas the rates ofis 8% in PCL Whereas the rates ofinterest is very high interest is very high i.ei.e is 8% in PCL. Whereas the rates of is 8% in PCL. Whereas the rates of liborlibor is around 1%. Multinationals can avail Dollar Loans is around 1%. Multinationals can avail Dollar Loans where as SME’s are being denied on one pretext or anotherwhere as SME’s are being denied on one pretext or another

Problems of SME Pharma Sector Problems of SME Pharma Sector with Public Sector Banks (Contd.)with Public Sector Banks (Contd.)
The bank do not open back to back L/C . They want more The bank do not open back to back L/C . They want more collateral security from SME’scollateral security from SME’s
B k d d SME it ti i th i t liB k d d SME it ti i th i t liBank downgrade SME units rating in case their export supplies Bank downgrade SME units rating in case their export supplies are to African countries because they are are to African countries because they are High Risk CountriesHigh Risk Countries

IntiativeIntiative By PHARMEXCILBy PHARMEXCILIntiativeIntiative By PHARMEXCIL By PHARMEXCIL We have requested Ministry of Commerce to call for a Joint meeting We have requested Ministry of Commerce to call for a Joint meeting with RBI, Banking Secretary and PSU Bank to address the following with RBI, Banking Secretary and PSU Bank to address the following IIIssuesIssuesNo denial of export credit by PSU banks nor asking for extra No denial of export credit by PSU banks nor asking for extra collateral or delay in providing export credit.collateral or delay in providing export credit.Non Non –– inclusion of FBN and FBP D/A (export refinancing) under inclusion of FBN and FBP D/A (export refinancing) under total exposure norms and increase the Ratio from 1:4 to 1:8total exposure norms and increase the Ratio from 1:4 to 1:8Term loan to be provided @ of 6% forTerm loan to be provided @ of 6% for upgradationupgradationTerm loan to be provided @ of 6% for Term loan to be provided @ of 6% for upgradationupgradation..CCLS subsidy to be provided upfront by PSU banks as given in the CCLS subsidy to be provided upfront by PSU banks as given in the policy.policy.Line of credit of Line of credit of EximExim bank to be reserved by 50% for SME sector.bank to be reserved by 50% for SME sector.Credit in PCL to be made available in Dollar terms at Credit in PCL to be made available in Dollar terms at liborlibor rates.rates.Opening of back to back L/C to be immediately given by PSUOpening of back to back L/C to be immediately given by PSUOpening of back to back L/C to be immediately given by PSU Opening of back to back L/C to be immediately given by PSU banks.banks.No down grading of SME units if exports to African countriesNo down grading of SME units if exports to African countries..

Problem faced by SME’s Exporters Problem faced by SME’s Exporters in Customsin Customs
Problem in Customs relating to release ofProblem in Customs relating to release ofProblem in Customs relating to release of Problem in Customs relating to release of Shipping Bills EP Copy and cancellation of Shipping Bills EP Copy and cancellation of bonds after exportbonds after exportbonds after export bonds after export Cancellation of bank guarantee Cancellation of bank guarantee D l i iD l i iDelay in processing export papers Delay in processing export papers Unnecessary queries on export documents Unnecessary queries on export documents

Problem faced by Exporters in Problem faced by Exporters in DGFTDGFT
Problem relating to issuing of AdvanceProblem relating to issuing of AdvanceProblem relating to issuing of Advance Problem relating to issuing of Advance License or DEPB or Focus Market SchemeLicense or DEPB or Focus Market SchemeRedemption of Advance LicensesRedemption of Advance LicensesRedemption of Advance LicensesRedemption of Advance Licenses
Fixation of Norms Fixation of Norms -- SIONSION
Unnecessary queries or delay tactics which Unnecessary queries or delay tactics which leads to higher transaction costleads to higher transaction costleads to higher transaction cost.leads to higher transaction cost.

Initiative taken by PHARMEXCILInitiative taken by PHARMEXCILInitiative taken by PHARMEXCILInitiative taken by PHARMEXCIL
Participation in Public Grievances Committee of Participation in Public Grievances Committee of ppCustoms region wiseCustoms region wiseParticipation in Public Grievances Committee at Participation in Public Grievances Committee at
d id iDGFT and JT. DGFT offices DGFT and JT. DGFT offices Participation in Norms fixation committee at DGFT Participation in Norms fixation committee at DGFT to fix norms of SIONto fix norms of SIONto fix norms of SIONto fix norms of SIONCapacity building programs such as one in Capacity building programs such as one in Ahemdabad. Future programs in other cities to Ahemdabad. Future programs in other cities to e d b d. u u e p og s o e c es oe d b d. u u e p og s o e c es ocreate awareness in SME’s regarding their rights as create awareness in SME’s regarding their rights as well as imparting information to themwell as imparting information to them

Various benefits of Govt. Schemes Various benefits of Govt. Schemes through PHARMEXCILthrough PHARMEXCIL
MDA SchemesMDA Schemes –– refund of air fare /refund of air fare /MDA Schemes MDA Schemes refund of air fare / refund of air fare / exhibition expenses subject to maximum exhibition expenses subject to maximum ceiling region wiseceiling region wise –– Rs 1Rs 1 laclac to Rs 0 80to Rs 0 80 laclacceiling region wise ceiling region wise Rs 1 Rs 1 laclac to Rs 0.80 to Rs 0.80 laclacMAI Schemes MAI Schemes –– refund of registration refund of registration chargescharges uptoupto 50%50% uptoupto Rs 50Rs 50 lacslacs per yearper yearcharges charges uptoupto 50% 50% uptoupto Rs 50 Rs 50 lacslacs per yearper yearIncentives on printing of brochures, Incentives on printing of brochures,
k i i l h ik i i l h i llpackaging material, warehousing, packaging material, warehousing, cluster cluster managementmanagement..

THANK YOUTHANK YOUMr. Nipun JainMr. Nipun JainChairman SME Panel Chairman SME Panel PHARMEXCILPHARMEXCILMD, M/s PHARMCHEMMD, M/s PHARMCHEM,,

CTD Dossier Preparation
K. Srikantha ReddyK. Srikantha ReddySr.Manager-Regulatory Affairs
Medreich LimitedMedreich [email protected]@medreich.com
CTD Dossier PreparationCTD Dossier Preparation
• CTD (Common Technical Document) contains 5 modules
• Module 1• Module – 1 • Module – 2• Module – 3• Module – 4• Module – 5

DMFDrug Master File (DMF) is a submission to theFood and Drug Administration (FDA) that maybe used to provide confidential detailedbe used to provide confidential detailedinformation about facilities, processes, orarticles used in the manufacturing, processing,packaging and storing of one or more humanpackaging, and storing of one or more humandrugs. The information contained in the DMFmay be used to support following,
Investigational New Drug Application (IND)– Investigational New Drug Application (IND),– New Drug Application (NDA),– Abbreviated New Drug Application (ANDA),– Export Application.

ANDA:
• An Abbreviated New Drug Application (ANDA)is an application for a U.S. generic drug
l f i ti li d di tiapproval for an existing licensed medication orapproved drug.
• The ANDA contains data which when submittedto FDA's Center For drug Evaluation andResearch (CDER), Office of Generic Drugs,provides for the review and ultimate approvalp ppof a generic drug product. Once approved, anapplicant may manufacture and market thegeneric drug product to provide a safe,generic drug product to provide a safe,effective, low cost alternative to the Americanpublic.


Module – 1 (e.g. EU)
Module-1: Administrative Information and Prescribing Information 1 0 Cover Letter 1.0 Cover Letter 1.1 Comprehensive Table of Content 1.2 Application Form 1 3 P d t I f ti 1.3 Product Information 1.3.1 SPC’s, Labelling and Packaging 1.3.2 Mock-Up 1.3.3 Specimen 1.3.4 Consultation with target patient group 1 3 5 SPC’s already approved in the Member 1.3.5 SPC s already approved in the Member
states
1.3.6 Braille
Module - 1
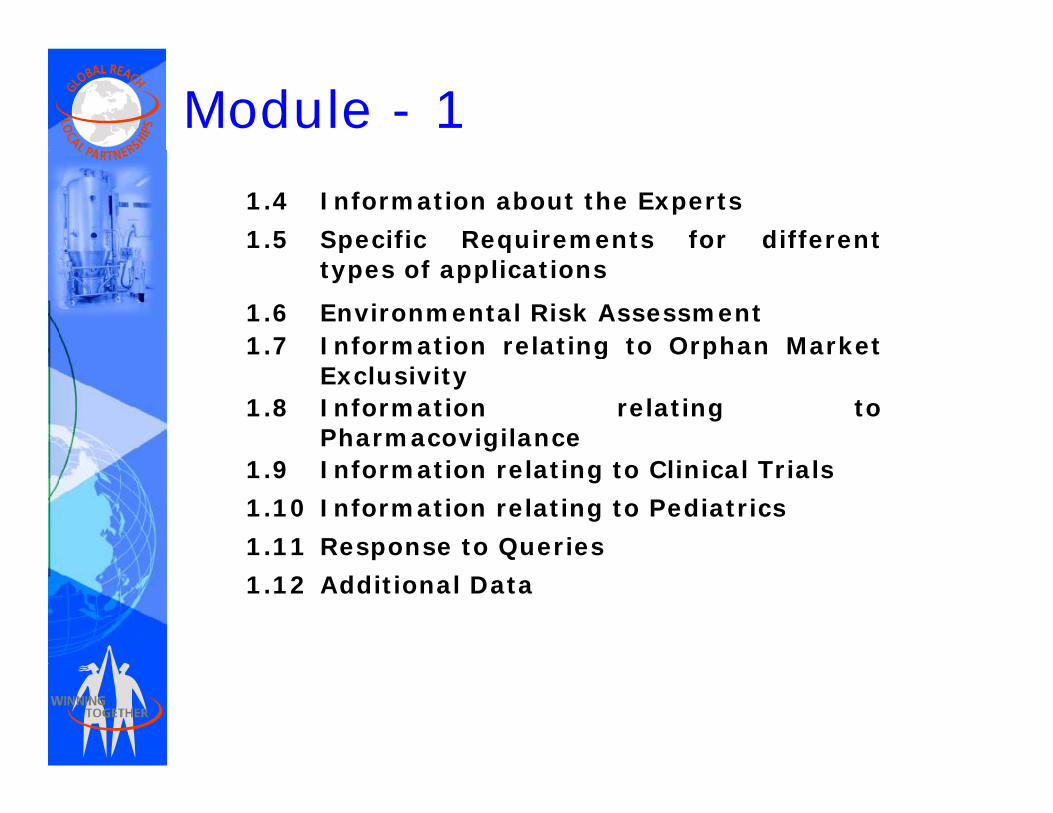
1.4 Information about the Experts
1.5 Specific Requirements for different p qtypes of applications
1.6 Environmental Risk Assessment 1.7 Information relating to Orphan Market g p
Exclusivity 1.8 Information relating to
Pharmacovigilance 1.9 Information relating to Clinical Trials
1.10 Information relating to Pediatrics
1.11 Response to Queries
1.12 Additional Data
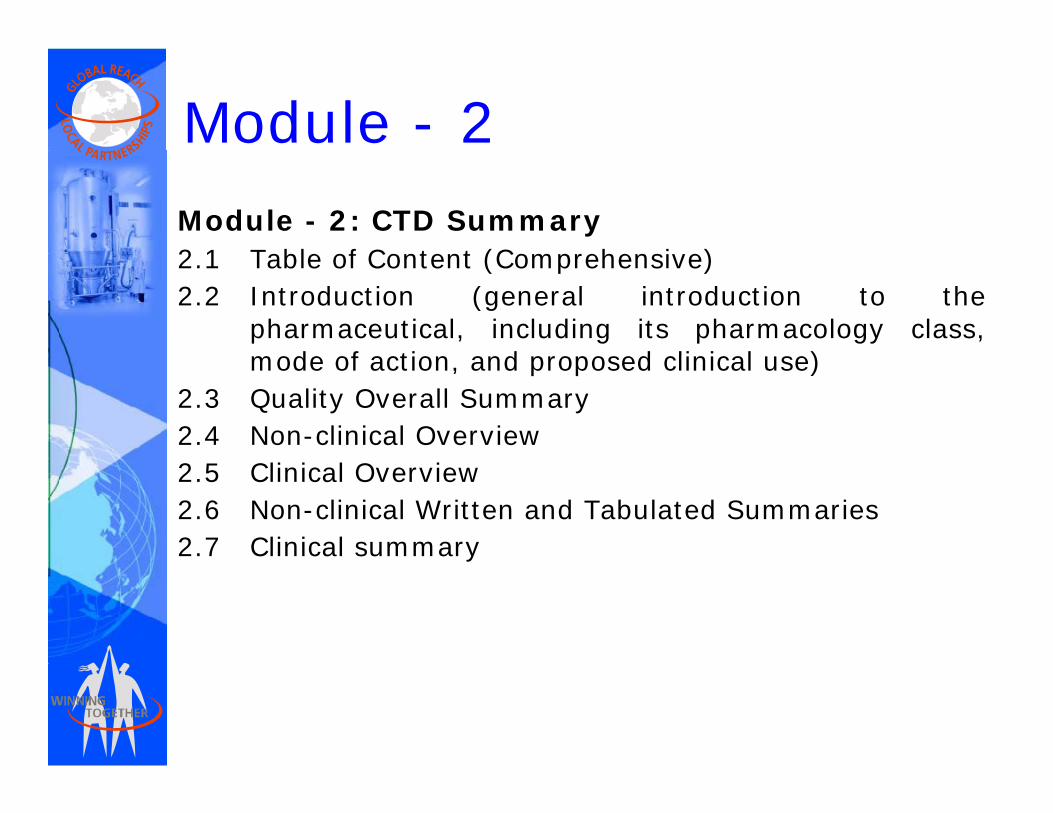
Module - 2Module - 2: CTD Summary 2 1 T bl f C t t (C h i ) 2.1 Table of Content (Comprehensive) 2.2 Introduction (general introduction to the
pharmaceutical, including its pharmacology class, d f ti d d li i l ) mode of action, and proposed clinical use)
2.3 Quality Overall Summary 2.4 Non-clinical Overview 2.5 Clinical Overview 2.6 Non-clinical Written and Tabulated Summaries 2.7 Clinical summary y

Module - 22.4 Non-clinical Overview 2.4.1 General Aspects Ge e a spects 2.4.2 Content and Structural Format 2.5 Clinical Overview 2.5.1 Product Development of Content Rationale 2.5.2 Overview of Biopharmaceutics 253 Overview of Clinical Pharmacology 2.5.3 Overview of Clinical Pharmacology 2.5.4 Overview of Efficacy 2.5.5 Overview of Safety 2.5.5 Overview of Safety 2.5.6 Benefits and Risks Conclusions 2.5.7 Literature References

Module - 22.6 Non-clinical Written and Tabulated Summaries 2.6.1 Pharmacology 2 6 2 Ph ki ti 2.6.2 Pharmacokinetics 2.6.3 Toxicology 2 7 Clinical summary 2.7 Clinical summary 2.7.1 Biopharmaceutic Studies and Associated
Analytical Methods 2.7.2 Clinical Pharmacology Studies 2.7.3 Clinical Efficacy 2 7 4 Cli i l S f t 2.7.4 Clinical Safety 2.7.5 Literature References 2 7 6 Synopses of Individual Studies 2.7.6 Synopses of Individual Studies

Module - 3
Module – 3: Quality Q y
3.1 Table of Contents 3.2 Body of Data y
3.2.S Drug Substance 3.2.S.1 General Information 3.2.S.1.1 Nomenclature 3.2.S.1.2 Structure 3 2 S 1 3 General Properties
3.2.S.1.3 General Properties

Module - 33.2.S.2 Manufacture
3.2.S.2.1 Manufacturer Details
Module 3
3.2.S.2.2 Description of Manufacturing Process and Process Controls
3 2 S 2 3 Control of Materials 3.2.S.2.3 Control of Materials 3.2.S.2.4 Controls of Critical Steps and
Intermediates 3 2 S 2 5 P V lid ti d / E l ti 3.2.S.2.5 Process Validation and /or Evaluation 3.2.S.2.6 Manufacturing Process Development
3.2.S.3 Characterisation 3.2.S.3.1 Elucidation of structure and other
Characteristics 3.2.S.3.2 Impurities 3 3 pu

Module - 3
3.2.S.4 Control of Drug Substance
Module 3
3.2.S.4.1 Specification of Drug Substance 3.2.S.4.2 Analytical Procedures 3.2.S.4.3 Validation of Analytical Procedures 3.2.S.4.3 Validation of Analytical Procedures 3.2.S.4.4 Batch Analyses 3.2.S.4.5 Justification of Specification
3 2 S 5 Reference Standards or Materials 3.2.S.5 Reference Standards or Materials 3.2.S.6 Container Closure System 3.2.S.7 Stability
3.2.S.7.1 Stability Summary and Conclusions 3.2.S.7.2 Post-approval Stability Protocol and
Stability Commitment Stability Commitment 3.2.S.7.3 Stability Data

Module - 3
3.2.PDrug Product 3.2.P.1 Description and Composition of the Drug
Product 32P 2 Ph ti l D l t 3.2.P.2 Pharmaceutical Development 3.2.P.2.1 Components of Drug Product 32P 22 Drug Product 3.2.P.2.2 Drug Product 3.2.P.2.3 Manufacturing Process
Development p 3.2.P.2.4 Container Closure System 3.2.P.2.5 Microbiological Attributes 3.2.P.2.6 Compatibility

Module - 3
3 2 P 3 M f t
Module 3
3.2.P.3 Manufacture 3.2.P.3.1 Manufacturer 3 2 P 3 2 Batch Formula 3.2.P.3.2 Batch Formula 3.2.P.3.3 Description of Manufacturing Process
and Process Controls 3.2.P.3.4 Controls of Critical Steps and
Intermediates 3 2 P 3 5 Process Validation and /or Evaluation 3.2.P.3.5 Process Validation and /or Evaluation

Module - 3
3 2 P 4 Control of Excipients
Module 3
3.2.P.4 Control of Excipients 3.2.P.4.1 Specifications 3 2 P 4 2 Analytical Procedures 3.2.P.4.2 Analytical Procedures 3.2.P.4.3 Validation of Analytical
Procedures Procedures 3.2.P.4.4 Justification of Specifications 3 2 P 4 5 Excipients of Human or Animal 3.2.P.4.5 Excipients of Human or Animal
Origin 3.2.P.4.6 Novel Excipients 3.2.P.4.6 Novel Excipients

Module - 3
3 2 P 5 C t l f D P d t
Module 3
3.2.P.5 Control of Drug Product 3.2.P.5.1 Specification of Drug Product 3 2 P 5 2 Analytical Procedures 3.2.P.5.2 Analytical Procedures 3.2.P.5.3 Validation of Analytical Procedures 3.2.P.5.4 Batch Analyses 3.2.P.5.4 Batch Analyses 3.2.P.5.5 Characterisation of Impurities 3.2.P.5.6 Justification of Specification p
3.2.P.6 Reference Standards or Materials 3.2.P.7 Container Closure System

Module - 3Module 3
3.2.P.8 Stability 3.2.P.8.1 Stability Summary and
C l i Conclusions 3.2.P.8.2 Post-approval Stability
Protocol and Stability Protocol and Stability Commitment
3 2 P 8 3 Stability Data 3.2.P.8.3 Stability Data

Module - 3
3.2.A Appendices 3.2.A.1 Facilities and Equipment 3.2.A.2 Adventitious Agents Safety Evaluation 3 2 A 3 Novel Excipients 3.2.A.3 Novel Excipients 3.2.R Regional Information/ Requirements 3.2.R.1 Process Validation and or Evaluation 3.2.R.2 Medical Device 3.2.R.3 Restricted part of DMF 3 2 R 4 M di i l d t t i i i i 3.2.R.4 Medicinal products containing or using in
the manufacturing process materials of animal and / or human origin.
3.3 List of Literature References

Module - 4
Module - 4: Non-clinical Study Reports
Module 4
y p4.1 Table of contents 4.2 Study Reports 4 2 1 Pharmacology 4.2.1 Pharmacology 4.2.1 Primary Pharmacodynamic 4.2.2 Secondary Pharmacodynamic 4 2 3 S f t h l 4.2.3 Safety pharmacology 4.2.4 Pharmacodynamic drug
interactions

Module - 4
4.2.2 Pharmacokinetics 4.2.2.1 Analytical Methods and
validation Reports 4 2 2 2 Absorption 4.2.2.2 Absorption 4.2.2.3 Distribution 4.2.2.4 Metabolism 4.2.2.5 Excretion 4.2.2.6 Pharmacokinetic Drug
Interactions 4.2.2.7 Other Pharmacokinetic studies

Module - 4
4.2.3 Toxicology 4 2 3 1 Single-dose toxicity 4.2.3.1 Single-dose toxicity 4.2.3.2 Repeat-dose toxicity 4.2.3.3 Genotoxicity y 4.2.3.4 Carcinogenicity 4.2.3.5 Reproductive and developmental
t i it toxicity 4.2.3.6 Local tolerance 4 2 3 7 Other toxicity studies 4.2.3.7 Other toxicity studies 4.3 Literature References

M d l 5 Cli i l St d R t
Module - 5 Module - 5: Clinical Study Reports
5.1 Table of Contents 5.2 Tabular Listings of All Clinical Studies 5.3 Clinical Study Reports
5.3.1.1 Bioavailability (BA) study Reports 5.3.1.2 Comparative BA and 5.3.1.2 Comparative BA and
Bioequivalence study reports 5.3.1.3 In-vitro In-vivo Correlation study
reports reports 5.3.1.4 Reports of Bioanalytical and
Analytical methods 5 3 2 1 Plasma Protein Binding Study 5.3.2.1 Plasma Protein Binding Study
Reports 5.3.2.2 Reports of Hepatic metabolism
and Drug Interaction Studies and Drug Interaction Studies 5.3.2.3 Reports of Studies Using human
Biomaterials

5 3 3 1 H lth S bj t PK d I iti l
Module - 5 5.3.3.1 Healthy Subject PK and Initial
Tolerability study reports 5.3.3.2 Patient PK and Initial Tolerability y
study reports. 5.3.3.3 Intrinsic Factor PK study reports 5 3 3 4 E t i i F t PK t d t 5.3.3.4 Extrinsic Factor PK study reports 5.3.3.5 Population PK study reports 5 3 4 1 Healthy subject PD and PK/PD 5.3.4.1 Healthy subject PD and PK/PD
study reports 5.3.4.2 Patient PD and PK/PD study
reports 5.3.5.1 Study reports of controlled clinical
studies studies

Module - 5 5.3.5.2 Study reports of Uncontrolled clinical
studies studies 5.3.5.3 Reports of Analyses of data from
more than one study 5.3.5.4 Other clinical study reports 5.3.6 Reports of Post-Marketing
E i Experience 5.3.7 Case report forms and Individual
patient listings patient listings 5.4 List of Key Literature References

eCTDeCTD(Version 3.2.2)(Version 3.2.2)06.05.201106.05.2011
K. Srikantha ReddyK. Srikantha ReddySr. ManagerSr. Manager--Regulatory AffairsRegulatory Affairs
Medreich LimitedMedreich LimitedMedreich LimitedMedreich [email protected]@medreich.com

eCTDeCTD• eCTD – electronic Common Technical Document
• The eCTD is the electronic equivalent to the CTD• The eCTD is the electronic equivalent to the CTD.
• Regulatory Perspective
• “The eCTD is defined as an interface for industry toagency transfer of regulatory information while atthe same time taking into consideration thegfacilitation of the creation, review, lifecyclemanagement and archival of the electronicsubmission ”submission.
• Common structure for Modules 2 through 5
• Agency specific requirements for Modules 1

eCTD
• Technical Perspective
• Structured set of common folders structure• Structured set of common folders structure containing PDFs and SAS files (Statistical Analysis Software) on a CD/DVD (Can also be submitted through Agency web portals)
• The eCTD backbone is an XML file (Extensible M k L ) ti th t t f thMarkup Language) representing the structure of the submission, it includes links to files and other metadata such as check sum information. The schema for the XML is very rigid.
• PDF hyperlinks

eCTD• Granularity of files submitted is small (there are no longer
issues of creating large volumes of PDFs).
• Increased potential for reusing the same submission content across agency submissions.
• The standard, and many of the modules have been agreed upon by the main worldwide agencies.
• Once a submission is sent in eCTD format all future submissions for the application should be in eCTD format.
O t it t P t 11 C li t El t i• Opportunity to use Part 11 Compliant Electronic Signatures.
• Use only file formats specified in the guidance• Use only file formats specified in the guidance

eCTD BenefitseCTD Benefits• Easy to distribute and review
• More efficient use of resources, less cost and stress to the organization
• Highly organized electronic table of contents
• Searchable
• Self-validating
• Integrated document and life-cycle management
• Cross submission integration
• Living documentLiving document
• New, replace, append & delete

How it is different to Paper/Document CTDHow it is different to Paper/Document CTD
• Overall Table of contents provided in XML (Extensible Markup Language)
• Utility files to enable technical conformance and i iviewing
• Submission Folders, XML and Utility Files are created t ti ll if CTD b ild i dautomatically if an eCTD builder is used.
• Generally high level of granularity in documents
• Structure is more precise
• Lifecycle Management of the submission is easier.

eCTD Implementation FDAeCTD Implementation - FDA
• Jan 1, 2008, eCTD became CDER’s standard for electronic submission.
• FDA has made it mandatory for all ELECTRONIC b i i b i f isubmissions to be in eCTD format since 2007-08.
However, paper copies are still accepted. Suitable waivers will have to be taken before hand.
• The number of ANDA submissions to FDA has increased from 72 in the year 2006 to 1550 in 2009

eCTD Implementation - EU (http://esubmission.emea.europa.eu/)( p p )
•Requirements on Electronic submissions (Nees (Non-eCTD electronic
submission, Version 2.0 March-2010) and eCTD) and paper documentation for New Application within MRP, DCP or National procedure –Refer CMDh/085/2008/Rev7 October 2010)
F 1 t J l 2010 th EU M1 1 4 t b d f ll•From 1st July 2010, the EU M1 v1.4 must be used for all eCTD submissions for all European procedures,
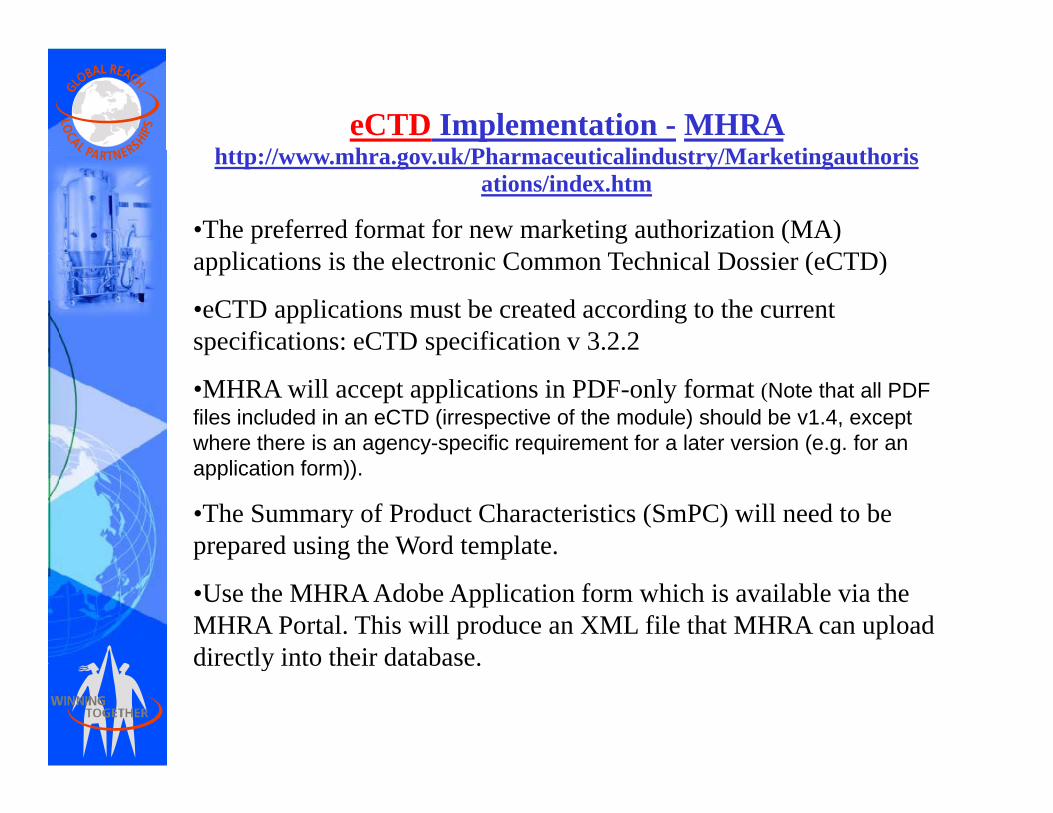
eCTD Implementation - MHRA htt // h k/Ph ti li d t /M k ti th ihttp://www.mhra.gov.uk/Pharmaceuticalindustry/Marketingauthoris
ations/index.htm
•The preferred format for new marketing authorization (MA) li i i h l i C T h i l D i ( CTD)applications is the electronic Common Technical Dossier (eCTD)
•eCTD applications must be created according to the current specifications: eCTD specification v 3.2.2
•MHRA will accept applications in PDF-only format (Note that all PDF files included in an eCTD (irrespective of the module) should be v1.4, except where there is an agency-specific requirement for a later version (e.g. for an application form)).
•The Summary of Product Characteristics (SmPC) will need to be prepared using the Word template.
•Use the MHRA Adobe Application form which is available via the MHRA Portal. This will produce an XML file that MHRA can upload directly into their databasedirectly into their database.

Regulatory Contact informationRegulatory Contact information

eCTD ModuleseCTD Modules• When making an electronic submission, each document
should be provided as a separate file.p p
• The documents, whether for a marketing application, an investigational application, or a related submission, should be organized based on the five modules in the CTD:
d l 1 i l d d i i i i f i d• Module 1 includes administrative information and prescribing information,
• Mod le 2 incl des CTD s mmar doc ments• Module 2 includes CTD summary documents,
• Module 3 includes information on quality,
• Module 4 includes the nonclinical study reports, and
• Module 5 includes the clinical study reports.

eCTD TemplateeCTD Template

eCTD Screen ShoteCTD Screen Shot

eCTD Screen Shot of Module 2eCTD Screen Shot of Module 2

eCTD Screen Shot of Module 3

eCTD Screen Shot of Module 4

eCTD Screen Shot of Module 5

eCTD Screen Shot of Module 5

eCTD Screen Shot of Module 5
eCTD Management SoftwareeCTD Management Software• eCTDXPress – Image Solutions –http://www
imagesolutions comimagesolutions.com
• MasterControl Submissions Gateway™ - Master Control http://www mastercontrol comControl, http://www.mastercontrol.com
• Liquent’s EZsubs® software solution, http://www.liquent.com/p q
• Data Farm, http://www.datafarminc.com/
• Take solution : www PharmaReady com• Take solution : www.PharmaReady.com
• Lorenz Life Sciences : www.lorenz.cc

Thank YouThank You
SRIKANTH.K