presentation half year results - iress.com
TRANSCRIPT

Half year resultsFor the six months ended 30 June 2021
presentation

Overview of Iress 3
1H 21 results summary 4
Performance review 11
Growth and outlook 22
Appendix 31
Agenda
Andrew WalshManaging Director & CEO
John HarrisChief Financial Officer
2
Highlights
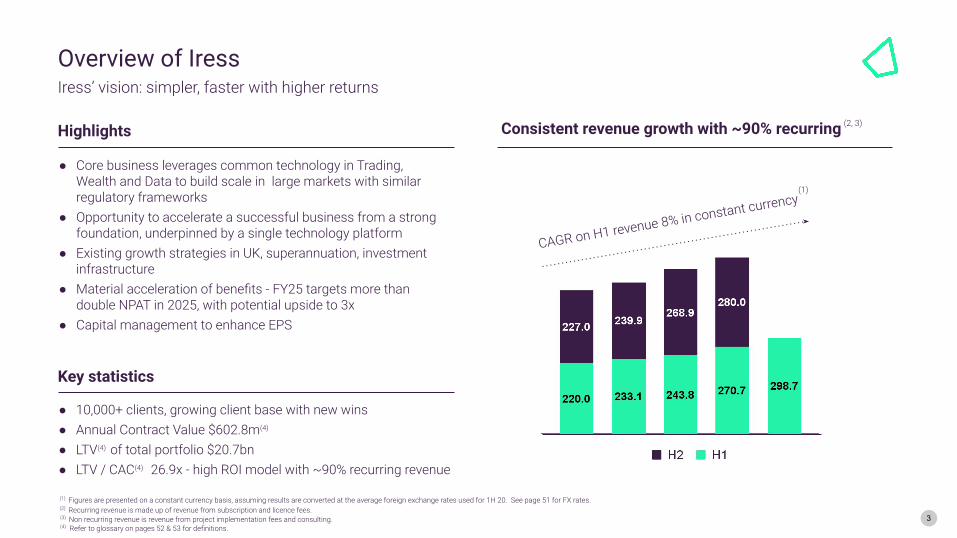
● 10,000+ clients, growing client base with new wins ● Annual Contract Value $602.8m(4) ● LTV(4) of total portfolio $20.7bn● LTV / CAC(4) 26.9x - high ROI model with ~90% recurring revenue
● Core business leverages common technology in Trading, Wealth and Data to build scale in large markets with similar regulatory frameworks
● Opportunity to accelerate a successful business from a strong foundation, underpinned by a single technology platform
● Existing growth strategies in UK, superannuation, investment infrastructure
● Material acceleration of benefits - FY25 targets more than double NPAT in 2025, with potential upside to 3x
● Capital management to enhance EPS
Overview of Iress
Key statistics
Consistent revenue growth with ~90% recurring
Iress’ vision: simpler, faster with higher returns
(1) Figures are presented on a constant currency basis, assuming results are converted at the average foreign exchange rates used for 1H 20. See page 51 for FX rates. (2) Recurring revenue is made up of revenue from subscription and licence fees. (3) Non recurring revenue is revenue from project implementation fees and consulting. (4) Refer to glossary on pages 52 & 53 for definitions.
Up 10% V pcp
CAGR on H1 revenue 8% in constant currency
(1)
3
(1)
(2, 3)
4
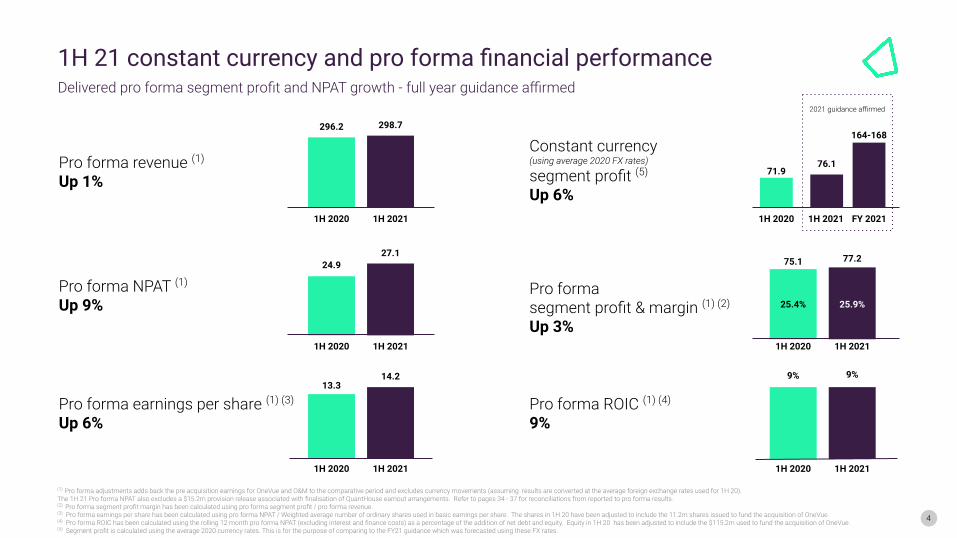
Pro forma revenue (1)
Up 1%
Pro forma NPAT (1)
Up 9%
Pro forma earnings per share (1) (3)
Up 6%Pro forma ROIC (1) (4)
9%
Pro forma segment profit & margin (1) (2)
Up 3%25.4% 25.9%
164-168Constant currency(using average 2020 FX rates)
segment profit (5) Up 6%
2021 guidance affirmed
(1) Pro forma adjustments adds back the pre acquisition earnings for OneVue and O&M to the comparative period and excludes currency movements (assuming results are converted at the average foreign exchange rates used for 1H 20).The 1H 21 Pro forma NPAT also excludes a $15.2m provision release associated with finalisation of QuantHouse earnout arrangements. Refer to pages 34 - 37 for reconciliations from reported to pro forma results.(2) Pro forma segment profit margin has been calculated using pro forma segment profit / pro forma revenue.(3) Pro forma earnings per share has been calculated using pro forma NPAT / Weighted average number of ordinary shares used in basic earnings per share. The shares in 1H 20 have been adjusted to include the 11.2m shares issued to fund the acquisition of OneVue.(4) Pro forma ROIC has been calculated using the rolling 12 month pro forma NPAT (excluding interest and finance costs) as a percentage of the addition of net debt and equity. Equity in 1H 20 has been adjusted to include the $115.2m used to fund the acquisition of OneVue.(5) Segment profit is calculated using the average 2020 currency rates. This is for the purpose of comparing to the FY21 guidance which was forecasted using these FX rates.
1H 2020 1H 2021
1H 2020 1H 2021
1H 2020 1H 2021
296.2 298.7
24.927.1
13.314.2
71.9
1H 2021 FY 20211H 2020
75.1 77.2
1H 2020 1H 2021
1H 2020 1H 2021
9% 9%
76.1
1H 21 constant currency and pro forma financial performanceDelivered pro forma segment profit and NPAT growth - full year guidance affirmed
5
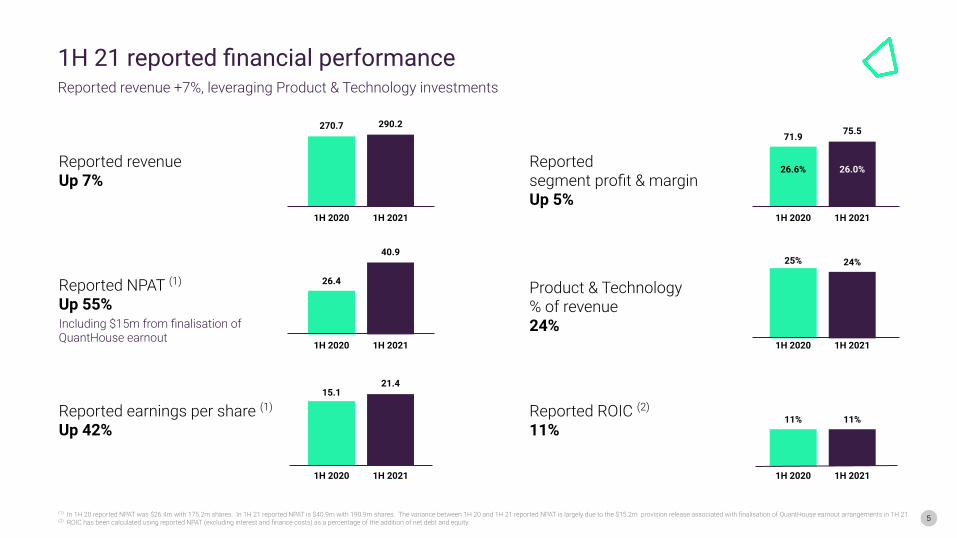
Reported revenueUp 7%
Reported NPAT (1)
Up 55%Including $15m from finalisation of QuantHouse earnout
Reported earnings per share (1)
Up 42%Reported ROIC (2)
11%
Product & Technology% of revenue24%
1H 2020 1H 2021
1H 2020 1H 2021
1H 2020 1H 2021
270.7 290.2
26.4
40.9
15.121.4
25% 24%
1H 2020 1H 2021
1H 2020 1H 2021
11% 11%
(1) In 1H 20 reported NPAT was $26.4m with 175.2m shares. In 1H 21 reported NPAT is $40.9m with 190.9m shares. The variance between 1H 20 and 1H 21 reported NPAT is largely due to the $15.2m provision release associated with finalisation of QuantHouse earnout arrangements in 1H 21. (2) ROIC has been calculated using reported NPAT (excluding interest and finance costs) as a percentage of the addition of net debt and equity.
Reported segment profit & marginUp 5%
1H 2020 1H 2021
71.9 75.5
26.6% 26.0%
1H 21 reported financial performanceReported revenue +7%, leveraging Product & Technology investments

6
In constant currency, pro forma segment profit up 3% v 1H 20.NPAT up 9%, EPS up 6%, ROIC 9%.
Interim dividend of 16c franked to 80%. (1)
Delivered
Strong revenue growth up 10% v 1H 20 in constant currency - largely driven by full period impact of OneVue, Mortgages up 23%, ANZ Trading up 5% v 1H 20.
Growth
UK margins have increased v 1H 20; Super client Guild and two Mortgage clients went live, successful implementation and go live of Australian private wealth management client.
Progress
COVID-19 recovery varies from location to location. Projects progressing and pipelines remain strong.
Impact
OneVue integration is meeting all milestones, commercial launch in 2H. Funds registry FUA is $872bn,up 74% (1 July 2020 to 30 June 2021).
Integration
Positive outlook with growth accelerating in 2H 21. FY 21 guidance affirmed - segment profit growth, in constant currency of 7-10% vs PcP and a ROIC between 10% and 11%. FY25 targets more than 2x NPAT.
Future
1H 21 results summary
(1) Reflecting final determination of the dividend by the Iress Board. A franking rate of 80% is not expected to materially impact the additional value that certain Iress shareholders may receive in connection with EQT’s scheme proposal (if it proceeds) compared to approximately 83% franking as described in Iress’ 29 July 2021 ASX announcement. Eligible Iress shareholders who are able to utilise the full benefit of available franking credits will receive a total implied value of approximately A$15.96 per share including the franked FY21 interim dividend. As always, the ability of shareholders to use the full benefit of available franking credits will depend on their individual tax circumstances.

7
Targets exceed consensus revenue based on modest market share gains.
Shift to single technology platform to drive operating leverage and higher returns with $15m p.a. of pre tax investment spend assumed in both FY22 & FY23 ($30m in total). Targeting
Segment profit margin expands to 30%+ in FY25 ~67c EPS in FY25 (up from 32.3c in 2020)(1)
300+ cps cumulative potential dividend payments (from FY20 to FY25)~18%+ ROIC in FY25 (9% in FY20).
Surplus proceeds of potential MSO sale proposed to be distributed in 2022.(1)
1.4x debt leverage in FY25 remains conservative with $130m-$160m extra debt headroom to meet neutral 2x.
Targeting more than double NPAT in 2025, with potential upside to 3x.
$1.4bnSuper
$3bnInvestment
Infrastructure
$700m+UK Wealth
(1) FY25 EPS target of 67 cents assumes surplus proceeds are returned and post buyback. Surplus proceeds refers to funds remaining from a potential sale less transaction-related costs.(2) All statements in relation to addressable revenue pool and addressable markets in this presentation are based on Iress management estimates and in AUD$, unless otherwise statedNote: The material assumptions on which the targets on this slide (and in the presentation generally) are predicated, are set out on the subsequent slides and as announced at Iress investor strategy day on 29 July 2021.
New medium term target
Total addressable markets(2)
7

8
Today
Product strength is primarily based on the individual capability of
each product.
Target future state
Integration and connectivity are inherent in our software, data
solutions and insights.
Hybrid of manual and automated onboarding. Streamlined
implementation of large clients.
85% of Xplan clients and 90% of CommPay clients receive
automatic updates and upgrades without need for client handling.
Data management and business intelligence within select products
but not platform-based.
The IP and functionality in each product can be easily leveraged by
Iress and accessed by clients across multiple offers.
The capabilities are available as a single experience through
commercialised, productised and unified APIs.
Simple sign-ups, implementation partnerships, continued
streamlined implementation of large clients.
All clients receive automatic and ongoing upgrades.
Built-in capability for data-rich insights, monitoring, security.
Accelerating the benefits from a changing operating model
8
9
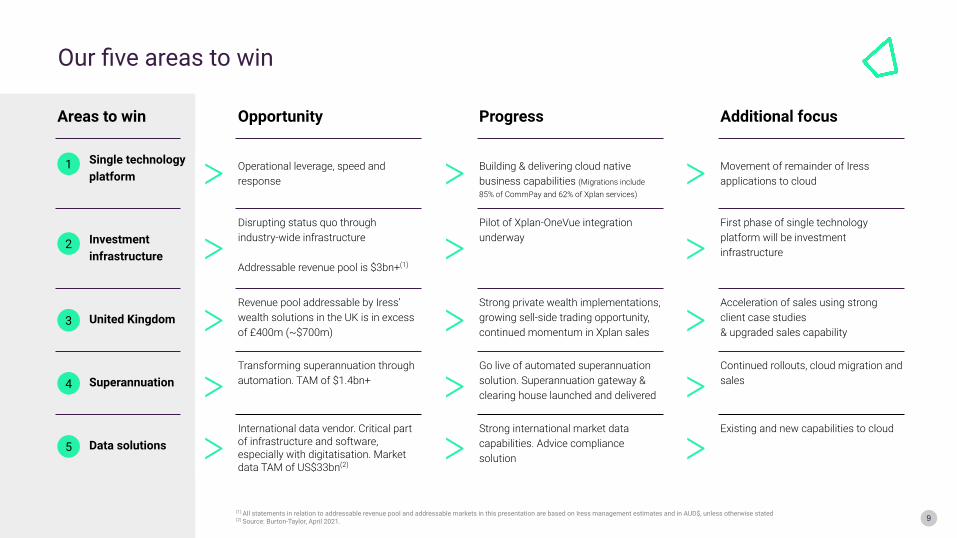
International data vendor. Critical part of infrastructure and software, especially with digitatisation. Market data TAM of US$33bn(2)
Strong international market data capabilities. Advice compliance solution
Existing and new capabilities to cloud
Transforming superannuation through automation. TAM of $1.4bn+
Go live of automated superannuation solution. Superannuation gateway & clearing house launched and delivered
Continued rollouts, cloud migration and sales
Revenue pool addressable by Iress’ wealth solutions in the UK is in excess of £400m (~$700m)
Strong private wealth implementations, growing sell-side trading opportunity, continued momentum in Xplan sales
Acceleration of sales using strong client case studies& upgraded sales capability
Areas to win
Single technologyplatform
Investmentinfrastructure
United Kingdom
Superannuation
Data solutions
Opportunity
Operational leverage, speed and response
Disrupting status quo through industry-wide infrastructure
Addressable revenue pool is $3bn+(1)
Progress
Building & delivering cloud native business capabilities (Migrations include85% of CommPay and 62% of Xplan services)
Pilot of Xplan-OneVue integration underway
Additional focus
Movement of remainder of Iress applications to cloud
First phase of single technology platform will be investment infrastructure
1
2
3
4
5
(1) All statements in relation to addressable revenue pool and addressable markets in this presentation are based on Iress management estimates and in AUD$, unless otherwise stated(2) Source: Burton-Taylor, April 2021.
Our five areas to win

10
FY20Actuals
FY25 basecase targets
Target growth v FY20
FY25 potential upside growth
Potential upside growth v FY20
Revenue (AUD$m) $542.6m $766m - $806m 7-8% pa $870m - $910m ~10%-11% pa
Segment profit inconstant currency (AUD$m) $152.9m $240m - $250m 9-10% pa $320m - $330m 16%-17% pa
NPAT (AUD$m) $59.1m ~$120m 15% pa ~$180m ~25% pa
EPS (cents) 32.3 cents ~67 cents ~+35 cents ~99 cents ~+67 cents
ROIC (%) 9% ~18% +900bps ~27% +1800bps
Buyback announced at the Iress investor strategy day on 29 July 2021, for up to $100m through on-market share buyback over the next 12 months. In addition, surplus from potential MSO sale proposed to be distributed early 2022.FY22 and FY23 forecasts assume $15m p.a. of pre tax investment spend (i.e. $30m in total) to accelerate product growth. Funded from cash flow with 3 year payback. Share-based payments - shares bought on market to avoid dilution. Note: The material assumptions on which the targets on this slide (and in the presentation generally) are predicated, are set out on the previous slides.
Accelerating growth with capital management, enhancing earnings

Performance review

2012 2013 2014 2015 2016 2017 2018 2019 2020
Avelo FSHoldingsin the UK
Proquote and Pulse Software Systems
in the UK
Innergiin Australia
Financial Synergyin Australia
INET inSouth Africa
QuantHouse OneVue& O&M
OrganicCAGR = 5%
(incl. Trading & Market Data and Financial
Advice)
Total RevenueCAGR = 13%
Growth +$345m (1)
Australia Trading and Wealth +$74m Acquired businesses +$271m
(1) Figures are presented on a constant currency basis, assuming results are converted at the average foreign exchange rates used for 1H 20
162.6
42.9205.5
170.0
83.7253.7
180.3
153.2
333.4
189.9
162.6
351.6
196.7
397.0
200.3
238.7
446.9
208.2
257.5
472.9
215.4
287.5
512.7
225.1
314.2
550.4
236.2
Historic revenue growth, 13% CAGR with organic growth and acquisitions
12
Includes Trading & Market Data and Financial AdviceIncludes UK, Mortgages, Asia, South Africa, Canada, QuantHouse, BCG, O&M and OneVue
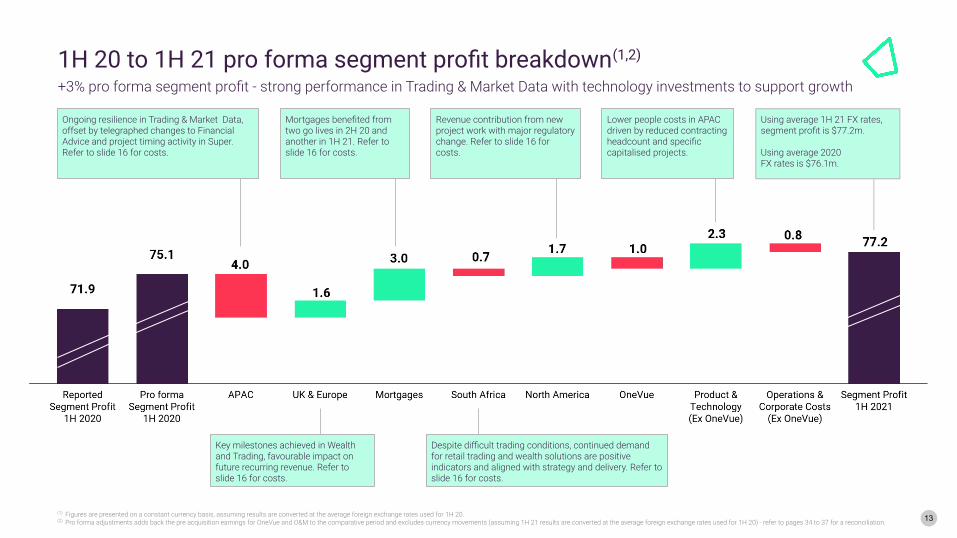
1H 20 to 1H 21 pro forma segment profit breakdown(1,2)
+3% pro forma segment profit - strong performance in Trading & Market Data with technology investments to support growth
(1) Figures are presented on a constant currency basis, assuming results are converted at the average foreign exchange rates used for 1H 20.(2) Pro forma adjustments adds back the pre acquisition earnings for OneVue and O&M to the comparative period and excludes currency movements (assuming 1H 21 results are converted at the average foreign exchange rates used for 1H 20) - refer to pages 34 to 37 for a reconciliation.
Key milestones achieved in Wealth and Trading, favourable impact on future recurring revenue. Refer to slide 16 for costs.
Despite difficult trading conditions, continued demand for retail trading and wealth solutions are positive indicators and aligned with strategy and delivery. Refer to slide 16 for costs.
Ongoing resilience in Trading & Market Data, offset by telegraphed changes to Financial Advice and project timing activity in Super. Refer to slide 16 for costs.
Mortgages benefited from two go lives in 2H 20 and another in 1H 21. Refer to slide 16 for costs.
Revenue contribution from new project work with major regulatory change. Refer to slide 16 for costs.
Lower people costs in APAC driven by reduced contracting headcount and specific capitalised projects.
Using average 1H 21 FX rates, segment profit is $77.2m.
Using average 2020FX rates is $76.1m.
13

2H 20 to 1H 21 pro forma segment profit breakdown(1,2)
Excluding annual leave, segment profit growing vs 2H 20 with Trading & Market Data, North America and OneVue contributing
(1) Figures are presented on a constant currency basis, assuming results are converted at the average foreign exchange rates used for 1H 20.(2) Pro forma adjustments adds back the pre acquisition earnings for OneVue and O&M to the comparative period and excludes currency movements (assuming 1H 21 results are converted at the average foreign exchange rates used for 1H 20) - refer to pages 34 to 37 for reconciliations.
Expected revenue adjustments in Financial Advice and the timing of elevated project activity in Super in 2H 20. Refer to slide 17 for costs.
Decrease reflects higher level of project work in 2H 20. Business continues to increase recurring revenue as new clients won and go live. Refer to slide 17 for costs.
Reflects regulatory project work, go-live of a retail trading system to a Tier 1 bank in 2H 20. Refer to slide 17 for costs.
Impacted by movements in annual leave expense ($4m AL expense in 1H 21 compared to $4m credit in 2H 20).
Investment Infrastructure is progressing. Margins to grow as integration progresses.
Key milestones achieved in Wealth and Trading. Higher project work undertaken in 2H 20. Refer to slide 17 for costs.
Using average 1H 21 FX rates, segment profit is $77.2m.
Using average 2020 FX rates is $76.1m.
14

Strong revenue performance in APAC driven by Trading & Market Data growth and positive contribution from OneVue.
Mortgages revenue impacted by COVID-19 delays which commenced 1H 20 and continued into early 2H 20. This is reflected in growth 1H 21 vs 2H 20.
Canada growth contributed by additional project work due to a regulatory requirement and go-live of the retail trading system to a Tier 1 bank in 2H 20.
Financial advice impacted by the change insize of a number of enterprise clients. Xplan user numbers remain high and steady despite topology of the market and registered adviser numbers.
Segment performance - constant currency(1,2)
Key notes
(1) Figures are presented on a constant currency basis, assuming results are converted at the average foreign exchange rates used for 1H 20..
Segment (AUD$m) 1H 20 2H 20 1H 21 1H 21/1H 20 1H 21/2H 20
Revenue Constant Currency
APAC 142.3 147.9 165.3 16% 12%
UK & Europe 79.1 79.9 80.9 2% 1%
Mortgages 11.8 16.1 14.6 23% (9%)
South Africa 22.8 21.7 21.9 (4%) 1%
North America 14.7 14.4 16.1 10% 12%
Total Revenue 270.7 280.0 298.7 10% 7%
Direct Contribution
APAC 102.1 102.0 116.2 14% 14%
UK & Europe 47.1 50.2 49.2 5% (2%)
Mortgages 7.0 11.8 9.9 42% (16%)
South Africa 18.1 17.1 17.4 (4%) 1%
North America 5.6 5.7 7.3 31% 29%
Total Direct Contribution 179.9 186.8 200.1 11% 7%
Functional Segments
Product & Technology (68.1) (62.1) (70.3) 3% 13%
Operations (22.0) (21.3) (30.5) 39% 43%
Corporate (17.9) (20.0) (22.1) 23% 10%
Segment Profit 71.9 83.4 77.2 7% (7%)
Product & Technology costs % of revenue
15
flat
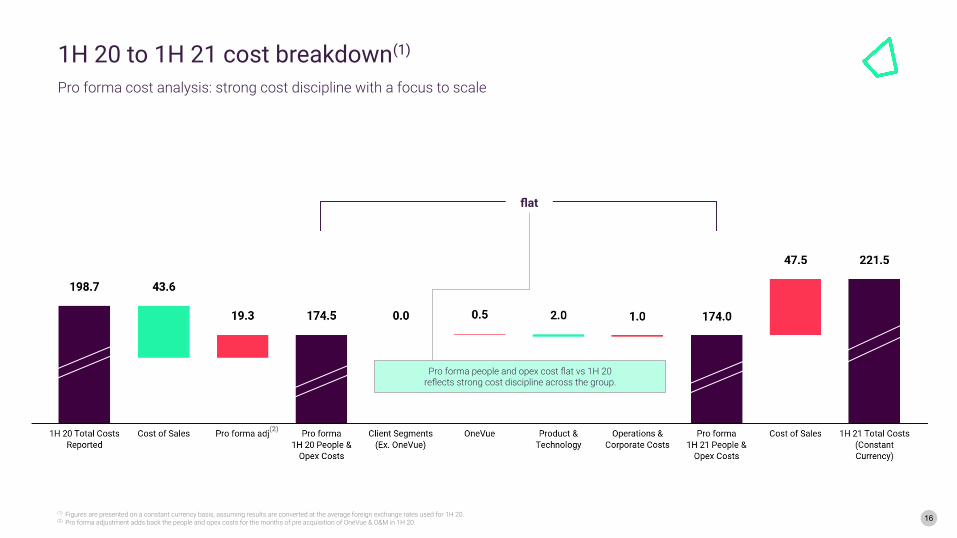
(1) Figures are presented on a constant currency basis, assuming results are converted at the average foreign exchange rates used for 1H 20.(2) Pro forma adjustment adds back the people and opex costs for the months of pre acquisition of OneVue & O&M in 1H 20.
(2)
1H 20 to 1H 21 cost breakdown(1)
Pro forma cost analysis: strong cost discipline with a focus to scale
Pro forma people and opex cost flat vs 1H 20reflects strong cost discipline across the group.
16

+ 5%(excl.
Annual leave flat)
(1) Figures are presented on a constant currency basis, assuming results are converted at the average foreign exchange rates used for 1H 20.(2) Pro forma adjustment adds back the people and opex costs for the months of pre acquisition of OneVue in 2H 20.(3) Annual leave is impacted by a $4m annual leave expense in 1H 21 compared to a $4m credit in 2H 20.
Pro forma people and opex costs excluding annual leave areflat vs 2H 20 reflecting strong cost discipline across the group.
2H 20 to 1H 21 cost breakdown(1)
Pro forma cost analysis: investment across group with a focus to scale
Reflects timing of when leave is taken which was significantly weighted towards the second half in 2020, a profile which is
expected to be repeated in 2021.(3)
17
(2)
(1) Figures are presented on a constant currency basis, assuming results are converted at the average foreign exchange rates used for 1H 20.(2) Pro forma adjustment excludes currency movements, removes $15.2m provision release associated with finalisation of QuantHouse earnout arrangements in 1H 21, and adds back the pre acquisition for OneVue and O&M trading in 2020. Refer to pages 34 to 37 for a reconciliation.(3) Annual leave is impacted by a $4m annual leave expense in 1H 21 compared to a $4m credit in 2H 20.
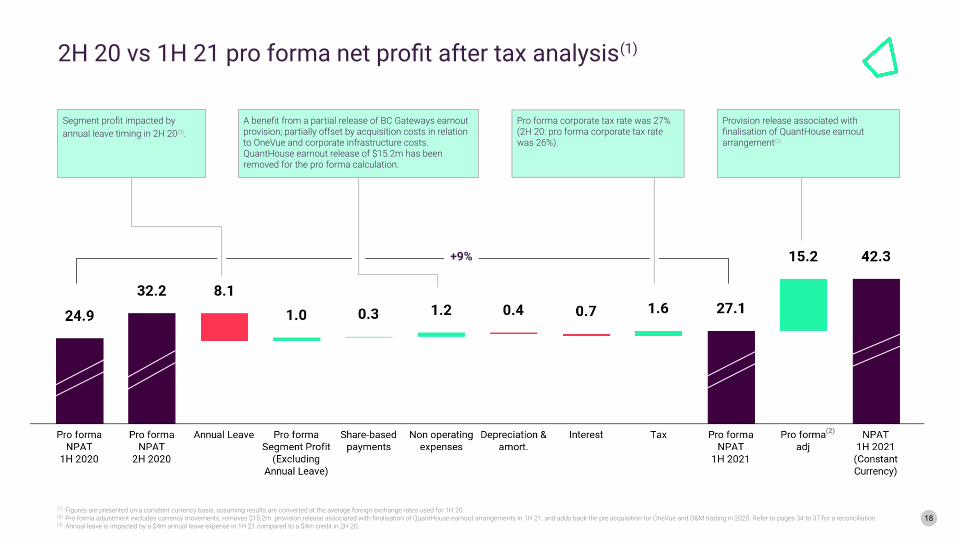
A benefit from a partial release of BC Gateways earnout provision; partially offset by acquisition costs in relation to OneVue and corporate infrastructure costs. QuantHouse earnout release of $15.2m has been removed for the pro forma calculation.
+9%
Segment profit impacted by annual leave timing in 2H 20(3).
2H 20 vs 1H 21 pro forma net profit after tax analysis(1)
Provision release associated with finalisation of QuantHouse earnout arrangement(2)
Pro forma corporate tax rate was 27%(2H 20: pro forma corporate tax rate was 26%).
18
(2)

(1) Figures are presented on a constant currency basis, assuming results are converted at the average foreign exchange rates used for 1H 20.(2) Pro forma adjustment excludes currency movements, removes $15.2m provision release associated with finalisation of QuantHouse earnout arrangements in 1H 21, and adds back the pre acquisition for OneVue and O&M trading in 2020. Refer to pages 34 to 37 for a reconciliation.
1H 20 vs 1H 21 pro forma net profit after tax analysis(1)
9% pro forma NPAT growth vs 1H 20
+9%
Provision release associated with finalisation of QuantHouse earnout arrangements.(2)
Pro forma corporate tax rate was 27%(1H 20: pro forma tax rate was 27%)
19

1H 19 2H 19 1H 20 2H 20 1H 21
Segment profit (constant currency) 74.1 78.0 71.8 83.4 77.2
NPAT (constant currency) 30.4 34.6 26.2 34.6 42.3
Add back:
Share-based payments 8.2 9.5 10.4 10.6 10.3
Non-operating items 2.0 (1.0) 1.8 3.6 (12.1)
D&A - Acquisition related 6.0 7.2 7.3 7.2 8.5
Tax expense/(benefit) (4.4) (4.1) (4.9) (5.1) (1.3)
NPAT adjusted (constant currency) 42.2 46.2 40.8 50.9 47.7
Weighted avg. shares (millions) 171.5 171.5 175.2 183.0 190.9
EPS adjusted constant currency (cents) 24.6 26.9 23.3 27.8 25.0
EPS reported (cents)(1) 17.7 20.2 15.0 17.3 21.4
NPAT has been adjusted for share-based payments, non-operating items, and acquisition-related depreciation & amortisation.
1H 21 Adjusted NPAT has increased 17% since 1H 20 to $47.7m.
Equity capital raises in 2020 (OneVue, balance sheet management) have increased shares on issue and impacted reported EPS.
Adjusted EPS (constant currency) (AUD$m)
EPS adjusted in constant currency
(1) Reported EPS as disclosed in the annual report using actual FX rates.(2) Annual leave 2H 20 credit of $4.0m and 1H 21 is $4.0m, variance of $8m post tax effect added back to the NPAT adjusted to get $54.1m
Key assumptions
Normalising for annual leave on a comparable basis to 2H 20 NPAT adjusted would be $54.1m and EPS would be 28.3cps.(2)
Adjusted earnings per share in constant currency: +7.3% growth vs pcp
20
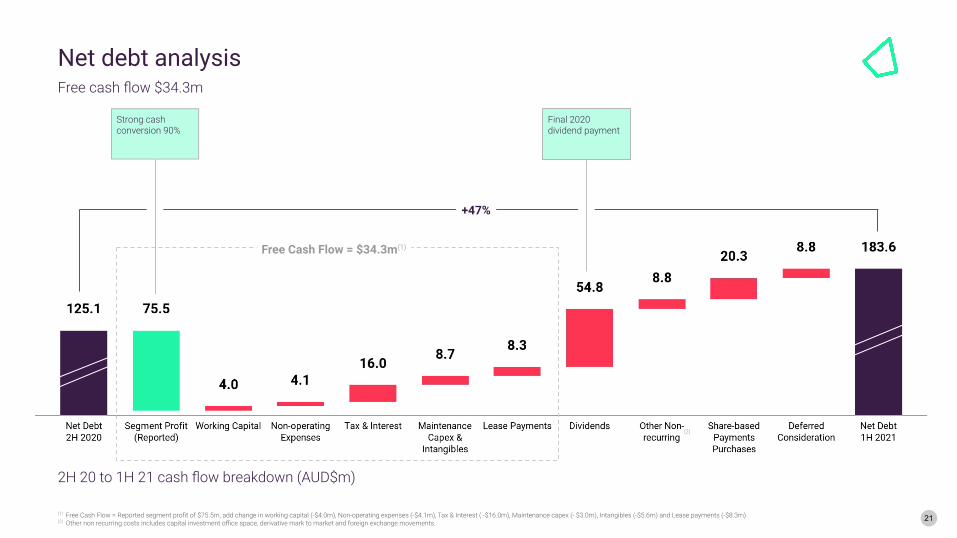
(1) Free Cash Flow = Reported segment profit of $75.5m, add change in working capital (-$4.0m), Non-operating expenses (-$4.1m), Tax & Interest ( -$16.0m), Maintenance capex (- $3.0m), Intangibles (-$5.6m) and Lease payments (-$8.3m) (2) Other non recurring costs includes capital investment office space, derivative mark to market and foreign exchange movements.
2H 20 to 1H 21 cash flow breakdown (AUD$m)
Free Cash Flow = $34.3m(1)
Strong cash conversion 90%
Final 2020 dividend payment
(2)
21
+47%
Net debt analysisFree cash flow $34.3m

Executing growth strategies & outlook

23
FY20 1H 21 2H 21 guidance FY21 guidance - Affirmed
Inc OneVue Total required Total
Actual Actual Low High Low High
Segment profit 153 76 88 92 164 168
Share-based payments (21) (10) (11) (11) (21) (21)
Non-operating items (6) 12 (6) (5) 6 7
Depreciation & amortisation (39) (23) (26) (24) (49) (47)
Net interest & finance costs (8) (4) (4) (4) (8) (8)
Tax (expense)/benefit (FY21 ETR 22 - 24%) (19) (10) (13) (12) (22) (22)
NPAT 59 41 29 36 70 77
ROIC 9% 11% 9% 10% 10% 11%
EPS reported (cents) 32.3 21.4 15.2 19.0 36.6 40.4
FY21 segment profit guidance affirmed: up 7-10% on pcp. ROIC expected to be in the range of 10%to 11%.
Growth in 2H 21 will include the full period impact of OneVue vs prior year, delivery in Automated Super Admin and two clients in the Mortgages business.
UK business has strongrevenue pipeline. We seegood medium-term growth opportunities.
Segment profit will benefit from annual leave timing in 2H 21.
DeliveredGuidance (constant currency) (AUD$m)(1)
Segment profit (constant currency) (AUD$m)
77.2
1H 21Segment profit
(Pro forma)
Pro formaadjustments
1H 21Segment profit
Organicgrowth
OneVue contribution
2H 21Segment profit
1.1 76.1
Growth 16-21%
+$11mto +14m
+$1mto +$2m
~$88mto $92m
(1) Figures are presented on a constant currency basis, assuming 2021 results are converted at the average foreign exchange rates used for FY20.
FY21 segment profit guidance affirmed
Organic Growth +$11m to +$14m
Growth of 16-21%
(1) Figures are presented on a constant currency basis, assuming 2021 results are converted at the average foreign exchange rates used for FY20.
~$4m~$4m
~$2m ~$2m~$4m
~$8m
~$1mto $2m
~$88mto $92m
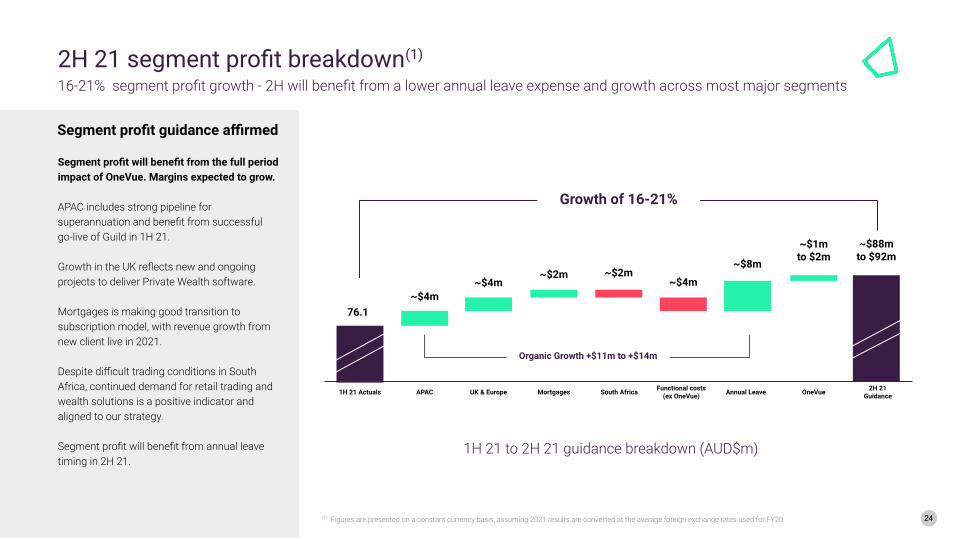
1H 21 to 2H 21 guidance breakdown (AUD$m)
Segment profit will benefit from the full period impact of OneVue. Margins expected to grow.
APAC includes strong pipeline for superannuation and benefit from successful go-live of Guild in 1H 21.
Growth in the UK reflects new and ongoing projects to deliver Private Wealth software.
Mortgages is making good transition to subscription model, with revenue growth from new client live in 2021.
Despite difficult trading conditions in South Africa, continued demand for retail trading and wealth solutions is a positive indicator and aligned to our strategy.
Segment profit will benefit from annual leave timing in 2H 21.
24
Segment profit guidance affirmed
2H 21 segment profit breakdown(1)
16-21% segment profit growth - 2H will benefit from a lower annual leave expense and growth across most major segments
1H 21 Actuals APAC UK & Europe Mortgages South Africa Functional costs(ex OneVue) Annual Leave OneVue 2H 21
Guidance
76.1

25
Capital management Potential cumulative dividends(cents per share) ex potentialMSO sale proceeds
Target leverage ratio post buyback
$100m buyback announced In addition, surplus proceeds from potential MSO sale distributed to shareholders in 2022$30m pre tax total investment (FY22-23) funded from operating cash flow
Significant potential dividend opportunity under current policy(1)
(80% of normalised NPAT; 30-40% franked)Leverage remains conservative post buyback
FY20
200
FY21 FY22 FY23 FY24 FY250
Plus distribution of potential MSO sale
proceeds
Potential dividend(2)
Buyback(1)
FY20
400
FY21 FY22 FY23 FY24 FY25
300
200
100
0
CPS
FY20 Actual
AUD$
m
FY21 FY25
Neutral net leverage = 2 x Segment profit
Capacity of additional debt
available at neutral net leverage
Range $47m to
$59m
Range$130m to
$160m
(1) Buyback announced at the Iress investor strategy day on 29 July 2021, for up to $100m through on-market share buyback over the next 12 months. In addition, surplus from potential MSO sale proposed to be distributed early 2022.(2) Dividends and distributions remain subject to no material events, assuming strategy implementation is broadly in line with management estimates, and is subject to board discretion having regard to financial and market conditions,
business needs, and maintenance of financial strength and stability in accordance with Iress' capital management framework. Sale of MSO remains subject to market conditions and availability of appropriate terms.
Capital management further enhancing earnings metrics
26
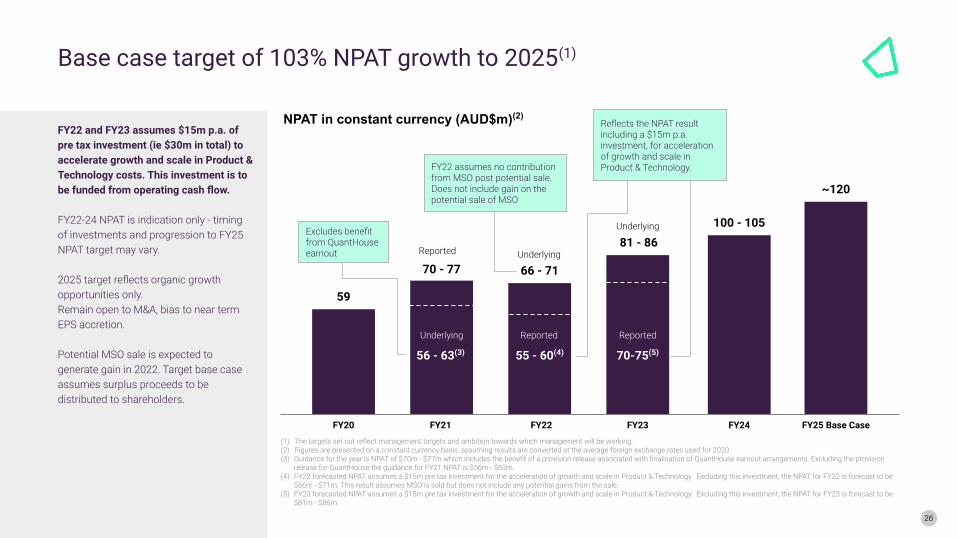
NPAT in constant currency (AUD$m)(2)
(1) The targets set out reflect management targets and ambition towards which management will be working. (2) Figures are presented on a constant currency basis, assuming results are converted at the average foreign exchange rates used for 2020.(3) Guidance for the year is NPAT of $70m - $77m which includes the benefit of a provision release associated with finalisation of QuantHouse earnout arrangements. Excluding the provision
release for QuantHouse the guidance for FY21 NPAT is $56m - $63m.(4) FY22 forecasted NPAT assumes a $15m pre tax investment for the acceleration of growth and scale in Product & Technology. Excluding this investment, the NPAT for FY22 is forecast to be
$66m - $71m. This result assumes MSO is sold but does not include any potential gains from the sale.(5) FY23 forecasted NPAT assumes a $15m pre tax investment for the acceleration of growth and scale in Product & Technology. Excluding this investment, the NPAT for FY23 is forecast to be
$81m - $86m.
FY20 FY21 FY22 FY23 FY24 FY25 Base Case
59
70 - 77 66 - 71
81 - 86100 - 105
~120
Underlying
56 - 63(3) 55 - 60(4) 70-75(5)
Reported Reported
Underlying
UnderlyingExcludes benefit from QuantHouse earnout
FY22 assumes no contribution from MSO post potential sale.Does not include gain on the potential sale of MSO
Reflects the NPAT result including a $15m p.a. investment, for accelerationof growth and scale in Product & Technology.
Reported
Base case target of 103% NPAT growth to 2025(1)
FY22 and FY23 assumes $15m p.a. of pre tax investment (ie $30m in total) to accelerate growth and scale in Product & Technology costs. This investment is to be funded from operating cash flow.
FY22-24 NPAT is indication only - timing of investments and progression to FY25 NPAT target may vary.
2025 target reflects organic growth opportunities only. Remain open to M&A, bias to near term EPS accretion.
Potential MSO sale is expected to generate gain in 2022. Target base case assumes surplus proceeds to be distributed to shareholders.

27
We see benefits being realised at a greater rate with the opportunity for acceleration in key areas.
Benefits
A single technology platform is key to unlock scale and benefits. The transition to this platform is already underway.
Technology
New medium term target of more than 2x NPAT in 2025 (Base Case) with potential upside to 3x, and EPS enhanced with capital management.
Capital management
2021 guidance affirmed
2021
We are building scale in large addressable markets with a focus on the United Kingdom, superannuation and investment infrastructure.
Growth priorities
Iress’ vision: simpler, faster with higher returns

Q & A

CloseAndrew WalshChief Executive

Thank you

Appendix
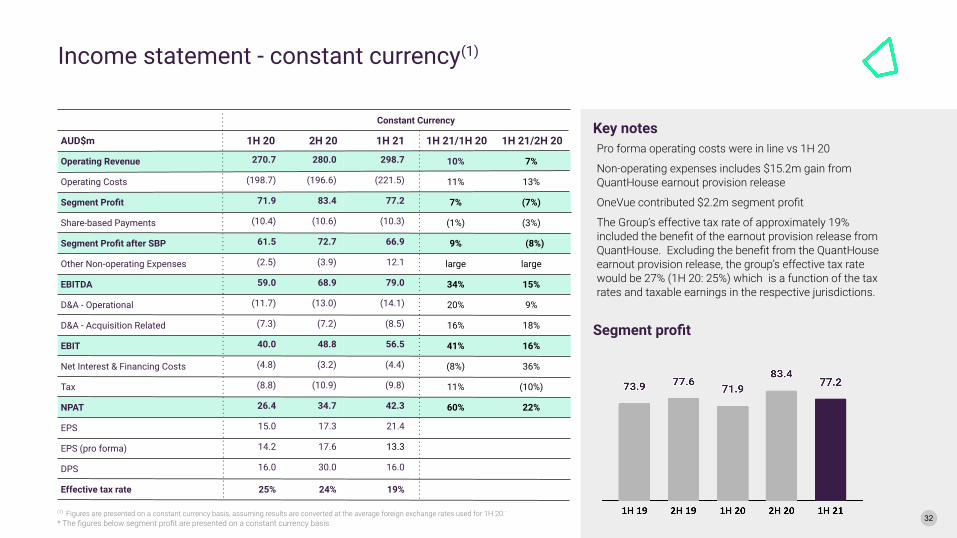
Pro forma operating costs were in line vs 1H 20
Non-operating expenses includes $15.2m gain from QuantHouse earnout provision release
OneVue contributed $2.2m segment profit
The Group’s effective tax rate of approximately 19% included the benefit of the earnout provision release from QuantHouse. Excluding the benefit from the QuantHouse earnout provision release, the group’s effective tax rate would be 27% (1H 20: 25%) which is a function of the tax rates and taxable earnings in the respective jurisdictions.
Key notesConstant Currency
AUD$m 1H 20 2H 20 1H 21 1H 21/1H 20 1H 21/2H 20
Operating Revenue 270.7 280.0 298.7 10% 7%
Operating Costs (198.7) (196.6) (221.5) 11% 13%
Segment Profit 71.9 83.4 77.2 7% (7%)
Share-based Payments (10.4) (10.6) (10.3) (1%) (3%)
Segment Profit after SBP 61.5 72.7 66.9 9% (8%)
Other Non-operating Expenses (2.5) (3.9) 12.1 large large
EBITDA 59.0 68.9 79.0 34% 15%
D&A - Operational (11.7) (13.0) (14.1) 20% 9%
D&A - Acquisition Related (7.3) (7.2) (8.5) 16% 18%
EBIT 40.0 48.8 56.5 41% 16%
Net Interest & Financing Costs (4.8) (3.2) (4.4) (8%) 36%
Tax (8.8) (10.9) (9.8) 11% (10%)
NPAT 26.4 34.7 42.3 60% 22%
EPS 15.0 17.3 21.4
EPS (pro forma) 14.2 17.6 13.3
DPS 16.0 30.0 16.0
Effective tax rate 25% 24% 19%
(1) Figures are presented on a constant currency basis, assuming results are converted at the average foreign exchange rates used for 1H 20..
* The figures below segment profit are presented on a constant currency basis
Segment profit
Income statement - constant currency(1)
32
Reported Currency
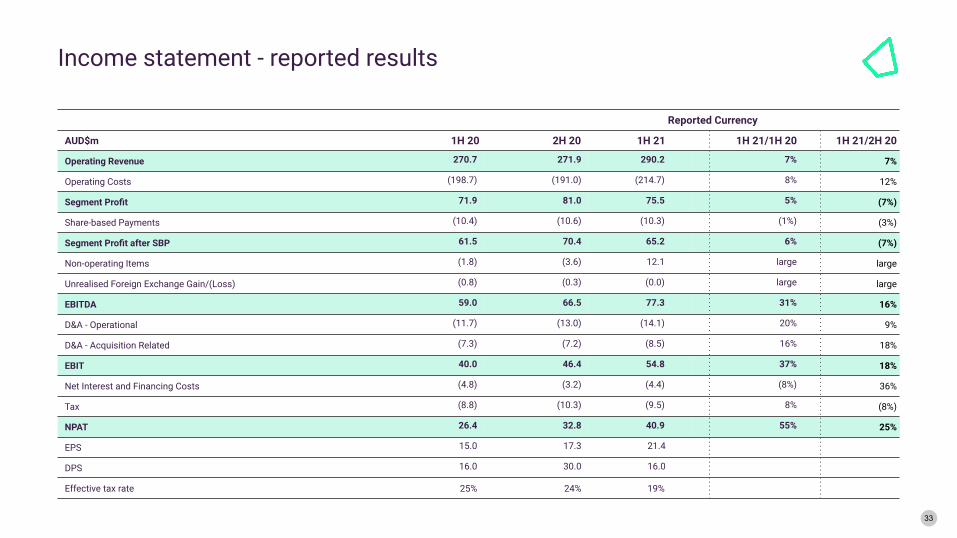
AUD$m 1H 20 2H 20 1H 21 1H 21/1H 20 1H 21/2H 20
Operating Revenue 270.7 271.9 290.2 7% 7%
Operating Costs (198.7) (191.0) (214.7) 8% 12%
Segment Profit 71.9 81.0 75.5 5% (7%)
Share-based Payments (10.4) (10.6) (10.3) (1%) (3%)
Segment Profit after SBP 61.5 70.4 65.2 6% (7%)
Non-operating Items (1.8) (3.6) 12.1 large large
Unrealised Foreign Exchange Gain/(Loss) (0.8) (0.3) (0.0) large large
EBITDA 59.0 66.5 77.3 31% 16%
D&A - Operational (11.7) (13.0) (14.1) 20% 9%
D&A - Acquisition Related (7.3) (7.2) (8.5) 16% 18%
EBIT 40.0 46.4 54.8 37% 18%
Net Interest and Financing Costs (4.8) (3.2) (4.4) (8%) 36%
Tax (8.8) (10.3) (9.5) 8% (8%)
NPAT 26.4 32.8 40.9 55% 25%
EPS 15.0 17.3 21.4
DPS 16.0 30.0 16.0
Effective tax rate 25% 24% 19%
33
Income statement - reported results
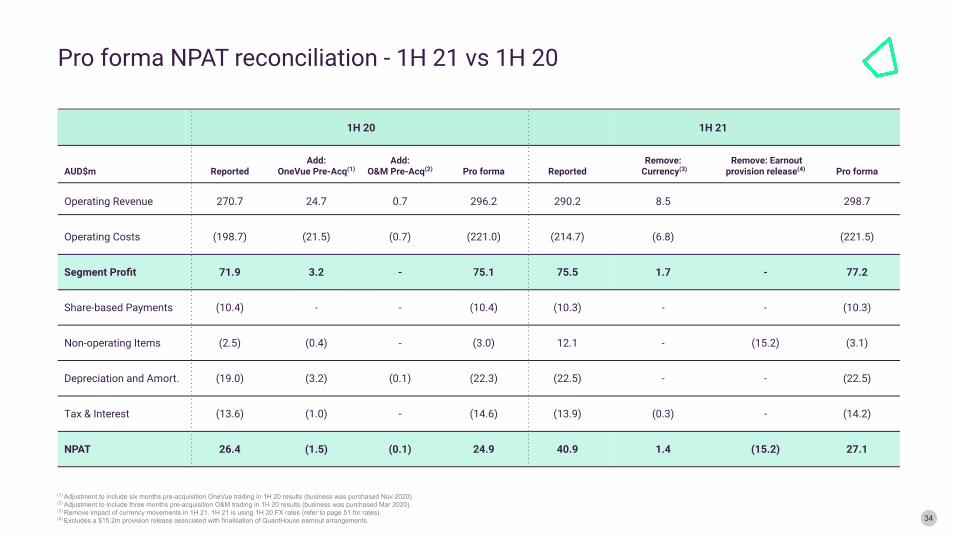
34
1H 20 1H 21
AUD$m ReportedAdd:
OneVue Pre-Acq(1)Add:
O&M Pre-Acq(2) Pro forma ReportedRemove:
Currency(3) Remove: Earnout
provision release(4) Pro forma
Operating Revenue 270.7 24.7 0.7 296.2 290.2 8.5 298.7
Operating Costs (198.7) (21.5) (0.7) (221.0) (214.7) (6.8) (221.5)
Segment Profit 71.9 3.2 - 75.1 75.5 1.7 - 77.2
Share-based Payments (10.4) - - (10.4) (10.3) - - (10.3)
Non-operating Items (2.5) (0.4) - (3.0) 12.1 - (15.2) (3.1)
Depreciation and Amort. (19.0) (3.2) (0.1) (22.3) (22.5) - - (22.5)
Tax & Interest (13.6) (1.0) - (14.6) (13.9) (0.3) - (14.2)
NPAT 26.4 (1.5) (0.1) 24.9 40.9 1.4 (15.2) 27.1
(1) Adjustment to include six months pre-acquisition OneVue trading in 1H 20 results (business was purchased Nov 2020).(2) Adjustment to include three months pre-acquisition O&M trading in 1H 20 results (business was purchased Mar 2020).(3) Remove impact of currency movements in 1H 21. 1H 21 is using 1H 20 FX rates (refer to page 51 for rates).(4) Excludes a $15.2m provision release associated with finalisation of QuantHouse earnout arrangements.
Pro forma NPAT reconciliation - 1H 21 vs 1H 20

(1) Adjustment to include four months pre-acquisition OneVue trading in 2020 results (business was purchased Nov 2020).(2) Remove impact of currency movements, 2H 20 and 1H 21 are using 1H 20 FX rates (refer to page 51 for rates).(3) Excludes a $15.2m provision release associated with finalisation of QuantHouse earnout arrangements.
2H 20 1H 21
AUD$m ReportedRemove:
Currency(2) Add:
OneVue Pre-Acq(1) Pro forma Reported Remove:
Currency(2)Remove: Earnout
provision release(3) Pro forma
Operating Revenue 271.9 8.1 15.6 295.6 290.2 8.5 298.7
Operating Costs (191.0) (5.7) (14.6) (211.3) (214.7) (6.8) (221.5)
Segment Profit 81.0 2.4 1.0 84.3 75.5 1.7 - 77.2
Share-based Payments (10.6) - - (10.6) (10.3) - - (10.3)
Non-operating Items (3.9) - (0.4) (4.3) 12.1 - (15.2) (3.1)
D&A (20.1) - (2.0) (22.1) (22.5) - - (22.5)
Tax & Interest (13.6) (0.5) (1.0) (15.1) (13.9) (0.3) - (14.2)
NPAT 32.8 1.8 (2.4) 32.2 40.9 1.4 (15.2) 27.1
Growth (%)
Operating Revenue 7% 1%
Operating Costs 12% 5%
Segment Profit (7%) (8%)
NPAT 25% (16%)
35
Pro forma NPAT reconciliation - 1H 21 vs 2H 20

36
1H 20 1H 21 1H 21/1H 20
AUD$m Reported Add: OneVue Pre-Acq(1)
Add: O&M Pre-Acq(2)
Proforma Reported Remove:
Currency(3)Pro
forma Pro forma% change
APAC 102.1 18.7 120.8 116.1 0.2 116.2 (4%)
UK & Europe 47.1 0.5 47.6 46.1 3.1 49.2 3%
Mortgages 7.0 7.0 9.3 0.6 9.9 42%
South Africa 18.1 18.1 16.9 0.5 17.4 (4%)
North America 5.6 5.6 6.9 0.5 7.3 31%
Direct Contribution 179.9 18.7 0.5 199.1 195.2 4.9 200.1 -
Product & Technology (68.1) (4.1) (0.3) (72.5) (68.5) (1.8) (70.3) (3%)
Operations (22.0) (8.5) (0.2) (30.7) (29.7) (0.9) (30.5) (1%)
Corporate (17.9) (2.9) (0.1) (20.8) (21.5) (0.5) (22.1) 6%
Segment Profit 71.9 3.2 - 75.1 75.5 1.7 77.2 3%
(1) Adjustment to include six months pre-acquisition OneVue trading in 1H 20 results (business was purchased Nov 2020).(2) Adjustment to include three months pre-acquisition O&M trading in 1H 20 results (business was purchased Mar 2020).(3) Remove impact of currency movements in 1H 21. 1H 21 is using 1H 20 FX rates (refer to page 51 for rates).
Pro forma segment profit reconciliation by region - 1H 21 vs 1H 20Reported segment profit to pro forma segment profit by region

(1) Adjustment to include four months pre-acquisition OneVue trading in 2020 results (business was purchased Nov 2020).(2) Remove impact of currency movements, 2H 20 and 1H 21 are using 1H 20 FX rates (refer to page 51 for rates).
2H 20 1H 21 1H 21/2H 20
AUD$m Reported Remove: Currency(2)
Add:OneVue Pre-Acq(1)
Proforma Reported Remove:
Currency(2)Pro
forma Pro forma% change
APAC 101.9 0.1 11.6 113.6 116.1 0.2 116.2 2%
UK & Europe 47.3 2.9 50.2 46.1 3.1 49.2 (2%)
Mortgages 11.1 0.7 11.8 9.3 0.6 9.9 (16%)
South Africa 15.8 1.3 17.1 16.9 0.5 17.4 1%
North America 5.4 0.2 5.7 6.9 0.5 7.3 29%
Direct Contribution 181.5 5.3 11.6 198.4 195.2 4.9 200.1 1%
Product & Technology (60.3) (1.7) (2.8) (64.9) (68.5) (1.8) (70.3) 8%
Operations (20.6) (0.7) (5.8) (27.2) (29.7) (0.9) (30.5) 12%
Corporate Core (19.6) (0.4) (2.0) (22.0) (21.5) (0.5) (22.1) -
Segment Profit 81.0 2.4 1.0 84.3 75.5 1.7 77.2 (8%)
37
Pro forma segment profit reconciliation by region - 1H 21 vs 2H 20Reported segment profit to pro forma segment profit by region

Segment (AUD$m) 1H 20 2H 20 1H 21 1H 21/1H 20 1H 21/2H 20
Revenue Reported Reported Reported
APAC 142.3 147.5 164.6 16% 12%
UK & Europe 79.1 75.5 75.7 (4%) -
Mortgages 11.8 15.1 13.6 15% (10%)
South Africa 22.8 20.1 21.3 (6%) 6%
North America 14.7 13.7 15.0 2% 10%
Total Revenue 270.7 271.9 290.2 7% 7%
Direct Contribution
APAC 102.1 101.9 116.1 14% 14%
UK & Europe 47.2 47.3 46.1 (2%) (2%)
Mortgages 7.0 11.1 9.3 34% (16%)
South Africa 18.1 15.8 16.9 (7%) 7%
North America 5.6 5.4 6.9 23% 27%
Total Direct Contribution 179.9 181.5 195.2 9% 8%
Functional segments
Product & Technology (68.1) (60.3) (68.5) 1% 14%
Operations (22.0) (20.6) (29.7) 35% 44%
Corporate (17.9) (19.6) (21.5) 21% 10%
Segment Profit 71.9 81.0 75.5 5% (7%)
38
Segment performanceReported currency

Segment (AUD$m) 1H 20 2H 20 1H 21 1H 21/1H 20 1H 21/2H 20
Revenue
APAC 142.3 147.5 165.1 16% 12%
UK & Europe 79.1 75.5 78.6 (1%) 4%
Mortgages 11.8 15.1 14.1 19% (7%)
South Africa 22.8 20.1 21.1 (8%) 5%
North America 14.7 13.7 15.7 7% 15%
Total Revenue 270.7 271.9 294.5 9% 8%
Direct Contribution
APAC 102.1 101.9 116.2 14% 14%
UK & Europe 47.1 47.3 47.8 1% 1%
Mortgages 7.0 11.1 9.6 38% (13%)
South Africa 18.1 15.8 16.7 (8%) 5%
North America 5.6 5.4 7.1 28% 32%
Total Direct Contribution 179.9 181.5 197.4 10% 9%
Functional segments
Product & Technology (68.1) (60.3) (69.4) 2% 15%
Operations (22.0) (20.6) (30.1) 37% 46%
Corporate (17.9) (19.6) (21.8) 22% 11%
Segment Profit 71.9 81.0 76.1 6% (6%)
39
Segment performanceConstant currency using average 2020 rates
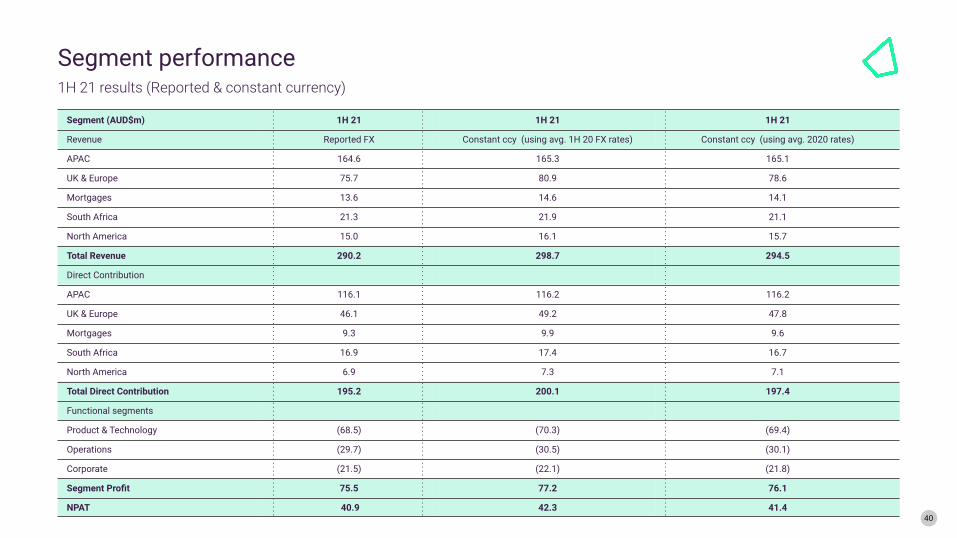
Segment (AUD$m) 1H 21 1H 21 1H 21
Revenue Reported FX Constant ccy (using avg. 1H 20 FX rates) Constant ccy (using avg. 2020 rates)
APAC 164.6 165.3 165.1
UK & Europe 75.7 80.9 78.6
Mortgages 13.6 14.6 14.1
South Africa 21.3 21.9 21.1
North America 15.0 16.1 15.7
Total Revenue 290.2 298.7 294.5
Direct Contribution
APAC 116.1 116.2 116.2
UK & Europe 46.1 49.2 47.8
Mortgages 9.3 9.9 9.6
South Africa 16.9 17.4 16.7
North America 6.9 7.3 7.1
Total Direct Contribution 195.2 200.1 197.4
Functional segments
Product & Technology (68.5) (70.3) (69.4)
Operations (29.7) (30.5) (30.1)
Corporate (21.5) (22.1) (21.8)
Segment Profit 75.5 77.2 76.1
NPAT 40.9 42.3 41.440
Segment performance1H 21 results (Reported & constant currency)

Performance is attributable to the full period impact of OneVue and revenue momentum in the Trading & Market Data business.
As expected, Financial Advice declined versus the first half of 2020 due to the timing impact of advisers migrating to independent advice firms. Xplan users remain high and growing comparatively to the decline in registered advisers. Software users are not directly correlated to registered adviser numbers.
We remain confident in medium-term growth opportunities in advice driven by ongoing demand for Xplan as advisers continue to focus on operational efficiency, data, client engagement, and compliance.
Guild Super was successfully deployed in April 2021. Deployment of our automated super administration solution to ESS Super is progressing and is expected to go live in early 2022.
Focus on commercialising SuperConnector clearing house technology post go live in May 2021.
Xplan-OneVue integration progressing well. Continuation of expansion of managed fund registry with full pipeline of fund transitions, and progress of unified quoted fund registry. Funds registry FUA is $872bn, up 74% (1 July 2020 to 30 June 2021)
Acceleration of Iress’ investment infrastructure proposition key focus for 2H 21.
Cloud to increase speed and scale of delivery, which will provide a superior offering for clients and users and enhance efficiency for Iress.
AUD$m 1H 20 2H 20 1H 21 1H 21/1H 20 1H 21/2H 20
Operating revenue
Recurring revenue 133.1 136.0 153.0 15% 12%
Non recurring revenue 9.2 11.5 11.6 25% 1%
Total operating revenue 142.3 147.5 164.6 16% 12%
Direct contribution 102.1 101.9 116.1 14% 14%
Direct contribution margin 72% 69% 70%
Direct contribution margin excluding acquisitions 73% 72% 71%
41
APACOngoing demand for financial advice software & high client retention. Super admin client delivery momentum building
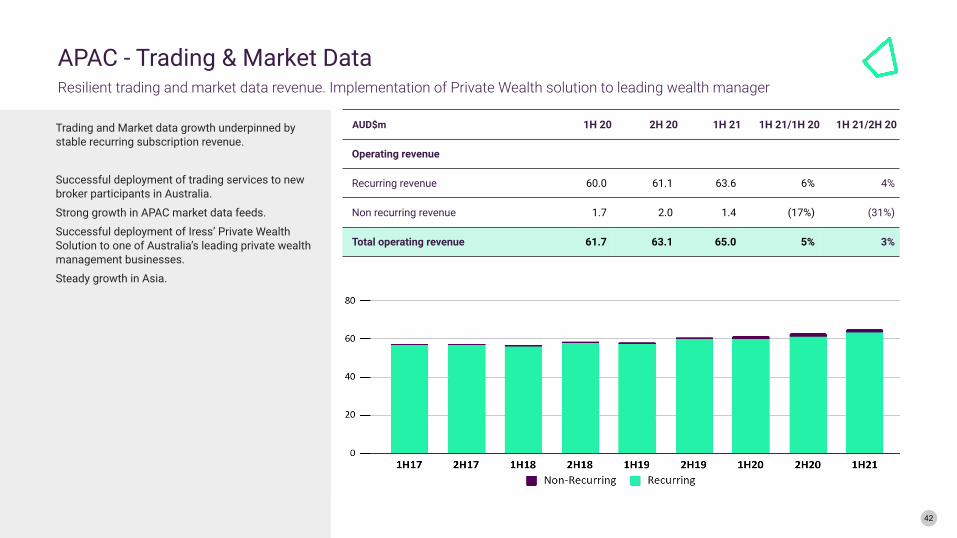
Trading and Market data growth underpinned by stable recurring subscription revenue.
Successful deployment of trading services to new broker participants in Australia.
Strong growth in APAC market data feeds.
Successful deployment of Iress’ Private Wealth Solution to one of Australia’s leading private wealth management businesses.
Steady growth in Asia.
AUD$m 1H 20 2H 20 1H 21 1H 21/1H 20 1H 21/2H 20
Operating revenue
Recurring revenue 60.0 61.1 63.6 6% 4%
Non recurring revenue 1.7 2.0 1.4 (17%) (31%)
Total operating revenue 61.7 63.1 65.0 5% 3%
42
APAC - Trading & Market DataResilient trading and market data revenue. Implementation of Private Wealth solution to leading wealth manager
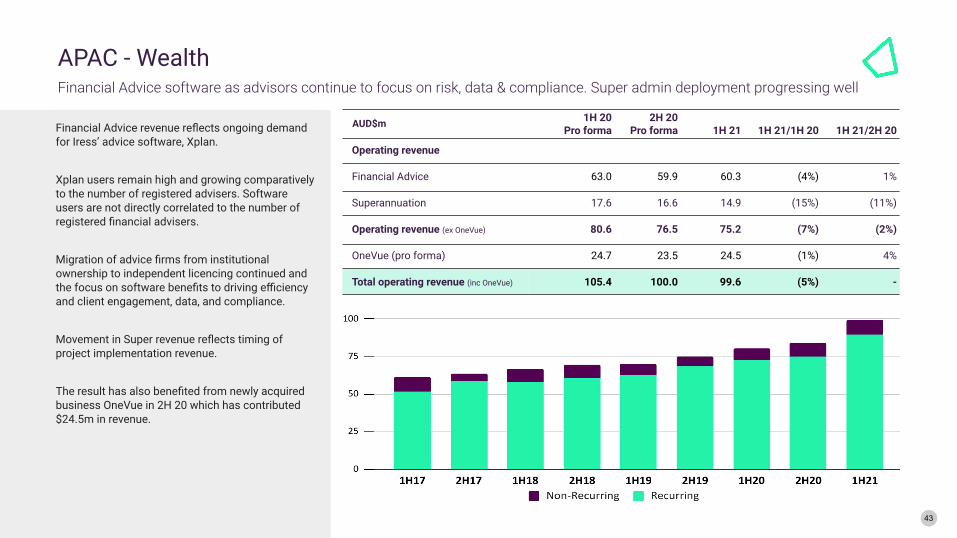
Financial Advice revenue reflects ongoing demand for Iress’ advice software, Xplan.
Xplan users remain high and growing comparatively to the number of registered advisers. Software users are not directly correlated to the number of registered financial advisers.
Migration of advice firms from institutional ownership to independent licencing continued and the focus on software benefits to driving efficiency and client engagement, data, and compliance.
Movement in Super revenue reflects timing of project implementation revenue.
The result has also benefited from newly acquired business OneVue in 2H 20 which has contributed $24.5m in revenue.
AUD$m 1H 20Pro forma
2H 20Pro forma 1H 21 1H 21/1H 20 1H 21/2H 20
Operating revenue
Financial Advice 63.0 59.9 60.3 (4%) 1%
Superannuation 17.6 16.6 14.9 (15%) (11%)
Operating revenue (ex OneVue) 80.6 76.5 75.2 (7%) (2%)
OneVue (pro forma) 24.7 23.5 24.5 (1%) 4%
Total operating revenue (inc OneVue) 105.4 100.0 99.6 (5%) -
43
APAC - WealthFinancial Advice software as advisors continue to focus on risk, data & compliance. Super admin deployment progressing well

Revenue growth reflects the contribution from O&M (acquired in 2020) as well as new and ongoing projects with clients to deliver Private Wealth software.
Significant client milestones have been achieved resulting in growth in recurring revenue (in particular in Private Wealth) offset by the timing of non-recurring activity compared to 2H 20. Milestones include the successful go-live of CommPay at an enterprise wealth manager with over 3,500 advisers.
Market making clients progressing well, with ongoing delivery in implementations and strong pipeline.
Project work at large existing Private Wealth clients continued, as did the migration of Adviser Office users to Xplan. Successful Xplan implementation at blue-chip Private Wealth client with contract in place to grow functionality and adoption.
Continuing to win new market data clients, and new products delivered to new and existing clients.
Revenue remains greater than 90% recurring.
Underlying direct contribution margin has been maintained, with half on half fluctuations due to the timing of annual leave.
GBP (m) 1H 20 2H 20 1H 21 1H 21/1H 20 1H 21/2H 20
Operating Revenue
Wealth 17.0 17.9 17.4 3% (3%)
Trading 5.7 5.7 6.0 6% 5%
Sourcing 12.2 11.5 11.7 (4%) 1%
QuantHouse Europe 6.4 6.8 7.0 10% 4%
Operating revenue 41.3 42.0 42.2 2% -
Direct contribution 24.6 26.3 25.7 5% (2%)
Direct contribution margin 60% 63% 61%
Direct contribution margin excluding acquisitions 65% 69% 66%
44
UK & EuropeStable underlying revenue. Market data feeds growing. Client delivery and ongoing demand to drive growth

Revenue growth was largely driven by the full period impact of two clients that went live in 2H 20 and another successful deployment completed in 1H 21.
An element of non-recurring revenue decline was expected in 1H 21 vs 1H 20, based on Management’s expectations of client project timing.
Mortgages continues to make good progress to grow subscription revenue with recurring revenue contributing approximately 58% in 1H 21 compared to 46% of total revenue in 1H 20.
Direct contribution margin fluctuations are driven by the timing of project revenue and annual leave.
As announced in June, the Board is considering options for the MSO business including potential divestment.
GBP (m) 1H 20 2H 20 1H 21 1H 21/1H 20 1H 21/2H 20
Operating revenue
Recurring revenue 2.9 3.8 4.4 54% 17%
Non recurring revenue 3.3 4.6 3.2 (5%) (31%)
Total Operating revenue 6.2 8.4 7.6 23% (9%)
Direct contribution 3.7 6.2 5.2 42% (16%)
Direct contribution margin 59% 74% 68%
45
MortgagesOne client live in first half. Another client already live in second half. Size of opportunity remains
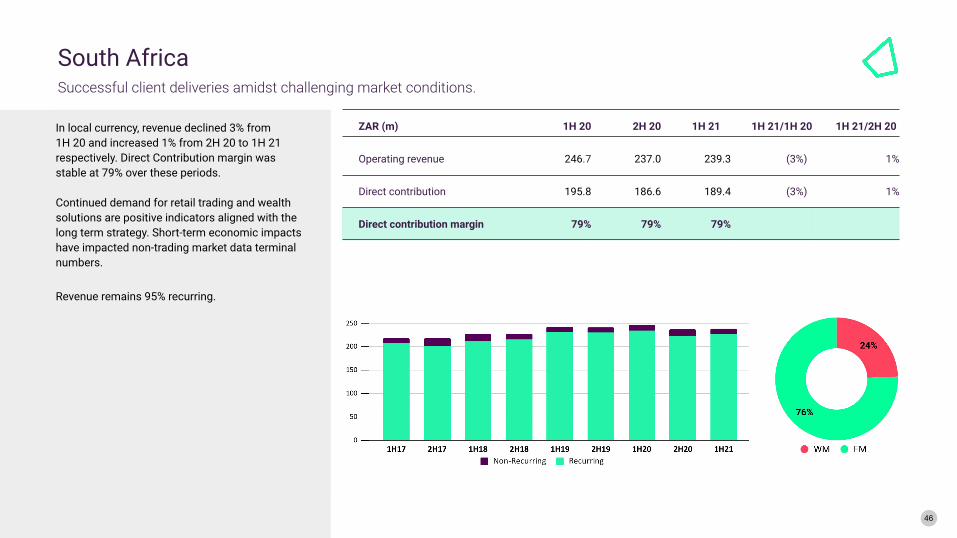
ZAR (m) 1H 20 2H 20 1H 21 1H 21/1H 20 1H 21/2H 20
Operating revenue 246.7 237.0 239.3 (3%) 1%
Direct contribution 195.8 186.6 189.4 (3%) 1%
Direct contribution margin 79% 79% 79%
In local currency, revenue declined 3% from1H 20 and increased 1% from 2H 20 to 1H 21 respectively. Direct Contribution margin wasstable at 79% over these periods.
Continued demand for retail trading and wealth solutions are positive indicators aligned with the long term strategy. Short-term economic impacts have impacted non-trading market data terminal numbers.
Revenue remains 95% recurring.
46
South AfricaSuccessful client deliveries amidst challenging market conditions.

CAD (m) 1H 20 2H 20 1H 21 1H 21/1H 20 1H 21/2H 20
Operating revenue 13.1 13.1 14.4 10% 11%
Direct contribution 5.0 5.2 6.6 32% 27%
Direct contribution margin 38% 40% 46%
Direct contribution margin excluding QuantHouse 41% 42% 53%
In local currency, revenue increased by 10% while direct contribution increased by 32%.
The 1H 21 revenue increase reflects the go-live of a retail trading system to a Tier 1 bank in 2H 20 and additional project work to meet new regulatory requirements.
Market Data revenue grew by 4% compared to both 1H 20 and 2H 20.
Direct Contribution increase reflects margin impact of the QuantHouse acquisition and ongoing cost discipline.
Revenue remains greater than 90% recurring.
47
North AmericaStable underlying client base. QuantHouse broadens market data capability.

Product & Technology costs increased 3% vs pcp and the cost as a % of revenue on a constant currency basis decreased from 25% in 1H 20 to 24% in 1H 21.
Excluding the impact of annual leave and removing OneVue for comparability purposes, Product & Technology costs decreased by 3% and Operations decreased 1% compared to 1H 20 which was largely attributable to strong cost discipline.
Iress continues to invest in people and capability to pursue emerging revenue opportunities and continue to improve the way Iress designs, engineers and deploys software.
AUD$m 1H 20 2H 20 1H 21 1H 21/1H 20 1H 21/2H 20
P&T Costs ($m)(1) 68.1 62.1 70.3 3% 13%
P&T Costs as % of revenue 25% 22% 24%
P&T Costs ex. AL and OneVue ($m)(2) 65.6 63.8 63.9 (3%) -
Operations
AUD$m 1H 20 2H 20 1H 21 1H 21/1H 20 1H 21/2H 20
Operations Costs ($m)(1) 22.0 21.3 30.5 39% 43%
Operations Costs as % of revenue 8% 8% 10%
Operations Costs ex. AL and OneVue ($m)(2) 21.5 20.9 21.4 (1%) 2%
Corporate
AUD$m 1H 20 2H 20 1H 21 1H 21/1H 20 1H 21/2H 20
Corporate Costs ($m)(1) 17.9 20.0 22.1 23% 10%
Corporate Costs as % of revenue 7% 7% 7%
Corporate Costs ex. AL and OneVue ($m)(2) 17.5 19.7 18.7 7% (5%)
(1) Figures are presented on a constant currency basis, assuming results are converted at the average foreign exchange rates used for 1H 20.(2) Annual Leave and OneVue has been removed from disclosures for comparability purposes between the halves. 48
Ongoing cost discipline across functional segments
Product & Technology

Cash conversion remains strong at 90% (FY20: 86%). Increase vs FY20 driven by positive working capital changes across the group, timing of project billing (mainly UK) and timing of prepaid expenses.
(1) Measured as borrowings excluding capitalised borrowing costs, net of derivatives, and less cash and cash equivalents(2) Leverage = Net debt divided by the last twelve months of segment profit
AUD$m 1H 20 2H 20 1H 21
Total current assets 174.8 133.8 131.7
Total non-current assets 732.1 869.9 893.8
Total Assets 906.9 1,003.8 1,025.5
Total current liabilities 105.3 102.2 102.2
Total non-current liabilities 250.3 314.7 348.7
Total Liabilities 355.6 417.0 450.9
Net Assets 551.3 586.8 574.6
AUD$m 1H 20 2H 20 1H 21
Cash 100.0 63.1 47.3
Borrowings (148.7) (188.4) (228.9)
Net debt (1) 48.7 125.1 183.6
Leverage (2) 0.3 0.8 1.2
Cash conversion (%)
Cash conversion = Cash generated from operating activities / Reported segment profit. The business generated $67.8m of cash from operating activities in 1H 21 from a rolling segment profit of $156.5m. 49
Strengthened balance sheet and strong cash conversion 90%

1H 21 onwards converted at June 2021 foreign exchange rates (refer to page 51 for rates).
D&A - Operational 1H 20 2H 20 1H 21
Depreciation
Plant & Equipment 5.4 5.6 5.7
Amortisation
Software (3rd Party Purchased) 0.7 0.9 0.8
Leases 5.6 6.5 7.5
Total 11.7 13.0 14.1
D&A - Acquisition Related 1H 20 2H 20 1H 21 2H 21 1H 22 2H 22 1H 23 2H 23Computer Software Avelo 0.2 0.2 0.2 0.2 - - - -
Proquote & Pulse 0.4 0.2 - - - - - -
Financial Synergy 1.1 1.1 1.1 1.1 1.1 1.1 1.1 1.1
INET 0.8 0.8 0.8 0.8 0.3 0.2 0.2 0.2
Lucsan 0.6 0.6 0.6 0.6 0.3 - - -
Pathways 0.1 0.1 - - - - - -
QuantHouse 1.1 1.1 1.0 1.0 1.0 1.0 1.0 1.0
O&M Systems 0.1 0.2 0.2 0.2 0.2 0.2 0.2 0.2
BC Gateways - 0.2 0.1 0.1 0.1 0.1 0.1 0.1
OneVue 0.5 1.8 1.8 1.8 1.8 1.8 1.8
Customer Relationships Avelo 0.9 - - - - - - -
Financial Synergy 0.6 0.6 0.6 0.6 0.6 0.6 0.6 0.6
Proquote & Pulse 1.3 1.3 1.3 1.3 1.3 1.0 0.6 0.6
QuantHouse 0.1 0.1 - - - - - -
O&M Systems 0.1 0.1 0.2 0.2 0.2 0.2 0.2 0.2
OneVue 0.2 0.6 0.6 0.6 0.6 0.6 0.6
Brands Proquote & Pulse - - - - - - - -
Total 7.3 7.4 8.5 8.5 7.5 6.7 6.4 6.4
50
Depreciation and amortisation
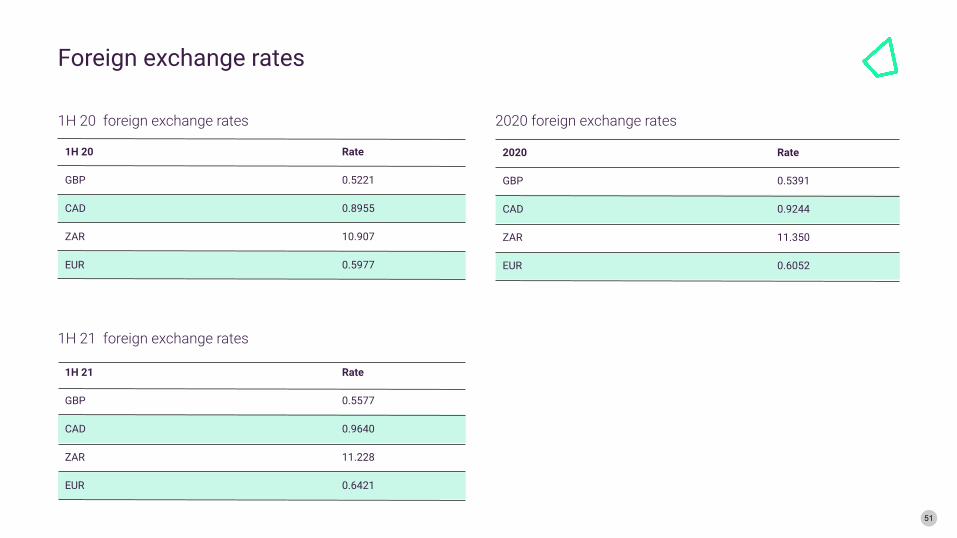
1H 20 foreign exchange rates
1H 20 Rate
GBP 0.5221
CAD 0.8955
ZAR 10.907
EUR 0.5977
2020 Rate
GBP 0.5391
CAD 0.9244
ZAR 11.350
EUR 0.6052
2020 foreign exchange rates
51
1H 21 foreign exchange rates
1H 21 Rate
GBP 0.5577
CAD 0.9640
ZAR 11.228
EUR 0.6421
Foreign exchange rates
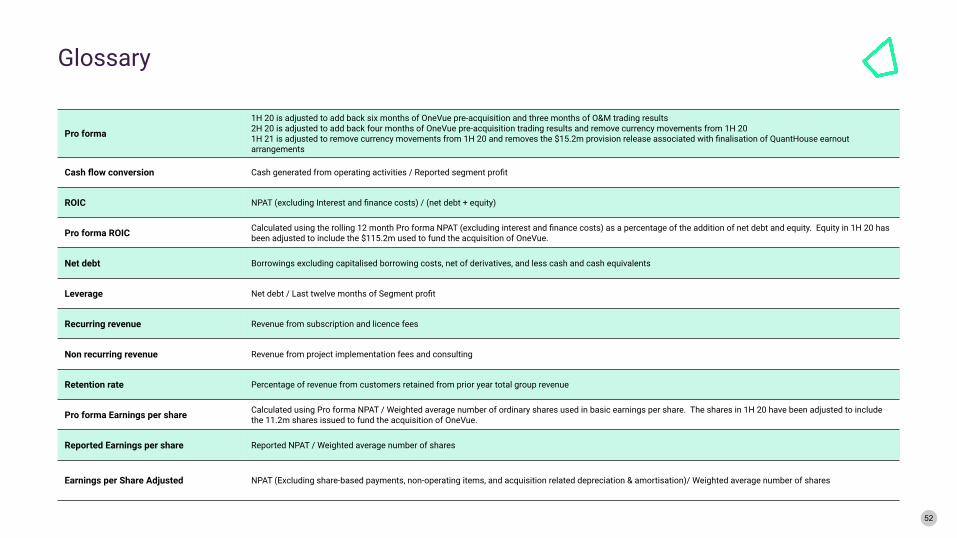
Pro forma
1H 20 is adjusted to add back six months of OneVue pre-acquisition and three months of O&M trading results2H 20 is adjusted to add back four months of OneVue pre-acquisition trading results and remove currency movements from 1H 201H 21 is adjusted to remove currency movements from 1H 20 and removes the $15.2m provision release associated with finalisation of QuantHouse earnout arrangements
Cash flow conversion Cash generated from operating activities / Reported segment profit
ROIC NPAT (excluding Interest and finance costs) / (net debt + equity)
Pro forma ROIC Calculated using the rolling 12 month Pro forma NPAT (excluding interest and finance costs) as a percentage of the addition of net debt and equity. Equity in 1H 20 has been adjusted to include the $115.2m used to fund the acquisition of OneVue.
Net debt Borrowings excluding capitalised borrowing costs, net of derivatives, and less cash and cash equivalents
Leverage Net debt / Last twelve months of Segment profit
Recurring revenue Revenue from subscription and licence fees
Non recurring revenue Revenue from project implementation fees and consulting
Retention rate Percentage of revenue from customers retained from prior year total group revenue
Pro forma Earnings per share Calculated using Pro forma NPAT / Weighted average number of ordinary shares used in basic earnings per share. The shares in 1H 20 have been adjusted to include the 11.2m shares issued to fund the acquisition of OneVue.
Reported Earnings per share Reported NPAT / Weighted average number of shares
Earnings per Share Adjusted NPAT (Excluding share-based payments, non-operating items, and acquisition related depreciation & amortisation)/ Weighted average number of shares
52
Glossary
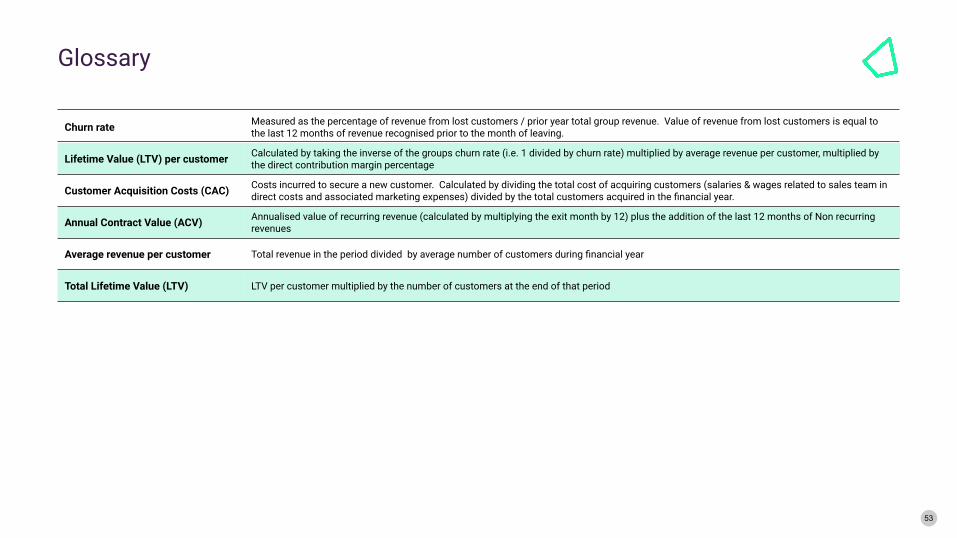
Churn rate Measured as the percentage of revenue from lost customers / prior year total group revenue. Value of revenue from lost customers is equal to the last 12 months of revenue recognised prior to the month of leaving.
Lifetime Value (LTV) per customer Calculated by taking the inverse of the groups churn rate (i.e. 1 divided by churn rate) multiplied by average revenue per customer, multiplied by the direct contribution margin percentage
Customer Acquisition Costs (CAC) Costs incurred to secure a new customer. Calculated by dividing the total cost of acquiring customers (salaries & wages related to sales team in direct costs and associated marketing expenses) divided by the total customers acquired in the financial year.
Annual Contract Value (ACV) Annualised value of recurring revenue (calculated by multiplying the exit month by 12) plus the addition of the last 12 months of Non recurring revenues
Average revenue per customer Total revenue in the period divided by average number of customers during financial year
Total Lifetime Value (LTV) LTV per customer multiplied by the number of customers at the end of that period
53
Glossary
54
DisclaimerThe material in this presentation is intended to be general background information on Iress Limited and its activities, current at the date of the presentation. The information is provided in summary form and does not purport to be complete or to contain all of the information that an investor should consider when making an investment decision. It should be read in conjunction with Iress’ other periodic and continuous disclosure announcements lodged with the ASX, which are available at www.asx.com.au.
It is not intended to be relied upon as advice to investors or potential investors and does not consider the individual circumstances of any particular investor. Prior to making a decision in relation to Iress’ securities, products or services, investors or potential investors should consider their own investment objectives, financial situation and needs and obtain professional advice. Nothing contained in this document constitutes investment, legal, tax or other advice.
No representations or warranties
The material contained in this presentation may include information derived from publicly available sources that have not been independently verified. No representation or warranty is made as to the accuracy, completeness or reliability of the information.
To the maximum extent permitted by law, Iress, any of its related bodies corporate or its directors, officers, employees, professional advisors and agents (Related Parties) do not accept any liability for any loss arising from or in connection with this presentation including, without limitation, any liability arising from fault or negligence, or make any representations or warranties regarding, and take no responsibility for, any part of this presentation and make no representation or warranty, express or implied, as to the currency, accuracy, reliability, or completeness of information in this presentation.
Forward looking statements
This presentation contains forward-looking statements, which may be identified by words such as ‘anticipate’, ‘believe’, ‘estimate’, ‘expect’, ‘intend’, ‘will’, ‘plan’, ‘may’, ‘could’, ‘should’, ‘predict’, ‘forecast’, ‘target’ and similar expressions. Indications of, and guidance on, future earnings, financial position, distributions and performance are also forward-looking statements as are statements regarding Iress’ businesses, future developments, market outlook, market conditions, results of operations, the outcome of the strategies described in this presentation and the use of proceeds. Such forward-looking statements are based on Iress’ current views and assumptions, and involve known and unknown risks and uncertainties, many of which are beyond the control of Iress and its Related Parties.
These risks include domestic and international economic conditions, exchange rates (including foreign exchange rates), competition in the markets in which Iress will operate, the substantial technological changes taking place in the financial software industry, the continuing growth in the technology markets where Iress will operate, and the risk of information security breaches and/or failure of critical systems. A number of these factors are described in the “material business risks” section of our Annual Report for the year ended 31 December 2020, which was lodged with the ASX on 18 February 2021 and is available on Iress’ website: www.iress.com/resources/investors/reports-presentations/.
In addition to the risks and uncertainties outlined above, there are particular risks and uncertainties in connection with the implementation of the strategies and targets described in this presentation including: the response of customers to changes in Iress’ products, services and platform, including if Iress determines that a product or service should be discontinued; that detailed business plans have not been developed for the entirety of the strategy; that the full scope and cost of implementation may vary as plans are developed and as Iress engages with third parties; that Iress may not successfully execute and manage implementation of these strategies and plans in a sequenced, controlled and effective manner and in accordance with the relevant project and business plans (once developed), including due to a lack of sufficient qualified personnel or loss of key personnel; and Iress’ ability to execute productivity initiatives and realise operational synergies, cost savings and revenue benefits in accordance with its plans.
These risks and uncertainties could cause actual results, performance or events to differ materially from those expressed or implied. There are usually differences between forecast and actual results because events and actual circumstances frequently do not occur as forecast and their differences may be material. Forward-looking statements contained in this presentation are not guarantees or representations of future performance and should not be relied upon as such. Neither Iress, nor its Related Parties, give any representation, warranty, assurance, nor will guarantee that the occurrence of the events expressed or implied in any forward-looking statement will occur. Readers should not place undue reliance on these forward-looking statements (including projections, guidance on future earnings and estimates), which speak only as of the date of this presentation. Each recipient of this publication should make its own enquiries and investigations regarding all information included in this publication including the assumptions, uncertainties and contingencies which may affect Iress’ future operations and the values and the impact that future outcomes may have on Iress. To the maximum extent permitted by law, Iress and its Related Parties disclaim any obligation, undertaking or responsibility to update or revise any forward-looking statement to reflect any change in Iress’ financial condition, status or affairs or any change in the expectations, assumptions, events, conditions or circumstances on which a statement is based after the date of this presentation, except as required by Australian law (including applicable disclosure requirements).
Securities
This presentation is not intended to (nor does it) constitute an offer, invitation or recommendation by or on behalf of Iress or its Related Parties to subscribe for, purchase, sell or otherwise deal in any equity instrument or other securities, nor are they intended to be used for the purpose of or in connection with offers, invitations or recommendations to subscribe for, purchase, sell or otherwise deal in any equity instruments or other securities.
Figures
Unless otherwise noted, financial information, including forward-looking figures, in this presentation is based on IFRS. This presentation contains financial information and disclosures which are extracted or derived from the Consolidated Interim Financial Report for the half year ended 30 June 2021, which has not been reviewed by Iress’ independent auditor.
All amounts and dollar values are in Australian dollars (A$) and financial data is presented within the six months ended 30 June 2021 unless otherwise stated. Certain figures, amounts, percentages, estimates, calculations of value and fractions may be subject to rounding differences. All market share information in this presentation is based on management estimates based on internally available information unless otherwise indicated.

ContactAndrew Walsh, CEOJohn Harris, CFO
+61 3 9018 5800iress.com