presentation for the cirpa 2010 conference by joanne heslop, manager student transitions project...
TRANSCRIPT

1
Presentation for theCIRPA 2010 CONFERENCE
By Joanne Heslop, Manager
Student Transit ions Project (STP)
October 26, 2010Ottawa, ON
The Student Transitions Project (STP):Collaborating Across Education Ministries and Institutions
to Track Grade 12 Graduates Enrolling in B.C. Public, B.C. Private and Non-B.C.
Post-Secondary Institutions

2
STP BACKGROUND
STUDENT TRANSITIONS
STUDENT MOBILITY
STUDENT SUCCESS
AGENDA

HISTORY
PURPOSE
METHODOLOGY
STPBACKGROUND
3
4
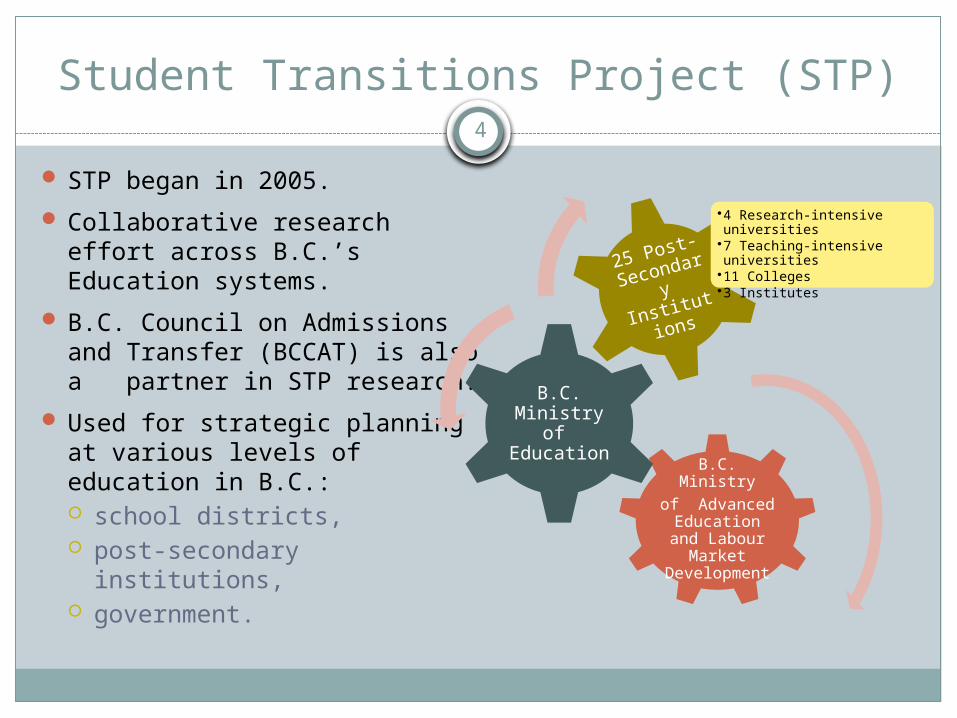
Student Transitions Project (STP)
STP began in 2005.
Collaborative research effort across B.C.’s Education systems.
B.C. Council on Admissions and Transfer (BCCAT) is also a partner in STP research.
Used for strategic planning at various levels of education in B.C.: school districts, post-secondary institutions, government.
B.C. Ministryof Advanced
Education and Labour Market
Development
B.C. Ministry of Education
25 Post-
Secondary
Institution
s
•4 Research-intensive universities
•7 Teaching-intensive universities
•11 Colleges•3 Institutes

5
STP Purpose, Goal and Outputs
PurposeCollect, analyze, report on student
mobility using K-12 and post-secondary
education data.
GoalProvide reliable information at
predictable times in a timely
manner to support
institutions and government with
planning.
OutputsReports,
newsletters, Excel
PivotTables and interactive tools on a variety of
topics.
6
STP Governance
STP Steering Committee
Ministry of Advanced
Education and Labour Market
Development
Ministry of Education
(K-12)
BC Research-Intensive
Universities
BC Colleges, Institutes and
Teaching-Intensive
Universities
BC Council on Admissions
and Transfer (BCCAT)
Joanne Heslop,
STP Manager

7
STP Sub-committees
STP
Data Management Subcommitte
e
Applicant Research
Subcommittee
Mobility of Transfer Students
Subcommittee

8
K-12
Research-Intensive University
Teaching-Intensive University
Urban College
Rural CollegeInstitute
B.C. Private Institution or
Non-B.C. Institution
No Post-Sec. Registration
Student Transitions and Mobility
STP tracks education transitions and pathways of students:
From K-12 to post-secondary,
AND
Within the post-secondary system.
Using 2009-10 institution types
9
Student Transitions – How?
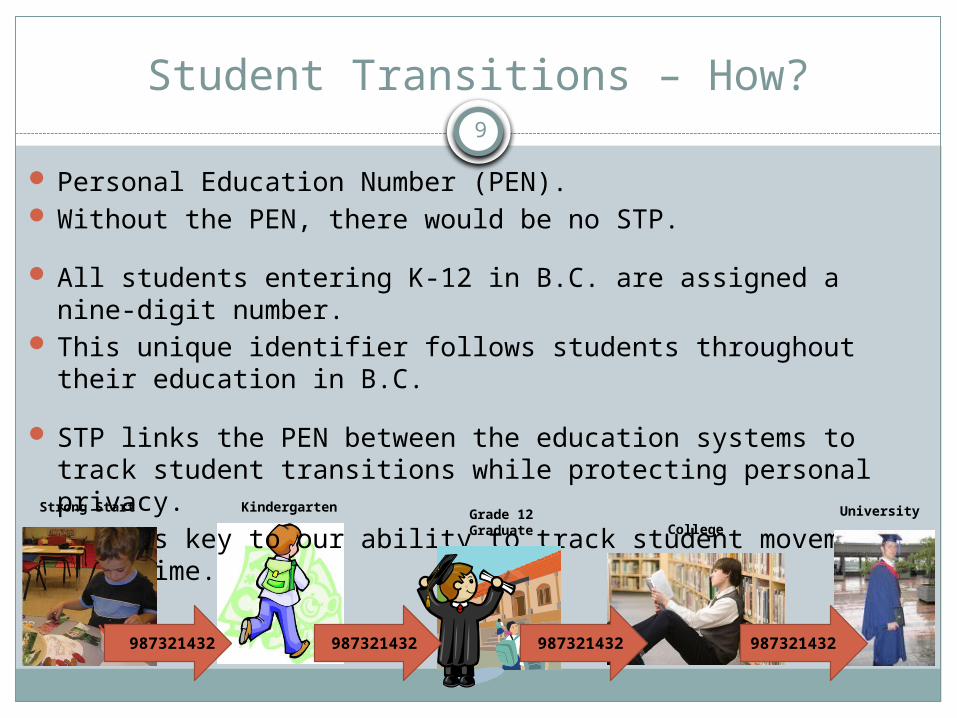
Personal Education Number (PEN). Without the PEN, there would be no STP.
All students entering K-12 in B.C. are assigned a nine-digit number.
This unique identifier follows students throughout their education in B.C.
STP links the PEN between the education systems to track student transitions while protecting personal privacy.
This is key to our ability to track student movement over time.
987321432 987321432
Kindergarten Grade 12Graduate College
University
987321432
Strong Start
987321432

12
High School Graduates of 2001/02 – 2007/08
First transitions to B.C. public post-secondary education: 2002/03 – 2008/09
1-Year Delay 1-Year DelayImmediate
EntryImmediate
EntryImmediate
Entry
HighSchool
2001/2002
2002/2003
2003/2004
2004/2005
2005/2006
2006/2007
2007/2008
5-Year Delay
Which Students are Included?
Post-Sec 2002/
20032003/2004
2004/2005
2005/2006
2006/2007
2007/2008
2008/2009
Fall 2009
STPRESEARCH FINDINGS
13
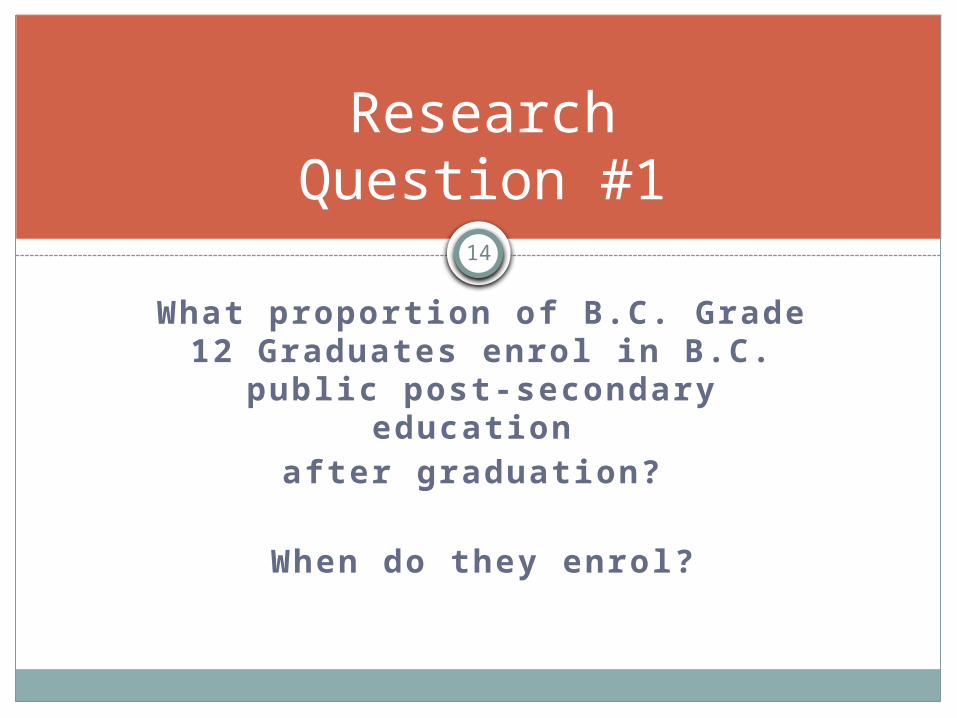
What proportion of B.C. Grade 12 Graduates enrol in B.C.
public post-secondary education
after graduation?
When do they enrol?
ResearchQuestion #1
14

3-Year Delay(3%)
Student Transitions – When?15
K-12 Immediate Entry
(51%-52%)
1-Year Delay(11%)
2-Year Delay(5%)
4-Year Delay(2%)
7-Yr CumulativeTransition Rate =
75%
5-Year Delay(2%)
The majority enroll in Fall
(44%)
6-Year Delay(1%)

Among those who do not transition to
B.C. public post-secondary education, are they enrolling
elsewhere?
B.C. Private Institutions? Non-B.C. Institutions?
Research Question #2
16

17
STP Links to Other Sources to Identify Student Enrollments Beyond the B.C. Public System
Student Transitions
Project
B.C. K-12 Enrollment
s
B.C. Public Post-
Secondary Enrollment
s
Student Financial
Aid
Passport to Education
The PEN makes the data linkage possible.

18
Immediate Entry
(BC Public), 51%Delay Up
to 5 Yrs(BC Pub-lic); 23%
No Tran-sition Yet;
26%
Student Transition Rates Over Six Years (2001/02 Grads): Two Perspectives
Immediate Entry
(BC Pub-lic); 51%
(BC Private); 2%(Non-BC), 3%
Delay Up to 5 Yrs
(All Sectors); 25%
No Tran-sition
(Yet); 19%
Cum. 6-Year Transition Rate = 81%
Cum. 6-Year Transition Rate = 74%
(1) BC Public System Perspective:
(2) All Sectors Perspective:
Immed Entry
(All Sectors)= 56%
19
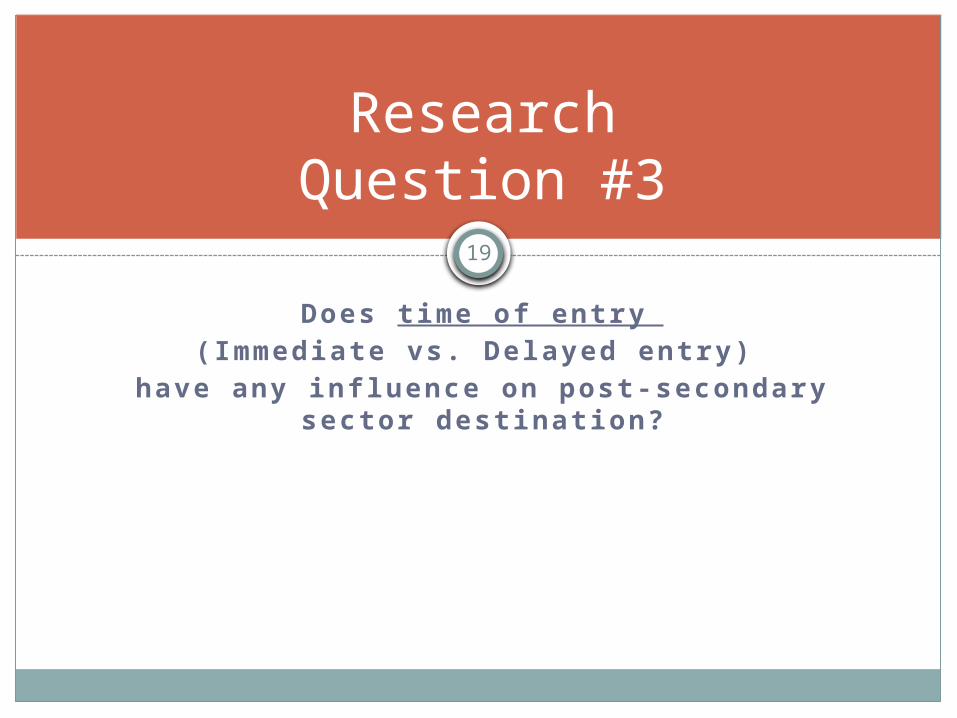
Does time of entry (Immediate vs. Delayed entry)
have any infl uence on post-secondary sector destination?
ResearchQuestion #3
20
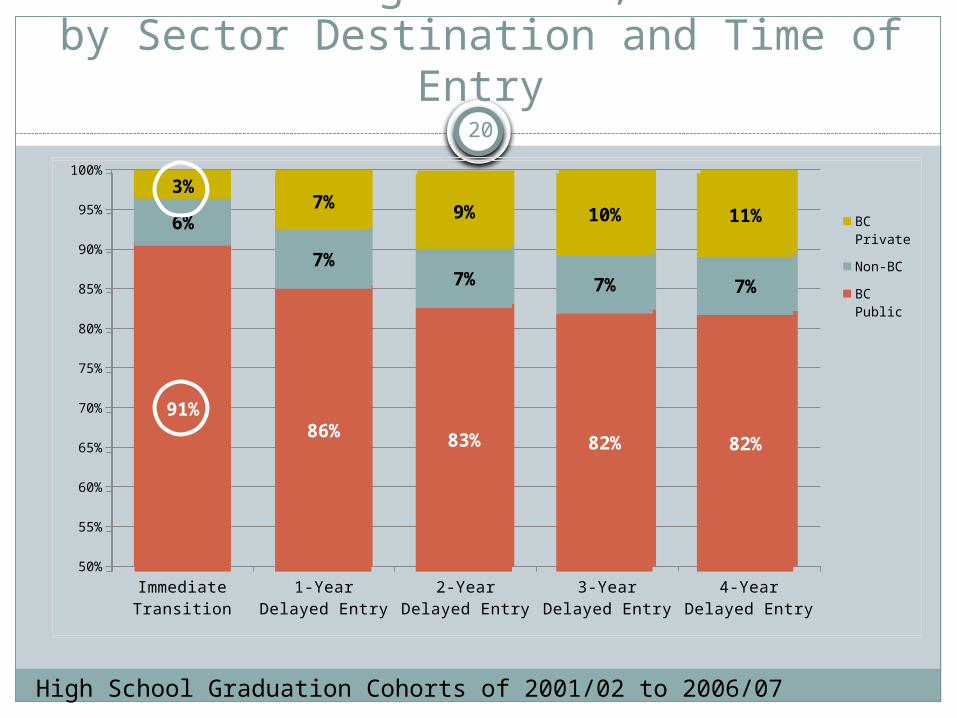
% Distribution of Post-Secondary Registrants,
by Sector Destination and Time of Entry
Immediate Transition
1-Year Delayed Entry
2-Year Delayed Entry
3-Year Delayed Entry
4-Year Delayed Entry
50%
55%
60%
65%
70%
75%
80%
85%
90%
95%
100%
91%86% 83% 82% 82%
6%
7%7% 7% 7%
3%7% 9% 10% 11% BC
Private
Non-BC
BC Public
91%86% 83% 82% 82%
6%
7%7% 7% 7%
3%7% 9% 10% 11%
High School Graduation Cohorts of 2001/02 to 2006/07

21
Do academic qualifi cations from high school aff ect students’ post-
secondary sector destinations?
ResearchQuestion #4

22
% Distribution of Post-Secondary Registrants,by Sector Destination and Academic GPA at Gr12 Graduation
<50 or (blank)
50-60 60-70 70-75 75-80 80-90 90-100
No GPA Moderate Achievers High Achievers
0%
10%
20%
30%
40%
50%
60%
70%
80%
90%
100%
53%
68%75% 77% 79% 79% 74%
4%
2%
2% 2% 2% 1%1%
1%
2%
2%4% 6% 10% 18%
41%
28%20% 16% 13% 10% 7%
BC PUBLIC BC PRIVATE NON-BC
High School Graduation Cohorts of 2001/02 to 2006/07. On average, 5% enrol outside of BC.

23
Sector Destination and Academic Qualifications:(BC Grade 12 Graduates of 2001/02 to 2006/07, by
2007/08)
No Transition
BC Private
BC Public
Non-BC
75.8
76.5
79.1
84.4
Average Academic GPA
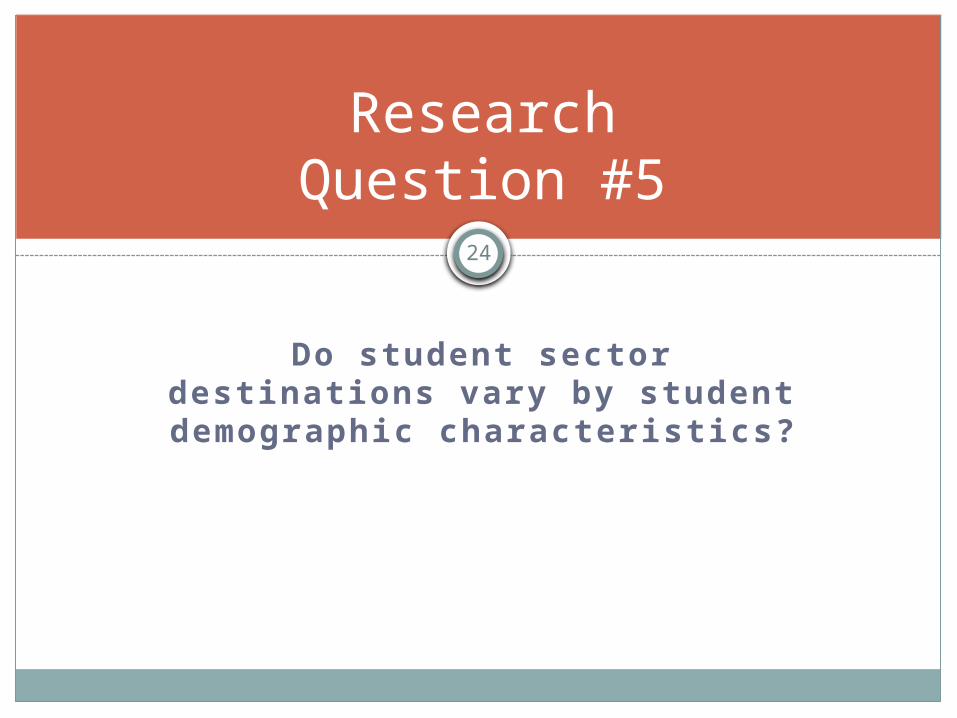
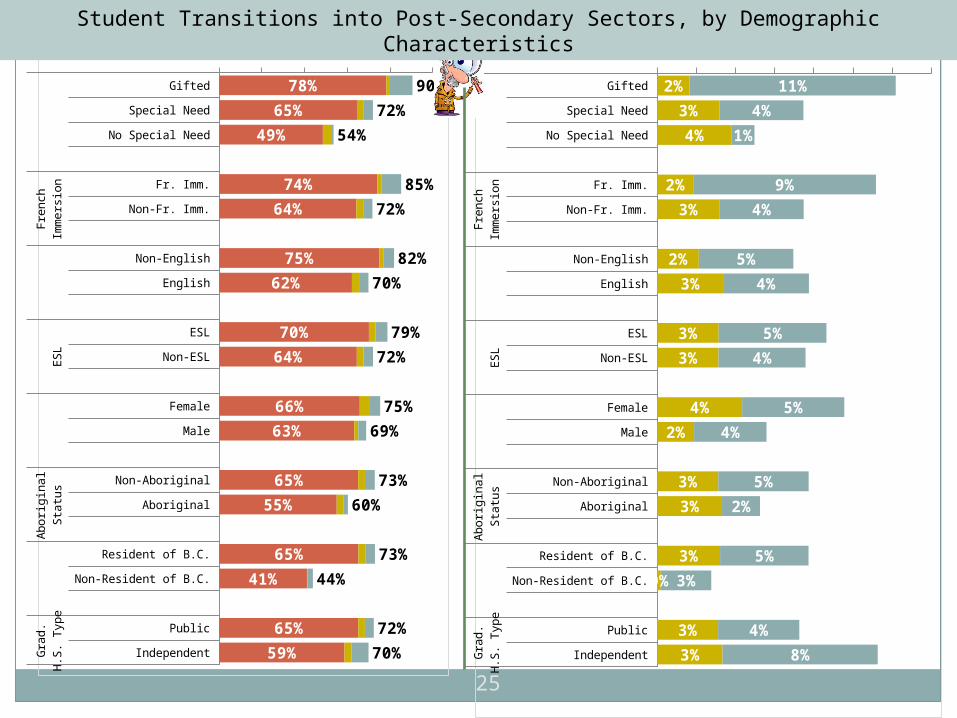
Do student sector destinations vary by student demographic
characteristics?
ResearchQuestion #5
24
25
Gifted
Special Need
No Special Need
Fr. Imm.
Non-Fr. Imm.
Non-English
English
ESL
Non-ESL
Female
Male
Non-Aboriginal
Aboriginal
Resident of B.C.
Non-Resident of B.C.
Public
Independent
Sp
ecia
lN
eed
Fre
nch
Imm
ers
ion
Hom
eL
ang
uag
eE
SL
Gen
der
Ab
orig
inal
Sta
tus
B.C
. N
on-
Res
.G
rad
.H
.S.
Typ
e
78%
65%
49%
74%
64%
75%
62%
70%
64%
66%
63%
65%
55%
65%
41%
65%
59%
90%
72%
54%
85%
72%
82%
70%
79%
72%
75%
69%
73%
60%
73%
44%
72%
70%
BC Public BC Private Non-BC All Sectors
Gifted
Special Need
No Special Need
Fr. Imm.
Non-Fr. Imm.
Non-English
English
ESL
Non-ESL
Female
Male
Non-Aboriginal
Aboriginal
Resident of B.C.
Non-Resident of B.C.
Public
Independent
Sp
ecia
lN
eed
Fre
nch
Imm
ers
ion
Hom
eL
an
gu
ag
eE
SL
Gen
der
Ab
ori
gin
al
Sta
tus
B.C
. N
on
-R
es.
Gra
d.
H.S
. T
yp
e
2%
3%
4%
2%
3%
2%
3%
3%
3%
4%
2%
3%
3%
3%
0%
3%
3%
11%
4%
1%
9%
4%
5%
4%
5%
4%
5%
4%
5%
2%
5%
3%
4%
8%
BC Private Non-BC
Student Transitions into Post-Secondary Sectors, by Demographic Characteristics
26
What are the regional diff erences in student sector destinations?
ResearchQuestion #6

College Regions and Geographic Areas27
Vancouver Island:1 - Camosun8 - Malaspina 11 - North Island
Lower Mainland:2 - Capilano 15 - Vancouver/Langara
Boundary-Fraser Valley:4 - Douglas6 - Fraser Valley7 - Kwantlen
Interior:3 - Thompson Rivers5 - Rockies 13 - Okanagan14 - Selkirk
Northern B.C.:9 - New Caledonia10 - Northern Lights 12 - Northwest
http://www.bclmiguide.ca/application/maps/collegeregions.asp

28
-1% 1% 3% 5% 7% 9% 11% 13% 15%
6%
3%
3%
6%
5%
7%
4%
5%
4%
3%
4%
3%
3%
10%
6%
14%
2%
3%
4%
2%
2%
2%
3%
2%
2%
4%
2%
3%
6%
1%
4%
2%
NON-BC BC PRIVATE
Regional Transition Rates intoB.C. Public and B.C. Private Post-Sec
Vancouver/Langara
Douglas
Kwantlen
Capilano
Northwest
Selkirk
ALL GRADS, ALL REGIONS
New Caledonia
Camosun
North Island
Malaspina
Thompson Rivers
Fraser Valley
Northern Lights
Okanagan
Rockies
0%20%40%60%80%
76%
71%
68%
66%
66%
65%
65%
62%
62%
61%
61%
60%
55%
53%
52%
49%
BC PUBLIC
Transition rates (by 2007/08) for high school graduation cohorts, 2001/02 to 2006/07.

College Regions and Geographic Areas29
Vancouver Island:1 - Camosun8 - Malaspina 11 - North Island
Lower Mainland:2 - Capilano 15 - Vancouver/Langara
Boundary-Fraser Valley:4 - Douglas6 - Fraser Valley7 - Kwantlen
Interior:3 - Thompson Rivers5 - Rockies 13 - Okanagan14 - Selkirk
Northern B.C.:9 - New Caledonia10 - Northern Lights 12 - Northwest
http://www.bclmiguide.ca/application/maps/collegeregions.asp
Northern Lights
Rockies
Selkirk
Okanagan
FraserValley
30
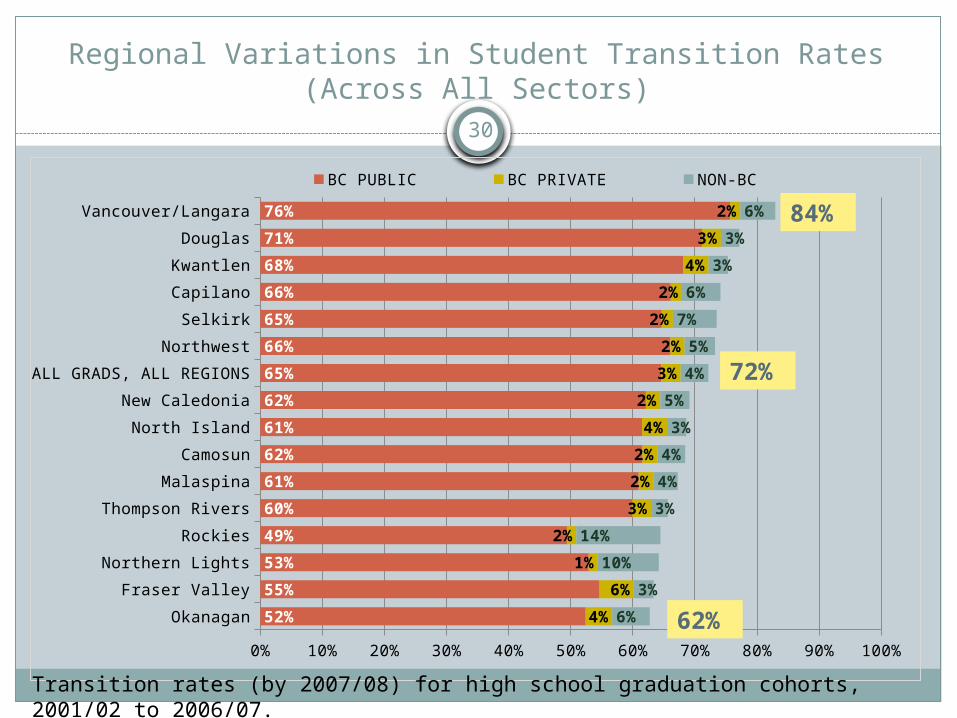
Regional Variations in Student Transition Rates (Across All Sectors)
Okanagan
Fraser Valley
Northern Lights
Rockies
Thompson Rivers
Malaspina
Camosun
North Island
New Caledonia
ALL GRADS, ALL REGIONS
Northwest
Selkirk
Capilano
Kwantlen
Douglas
Vancouver/Langara
0% 10% 20% 30% 40% 50% 60% 70% 80% 90% 100%
52%
55%
53%
49%
60%
61%
62%
61%
62%
65%
66%
65%
66%
68%
71%
76%
4%
6%
1%
2%
3%
2%
2%
4%
2%
3%
2%
2%
2%
4%
3%
2%
6%
3%
10%
14%
3%
4%
4%
3%
5%
4%
5%
7%
6%
3%
3%
6%
BC PUBLIC BC PRIVATE NON-BC
Transition rates (by 2007/08) for high school graduation cohorts, 2001/02 to 2006/07.
62%
84%
72%
31
Among those Grade 12 Graduates(5%) who enrolled outside of the
B.C. Public Post-Secondary System, where did they enrol?
• Which Countries?• Which Provinces?_
Research Question #7
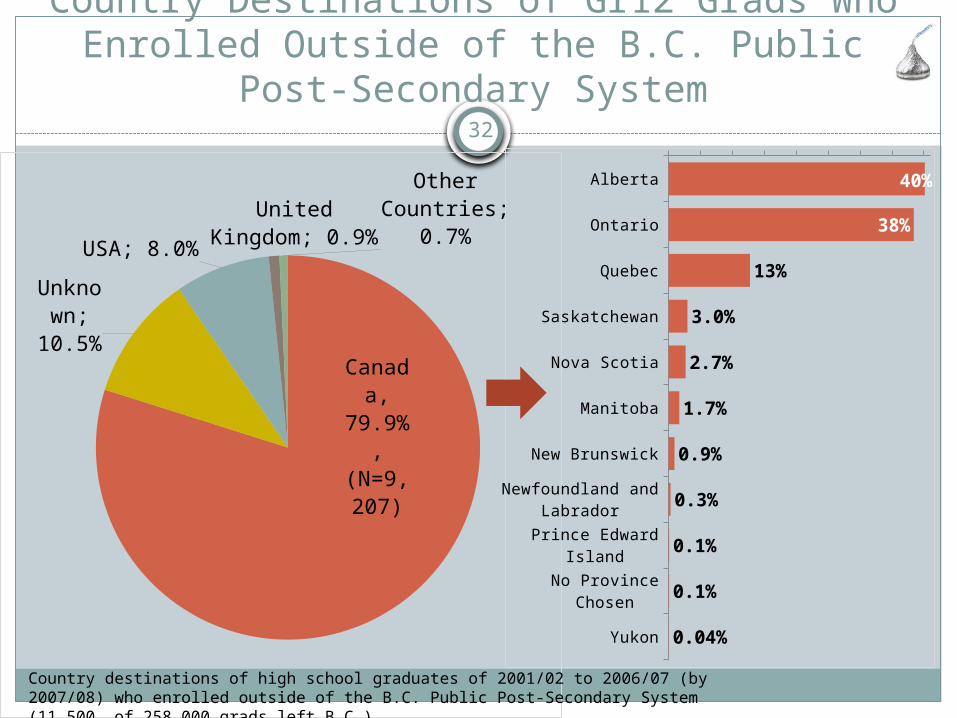
32
Country Destinations of Gr12 Grads Who Enrolled Outside of the B.C. Public Post-
Secondary System
Canada,
79.9%,
(N=9,207)
Un-know
n; 10.5%
USA; 8.0%
United Kingdom;
0.9%Other Countries;
0.7%
Country destinations of high school graduates of 2001/02 to 2006/07 (by 2007/08) who enrolled outside of the B.C. Public Post-Secondary System (11,500 of 258,000 grads left B.C.)
Alberta
Ontario
Quebec
Saskatchewan
Nova Scotia
Manitoba
New Brunswick
Newfoundland and Labrador
Prince Edward Island
No Province Chosen
Yukon
40%
38%
13%
3.0%
2.7%
1.7%
0.9%
0.3%
0.1%
0.1%
0.04%
33
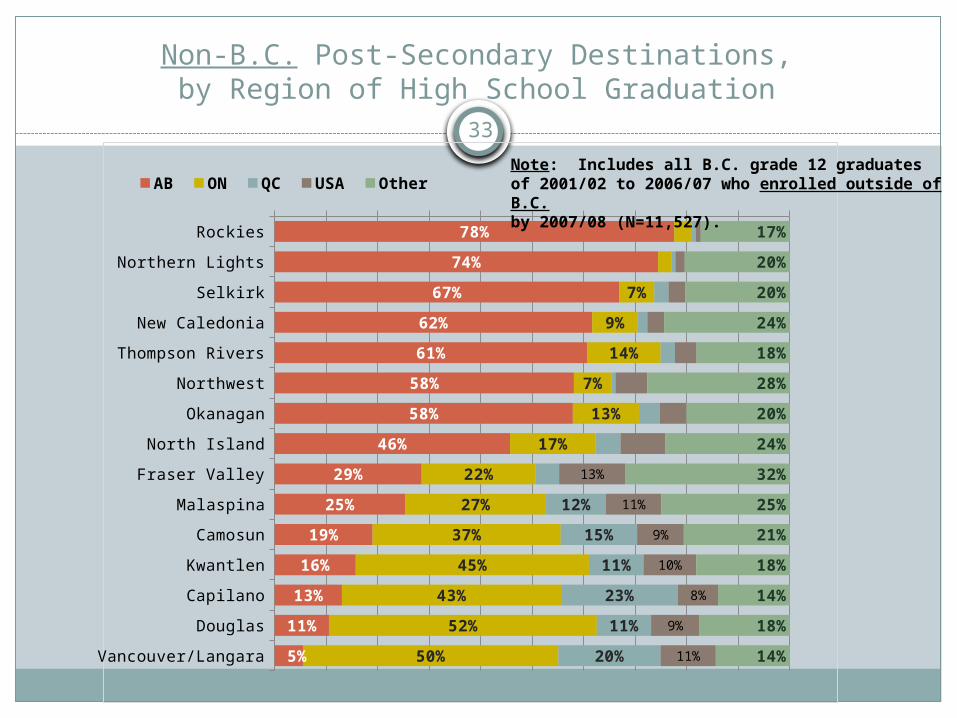
Non-B.C. Post-Secondary Destinations,by Region of High School Graduation
Rockies
Northern Lights
Selkirk
New Caledonia
Thompson Rivers
Northwest
Okanagan
North Island
Fraser Valley
Malaspina
Camosun
Kwantlen
Capilano
Douglas
Vancouver/Langara
78%
74%
67%
62%
61%
58%
58%
46%
29%
25%
19%
16%
13%
11%
5%
17%
20%
20%
24%
18%
28%
20%
24%
32%
25%
21%
18%
14%
18%
14%
7%
9%
14%
7%
13%
17%
22%
27%
37%
45%
43%
52%
50%
13%
11%
9%
10%
8%
9%
11%
12%
15%
11%
23%
11%
20%
AB ON QC USA OtherNote: Includes all B.C. grade 12 graduates of 2001/02 to 2006/07 who enrolled outside of B.C.by 2007/08 (N=11,527).

34
What are the most popular B.C. Private
post-secondary institution destinations?
What about non-B.C. institutions?
Research Question #8

35
Top 20 B.C. Private PSI Destinationsof Grade 12 Graduates of 2001/02 to 2006/07, by 2007/08
Rank B.C. Private Institution Count% of
Total
1) Art Institute of Vancouver 932 12%
2) Trinity Western University 859 11%
3) Sprott-Shaw Community College 843 10%
4) Blanche Macdonald Centre 446 6%
5) Vancouver Career College 346 4%
6) Columbia Bible College 299 4%
7) CDI Coll Of Bus,Tech &Healthcare 276 3%
8) Vancouver Film School 240 3%
9) Centre For Arts And Technology 202 2%
10) John Casablancas Inst Of Applied Arts 179 2%
11) Stenberg College 163 2%
12) Marvel College 152 2%
13) Summit Pacific College 143 2%
14) Academy Of Learning 142 2%
15) Discovery Comm Coll 138 2%
16) Tourism Training Institute 131 2%
17) Canadian Tourism College 118 1%
18) MTI Community College 113 1%
19) West Coast College/Massage Therapy 104 1%
20) The International Culinary School AIV 87 1%
Other B.C. Private Institutions 2,178 27%
Grand Total 8,091 100%

36
Top 20 Non-B.C. Post-Secondary Destinations
of Grade 12 Graduates of 2001/02 to 2006/07, by 2007/08
Rank Non-B.C. Post-Secondary Institution City Prov Count% of
Total1) University of Toronto Toronto ON 1,050 9.1%2) McGill University - Montreal Montreal PQ 997 8.6%3) University of Calgary Calgary AB 789 6.8%4) University of Alberta Edmonton AB 774 6.7%5) Queen's University Kingston ON 674 5.8%6) University of Waterloo Waterloo ON 483 4.2%7) Southern Alberta Institute of Technology Calgary AB 294 2.6%8) University of Western Ontario London ON 252 2.2%9) Mount Royal University Calgary AB 244 2.1%
10) University of Lethbridge Lethbridge AB 196 1.7%11) Carleton University Ottawa ON 193 1.7%12) Lethbridge Community College Lethbridge AB 182 1.6%13) University of Ottawa Ottawa ON 143 1.2%14) York University Toronto ON 137 1.2%15) Northern Alberta Institute of Technology Edmonton AB 136 1.2%16) Grant MacEwan University Edmonton AB 130 1.1%17) Briercrest College and Seminary Caronport SK 129 1.1%18) Grande Prairie Regional College Grande Prairie AB 107 0.9%19) Ryerson University Toronto ON 100 0.9%20) Dalhousie University Halifax NS 98 0.9%
Unknown ---- ---- 1,212 10.5%Other Non-B.C. Post-Secondary Institutions ---- ---- 3,207 27.8%
Grand Total 11,527 100.0%
37
What are the program destinations of students who enrol in
B.C. public, B.C. private and non-B.C. institutions?
Research Question #9
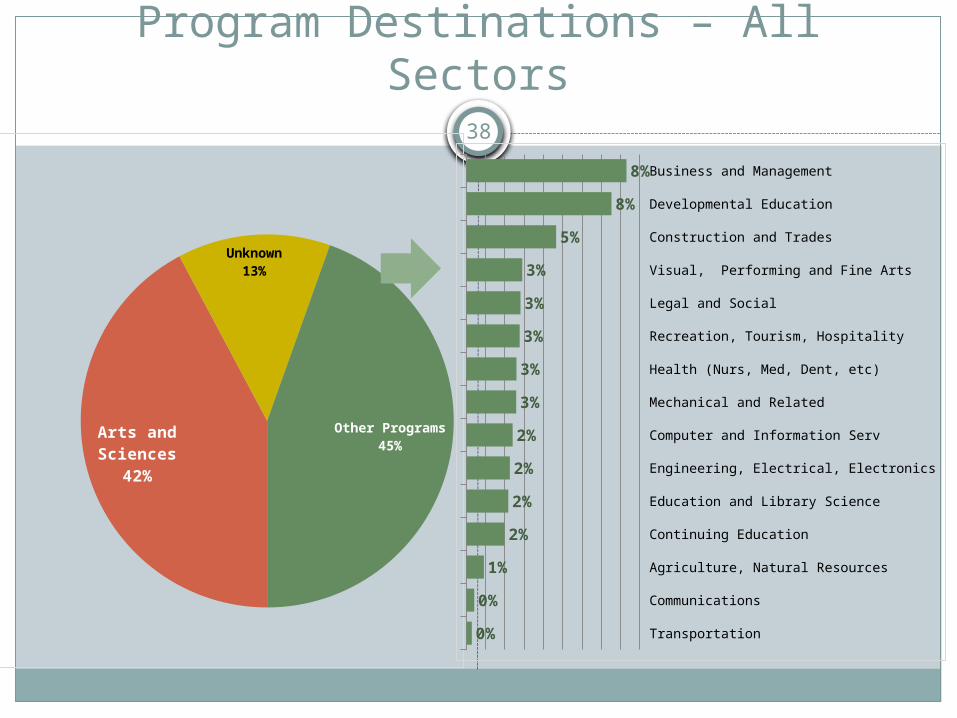
38
Program Destinations – All Sectors
Arts and Sciences42%
Unknown13%
Other Programs45%
Business and Management
Developmental Education
Construction and Trades
Visual, Performing and Fine Arts
Legal and Social
Recreation, Tourism, Hospitality
Health (Nurs, Med, Dent, etc)
Mechanical and Related
Computer and Information Serv
Engineering, Electrical, Electronics
Education and Library Science
Continuing Education
Agriculture, Natural Resources
Communications
Transportation
8%
8%
5%
3%
3%
3%
3%
3%
2%
2%
2%
2%
1%
0%
0%

39
Program Unknown
Popular Program Destinations
Sector (%) (N) Program Area Examples
B.C. Public 7% 12,374
Academic Arts, Sciences
B.C. Private 39% 3,125 Applied, Vocational
Hairdressing, Esthetics,
Make-up Artistry
Non-B.C. 80% 9,214 Academic Arts, Sciences, Engineering
All Sectors 13% 24,713
Program Destinations
Program information is incomplete across all sectors.Some program patterns are evident, despite missing data.
41
Among high school graduates who fi rst enrolled in
B.C. Private or Non-B.C. institutions, what proportion eventually enrolled in
the B.C. public system over the next fi ve
years?
ResearchQuestion #10

42
Cumulative % of 2001/02 Immediate-Entry Students who Attended Institutions
Outside of the B.C. Public Post-Secondary System and Later Enrolled in the B.C. Public Post-secondary System Over the Next
Five Years
2003/04 2004/05 2005/06 2006/07 2007/080%
5%
10%
15%
20%
25%
30%
35%
40%
10%
18%
26%
31%
36%
9%
16%
20%
26%
30%
BC Private Non-BC
Year of Entry to B.C. Public Post-Sec System
Sector of Immediate Entry:
Roughly one-third who left eventually enrolled in the B.C. public system over
next 5 yrs; more so from the B.C.
privates.

43
Summary ofKey Findings
Conclusion

44
Key Findings – Student Transitions
More than half (51% to 52%) of B.C.’s grade 12 graduates enrol directly in B.C. public post-secondary education.
When transitions into all sectors are accounted for (B.C. public, private and non-B.C.), the student transition rate increases to 81% within six years of graduation.
Patterns by sector and program are evident: B.C. Privates – more non-academic programs. B.C. Public and Non-B.C. – more academic programs.

45
Key Findings – Most Stay in B.C.
The B.C. public post-secondary system serves the vast majority of B.C.’s educational needs.
On average, only 10% of grade 12 graduates who pursued post-secondary education within five years of graduation, enrolled in B.C. private or non-B.C. institutions.
Among those who attended non-B.C. institutions, the majority (80%) stayed in Canada.
Do they come back? Roughly one-third of those who enrolled in B.C. private or non-B.C. institutions eventually enrolled in the B.C. public system over the next 5 years.

46
Key Findings – Collaboration is Key
B.C.’s Personal Education Number enables data linkages across education systems.
Extensive co-operation and collaboration across education ministries and post-secondary institutions makes this STP research possible.

Secrets of Our Success
Start small Small steering committee Achievable research
agenda Collect minimum dataset
to answer research questions
Manage the Data and Information Collect data annually Data sharing agreement Data use policy Data linkage policy
47
Expand incrementally Add 1 year of data at a
time Minimize new data
elements Evolving research
questions
Stability and continuity Steering committee
membership remains stable
Consultants replaced by permanent STP Manager
Sufficient/ongoing resources are allocated to the project.

48
Questions &Comments
49
Looking for More Information?
STP Web Site: http://www.aved.gov.bc.ca/student_transitions/ STP Fast Facts Regional Transition Matrices STP Highlights Newsletters STP Research Reports