presentation by government of maharashtra · · 2012-06-16to make rural maharashtra hut free,...
TRANSCRIPT

1
Presentation by Government of Maharashtra
beforePlanning Commission
Mumbai
27 June, 2011

Sector Xth FYP (2002-07)
XIth FYP (2007-12)
Targets Achievement (2007-11)
Link
Agriculture & allied activities 3.5 4.4 4.6
Industry Link 11.9 8.0 7.7
Services 10.8 10.2 10.8
GSDP 10.3 9.1 9.1
Achievements : Growth Rates
Source: DES 2

3
Particulars GSDP GDP
Agriculture & allied activities
4.6 2.3
Industry 7.7 7.2
Services 10.8 10.0
GSDP / GDP 9.1 8.0
XIth FYP (2007-11) : Sectoral Growth Rates(%)

Particulars Outlay Expenditure
Xth FYP 59,123 55,324
Projected for XIth FYP Link 1,27,538 -
Actual 1,60,624 1,04,818 *
Projected for XIIth FYP Link 3,00,000
XIth FYP- Outlays & Expenditure (Rs. Crores)
* Total expenditure upto 2010-11 Source: DES4

5
Regional Imbalance (2009-10)
Rs. 74,027
Rs. 56,241
Rs. 46,492
0
20000
40000
60000
80000
100000
120000
140000
Was
him
Nan
durb
ar
Gad
chir
oli
Osm
anab
ad
Hin
goli
Nan
ded
Bul
dhan
a
Lat
ur
Bee
d
Jaln
a
Parb
hani
Yav
atm
al
Dhu
le
Gon
dia
Am
rava
ti
Ahm
edna
gar
Sola
pur
Ako
la
Bha
ndar
a
Cha
ndra
pur
War
dha
Rat
nagi
ri
Sang
li
Jalg
aon
Sata
ra
Sind
hudu
rg
Kol
hapu
r
Nas
hik
Aur
anga
bad
Nag
pur
Rai
gad
Tha
ne
Pune
*Mum
bai
Per c
apita
(Rs.)
Districts from
Maharashtra
Maharashtra (Exclu. Mumbai, Pune & Thane)
India
* Mumbai+Mumbai subSource: DES
Rest of Maharashtra
Vidarbha
Marathwada

6
Regional Imbalance (2009-10)
Rs. 74,027
Rs. 46,492
0
20000
40000
60000
80000
100000
120000
140000
Was
him
Nan
durb
ar
Gad
chir
oli
Osm
anab
ad
Hin
goli
Nan
ded
Bul
dhan
a
Lat
ur
Bee
d
Jaln
a
Parb
hani
Yav
atm
al
Dhu
le
Gon
dia
Am
rava
ti
Ahm
edna
gar
Sola
pur
Ako
la
Bha
ndar
a
Cha
ndra
pur
War
dha
Rat
nagi
ri
Sang
li
Jalg
aon
Sata
ra
Sind
hudu
rg
Kol
hapu
r
Nas
hik
Aur
anga
bad
Nag
pur
Rai
gad
Tha
ne
Pune
*Mum
bai
Per c
apita
(Rs.)
Districts
Maharashtra
India
Source: DES
Above national avg.
Below national avg.

7
Particulars Vidarbha(11)
Marathwada(8)
Rest of Maharashtra
(16)
Total (35)
Districts below state average
10 8 11 29
Districts below state average (Excluding Mumbai, Pune, Thane)
10 7 4 21
Districts below national average
3 7 1 11
Source: DES
Districtwise disparity in per capita income

Per Capita District Income (2009-10)
Gondiya
AhmadnagarMumbai
Mumbai (Suburban)
AurangabadJalna
Hingoli
Dhule
Gadchiroli
Kolhapur
BhandaraNagpurAmravati
AkolaBuldana
Jalgaon
ChandrapurNashik
Sindhudurg
Ratnagiri
SataraSolapur
OsmanabadPune
Beed
Thane
Latur
ParbhaniNanded
Yavatmal
Wardha
Washim
Nandurbar
Sangli
Raigarh
Below National Avg.Above National Avg.
National Avg. : Rs. 46,492
Highest : Rs. 1,25,506 (Mumbai)
Lowest : Rs. 36,087 (Washim )

* Source - RGI + NFHS-III (2005-06) @ Public Health Dept., GoM
Item Unit Target for XIth FYP
Present status
National Rank
IMR (2009) / ‘000 live births 17 31* 3
MMR / ‘0000 live births 50 130* 3
TFR (2008) Children / woman 2.1 2.0* 6
Institutional Deliveries Percent - 90@ 5
Malnutrition of Children (0-3 years) Percent 24.8 41.6+ 6
Anaemia among women (15-49 years) Percent 24.3 48.5+ 3
Literacy Rate -Male (2011) Percent 97.52 89.8* 2
Literacy Rate Female (2011) Percent 95.93 75.5* 2
9
Selected Indicators (Comparison with major States)
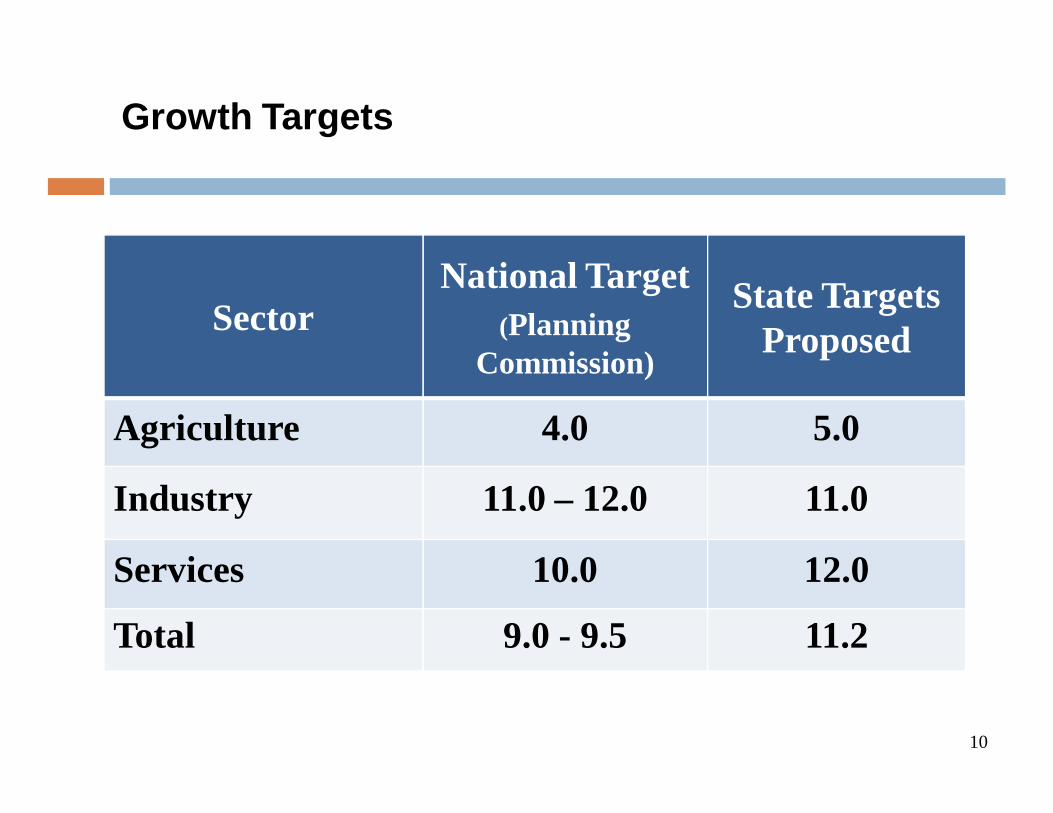
SectorNational Target
(Planning Commission)
State Targets Proposed
Agriculture 4.0 5.0
Industry 11.0 – 12.0 11.0
Services 10.0 12.0
Total 9.0 - 9.5 11.2
Growth Targets
10

11
XIIth FYP- Additional Challenges
Additional Challenges for Maharashtra Skill development & employability
Removing Regional Imbalance, and
Improvement of Human Development Index
Slum redevelopment & affordable housing
Water conservation

12
Steps taken by Maharashtra for inclusive growth
Rs. 375 cr. per year for 125 (1/3rd) backward tehsils for HDI
Reimbursement of fees for OBC students
First State to establish dept. for Minorities Development
Separate dept. for MSME
Special schemes for Women & children and senior citizens
Special schemes for SC, ST and minorities

Poverty
13
Total Population (2011 Census) - 11.24 cr.
Total Households (2011 Census) - 2.39 cr.
Total BPL population (26.4 % ) - 2.97 cr.
Total BPL Households - 63.12 lakh
With 2 per cent reduction every year, - 57.06 lakh
total BPL households at the end of 2016-17

14
Expectations fromPlanning Commission

Expectations from Planning Commission
15
Water Resources : Irrigation – AIBP Norms be changed -
• Increase in present norm of 2.0 Lakh Per Hectare to 3.0 LakhPer Hectare for MI Schemes
• Full Central assistance in one installment at early stage offinancial year
• GoI share be increased from 25% to 75% (For projects otherthan DPAP and Tribal Areas)
• Norm of inclusion be relaxed for a project against acompleted project for reforming State

Expectations from Planning Commission
16
Water Resources contd.:
• All MI (other than DPAP & tribal areas ) projects beincluded under AIBP for reforming State
• Inclusion of command area works under AIBP
• Completion period for major/medium projects beincreased to 6-7 years & 3-4 years for minor irrigationschemes

17
Expectations from Planning Commission
Energy :
Supply of crushed and washed coal by domestic coalcompanies would result in reduction oftransportation cost and improvement of performance
Allocation of domestic (KG-Basin) gas should beconsidered on priority to Maharashtra which haspoor hydro potential

18
Expectations from Planning Commission
Urban Development :
Urbanization – More Funds needed for JNNURM
Separate Sub-mission needed for Mega Cities
Increase allocation for the UIDSSMT
Extend support for JnNURM till 2013-14

Meeting Special Requirements of MumbaiSector Total Cost
(Rs. Cr)Share Requested
(Rs. Cr)
Roads Coastal Road (JnNURM) 6,000 2,100
MTHL (JnNURM) 20,000 4,000
Utility Duct (JnNURM) 6,000 2,100
Water Supply and Sewage
River Linking 3,500 3,500
Water Supply Project(JnNURM) 10,500 3,675
Sewerage Project(JnNURM) 5,700 1,995
Storm Water Drain
Brimstowad 2,350 2,350
Meethi River (JnNURM) 1,000 350
Other Rivers (JnNURM) 600 210
Total 55,650 20,28019

Meeting Special Requirements of Mumbai (contd.)
Support for RAYTotal JnNURM : Rs. 10,430 Cr.River Linking : Rs. 3,500 CrVGF(MTHL) : Rs. 4,000 Cr.PM Grants (BRIMSTOWAD) : Rs. 2,350 Cr.Difference of 35,370 Cr will be met by MCGM,
MMRDA, GOM through Budget or PPP
20

21
Expectations from Planning Commission
Housing :
Redevelopment of slums requires special attention
Implement RAY in all ULBs, not just 24
Frame policy for slums on GoI lands
Target construction of 10 lakh houses in XIIth FYP
Slum-free Mumbai :
Request to support MCGM for slum free city
Assistance to the tune of 50% of cost of construction (RAY)

22
Expectations from Planning Commission
Rural Development :
Raising cost of construction upto Rs. 1 lakh under IAY
To make rural Maharashtra Hut Free, State’s annual target underIAY be increased from 1.5 lakh houses to 2.6 lakh houses
For rural APL families with lower income, State govt. Isimplementing an interest subvention scheme. GoI should acceptthis as a plan scheme & extend support to State
Under PMGSY, strengthening of rural roads constructed in thepast under EGS should be taken up

23
Expectations from Planning Commission
Rural Development contd.:Extend BRGF to five more districts viz. Akola, Washim, Wardha,
Parbhani & Osmanabad (prone to crop failures & farmerssuicides)
Extend financial support to ‘Eco-Village’ scheme for sustainableenvironment
Raise the limit of administrative expenses to 9% in MG-NREGA

24
Expectations from Planning Commission
Water Supply & Sanitation :
Initiate sector specific programme specially for watersupply & sanitation or revise JNNURM or UIDSSMTCo-operation in establishing national/regional resource
centre in the state to address the specific schemes forsanitationSpecial scheme for water quality testing cell at field level

25
Expectations from Planning Commission
School Education :
Rashtriya Madhyamik Shiksha Abhiyan (RMSA)• Private schools in Maharashtra – 90%
• Request to include private schools in RMSA
Financial support for electricity & functional toilets in primaryschools along with separate toilets for girls
• Norm of Rs. 30,000 /- not sufficent for quality toilets
• May be increased to Rs. 60,000/- as per urban norms
Anganwadis :
Support for anganwadis and kitchen for cooking meals

26
Expectations from Planning Commission
Public Health :NRHM be continued during XIIth FYP
Initiate National Urban Health Mission Programme
Expand the scope of Non-communicable Diseases Scheme towhole State
Initiate Geriatric Health care scheme
Higher Education :Establishment of Institute of Information Technology in
Mumbai-Pune corridor
Establishment of IIT (apart from IIT-Mumbai) & IIM

27
Expectations from Planning Commission
Transport :Rs. 6,412 cr. annually for maintenance of road network
Support to develop road network of 36,000 km. in next 10 years
Support for rural transport fleet augmentation
Modernization and technical upgradation of railways; shift fromroad to rail transport

28
Expectations from Planning Commission
Food & Civil Supply :Ensure food security in the State on a sustainable basis
Market intervention fund be set up for ensuring adequateavailability of food development on sustainable basis
Necessity of market reforms for free and smooth movementof food grains and other essential commodities within thecountry and State

29
Expectations from Planning Commission
Home :
Coastal Security – more funds needed from Centre
More Allocation for Security in Naxalite-Prone Districts
Central assistance for raising special forces & equipping themwith modern weapons & equipments to tackle naxalite menace
Home ministry to provide 100% funds for railways & airportsin naxal affected areas
30
Expectations from Planning Commission
Textile :
TUF Scheme may be continued in XII FYP
Special scheme of capital subsidy for cotton growing districts
Law & Judiciary :
Infrastructure development for subordinate judiciary

31
Expectations from Planning Commission
Social Justice :
Assistance for six special courts for PCR & POA Act
Arrears of Rs. 1,633 crore for Post-matric scholarship for OBCfrom 2001-02 to till date may be paid
Enhance limit for Post-matric Scholarship for OBCs from presentRs. 44,500 to Rs. 2 lakh
Financial support for establishment of six residential school uptoclass XII & six degree colleges for disabled

32
Thank You

33
Sector 2007-08 2008-09 2009-10 2010-11
Agriculture & allied activities
13.2(5.8)
-4.1(-0.2)
3.1(0.4)
12.5(5.4)
Industry 8.6(9.7)
4.7(4.4)
8.5(8.0)
9.1(8.1)
Services 11.6(10.3)
11.4(10.1)
9.6(10.1)
10.9(9.6)
GSDP/ GDP 10.8(9.3)
7.8(6.8)
8.7(8.0)
10.5(8.6)
Sectoral Growth Rates of GSDP
Back
Source: DES Figures in bracket indicate GDP growth rates

Particulars Outlay Expenditure
2007-08 20,250 19,422
2008-09 25,000 22,870
2009-10 35,958 27,731
2010-11 37,916 34,795
2011-12 41,500 -
Total of XIth FYP 1,60,624 1,04,818*
XIth FYP- Outlays & Expenditure
* Total expenditure upto 2010-11Source: DES
34Back
(Rs. crore)

Year Outlay
2012-13 45,000
2013-14 50,000
2014-15 58,000
2015-16 67,000
2016-17 80,000
Total 3,00,000
XIIth FYP- Proposed Annual Outlay
Source: DES
35Back
(Rs. crore)

Industry Subsector Growth rate in XIth FYP
Mining 2.7
Registered manufacturing 6.7
Un-registered manufacturing 6.2
Construction 10.9
Electricity gas and water supply 8.5
Industry sector (Total) 7.7
Growth rates of Industry subsectors
Source: DES 36Back
(Rs. crore)

Particulars 2009-10 2012-13 2013-14 2014-15 2015-16 2016-17
GSDP (Rs. Crore) 9,01,330 13,70,404 15,81,391 18,25,151 21,06,818 24,32,335
Fiscal deficit as percentage of GSDP
2.90 2.70 2.62 2.57 2.50 2.50
Revenue as percentage of GSDP
9.60 10.23 10.28 10.33 10.41 10.46
Non-plan expenditure as percentage of GSDP
9.07 9.38 9.25 9.15 9.10 9.05
Plan expenditure as percentage of GSDP
3.53 3.30 3.40 3.50 3.60 3.70
Plan size (Rs in crore) 31,879 45,210 53,750 63,875 75,600 90,000
Internal extra budgetary resources as percntage of GSDP
- 1.50 1.50 1.50 1.50 1.50
Total plan including PSU plan (Rs in crore) @
- 65,766 77,471 91,252 1,07,202 1,26,485
State Finances