presentation 10 djg - gollner fire research group · –wildland fire hazard mitigation plan (nfpa...
TRANSCRIPT
6/14/2016
1
Department of Fire Protection Engineering
A. JAMES CLARK SCHOOL of ENGINEERING ● UNIVERSITY of MARYLAND
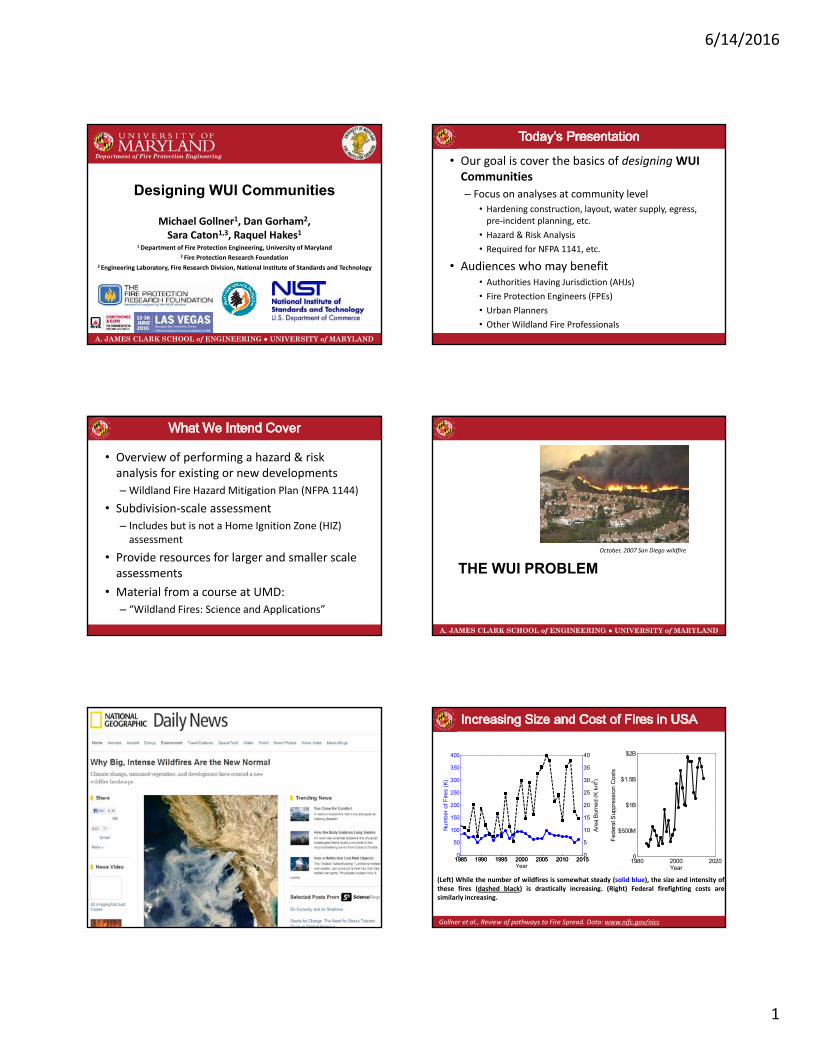
Designing WUI Communities
Michael Gollner1, Dan Gorham2, Sara Caton1,3, Raquel Hakes1
1 Department of Fire Protection Engineering, University of Maryland2 Fire Protection Research Foundation
3 Engineering Laboratory, Fire Research Division, National Institute of Standards and Technology
• Our goal is cover the basics of designing WUICommunities
– Focus on analyses at community level
• Hardening construction, layout, water supply, egress, pre‐incident planning, etc.
• Hazard & Risk Analysis
• Required for NFPA 1141, etc.
• Audiences who may benefit• Authorities Having Jurisdiction (AHJs)
• Fire Protection Engineers (FPEs)
• Urban Planners
• Other Wildland Fire Professionals
• Overview of performing a hazard & risk analysis for existing or new developments
– Wildland Fire Hazard Mitigation Plan (NFPA 1144)
• Subdivision‐scale assessment
– Includes but is not a Home Ignition Zone (HIZ) assessment
• Provide resources for larger and smaller scale assessments
• Material from a course at UMD:
– “Wildland Fires: Science and Applications”
A. JAMES CLARK SCHOOL of ENGINEERING ● UNIVERSITY of MARYLAND
THE WUI PROBLEM
October, 2007 San Diego wildfire
1985 1990 1995 2000 2005 2010 20150
50
100
150
200
250
300
350
400
Nu
mb
er o
f F
ires
(K)
1985 1990 1995 2000 2005 2010 20150
5
10
15
20
25
30
35
40
Year
Are
a B
urne
d (
K k
m2 )
1980 2000 20200
$500M
$1B
$1.5B
$2B
Fed
era
l Sup
pre
ssio
n C
ost
s
Year
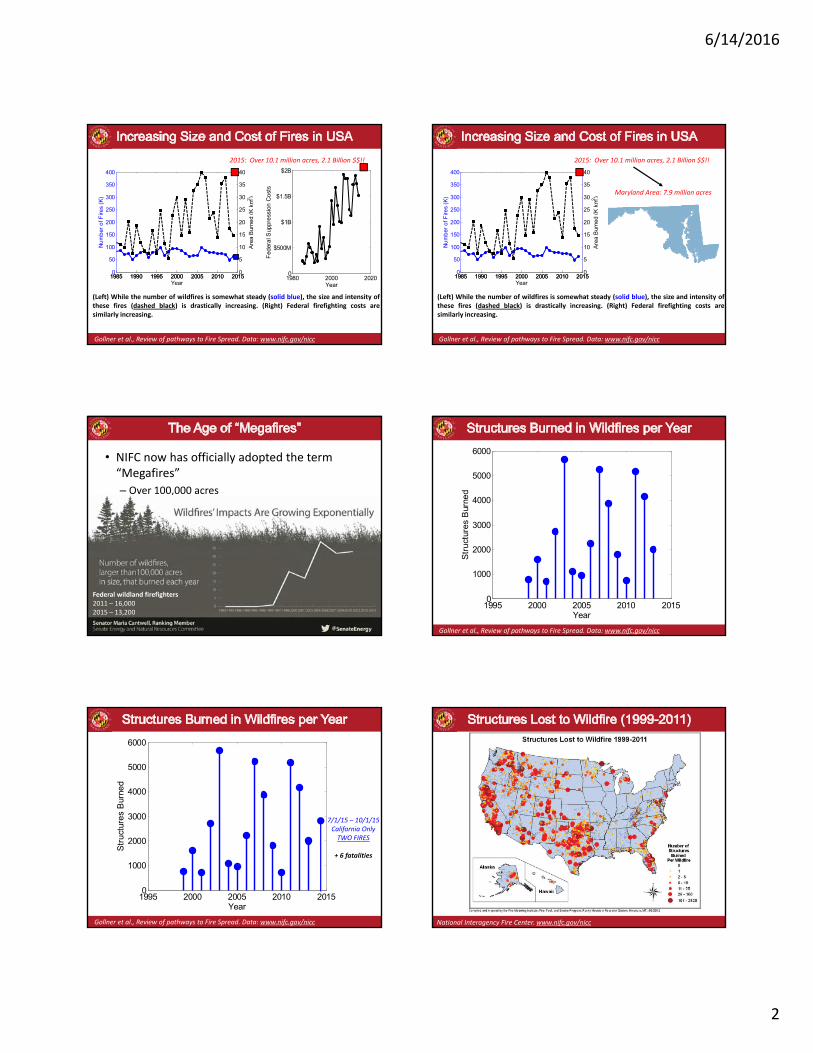
Gollner et al., Review of pathways to Fire Spread. Data: www.nifc.gov/nicc
(Left) While the number of wildfires is somewhat steady (solid blue), the size and intensity ofthese fires (dashed black) is drastically increasing. (Right) Federal firefighting costs aresimilarly increasing.
6/14/2016
2
(Left) While the number of wildfires is somewhat steady (solid blue), the size and intensity ofthese fires (dashed black) is drastically increasing. (Right) Federal firefighting costs aresimilarly increasing.
Gollner et al., Review of pathways to Fire Spread. Data: www.nifc.gov/nicc
1985 1990 1995 2000 2005 2010 20150
50
100
150
200
250
300
350
400
Nu
mb
er o
f F
ires
(K)
1985 1990 1995 2000 2005 2010 20150
5
10
15
20
25
30
35
40
Year
Are
a B
urne
d (
K k
m2 )
1980 2000 20200
$500M
$1B
$1.5B
$2B
Fed
era
l Sup
pre
ssio
n C
ost
s
Year
2015: Over 10.1 million acres, 2.1 Billion $$!!
(Left) While the number of wildfires is somewhat steady (solid blue), the size and intensity ofthese fires (dashed black) is drastically increasing. (Right) Federal firefighting costs aresimilarly increasing.
Gollner et al., Review of pathways to Fire Spread. Data: www.nifc.gov/nicc
1985 1990 1995 2000 2005 2010 20150
50
100
150
200
250
300
350
400
Nu
mb
er o
f F
ires
(K)
1985 1990 1995 2000 2005 2010 20150
5
10
15
20
25
30
35
40
Year
Are
a B
urne
d (
K k
m2 )
Maryland Area: 7.9 million acres
2015: Over 10.1 million acres, 2.1 Billion $$!!
• NIFC now has officially adopted the term “Megafires”
– Over 100,000 acres
– 18 this year – more to come (e.g. Santa Ana winds…)
Federal wildland firefighters2011 – 16,0002015 – 13,200
1995 2000 2005 2010 20150
1000
2000
3000
4000
5000
6000
Year
Str
uct
ure
s B
urne
d
Gollner et al., Review of pathways to Fire Spread. Data: www.nifc.gov/nicc
1995 2000 2005 2010 20150
1000
2000
3000
4000
5000
6000
Year
Str
uct
ure
s B
urne
d
7/1/15 – 10/1/15California OnlyTWO FIRES
+ 6 fatalities
Gollner et al., Review of pathways to Fire Spread. Data: www.nifc.gov/nicc National Interagency Fire Center. www.nifc.gov/nicc
6/14/2016
3
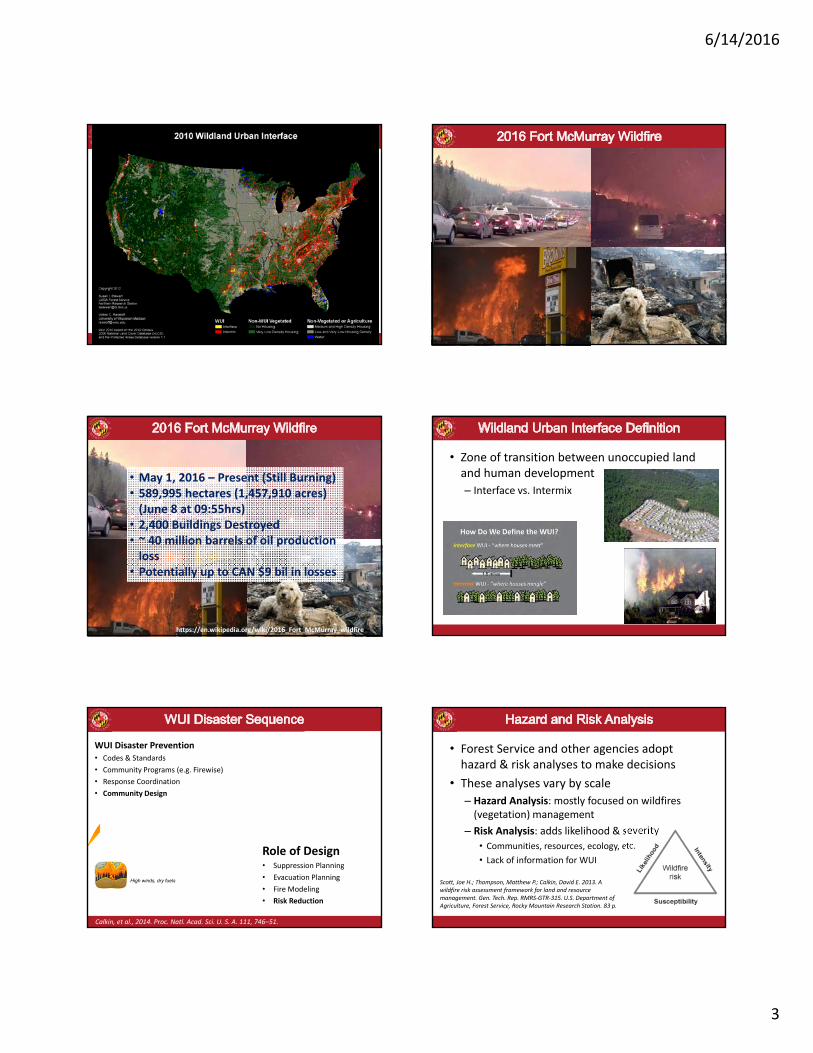
• May 1, 2016 – Present (Still Burning)• 589,995 hectares (1,457,910 acres) (June 8 at 09:55hrs)
• 2,400 Buildings Destroyed• ~ 40 million barrels of oil production loss
• Potentially up to CAN $9 bil in losses
https://en.wikipedia.org/wiki/2016_Fort_McMurray_wildfire
• Zone of transition between unoccupied land and human development
– Interface vs. Intermix
Severe Wildfire Conditions
Extreme Fire Behavior
WUI Fire Disaster
High winds, dry fuels
High fire intensity & growth rates
Many home ignitions
Overwhelmed resources diminish in effectiveness
Fire Protection Resources
Residential Fires
Potentially 100’s + homes destroyed
WUI Disaster Prevention• Codes & Standards
• Community Programs (e.g. Firewise)
• Response Coordination
• Community Design
Role of Design• Suppression Planning
• Evacuation Planning
• Fire Modeling
• Risk Reduction
Calkin, et al., 2014. Proc. Natl. Acad. Sci. U. S. A. 111, 746–51.
• Forest Service and other agencies adopt hazard & risk analyses to make decisions
• These analyses vary by scale
– Hazard Analysis: mostly focused on wildfires (vegetation) management
– Risk Analysis: adds likelihood & severity
• Communities, resources, ecology, etc.
• Lack of information for WUI
Scott, Joe H.; Thompson, Matthew P.; Calkin, David E. 2013. A wildfire risk assessment framework for land and resource management. Gen. Tech. Rep. RMRS‐GTR‐315. U.S. Department of Agriculture, Forest Service, Rocky Mountain Research Station. 83 p.
6/14/2016
4
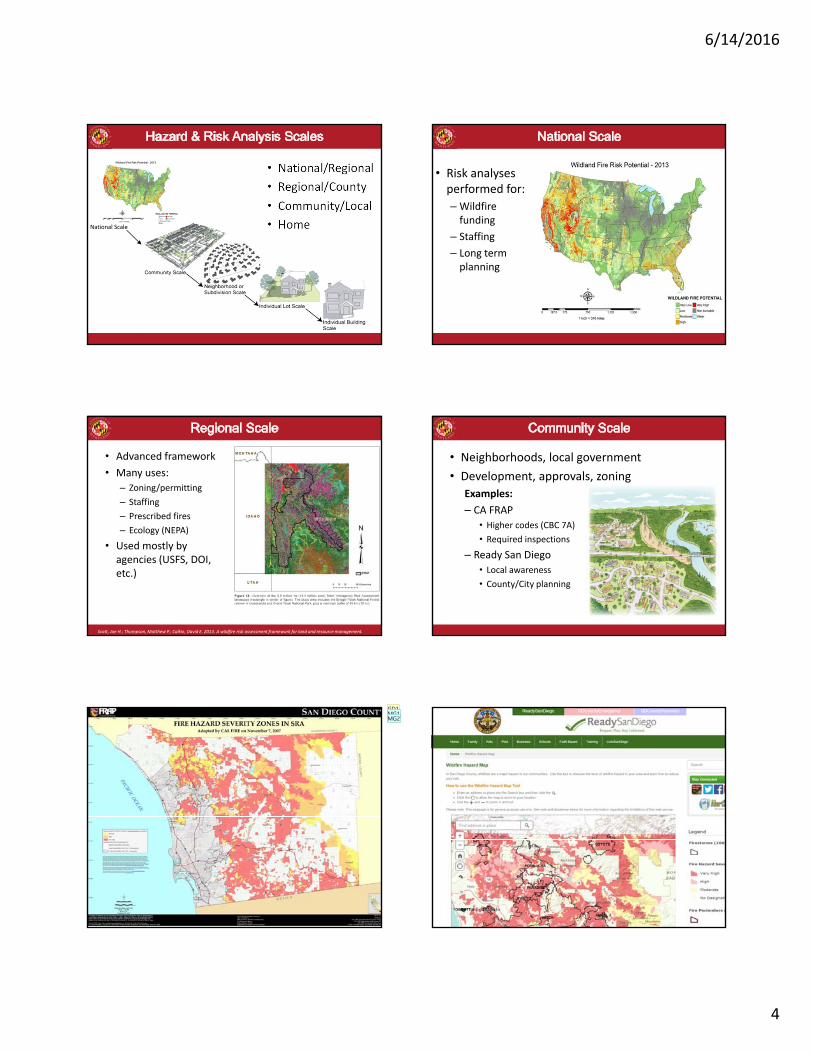
• National/Regional
• Regional/County
• Community/Local
• HomeNational Scale
• Risk analyses performed for:
– Wildfire funding
– Staffing
– Long term planning
• Advanced framework
• Many uses:
– Zoning/permitting
– Staffing
– Prescribed fires
– Ecology (NEPA)
• Used mostly by agencies (USFS, DOI, etc.)
Scott, Joe H.; Thompson, Matthew P.; Calkin, David E. 2013. A wildfire risk assessment framework for land and resource management.
• Neighborhoods, local government
• Development, approvals, zoning
Examples:
– CA FRAP
• Higher codes (CBC 7A)
• Required inspections
– Ready San Diego
• Local awareness
• County/City planning
GD1MG1MG2

Slide 23
GD1 What is the point of this (and th next couple) of slideS? Are they inputs for the community level assessment?Gorham, Daniel, 6/13/2016
MG1 These are examples of uses, and they were too small to put on the side there. It's an idea ofMichael Gollner, 6/14/2016
MG2 the scale, because in this case it's all the counties in a state, even though it would be defined as "community"Michael Gollner, 6/14/2016
6/14/2016
5
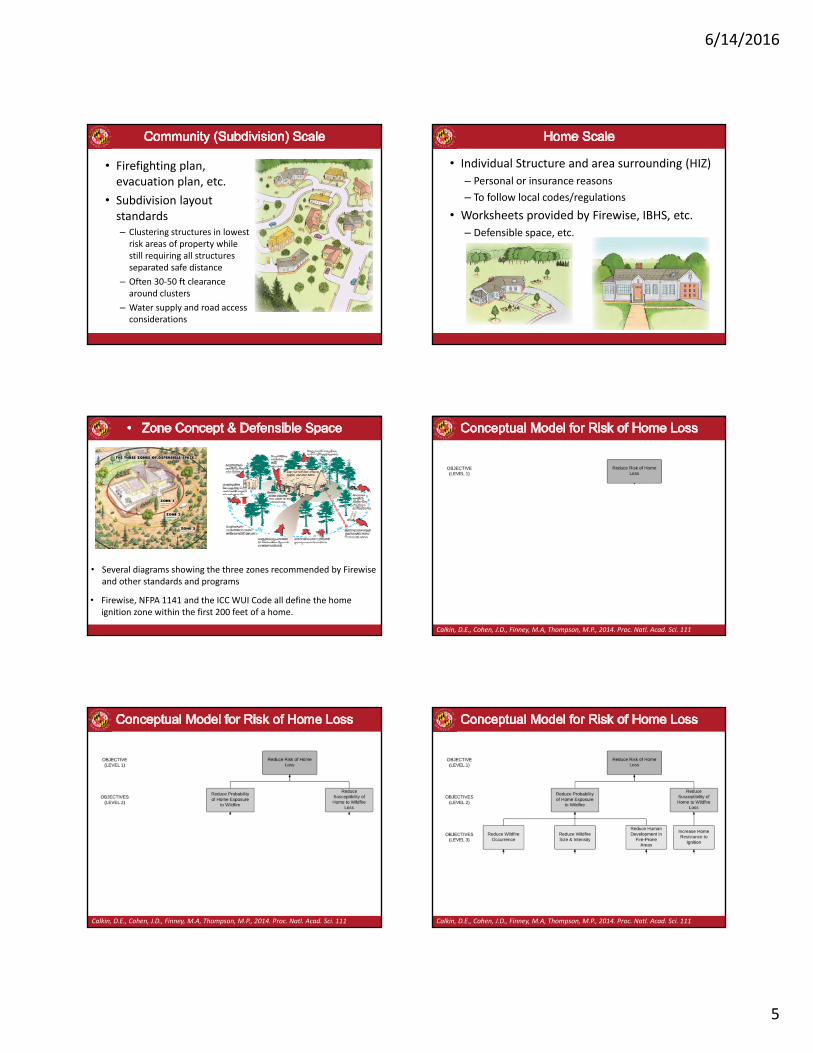
• Firefighting plan, evacuation plan, etc.
• Subdivision layout standards– Clustering structures in lowest risk areas of property while still requiring all structures separated safe distance
– Often 30‐50 ft clearance around clusters
– Water supply and road access considerations
• Individual Structure and area surrounding (HIZ)
– Personal or insurance reasons
– To follow local codes/regulations
• Worksheets provided by Firewise, IBHS, etc.
– Defensible space, etc.
• Several diagrams showing the three zones recommended by Firewiseand other standards and programs
• Firewise, NFPA 1141 and the ICC WUI Code all define the home ignition zone within the first 200 feet of a home.
Calkin, D.E., Cohen, J.D., Finney, M.A, Thompson, M.P., 2014. Proc. Natl. Acad. Sci. 111
Calkin, D.E., Cohen, J.D., Finney, M.A, Thompson, M.P., 2014. Proc. Natl. Acad. Sci. 111 Calkin, D.E., Cohen, J.D., Finney, M.A, Thompson, M.P., 2014. Proc. Natl. Acad. Sci. 111
6/14/2016
6
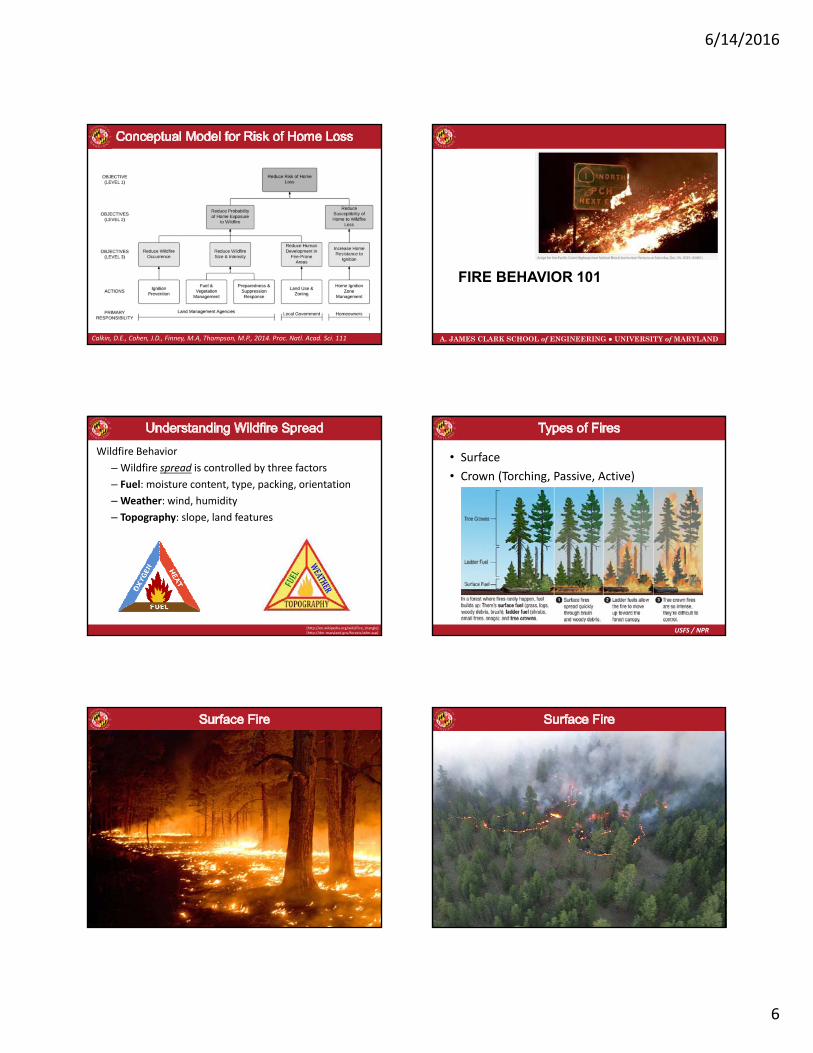
Calkin, D.E., Cohen, J.D., Finney, M.A, Thompson, M.P., 2014. Proc. Natl. Acad. Sci. 111 A. JAMES CLARK SCHOOL of ENGINEERING ● UNIVERSITY of MARYLAND
FIRE BEHAVIOR 101
Wildfire Behavior
– Wildfire spread is controlled by three factors
– Fuel: moisture content, type, packing, orientation
– Weather: wind, humidity
– Topography: slope, land features
[http://en.wikipedia.org/wiki/Fire_triangle][http://dnr.maryland.gov/forests/wfm.asp]
• Surface
• Crown (Torching, Passive, Active)
USFS / NPR
6/14/2016
7
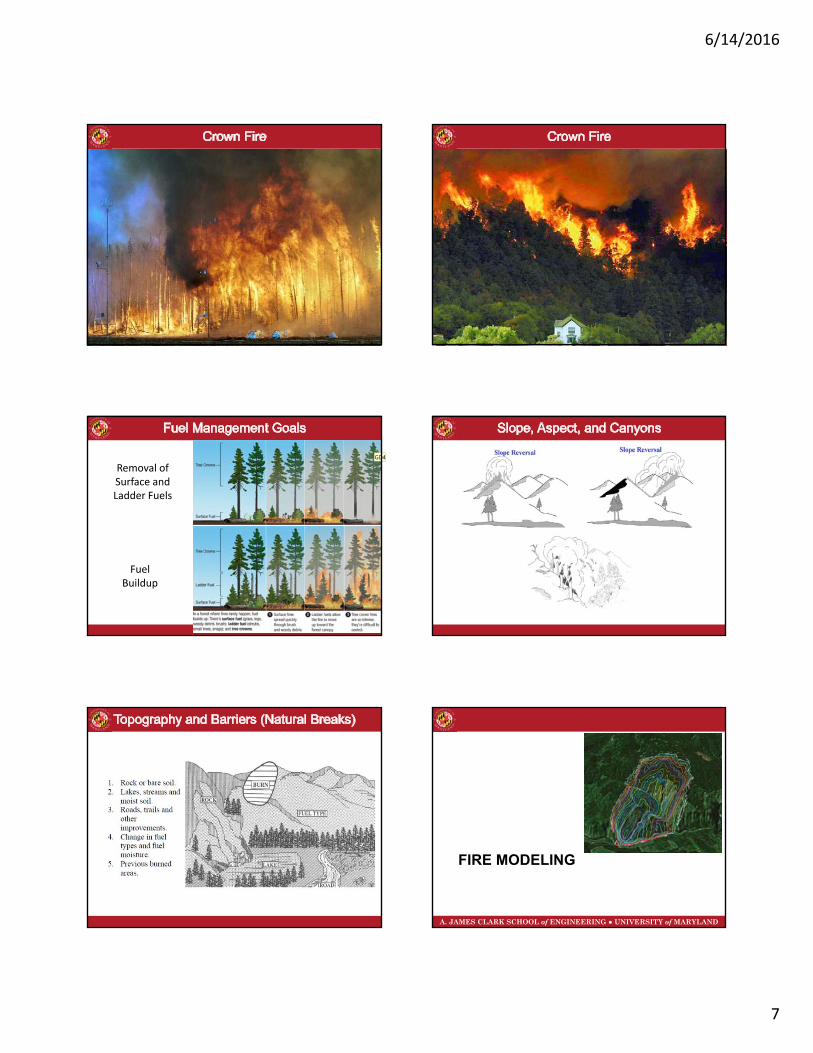
Removal of Surface and Ladder Fuels
Fuel Buildup
GD4
A. JAMES CLARK SCHOOL of ENGINEERING ● UNIVERSITY of MARYLAND
FIRE MODELING

Slide 39
GD4 Are you going to explain how this is the fire behavior when you have fuel management? consider starting with the previous picture again and then shwoing this for comparison.Gorham, Daniel, 6/13/2016
6/14/2016
8
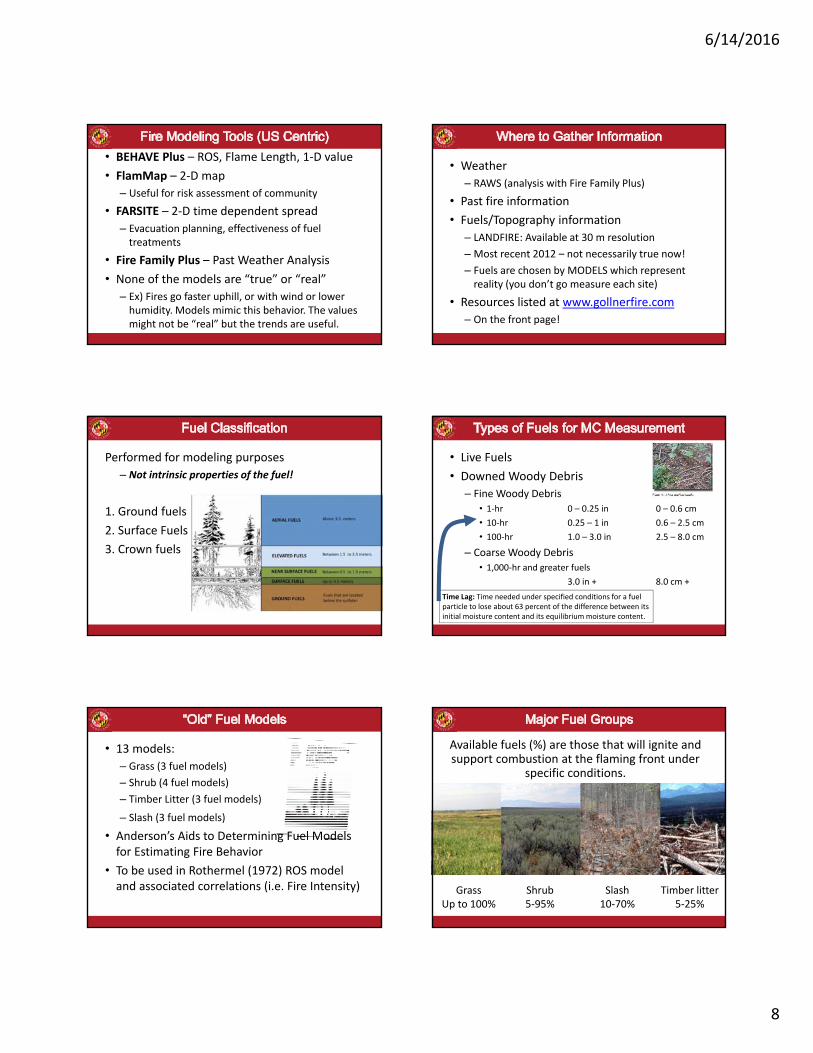
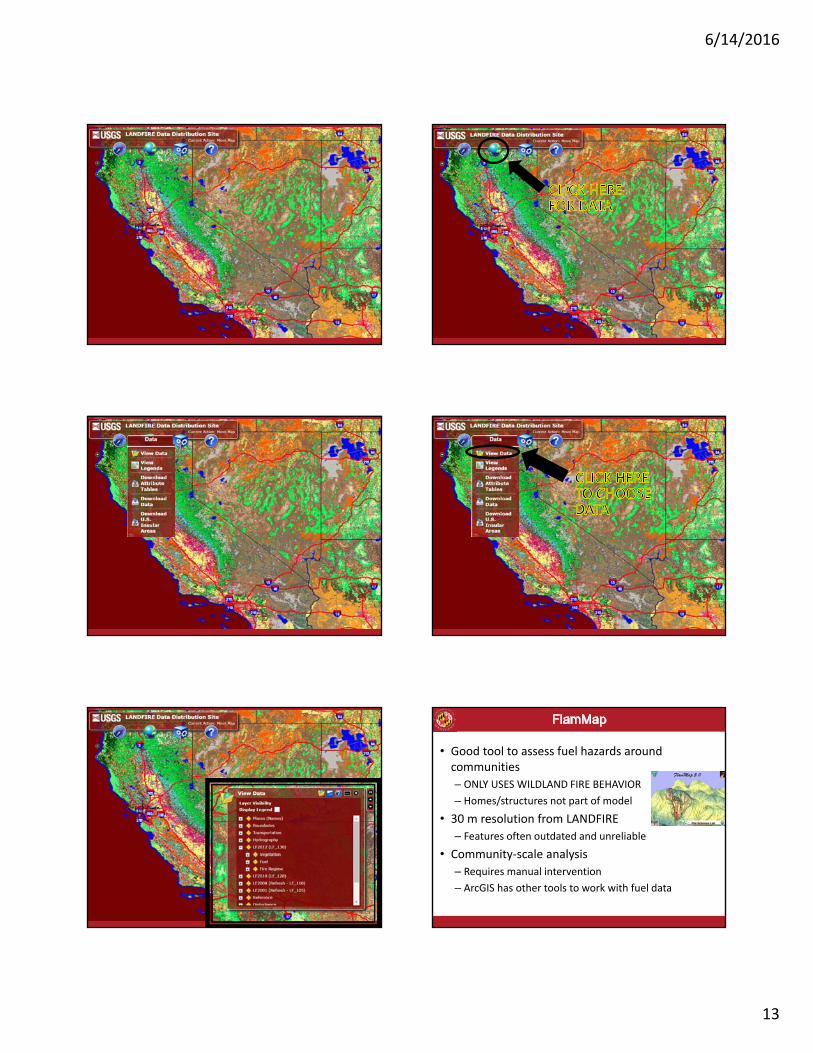
• BEHAVE Plus – ROS, Flame Length, 1‐D value
• FlamMap – 2‐D map
– Useful for risk assessment of community
• FARSITE – 2‐D time dependent spread
– Evacuation planning, effectiveness of fuel treatments
• Fire Family Plus – Past Weather Analysis
• None of the models are “true” or “real”
– Ex) Fires go faster uphill, or with wind or lower humidity. Models mimic this behavior. The values might not be “real” but the trends are useful.
• Weather
– RAWS (analysis with Fire Family Plus)
• Past fire information
• Fuels/Topography information
– LANDFIRE: Available at 30 m resolution
– Most recent 2012 – not necessarily true now!
– Fuels are chosen by MODELS which represent reality (you don’t go measure each site)
• Resources listed at www.gollnerfire.com
– On the front page!
Performed for modeling purposes
– Not intrinsic properties of the fuel!
1. Ground fuels
2. Surface Fuels
3. Crown fuels
• Live Fuels
• Downed Woody Debris
– Fine Woody Debris
• 1‐hr 0 – 0.25 in 0 – 0.6 cm
• 10‐hr 0.25 – 1 in 0.6 – 2.5 cm
• 100‐hr 1.0 – 3.0 in 2.5 – 8.0 cm
– Coarse Woody Debris
• 1,000‐hr and greater fuels
3.0 in + 8.0 cm +
Time Lag: Time needed under specified conditions for a fuel particle to lose about 63 percent of the difference between its initial moisture content and its equilibrium moisture content.
• 13 models:
– Grass (3 fuel models)
– Shrub (4 fuel models)
– Timber Litter (3 fuel models)
– Slash (3 fuel models)
• Anderson’s Aids to Determining Fuel Models for Estimating Fire Behavior
• To be used in Rothermel (1972) ROS model and associated correlations (i.e. Fire Intensity) Grass
Up to 100%Shrub5‐95%
Slash10‐70%
Timber litter5‐25%
Available fuels (%) are those that will ignite and support combustion at the flaming front under
specific conditions.
6/14/2016
9
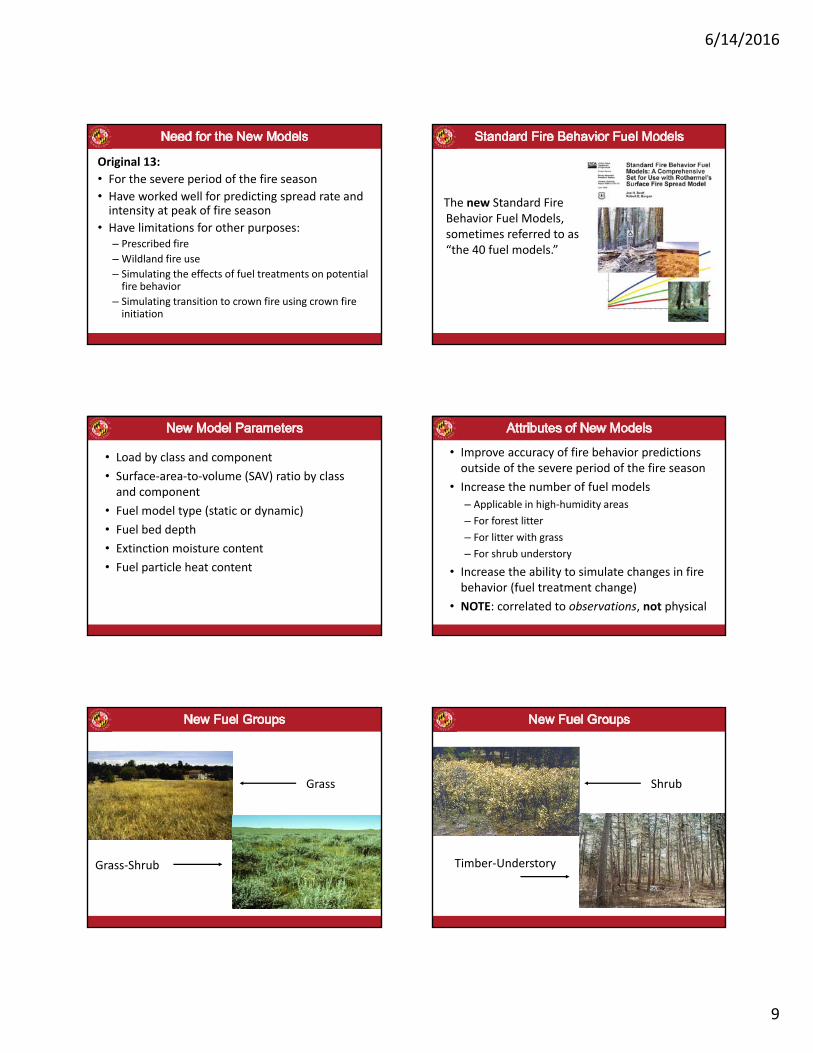
Original 13:
• For the severe period of the fire season
• Have worked well for predicting spread rate and intensity at peak of fire season
• Have limitations for other purposes:– Prescribed fire
– Wildland fire use
– Simulating the effects of fuel treatments on potential fire behavior
– Simulating transition to crown fire using crown fire initiation
The new Standard Fire Behavior Fuel Models, sometimes referred to as “the 40 fuel models.”
• Load by class and component
• Surface‐area‐to‐volume (SAV) ratio by class and component
• Fuel model type (static or dynamic)
• Fuel bed depth
• Extinction moisture content
• Fuel particle heat content
• Improve accuracy of fire behavior predictions outside of the severe period of the fire season
• Increase the number of fuel models
– Applicable in high‐humidity areas
– For forest litter
– For litter with grass
– For shrub understory
• Increase the ability to simulate changes in fire behavior (fuel treatment change)
• NOTE: correlated to observations, not physical
Grass
Grass‐Shrub
Shrub
Timber‐Understory
6/14/2016
10
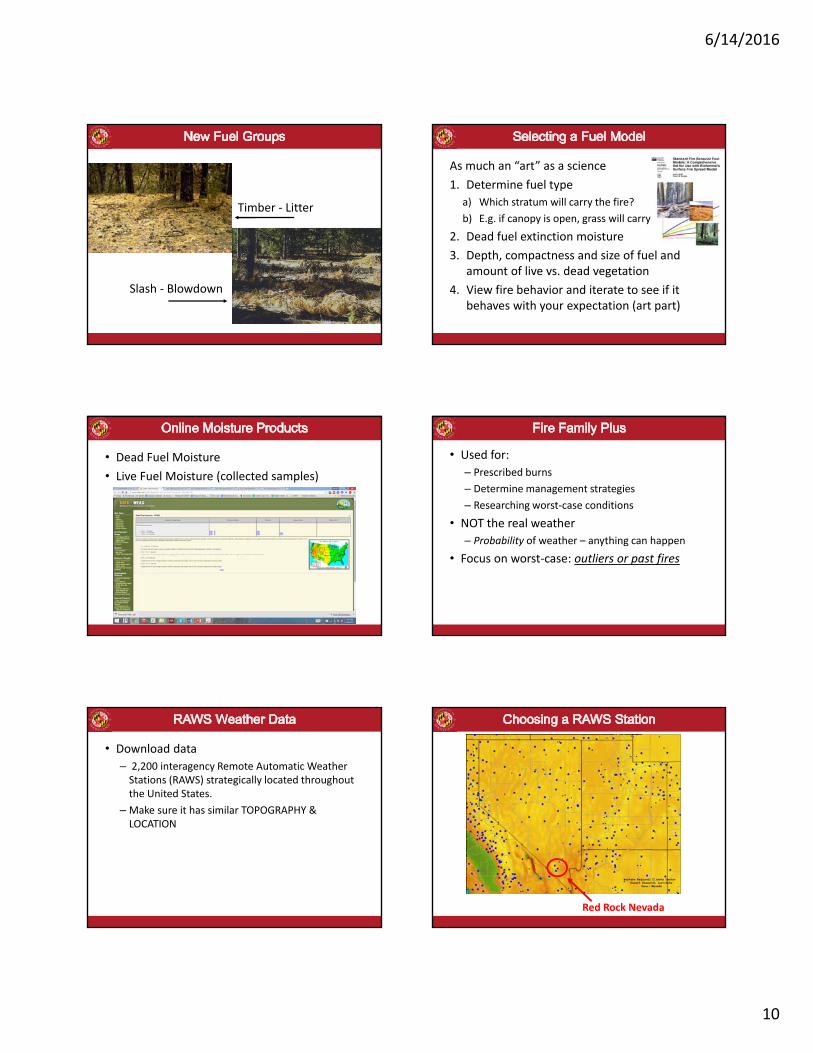
Slash ‐ Blowdown
Timber ‐ Litter
As much an “art” as a science
1. Determine fuel type
a) Which stratum will carry the fire?
b) E.g. if canopy is open, grass will carry
2. Dead fuel extinction moisture
3. Depth, compactness and size of fuel and amount of live vs. dead vegetation
4. View fire behavior and iterate to see if it behaves with your expectation (art part)
• Dead Fuel Moisture
• Live Fuel Moisture (collected samples)
• Used for:
– Prescribed burns
– Determine management strategies
– Researching worst‐case conditions
• NOT the real weather
– Probability of weather – anything can happen
• Focus on worst‐case: outliers or past fires
• Download data
– 2,200 interagency Remote Automatic Weather Stations (RAWS) strategically located throughout the United States.
– Make sure it has similar TOPOGRAPHY & LOCATION
Red Rock Nevada

6/14/2016
11
Pick Time Series Graph to get historical information over a given period on all relevant weather quantities
• Select elements to graph, especialy those required for the fire modeling tool you are using (e.g. both average wind speed and maximum wind gust for BEHAVE Plus).
• Different RAWS collect different data: try nearby stations if chosen RAWS doesn’t give a piece of information
Use worst‐case data rather than average!
Graph parameters over a year to determine which part of the year worst‐case conditions occur in
• Rate of Spread
• Surface Fire Intensity
• Flame Length
– Can be used to determine estimated radiant heat flux
• Scorch Height
• Fire Shape and Size
• Probability of Ignition from Firebrands/Lightning
• Crown fire spread rate, critical transition thresholds
• Spotting distance from a burning pile, torching trees, or a wind‐driven surface fire
– Maximum distance – not correlated to WUI ignition!!!
Can sample many possibilities FAST!
(1‐D only)

6/14/2016
12
• Fuels
– Anderson’s Fuel Model (1‐13)
– Or Scott & Burgan’s Model (1‐40)
– Fuel Moisture (live and dead)
• Weather
– Temperature
– Relative Humidity
– Wind speed and direction
• Topography
– Slope Steepness
Short Grass, 30% slope, 1% MC
6/14/2016
13
• Good tool to assess fuel hazards around communities
– ONLY USES WILDLAND FIRE BEHAVIOR
– Homes/structures not part of model
• 30 m resolution from LANDFIRE
– Features often outdated and unreliable
• Community‐scale analysis
– Requires manual intervention
– ArcGIS has other tools to work with fuel data
6/14/2016
14
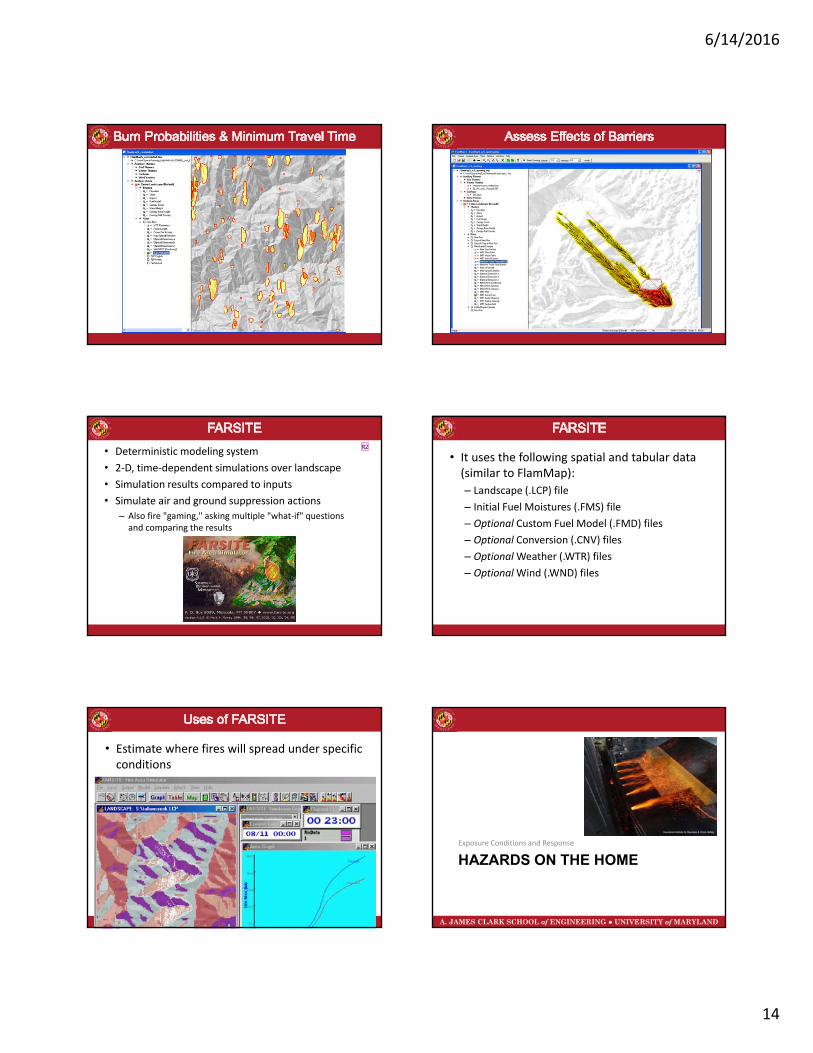
• Deterministic modeling system
• 2‐D, time‐dependent simulations over landscape
• Simulation results compared to inputs
• Simulate air and ground suppression actions
– Also fire "gaming," asking multiple "what‐if" questions and comparing the results
R2
• It uses the following spatial and tabular data (similar to FlamMap):
– Landscape (.LCP) file
– Initial Fuel Moistures (.FMS) file
– Optional Custom Fuel Model (.FMD) files
– Optional Conversion (.CNV) files
– Optional Weather (.WTR) files
– Optional Wind (.WND) files
• Estimate where fires will spread under specific conditions
A. JAMES CLARK SCHOOL of ENGINEERING ● UNIVERSITY of MARYLAND
HAZARDS ON THE HOMEExposure Conditions and Response

Slide 81
R2 Where is this from? Sounds like description from website? maybe change to bullet points?Raquel, 6/13/2016
6/14/2016
15
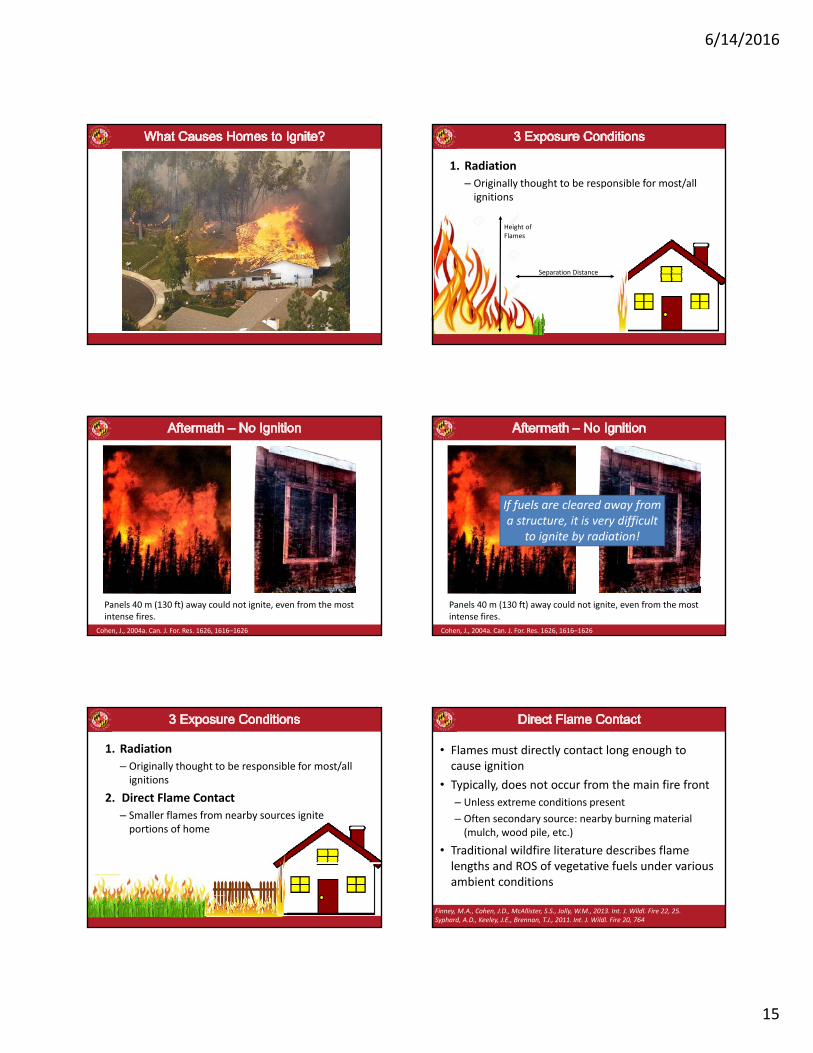
1. Radiation
– Originally thought to be responsible for most/all ignitions
Separation Distance
Height of Flames
Panels 40 m (130 ft) away could not ignite, even from the most intense fires.
Cohen, J., 2004a. Can. J. For. Res. 1626, 1616–1626
Panels 40 m (130 ft) away could not ignite, even from the most intense fires.
If fuels are cleared away from a structure, it is very difficult
to ignite by radiation!
Cohen, J., 2004a. Can. J. For. Res. 1626, 1616–1626
1. Radiation
– Originally thought to be responsible for most/all ignitions
2. Direct Flame Contact
– Smaller flames from nearby sources ignite portions of home
• Flames must directly contact long enough to cause ignition
• Typically, does not occur from the main fire front
– Unless extreme conditions present
– Often secondary source: nearby burning material (mulch, wood pile, etc.)
• Traditional wildfire literature describes flame lengths and ROS of vegetative fuels under various ambient conditions
Finney, M.A., Cohen, J.D., McAllister, S.S., Jolly, W.M., 2013. Int. J. Wildl. Fire 22, 25.Syphard, A.D., Keeley, J.E., Brennan, T.J., 2011. Int. J. Wildl. Fire 20, 764

6/14/2016
16
1. Radiation
– Originally thought to be responsible for most/all ignitions
2. Direct Flame Contact
– Smaller flames from nearby sources ignite portions of home
3. Embers or Firebrands
– Small burning pieces which ignite a structure or
nearby fuels
1. Radiation
– Originally thought to be responsible for most/all ignitions
2. Direct Flame Contact
– Smaller flames from nearby sources ignite portions of home
3. Embers or Firebrands
– Small burning pieces which ignite a structure or
nearby fuels
• Least understood of ignition pathways
• Typically broken into 3 processes
– Production/Generation
– Lofting/Transport• In 2007 NIST study in San Diego, firebrands arrived 1 hour before arrival of the flame front
• Travelled up to 9 km igniting properties over the following 9 hours
– Ignition/Deposition
• Of the three, Production and Ignition are least understood
SE Caton, RSP Hakes, DJ Gorham, A Zhou, MJ Gollner, Review of pathways for building fire spread in the wildland urban interface part I: exposure conditions. Fire Technology, 1‐45 Scott, Joe H. 2012. Introduction to Wildfire Behavior Modeling. National Interagency Fuels, Fire, & Vegetation Technology
Transfer.
• Buildings are engineered to passively protect people
– WUI environment relies on non‐standardized practices and active measures by homeowners
• Large flames must be within 100‐200 feet of the structure (the home ignition zone) in order to ignite them
• Because this distance is rarely met for sufficient duration, small flames or firebrands ignite most homes
– WUI fires can be thought of in terms of potential for home ignition
– The goal of decreasing home ignitability places much responsibility on the homeowner
Cohen, J., 2008. For. Hist. Today Fall, 20–26.
Roof
Vent
DormerValley
Eave GutterSiding
Gable
Deck
Fence
Mulch
Many areas addressed in codes/standards and HIZ assessments
6/14/2016
17
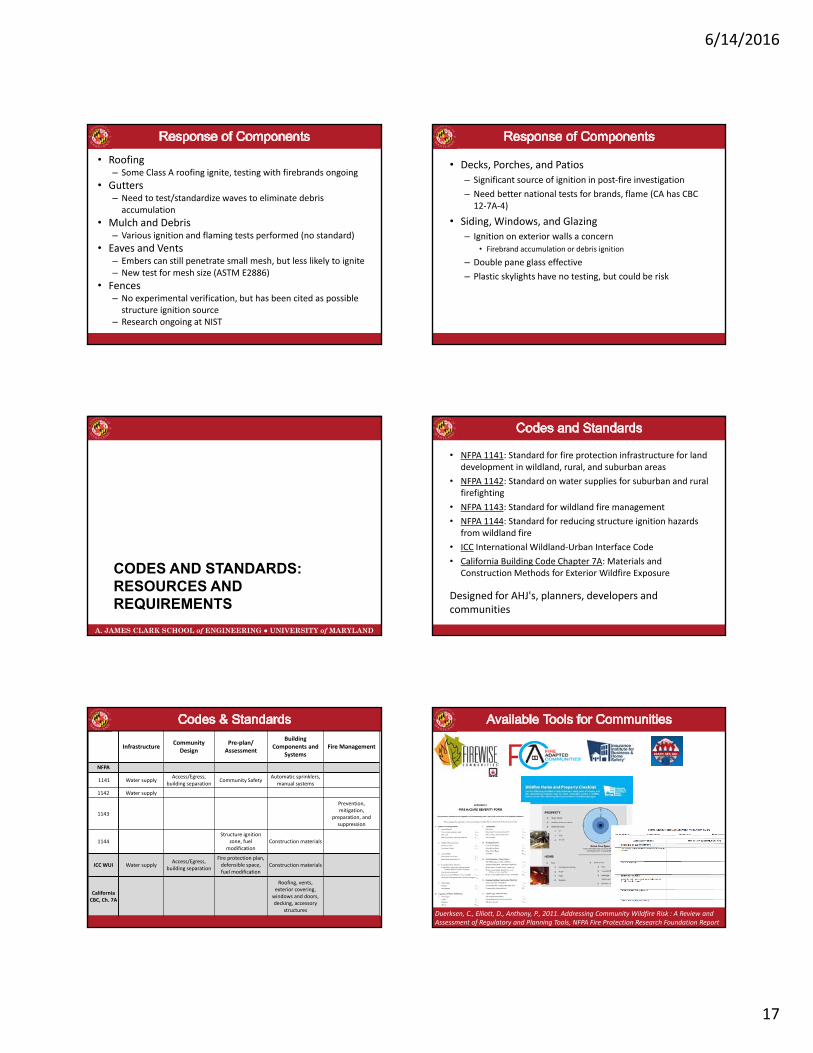
• Roofing– Some Class A roofing ignite, testing with firebrands ongoing
• Gutters– Need to test/standardize waves to eliminate debris accumulation
• Mulch and Debris– Various ignition and flaming tests performed (no standard)
• Eaves and Vents– Embers can still penetrate small mesh, but less likely to ignite– New test for mesh size (ASTM E2886)
• Fences– No experimental verification, but has been cited as possible structure ignition source
– Research ongoing at NIST
• Decks, Porches, and Patios
– Significant source of ignition in post‐fire investigation
– Need better national tests for brands, flame (CA has CBC 12‐7A‐4)
• Siding, Windows, and Glazing
– Ignition on exterior walls a concern • Firebrand accumulation or debris ignition
– Double pane glass effective
– Plastic skylights have no testing, but could be risk
A. JAMES CLARK SCHOOL of ENGINEERING ● UNIVERSITY of MARYLAND
CODES AND STANDARDS:RESOURCES AND REQUIREMENTS
• NFPA 1141: Standard for fire protection infrastructure for land development in wildland, rural, and suburban areas
• NFPA 1142: Standard on water supplies for suburban and rural firefighting
• NFPA 1143: Standard for wildland fire management
• NFPA 1144: Standard for reducing structure ignition hazards from wildland fire
• ICC International Wildland‐Urban Interface Code
• California Building Code Chapter 7A: Materials and Construction Methods for Exterior Wildfire Exposure
Designed for AHJ's, planners, developers and communities
InfrastructureCommunity
Design Pre‐plan/
Assessment
Building Components and
SystemsFire Management
NFPA
1141 Water supplyAccess/Egress,
building separationCommunity Safety
Automatic sprinklers, manual systems
1142 Water supply
1143
Prevention, mitigation,
preparation, and suppression
1144Structure ignition
zone, fuel modification
Construction materials
ICC WUI Water supplyAccess/Egress,
building separation
Fire protection plan, defensible space, fuel modification
Construction materials
CaliforniaCBC, Ch. 7A
Roofing, vents, exterior covering,
windows and doors, decking, accessory
structuresDuerksen, C., Elliott, D., Anthony, P., 2011. Addressing Community Wildfire Risk : A Review and Assessment of Regulatory and Planning Tools, NFPA Fire Protection Research Foundation Report
6/14/2016
18
A. JAMES CLARK SCHOOL of ENGINEERING ● UNIVERSITY of MARYLAND
COMMUNITY DESIGN
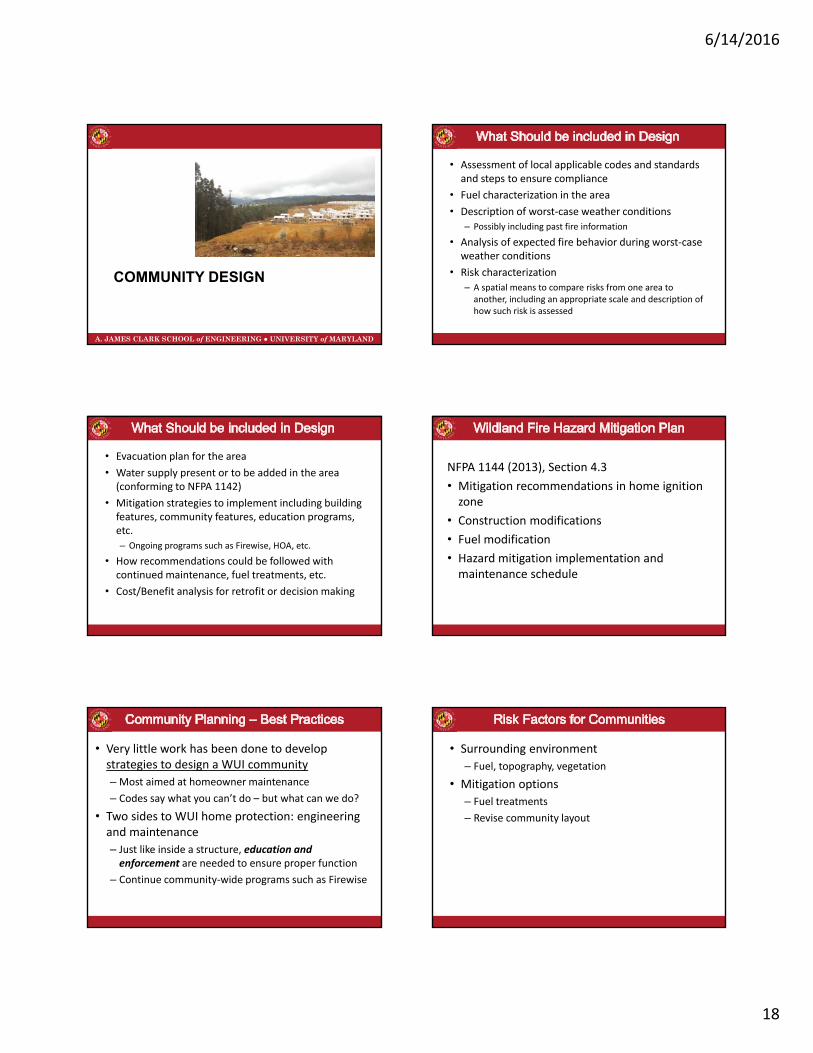
• Assessment of local applicable codes and standards and steps to ensure compliance
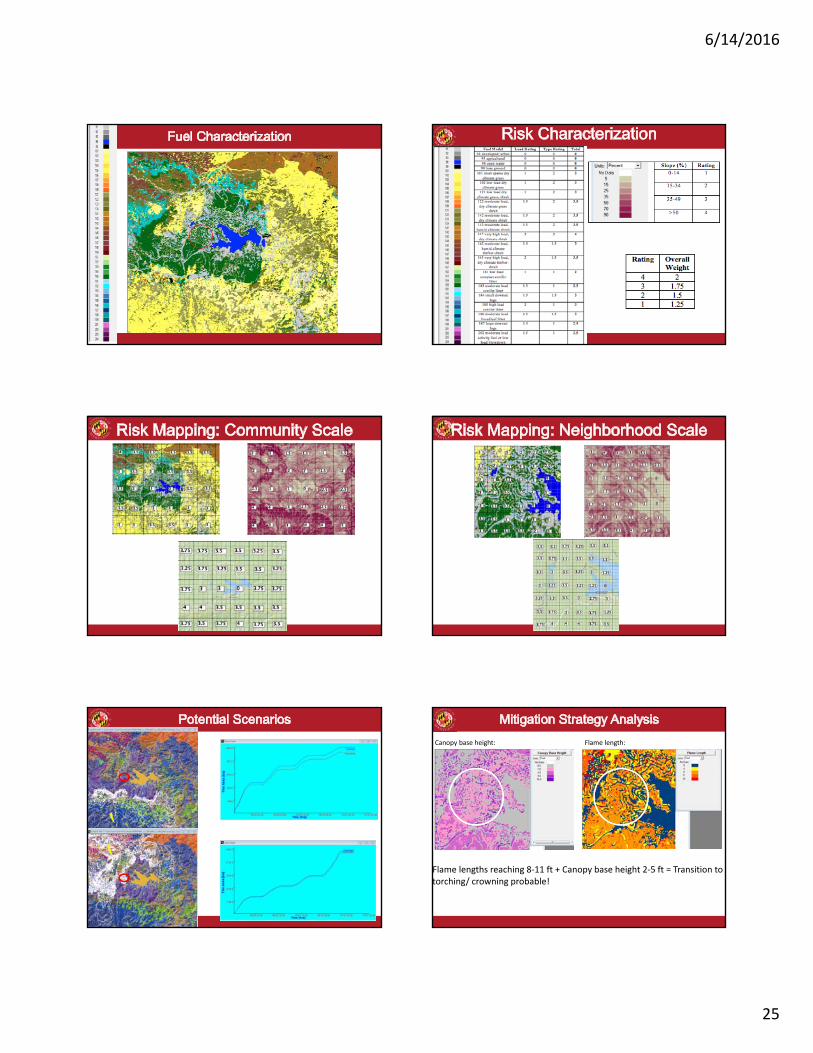
• Fuel characterization in the area
• Description of worst‐case weather conditions
– Possibly including past fire information
• Analysis of expected fire behavior during worst‐case weather conditions
• Risk characterization
– A spatial means to compare risks from one area to another, including an appropriate scale and description of how such risk is assessed
• Evacuation plan for the area
• Water supply present or to be added in the area (conforming to NFPA 1142)
• Mitigation strategies to implement including building features, community features, education programs, etc.
– Ongoing programs such as Firewise, HOA, etc.
• How recommendations could be followed with continued maintenance, fuel treatments, etc.
• Cost/Benefit analysis for retrofit or decision making
NFPA 1144 (2013), Section 4.3
• Mitigation recommendations in home ignition zone
• Construction modifications
• Fuel modification
• Hazard mitigation implementation and maintenance schedule
• Very little work has been done to develop strategies to design a WUI community
– Most aimed at homeowner maintenance
– Codes say what you can’t do – but what can we do?
• Two sides to WUI home protection: engineering and maintenance
– Just like inside a structure, education and enforcement are needed to ensure proper function
– Continue community‐wide programs such as Firewise
• Surrounding environment
– Fuel, topography, vegetation
• Mitigation options
– Fuel treatments
– Revise community layout
6/14/2016
19
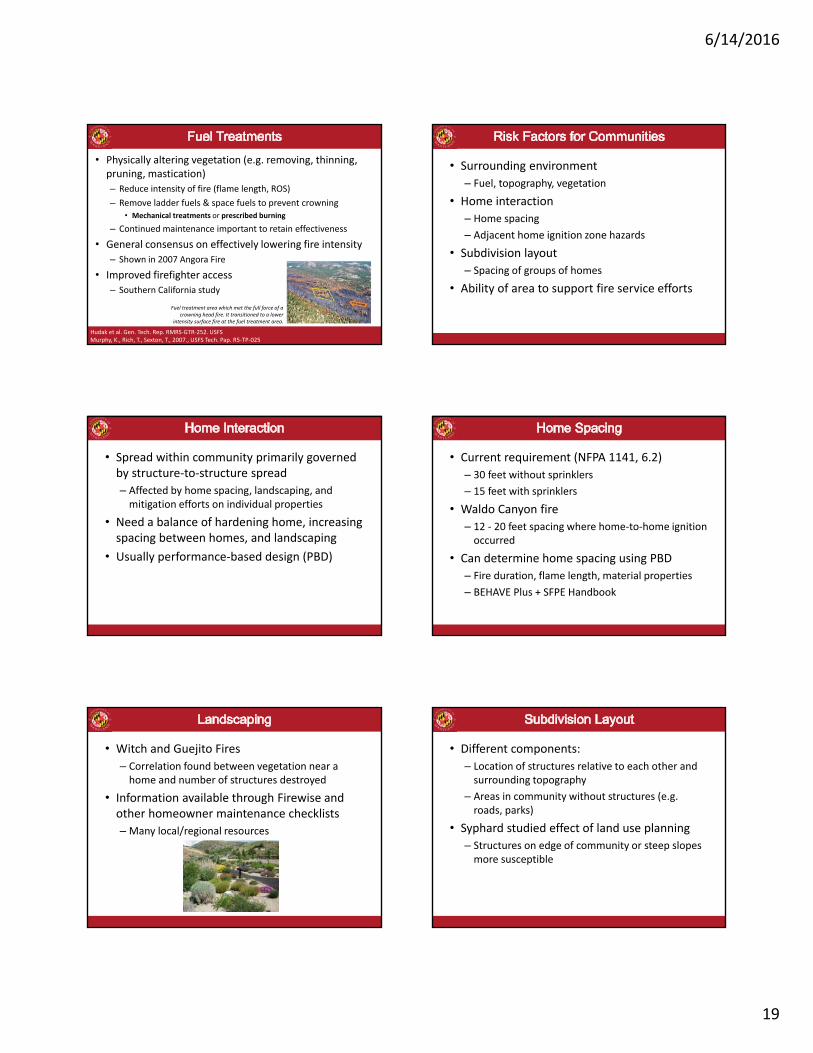
• Physically altering vegetation (e.g. removing, thinning, pruning, mastication)
– Reduce intensity of fire (flame length, ROS)
– Remove ladder fuels & space fuels to prevent crowning• Mechanical treatments or prescribed burning
– Continued maintenance important to retain effectiveness
• General consensus on effectively lowering fire intensity
– Shown in 2007 Angora Fire
• Improved firefighter access
– Southern California study
Hudak et al. Gen. Tech. Rep. RMRS‐GTR‐252. USFSMurphy, K., Rich, T., Sexton, T., 2007., USFS Tech. Pap. R5‐TP‐025
Fuel treatment area which met the full force of a crowning head fire. It transitioned to a lower
intensity surface fire at the fuel treatment area.
• Surrounding environment
– Fuel, topography, vegetation
• Home interaction
– Home spacing
– Adjacent home ignition zone hazards
• Subdivision layout
– Spacing of groups of homes
• Ability of area to support fire service efforts
• Spread within community primarily governed by structure‐to‐structure spread
– Affected by home spacing, landscaping, and mitigation efforts on individual properties
• Need a balance of hardening home, increasing spacing between homes, and landscaping
• Usually performance‐based design (PBD)
• Current requirement (NFPA 1141, 6.2)
– 30 feet without sprinklers
– 15 feet with sprinklers
• Waldo Canyon fire
– 12 ‐ 20 feet spacing where home‐to‐home ignition occurred
• Can determine home spacing using PBD
– Fire duration, flame length, material properties
– BEHAVE Plus + SFPE Handbook
• Witch and Guejito Fires
– Correlation found between vegetation near a home and number of structures destroyed
• Information available through Firewise and other homeowner maintenance checklists
– Many local/regional resources
• Different components:
– Location of structures relative to each other and surrounding topography
– Areas in community without structures (e.g. roads, parks)
• Syphard studied effect of land use planning
– Structures on edge of community or steep slopes more susceptible

6/14/2016
20
• Definition: Many significantly overlapped Home Ignition Zones
• Study on affect of cluster density
‐ Low density/isolated clusters: more likely to burn
‐ High density clusters: less likely to burn
Syphard AD, Keeley JE, Massada AB, Brennan TJ, Radeloff VC (2012) Housing arrangement and location determine the likelihood of housing loss due to wildfire. PLoS One 7(3):e33954. doi: 10.1371/journal.pone.0033954
• Trails, parks, roads, waterways, other barriers
– Between development and wildland
– Between subdivisions/clusters of the community
• Use space in community
– Golf courses
– Blacktops – areas without vegetation
– Parks
• Number of access routes
• Signage
• Dead‐ends
• Turn‐arounds
• Width
Fires can generally be attacked at the head or flanks by persons using hand tools. Handlineshould hold the fire.
Fires are too intense for direct attack on the head by persons using hand tools. Handline cannot be relied on to hold the fire.
Fires may present serious control problems; torching out, crowning and spotting. Control efforts at the head will probably be ineffective.
Crowning, spotting and major fire runs are probable. Control efforts at the head of the fire are ineffective.
Flame Length
0 ‐ 4 ft.
4 ‐ 8 ft.
8 ‐ 11 ft.
>11ft.
“An area cleared of flammable materials used for escape in the event the line is outflanked or in case a spot fire causes fuels outside the control line to render the line unsafe. They are greatly enlarged areas which can be used with relative safety by firefighters and their equipment in the event of blowup in the vicinity.”
6/14/2016
21
• Safety zones are LARGE
• Existing rule:
– Radius of safety zone = 4 * flame height
• Example:
– 6 ft flames, 10 mph wind, 20% slope, 3 ft tall fuel
– Safety zone radius = 4 * 6 = 24 ft
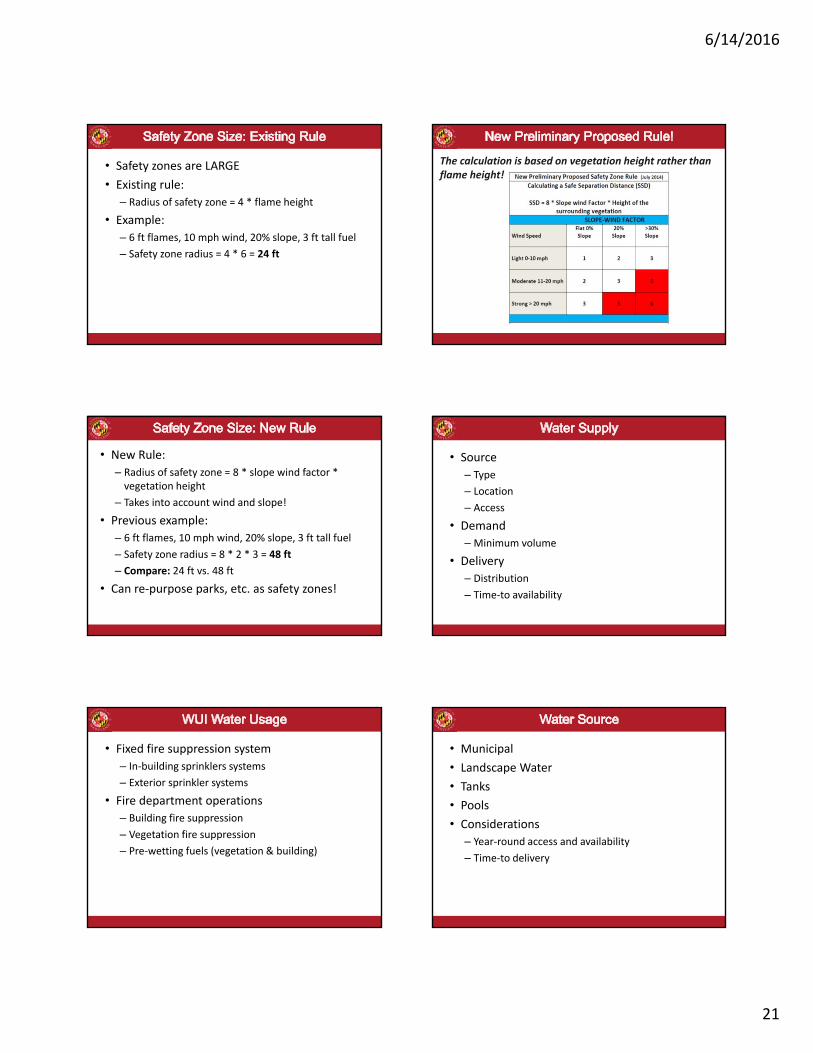
The calculation is based on vegetation height rather than flame height!
• New Rule:
– Radius of safety zone = 8 * slope wind factor * vegetation height
– Takes into account wind and slope!
• Previous example:
– 6 ft flames, 10 mph wind, 20% slope, 3 ft tall fuel
– Safety zone radius = 8 * 2 * 3 = 48 ft
– Compare: 24 ft vs. 48 ft
• Can re‐purpose parks, etc. as safety zones!
• Source
– Type
– Location
– Access
• Demand
– Minimum volume
• Delivery
– Distribution
– Time‐to availability
• Fixed fire suppression system
– In‐building sprinklers systems
– Exterior sprinkler systems
• Fire department operations
– Building fire suppression
– Vegetation fire suppression
– Pre‐wetting fuels (vegetation & building)
• Municipal
• Landscape Water
• Tanks
• Pools
• Considerations
– Year‐round access and availability
– Time‐to delivery
6/14/2016
22
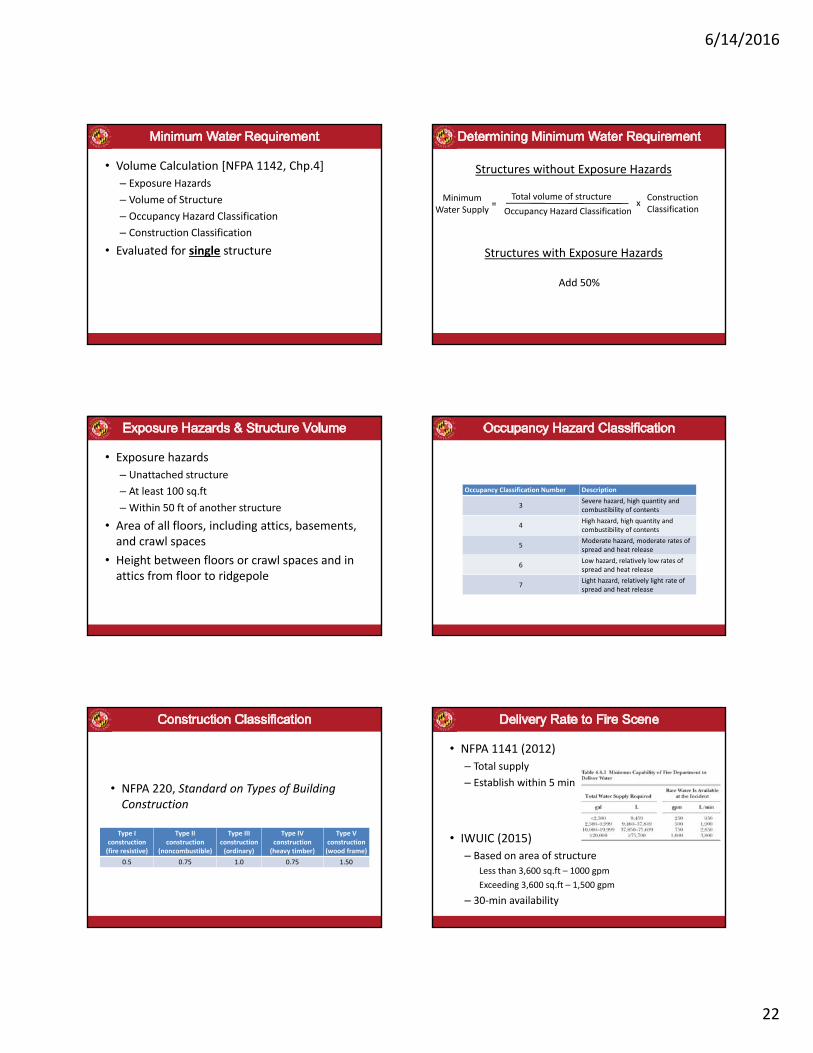
• Volume Calculation [NFPA 1142, Chp.4]
– Exposure Hazards
– Volume of Structure
– Occupancy Hazard Classification
– Construction Classification
• Evaluated for single structure
Minimum Water Supply
=Total volume of structure
Occupancy Hazard Classificationx
Structures without Exposure Hazards
Structures with Exposure Hazards
Add 50%
Construction Classification
• Exposure hazards
– Unattached structure
– At least 100 sq.ft
– Within 50 ft of another structure
• Area of all floors, including attics, basements, and crawl spaces
• Height between floors or crawl spaces and in attics from floor to ridgepole
Occupancy Classification Number Description
3Severe hazard, high quantity and combustibility of contents
4High hazard, high quantity and combustibility of contents
5Moderate hazard, moderate rates of spread and heat release
6Low hazard, relatively low rates of spread and heat release
7Light hazard, relatively light rate of spread and heat release
• NFPA 220, Standard on Types of Building Construction
Type I construction(fire resistive)
Type II construction
(noncombustible)
Type III construction(ordinary)
Type IV construction (heavy timber)
Type V construction (wood frame)
0.5 0.75 1.0 0.75 1.50
• NFPA 1141 (2012)
– Total supply
– Establish within 5 min
• IWUIC (2015)
– Based on area of structure
Less than 3,600 sq.ft – 1000 gpm
Exceeding 3,600 sq.ft – 1,500 gpm
– 30‐min availability
6/14/2016
23
A. JAMES CLARK SCHOOL of ENGINEERING ● UNIVERSITY of MARYLAND
PRE-INCIDENT PLANNING
• Hazard Assessment
• Operational Plan
– Command Element
– Training
• Public Safety & Notification
• Evacuation Plan
• Educational Program
– Firewise
– Ready, Set, Go!
– Fire Adapt Communities
• Response time
• Water supply operations
• Off‐road access
• Simultaneous fire department access and evacuation
• Trigger point
• Notification and communication
• Points of egress
• Time to evacuation
• Water supply access
• Time to availability
• Water use tactics
– Structure fire suppression
– Wildland fire suppression
– Pre‐wetting
A. JAMES CLARK SCHOOL of ENGINEERING ● UNIVERSITY of MARYLAND
RISK ANALYSIS
6/14/2016
24
• Hazard Assessment
– Fuel/Vegetation, Slope, Weather patterns
• Risk Assessment
– Identifies where wildfire is most likely to threaten something of community value
• Human life, property, natural/historic resources, infrastructure
– Existing roof types, road access, water supply, location and density of structures, likelihood of post‐fire flood damage
1. How large are fires likely to grow?2. Which highly valued resources and assets (HRVAs) have
the greatest exposure to wildfire hazard?3. Where might fires cause harm/ damage, and where might
they lead to benefits?4. How is wildfire risk distributed across the landscape?5. Which areas are most likely to experience loss, how much
loss, and to what HRVAs?
Scott, Joe H.; Thompson, Matthew P.; Calkin, David E. 2013. A wildfire risk assessment framework for land and resource management. Gen. Tech. Rep. RMRS‐GTR‐315. U.S. Department of Agriculture, Forest Service, Rocky Mountain Research Station. 83 p.
• Parameters to be evaluated for ranking overall community risk
– Surrounding vegetation and fuels
– Worst case weather
– Slope
– Home Construction / HIZ (1144 worksheet)
– Maintenance
– Fire crew access
– Resident evacuation
• Define a scale
• HOW and WHY do you chose the numerical values you choose
– Potentially weather, fuel, topography, home ignition potential, community, etc.
• What is an acceptable level of risk?
– Depends on specific community and decided HVRAs
• Consider different fire behavior scenarios
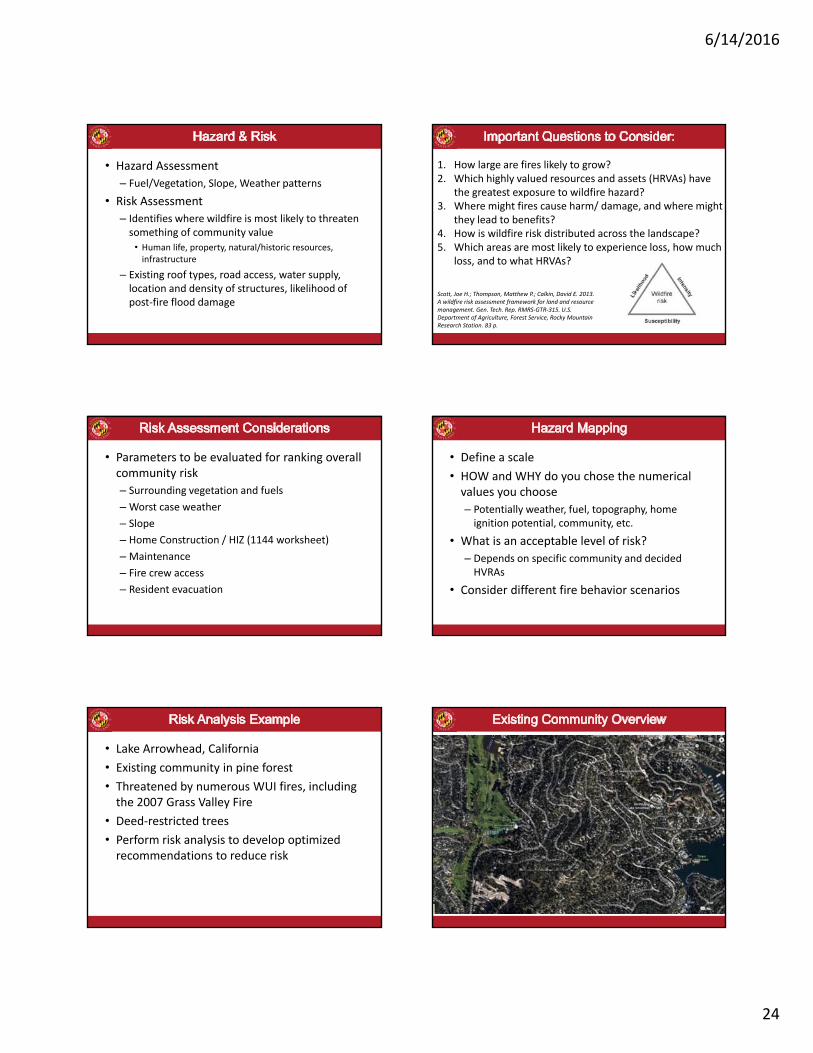
• Lake Arrowhead, California
• Existing community in pine forest
• Threatened by numerous WUI fires, including the 2007 Grass Valley Fire
• Deed‐restricted trees
• Perform risk analysis to develop optimized recommendations to reduce risk
6/14/2016
25
Canopy base height: Flame length:
Flame lengths reaching 8‐11 ft + Canopy base height 2‐5 ft = Transition to torching/ crowning probable!
6/14/2016
26
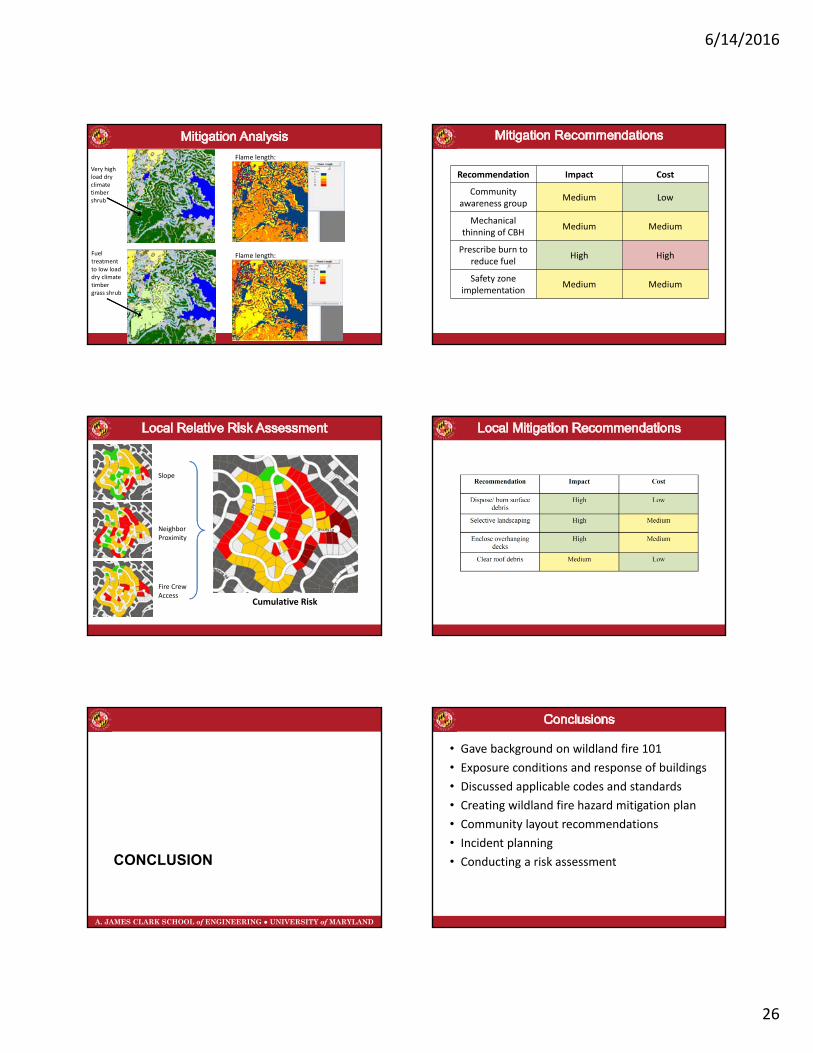
Fueltreatment to low load dry climate timber grass shrub
Flame length:
Flame length:
Very high load dry climate timber shrub
Recommendation Impact Cost
Community awareness group
Medium Low
Mechanical thinning of CBH
Medium Medium
Prescribe burn to reduce fuel
High High
Safety zone implementation
Medium Medium
Slope
Neighbor Proximity
Fire Crew Access
Cumulative Risk
A. JAMES CLARK SCHOOL of ENGINEERING ● UNIVERSITY of MARYLAND
CONCLUSION
• Gave background on wildland fire 101
• Exposure conditions and response of buildings
• Discussed applicable codes and standards
• Creating wildland fire hazard mitigation plan
• Community layout recommendations
• Incident planning
• Conducting a risk assessment
6/14/2016
27
CEUs: To receive CEUs for this session, scan yourbadge at the back of the room before leaving.
Evaluation: Complete a session evaluation on the mobile app.(Search app store for ‘NFPA 2016 C&E.’)
Handouts: Handouts will be available via the mobile app and at nfpa.org/conference.
Recordings: For information on audio recordings of Educational Sessions, visit nfpa.org/Xchange.
A. JAMES CLARK SCHOOL of ENGINEERING ● UNIVERSITY of MARYLAND
THANK YOU