presentación de powerpoint - sacyr 1t2017... · liabilities associated with the non current assets...
TRANSCRIPT
1Q2017 – Presentation of Results
RESULTS 1Q2017
8 M a y 2 0 1 7
1Q2017 – Presentation of Results
HIGHLIGHTS
OPERATIONAL DEVELOPMENT
PERFORMANCE BY BUSINESS AREA
ANNEXES
2
Table of contents
1Q2017 – Presentation of Results 3
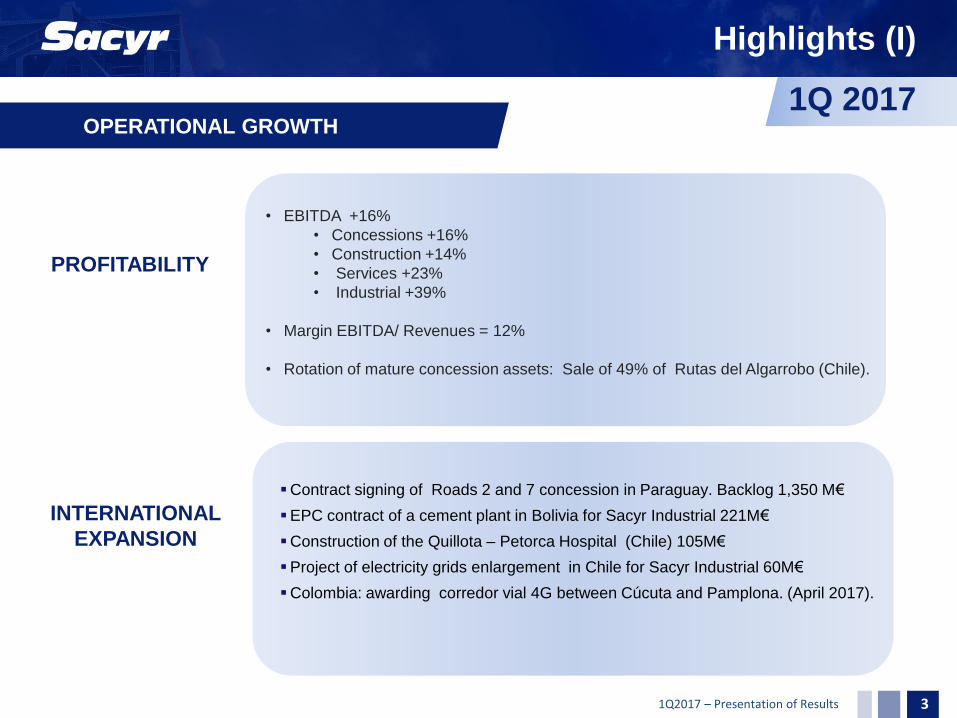
Highlights (I)
• EBITDA +16%
• Concessions +16%
• Construction +14%
• Services +23%
• Industrial +39%
• Margin EBITDA/ Revenues = 12%
• Rotation of mature concession assets: Sale of 49% of Rutas del Algarrobo (Chile).
Contract signing of Roads 2 and 7 concession in Paraguay. Backlog 1,350 M€
EPC contract of a cement plant in Bolivia for Sacyr Industrial 221M€
Construction of the Quillota – Petorca Hospital (Chile) 105M€
Project of electricity grids enlargement in Chile for Sacyr Industrial 60M€
Colombia: awarding corredor vial 4G between Cúcuta and Pamplona. (April 2017).
INTERNATIONAL
EXPANSION
1Q 2017 OPERATIONAL GROWTH
PROFITABILITY
1Q2017 – Presentation of Results 4
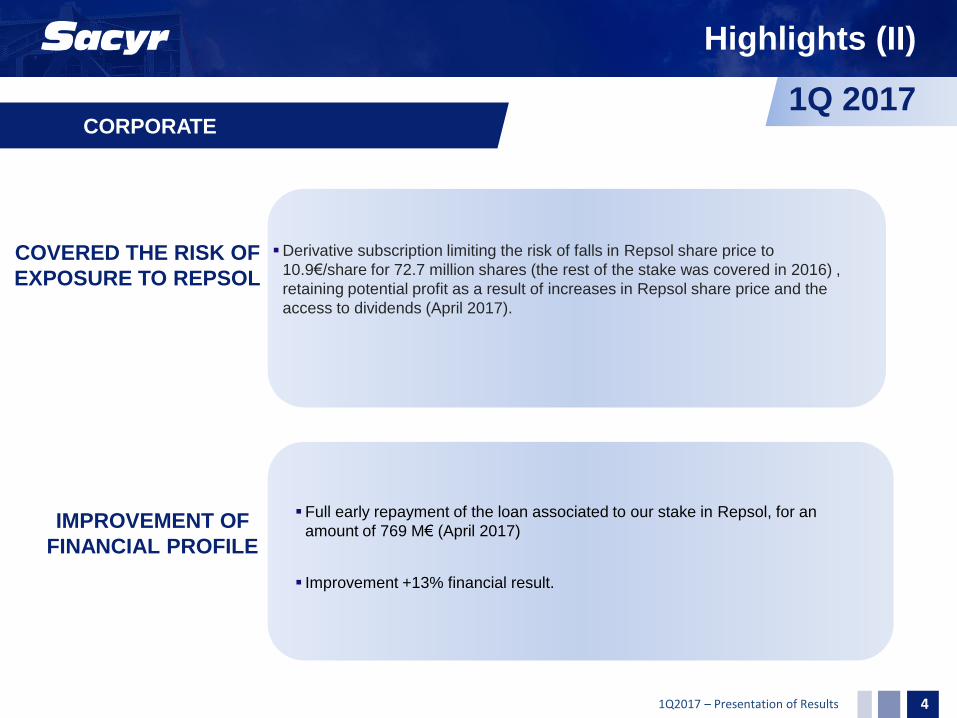
Highlights (II)
Derivative subscription limiting the risk of falls in Repsol share price to
10.9€/share for 72.7 million shares (the rest of the stake was covered in 2016) ,
retaining potential profit as a result of increases in Repsol share price and the
access to dividends (April 2017).
Full early repayment of the loan associated to our stake in Repsol, for an
amount of 769 M€ (April 2017)
Improvement +13% financial result.
IMPROVEMENT OF
FINANCIAL PROFILE
1Q 2017 CORPORATE
COVERED THE RISK OF
EXPOSURE TO REPSOL
1Q2017 – Presentation of Results
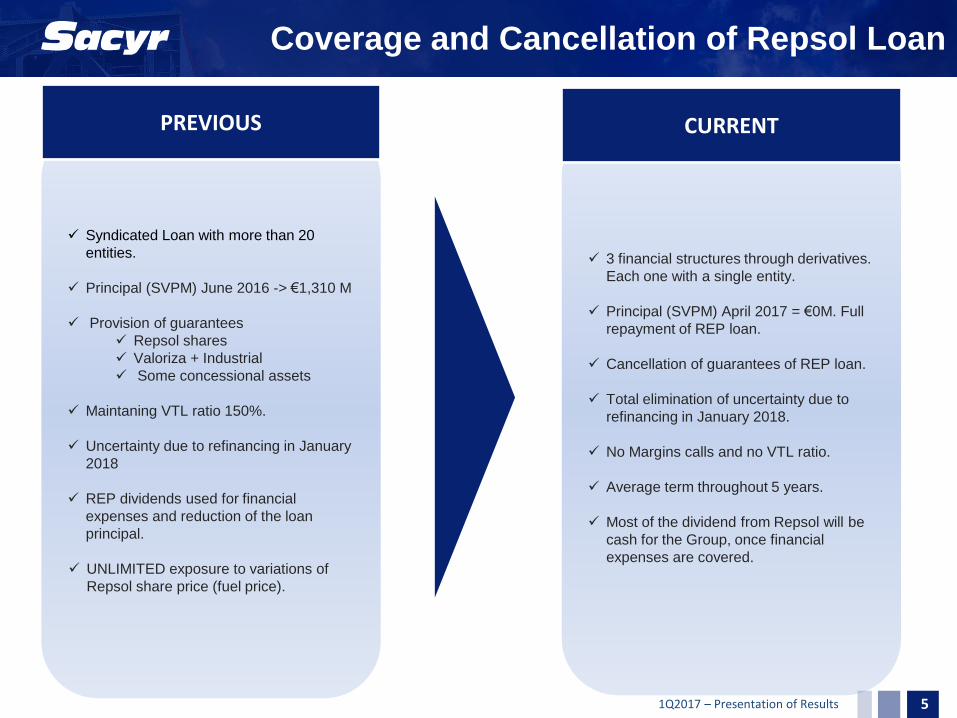
3 financial structures through derivatives.
Each one with a single entity.
Principal (SVPM) April 2017 = €0M. Full
repayment of REP loan.
Cancellation of guarantees of REP loan.
Total elimination of uncertainty due to
refinancing in January 2018.
No Margins calls and no VTL ratio.
Average term throughout 5 years.
Most of the dividend from Repsol will be
cash for the Group, once financial
expenses are covered.
Syndicated Loan with more than 20
entities.
Principal (SVPM) June 2016 -> €1,310 M
Provision of guarantees
Repsol shares
Valoriza + Industrial
Some concessional assets
Maintaning VTL ratio 150%.
Uncertainty due to refinancing in January
2018
REP dividends used for financial
expenses and reduction of the loan
principal.
UNLIMITED exposure to variations of
Repsol share price (fuel price).
CURRENT PREVIOUS
Coverage and Cancellation of Repsol Loan
5

1Q2017 – Presentation of Results
Elimination of the Repsol market price variation risk under €10.7/share.
Retaining upside
potential of Repsol shares at a given level, well above book value.
Debt reduction
€213M
20 mill. shares
Current exposure to REPSOL share price
Elimination of the Repsol market price variation risk under €11.9/share.
Retaining upside
potential of Repsol shares at a given level, well above book value.
Debt reduction
€319M
30 mill. shares
Elimination of the Repsol market price variation risk under €10.9/share.
Debt reduction
€769M
Retaining 100% upside potential of Repsol Share market price.
72.7 mill. shares
Stake of Sacyr in Repsol: 122.7 million shares = 8.2%
Total elimination of risk . Potential upside 6
1Q2017 – Presentation of Results
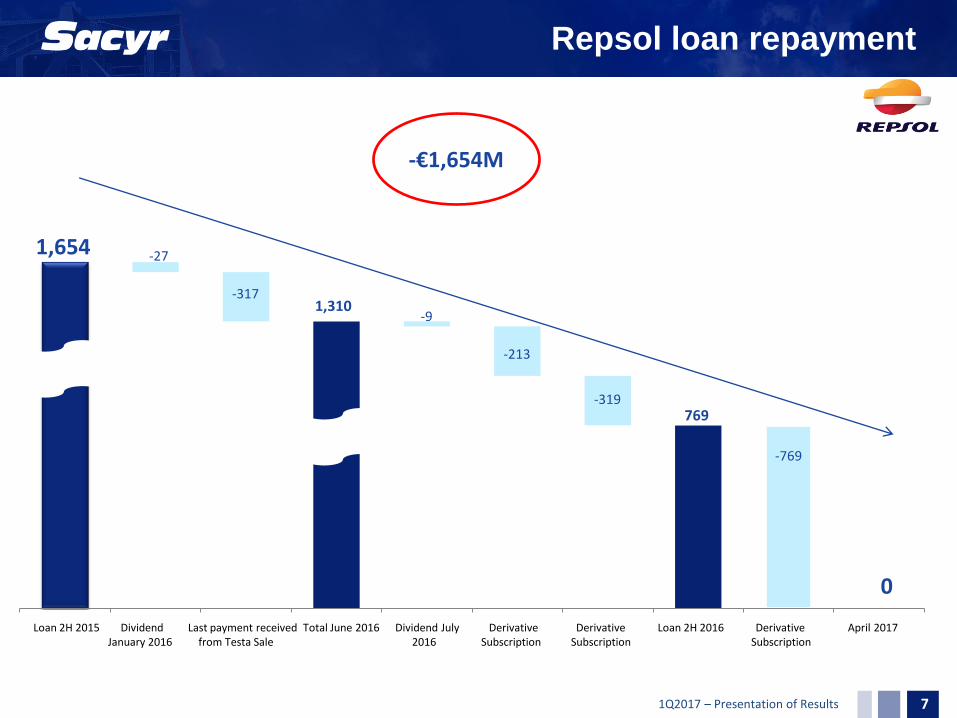
Repsol loan repayment
Préstamo 2S 2015
Cobro dividendo enero 2016
Último cobro de venta de Testa
Total Junio 2016 Dividendo julio 2016
Contratación derivado
Contratación derivado
Préstamo 2S2016
Contratación derivado
Abril 2017
-€1,654M
-27
-317 1,310
-9
-213
-319 769
1,654
0
-769
7
Loan 2H 2015 Dividend Last payment received Total June 2016 Dividend July Derivative Derivative Loan 2H 2016 Derivative April 2017 January 2016 from Testa Sale 2016 Subscription Subscription Subscription

1Q2017 – Presentation of Results
HIGHLIGHTS
OPERATIONAL DEVELOPMENT
PERFORMANCE BY BUSINESS AREA
ANNEXES
8
Table of contents
1Q2017 – Presentation of Results 9
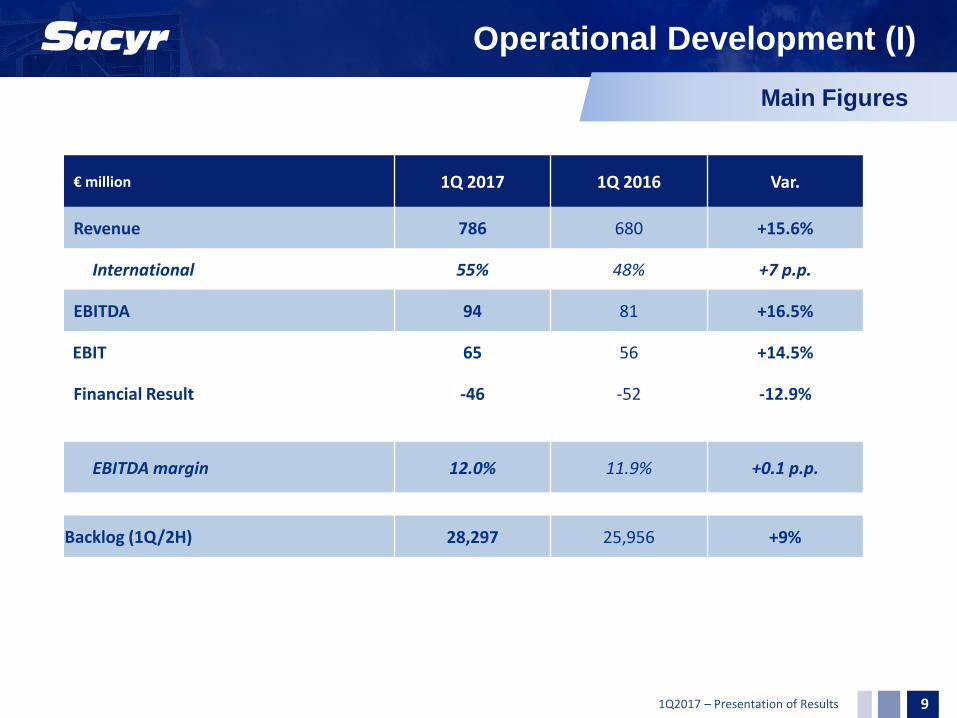
Operational Development (I)
€ million 1Q 2017 1Q 2016 Var.
Revenue 786 680 +15.6%
International 55% 48% +7 p.p.
EBITDA 94 81 +16.5%
EBIT 65 56 +14.5%
Financial Result -46 -52 -12.9%
EBITDA margin 12.0% 11.9% +0.1 p.p.
Backlog (1Q/2H) 28,297 25,956 +9%
Main Figures
1Q2017 – Presentation of Results 10
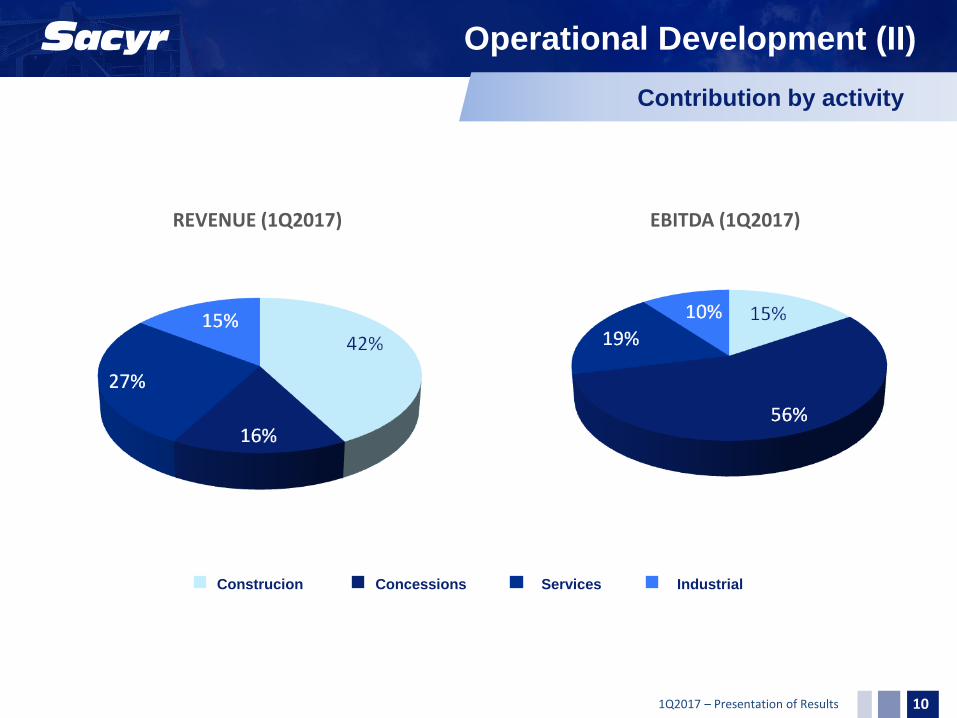
Contribution by activity
REVENUE (1Q2017) EBITDA (1Q2017)
Operational Development (II)
Construcion Concessions Services Industrial
1Q2017 – Presentation of Results 11
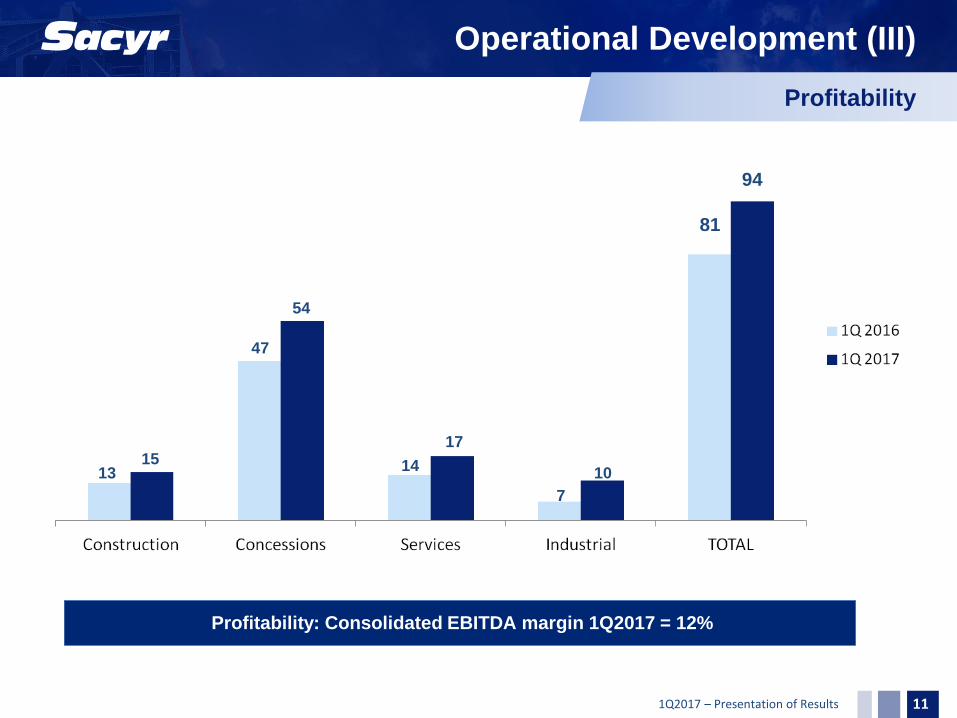
Profitability
Profitability: Consolidated EBITDA margin 1Q2017 = 12%
13 15
54
14
17
7
10
94
81
47
Operational Development (III)

1Q2017 – Presentation of Results 12
Backlog
28,297
25,956
+9%
86% of construction backlog is international.
67% of concessions backlog is international.
Selective international presence in countries with political, economic and legal stability.
Thorough risk analysis: Profitability vs Volume.
Operational Development (IV)
1Q2017 – Presentation of Results
HIGHLIGHTS
OPERATIONAL DEVELOPMENT
PERFORMANCE BY BUSINESS AREA
ANNEXES
13
Table of contents
1Q2017 – Presentation of Results
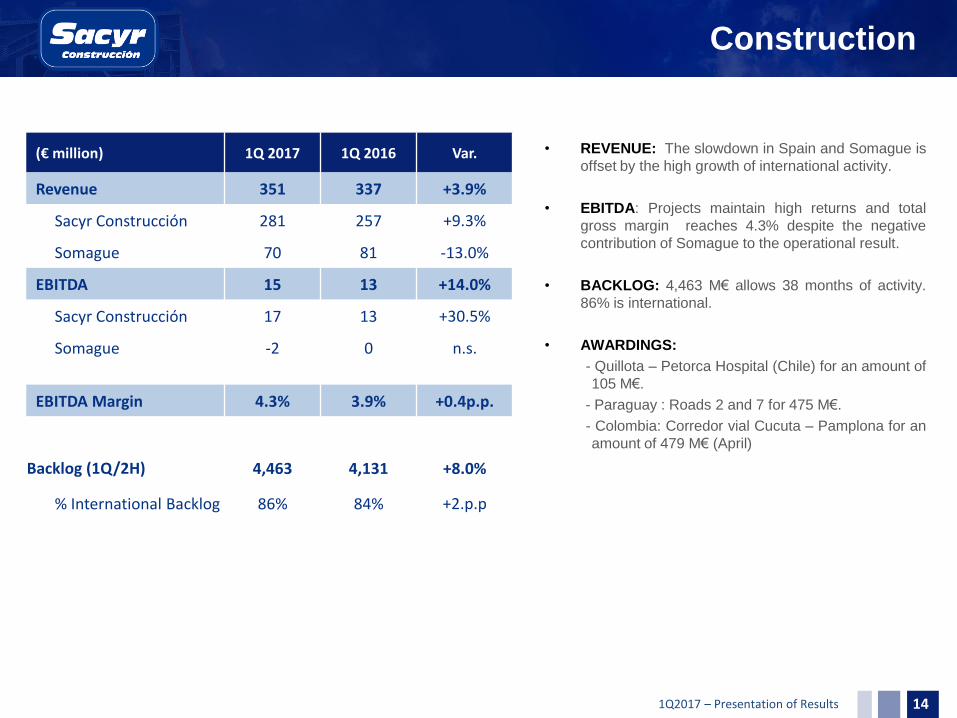
Construction
• REVENUE: The slowdown in Spain and Somague is
offset by the high growth of international activity.
• EBITDA: Projects maintain high returns and total
gross margin reaches 4.3% despite the negative
contribution of Somague to the operational result.
• BACKLOG: 4,463 M€ allows 38 months of activity.
86% is international.
• AWARDINGS:
- Quillota – Petorca Hospital (Chile) for an amount of
105 M€.
- Paraguay : Roads 2 and 7 for 475 M€.
- Colombia: Corredor vial Cucuta – Pamplona for an
amount of 479 M€ (April)
(€ million) 1Q 2017 1Q 2016 Var.
Revenue 351 337 +3.9%
Sacyr Construcción 281 257 +9.3%
Somague 70 81 -13.0%
EBITDA 15 13 +14.0%
Sacyr Construcción 17 13 +30.5%
Somague -2 0 n.s.
EBITDA Margin 4.3% 3.9% +0.4p.p.
Backlog (1Q/2H) 4,463 4,131 +8.0%
% International Backlog 86% 84% +2.p.p
14
1Q2017 – Presentation of Results
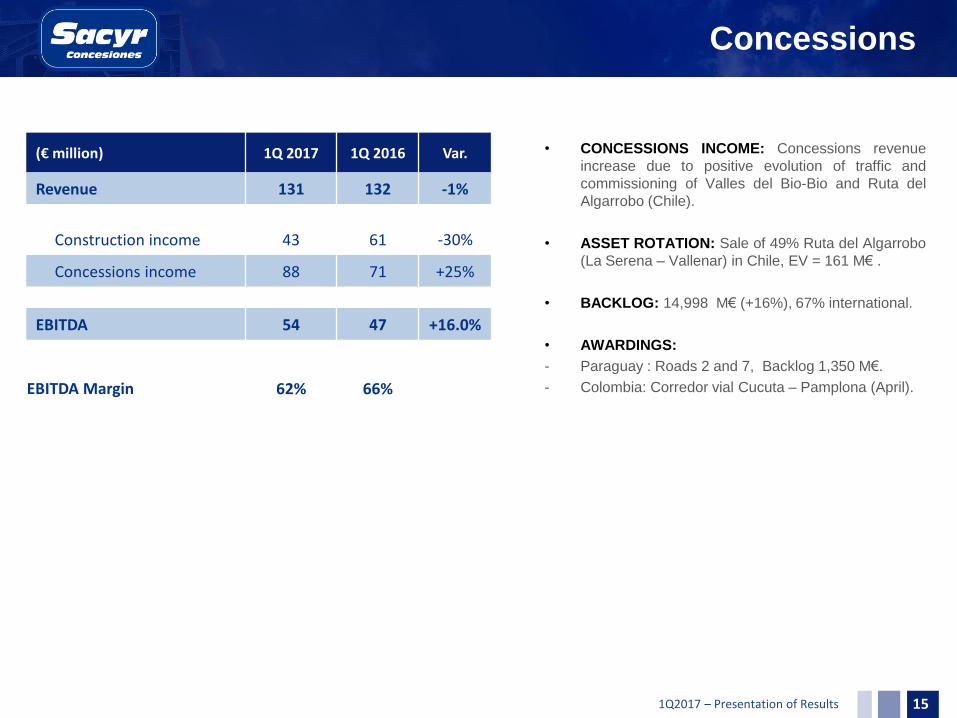
Concessions
(€ million) 1Q 2017 1Q 2016 Var.
Revenue 131 132 -1%
Construction income 43 61 -30%
Concessions income 88 71 +25%
EBITDA 54 47 +16.0%
EBITDA Margin 62% 66%
• CONCESSIONS INCOME: Concessions revenue
increase due to positive evolution of traffic and
commissioning of Valles del Bio-Bio and Ruta del
Algarrobo (Chile).
• ASSET ROTATION: Sale of 49% Ruta del Algarrobo
(La Serena – Vallenar) in Chile, EV = 161 M€ .
• BACKLOG: 14,998 M€ (+16%), 67% international.
• AWARDINGS:
- Paraguay : Roads 2 and 7, Backlog 1,350 M€.
- Colombia: Corredor vial Cucuta – Pamplona (April).
15
1Q2017 – Presentation of Results
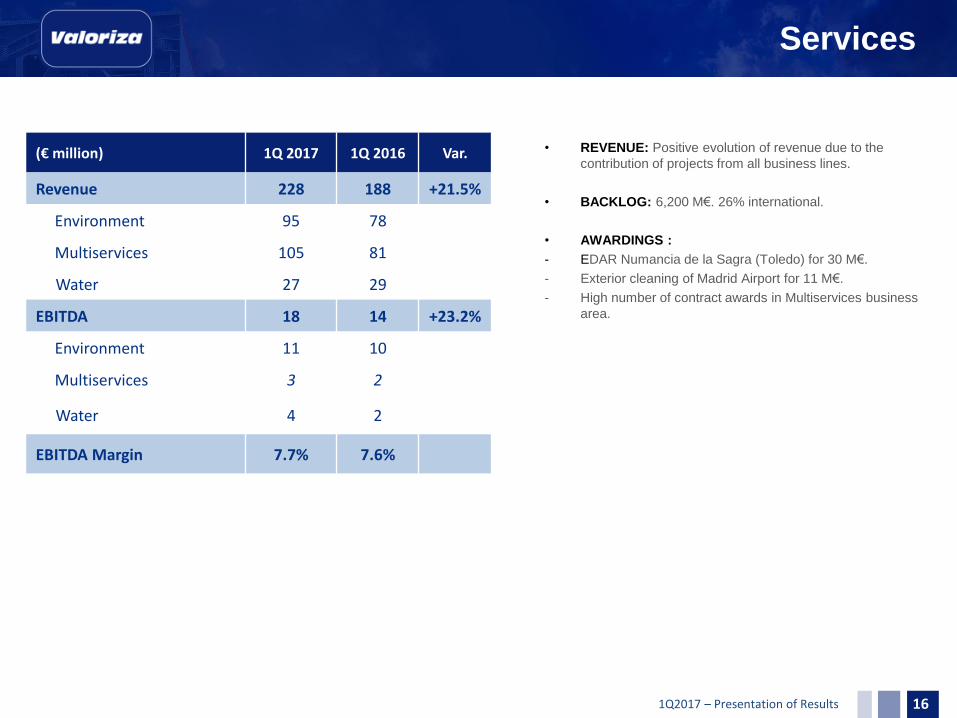
Services
• REVENUE: Positive evolution of revenue due to the
contribution of projects from all business lines.
• BACKLOG: 6,200 M€. 26% international.
• AWARDINGS :
- EDAR Numancia de la Sagra (Toledo) for 30 M€.
- Exterior cleaning of Madrid Airport for 11 M€.
- High number of contract awards in Multiservices business
area.
(€ million) 1Q 2017 1Q 2016 Var.
Revenue 228 188 +21.5%
Environment 95 78
Multiservices 105 81
Water 27 29
EBITDA 18 14 +23.2%
Environment 11 10
Multiservices 3 2
Water 4 2
EBITDA Margin 7.7% 7.6%
16
1Q2017 – Presentation of Results
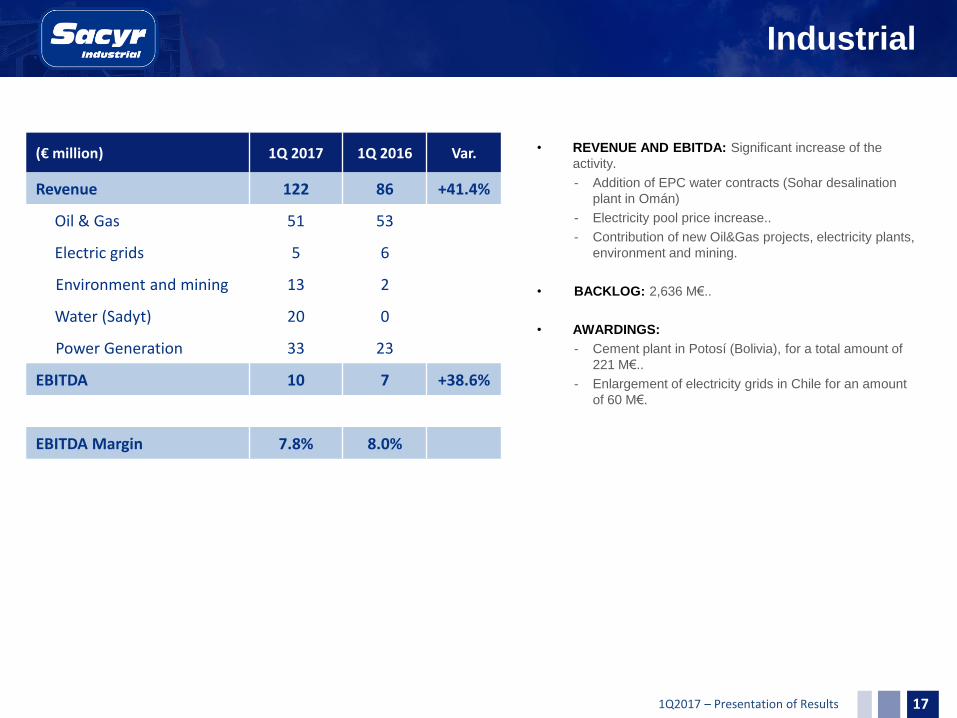
Industrial
• REVENUE AND EBITDA: Significant increase of the
activity.
- Addition of EPC water contracts (Sohar desalination
plant in Omán)
- Electricity pool price increase..
- Contribution of new Oil&Gas projects, electricity plants,
environment and mining.
• BACKLOG: 2,636 M€..
• AWARDINGS:
- Cement plant in Potosí (Bolivia), for a total amount of
221 M€..
- Enlargement of electricity grids in Chile for an amount
of 60 M€.
(€ million) 1Q 2017 1Q 2016 Var.
Revenue 122 86 +41.4%
Oil & Gas 51 53
Electric grids 5 6
Environment and mining 13 2
Water (Sadyt) 20 0
Power Generation 33 23
EBITDA 10 7 +38.6%
EBITDA Margin 7.8% 8.0%
17
1Q2017 – Presentation of Results
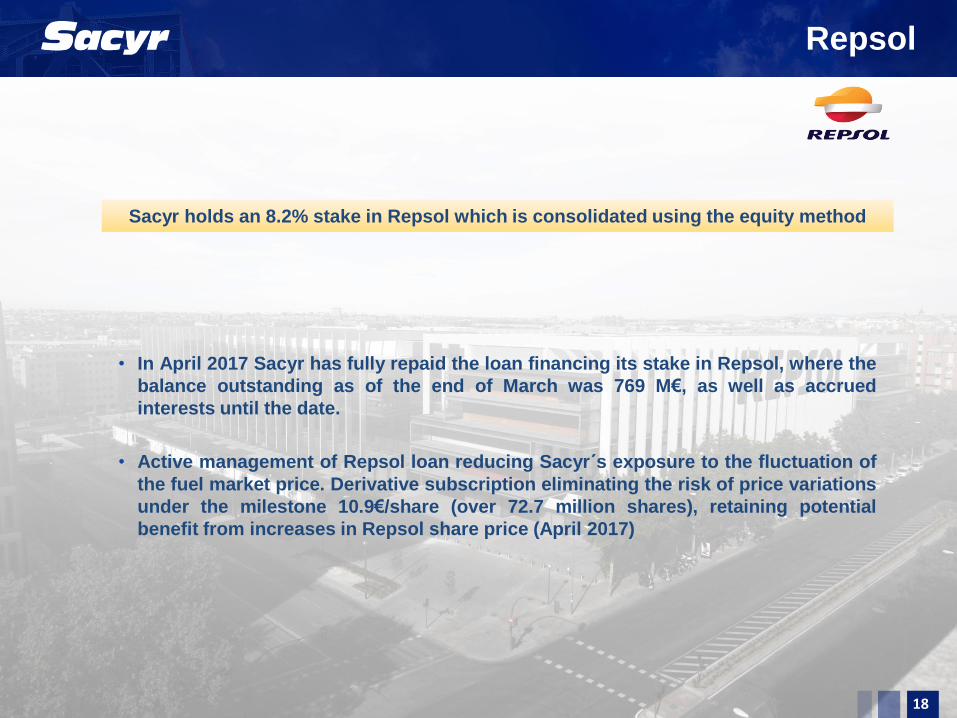
Sacyr holds an 8.2% stake in Repsol which is consolidated using the equity method
• In April 2017 Sacyr has fully repaid the loan financing its stake in Repsol, where the
balance outstanding as of the end of March was 769 M€, as well as accrued
interests until the date.
• Active management of Repsol loan reducing Sacyr´s exposure to the fluctuation of
the fuel market price. Derivative subscription eliminating the risk of price variations
under the milestone 10.9€/share (over 72.7 million shares), retaining potential
benefit from increases in Repsol share price (April 2017)
Repsol
18
1Q2017 – Presentation of Results 19
HIGHLIGHTS
OPERATIONAL DEVELOPMENT
PERFORMANCE BY BUSINESS AREA
ANNEXES
Table of contents

1Q2017 – Presentation of Results
Income Statement
20
STATEMENT OF INCOME % chg
(Thousands of Euros) 1Q17/1Q16
Revenue 785,921 679,913 15.6%Other income 19,079 13,606 40.2%Total operating income 805,000 693,519 16.1%External and Operating Expenses -711,044 -612,861 16.0%EBITDA 93,955 80,658 16.5%Amortisation and depreciation charge -27,107 -24,985 8.5%Trade Provisions and non recurring items -2,066 893 n.s.NET OPERATING PROFIT 64,783 56,566 14.5%Financial results -45,688 -52,473 -12.9%Forex results 1,305 -1,575 n.s.Results from equity accounted subsidiaries 58,376 39,219 48.8%Provisions for financial investments -1,558 -1,477 5.5%Change in value of financial instruments -31,898 -7,114 348.4%Results from sales of non current assets 411 19,796 -97.9%PROFIT BEFORE TAXES 45,731 52,943 -13.6%Corporate Tax -9,954 -8,986 10.8%PROFIT FOR CONTINUING ACTIVITIES 35,777 43,957 -18.6%
RESULTS FOR COMPANIES WITH DISCONTINOUS ACTIVITIES 0 0
CONSOLIDATE RESULTS 35,777 43,957 -18.6%Minorities -4,454 -1,326 236.0%NET ATTRIBUTABLE PROFIT 31,323 42,631 -26.5%
Gross margin 12.0% 11.9%
1Q 2017 1Q 2016
1Q2017 – Presentation of Results
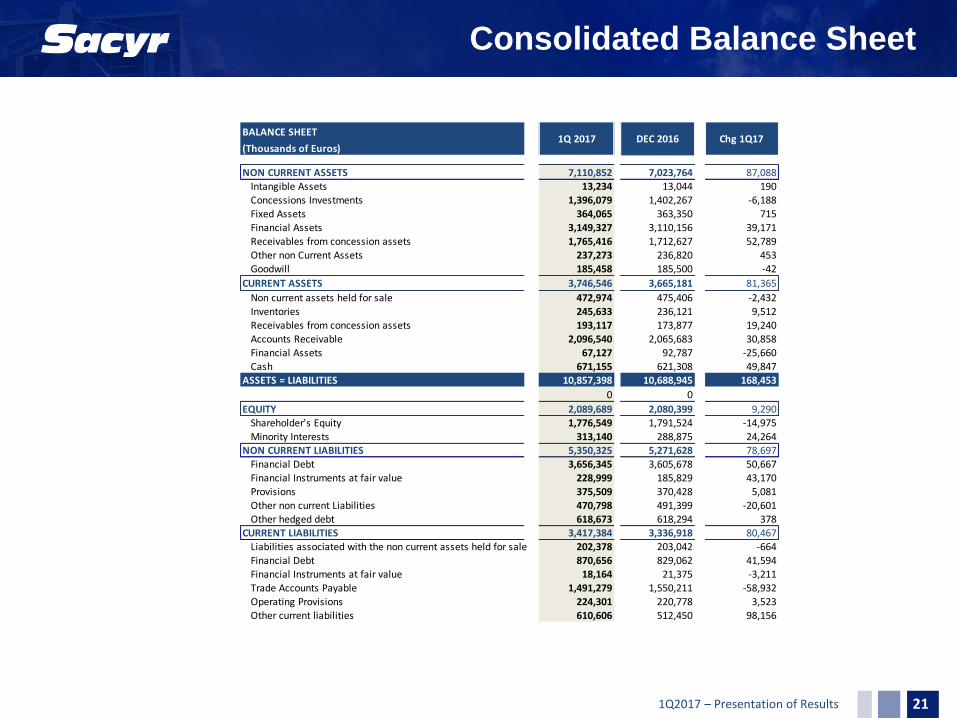
Consolidated Balance Sheet
21
BALANCE SHEET
(Thousands of Euros)
NON CURRENT ASSETS 7,110,852 7,023,764 87,088Intangible Assets 13,234 13,044 190Concessions Investments 1,396,079 1,402,267 -6,188Fixed Assets 364,065 363,350 715Financial Assets 3,149,327 3,110,156 39,171Receivables from concession assets 1,765,416 1,712,627 52,789Other non Current Assets 237,273 236,820 453Goodwill 185,458 185,500 -42
CURRENT ASSETS 3,746,546 3,665,181 81,365
Non current assets held for sale 472,974 475,406 -2,432Inventories 245,633 236,121 9,512Receivables from concession assets 193,117 173,877 19,240Accounts Receivable 2,096,540 2,065,683 30,858Financial Assets 67,127 92,787 -25,660Cash 671,155 621,308 49,847
ASSETS = LIABILITIES 10,857,398 10,688,945 168,453
0 0
EQUITY 2,089,689 2,080,399 9,290Shareholder's Equity 1,776,549 1,791,524 -14,975Minority Interests 313,140 288,875 24,264
NON CURRENT LIABILITIES 5,350,325 5,271,628 78,697Financial Debt 3,656,345 3,605,678 50,667Financial Instruments at fair value 228,999 185,829 43,170Provisions 375,509 370,428 5,081Other non current Liabilities 470,798 491,399 -20,601Other hedged debt 618,673 618,294 378
CURRENT LIABILITIES 3,417,384 3,336,918 80,467Liabilities associated with the non current assets held for sale 202,378 203,042 -664Financial Debt 870,656 829,062 41,594Financial Instruments at fair value 18,164 21,375 -3,211Trade Accounts Payable 1,491,279 1,550,211 -58,932Operating Provisions 224,301 220,778 3,523Other current liabilities 610,606 512,450 98,156
Chg 1Q171Q 2017 DEC 2016

1Q2017 – Presentation of Results
Income Statement by Line of Business 1Q 2017
22
CONSOLIDATED INCOME STATEMENT AS OF MARCH 2017
(Thousands of Euros) ConstrucciónSacyr
ConcesionesValoriza
Sacyr
Industrial
Holding and
AdjustmentsTOTAL
Turnover 350,587 131,143 227,882 122,005 -45,697 785,921
Other Sales 12,617 1,731 3,440 971 318 19,079
Total Income 363,205 132,875 231,322 122,976 -45,379 805,000
External and Operating Expenses -348,227 -78,512 -213,763 -113,445 42,902 -711,044
GROSS OPERATING PROFIT 14,978 54,363 17,559 9,531 -2,476 93,955
Depreciation -4,077 -11,433 -8,949 -2,149 -499 -27,107
Trade Provisions and non recurring items 1,007 -2,265 -814 3 3 -2,066
NET OPERATING PROFIT 11,908 40,665 7,796 7,385 -2,972 64,783
Financial results -1,206 -25,039 -2,213 -775 -16,455 -45,688
Forex results 1,785 -10 -209 -98 -164 1,305
Results from equity accounted subsidiaries 99 1,245 1,646 28 55,358 58,376
Provisions for financial investments 3 -1,205 -364 513 -506 -1,558
Change in value of financial instruments at fair value 0 -4,508 -929 -281 -26,180 -31,898
Results from sales of non current assets 391 23 4 -513 506 411
PROFIT BEFORE TAXES 12,980 11,172 5,731 6,261 9,587 45,731
Corporate Tax -7,272 -3,503 -1,839 -2,051 4,711 -9,954
PROFIT FOR CONTINUING ACTIVITIES 5,708 7,670 3,892 4,210 14,298 35,777
PROFIT FOR DISCONTINUING ACTIVITIES 0 0 0 0 0 0
CONSOLIDATE RESULTS 5,708 7,670 3,892 4,210 14,298 35,777
Minorities -31 -3,362 256 -1,356 38 -4,454
NET ATTRIBUTABLE PROFIT 5,677 4,308 4,148 2,853 14,337 31,323
1Q2017 – Presentation of Results
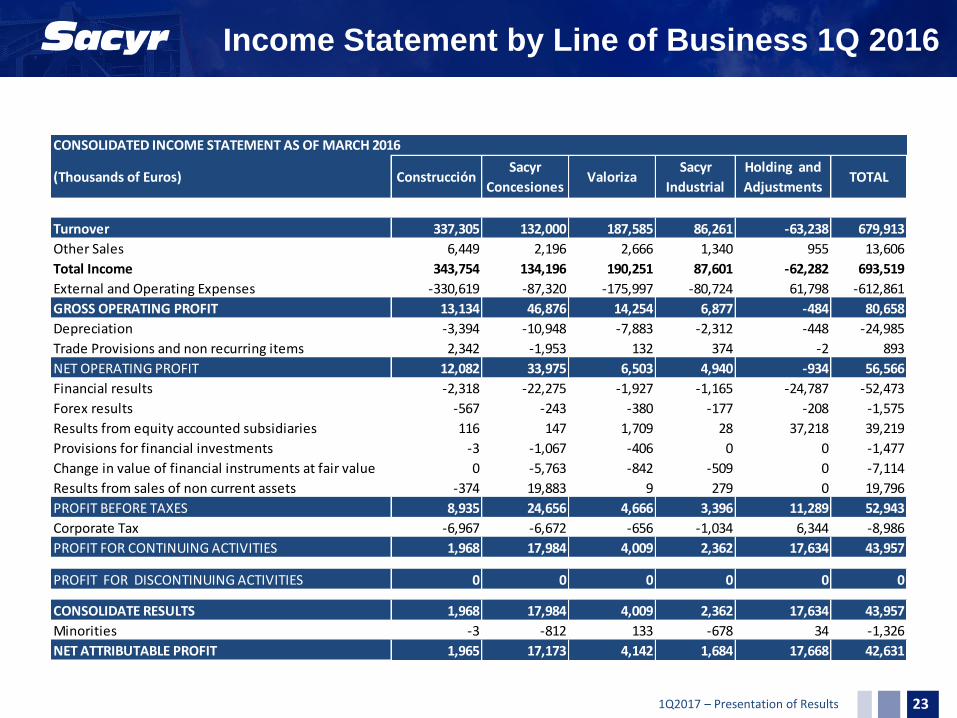
Income Statement by Line of Business 1Q 2016
23
CONSOLIDATED INCOME STATEMENT AS OF MARCH 2016
(Thousands of Euros) ConstrucciónSacyr
ConcesionesValoriza
Sacyr
Industrial
Holding and
AdjustmentsTOTAL
Turnover 337,305 132,000 187,585 86,261 -63,238 679,913
Other Sales 6,449 2,196 2,666 1,340 955 13,606
Total Income 343,754 134,196 190,251 87,601 -62,282 693,519
External and Operating Expenses -330,619 -87,320 -175,997 -80,724 61,798 -612,861
GROSS OPERATING PROFIT 13,134 46,876 14,254 6,877 -484 80,658
Depreciation -3,394 -10,948 -7,883 -2,312 -448 -24,985
Trade Provisions and non recurring items 2,342 -1,953 132 374 -2 893
NET OPERATING PROFIT 12,082 33,975 6,503 4,940 -934 56,566
Financial results -2,318 -22,275 -1,927 -1,165 -24,787 -52,473
Forex results -567 -243 -380 -177 -208 -1,575
Results from equity accounted subsidiaries 116 147 1,709 28 37,218 39,219
Provisions for financial investments -3 -1,067 -406 0 0 -1,477
Change in value of financial instruments at fair value 0 -5,763 -842 -509 0 -7,114
Results from sales of non current assets -374 19,883 9 279 0 19,796
PROFIT BEFORE TAXES 8,935 24,656 4,666 3,396 11,289 52,943
Corporate Tax -6,967 -6,672 -656 -1,034 6,344 -8,986
PROFIT FOR CONTINUING ACTIVITIES 1,968 17,984 4,009 2,362 17,634 43,957
PROFIT FOR DISCONTINUING ACTIVITIES 0 0 0 0 0 0
CONSOLIDATE RESULTS 1,968 17,984 4,009 2,362 17,634 43,957
Minorities -3 -812 133 -678 34 -1,326
NET ATTRIBUTABLE PROFIT 1,965 17,173 4,142 1,684 17,668 42,631
1Q2017 – Presentation of Results
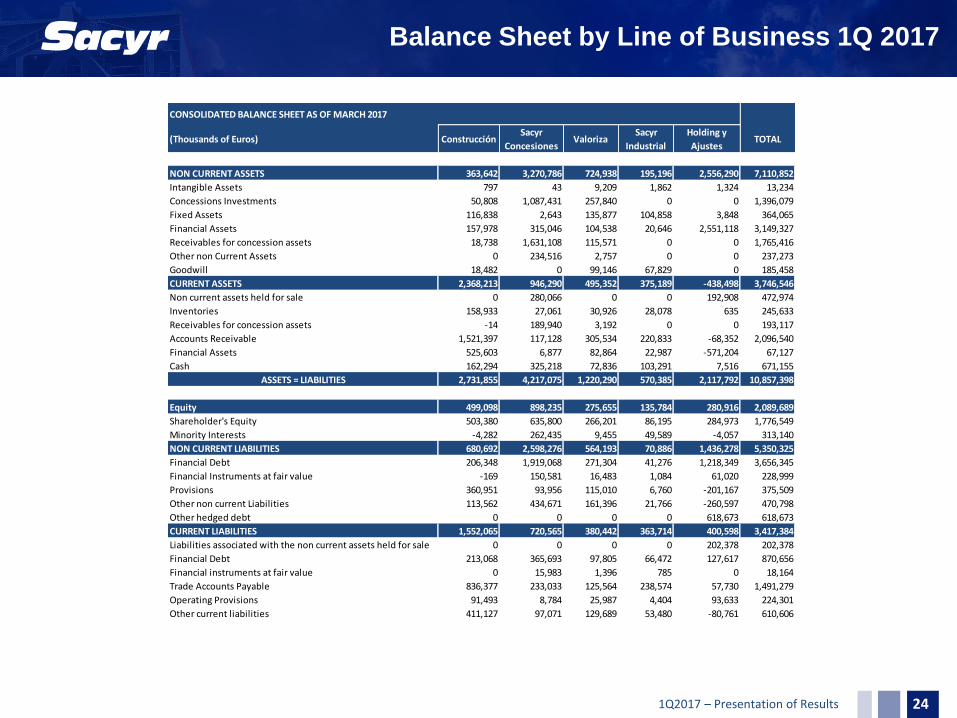
Balance Sheet by Line of Business 1Q 2017
24
CONSOLIDATED BALANCE SHEET AS OF MARCH 2017
(Thousands of Euros) ConstrucciónSacyr
ConcesionesValoriza
Sacyr
Industrial
Holding y
AjustesTOTAL
NON CURRENT ASSETS 363,642 3,270,786 724,938 195,196 2,556,290 7,110,852
Intangible Assets 797 43 9,209 1,862 1,324 13,234
Concessions Investments 50,808 1,087,431 257,840 0 0 1,396,079
Fixed Assets 116,838 2,643 135,877 104,858 3,848 364,065
Financial Assets 157,978 315,046 104,538 20,646 2,551,118 3,149,327
Receivables for concession assets 18,738 1,631,108 115,571 0 0 1,765,416
Other non Current Assets 0 234,516 2,757 0 0 237,273
Goodwill 18,482 0 99,146 67,829 0 185,458
CURRENT ASSETS 2,368,213 946,290 495,352 375,189 -438,498 3,746,546
Non current assets held for sale 0 280,066 0 0 192,908 472,974
Inventories 158,933 27,061 30,926 28,078 635 245,633
Receivables for concession assets -14 189,940 3,192 0 0 193,117
Accounts Receivable 1,521,397 117,128 305,534 220,833 -68,352 2,096,540
Financial Assets 525,603 6,877 82,864 22,987 -571,204 67,127
Cash 162,294 325,218 72,836 103,291 7,516 671,155
ASSETS = LIABILITIES 2,731,855 4,217,075 1,220,290 570,385 2,117,792 10,857,398
Equity 499,098 898,235 275,655 135,784 280,916 2,089,689
Shareholder's Equity 503,380 635,800 266,201 86,195 284,973 1,776,549
Minority Interests -4,282 262,435 9,455 49,589 -4,057 313,140
NON CURRENT LIABILITIES 680,692 2,598,276 564,193 70,886 1,436,278 5,350,325
Financial Debt 206,348 1,919,068 271,304 41,276 1,218,349 3,656,345
Financial Instruments at fair value -169 150,581 16,483 1,084 61,020 228,999
Provisions 360,951 93,956 115,010 6,760 -201,167 375,509
Other non current Liabilities 113,562 434,671 161,396 21,766 -260,597 470,798
Other hedged debt 0 0 0 0 618,673 618,673
CURRENT LIABILITIES 1,552,065 720,565 380,442 363,714 400,598 3,417,384
Liabilities associated with the non current assets held for sale 0 0 0 0 202,378 202,378
Financial Debt 213,068 365,693 97,805 66,472 127,617 870,656
Financial instruments at fair value 0 15,983 1,396 785 0 18,164
Trade Accounts Payable 836,377 233,033 125,564 238,574 57,730 1,491,279
Operating Provisions 91,493 8,784 25,987 4,404 93,633 224,301
Other current liabilities 411,127 97,071 129,689 53,480 -80,761 610,606
1Q2017 – Presentation of Results
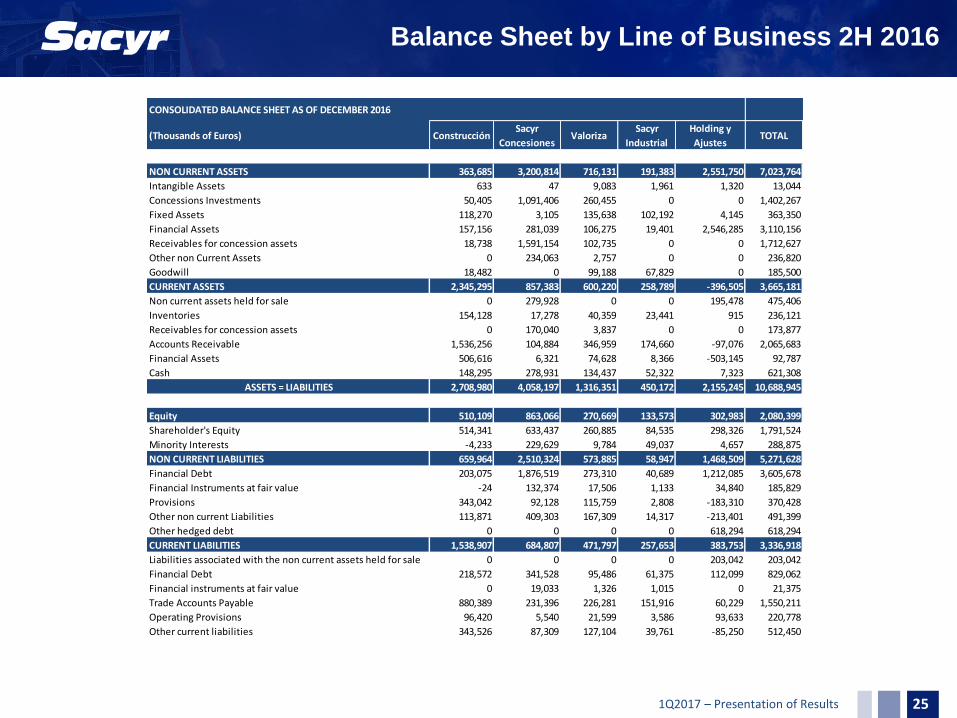
Balance Sheet by Line of Business 2H 2016
25
CONSOLIDATED BALANCE SHEET AS OF DECEMBER 2016
(Thousands of Euros) ConstrucciónSacyr
ConcesionesValoriza
Sacyr
Industrial
Holding y
AjustesTOTAL
NON CURRENT ASSETS 363,685 3,200,814 716,131 191,383 2,551,750 7,023,764
Intangible Assets 633 47 9,083 1,961 1,320 13,044
Concessions Investments 50,405 1,091,406 260,455 0 0 1,402,267
Fixed Assets 118,270 3,105 135,638 102,192 4,145 363,350
Financial Assets 157,156 281,039 106,275 19,401 2,546,285 3,110,156
Receivables for concession assets 18,738 1,591,154 102,735 0 0 1,712,627
Other non Current Assets 0 234,063 2,757 0 0 236,820
Goodwill 18,482 0 99,188 67,829 0 185,500
CURRENT ASSETS 2,345,295 857,383 600,220 258,789 -396,505 3,665,181
Non current assets held for sale 0 279,928 0 0 195,478 475,406
Inventories 154,128 17,278 40,359 23,441 915 236,121
Receivables for concession assets 0 170,040 3,837 0 0 173,877
Accounts Receivable 1,536,256 104,884 346,959 174,660 -97,076 2,065,683
Financial Assets 506,616 6,321 74,628 8,366 -503,145 92,787
Cash 148,295 278,931 134,437 52,322 7,323 621,308
ASSETS = LIABILITIES 2,708,980 4,058,197 1,316,351 450,172 2,155,245 10,688,945
Equity 510,109 863,066 270,669 133,573 302,983 2,080,399
Shareholder's Equity 514,341 633,437 260,885 84,535 298,326 1,791,524
Minority Interests -4,233 229,629 9,784 49,037 4,657 288,875
NON CURRENT LIABILITIES 659,964 2,510,324 573,885 58,947 1,468,509 5,271,628
Financial Debt 203,075 1,876,519 273,310 40,689 1,212,085 3,605,678
Financial Instruments at fair value -24 132,374 17,506 1,133 34,840 185,829
Provisions 343,042 92,128 115,759 2,808 -183,310 370,428
Other non current Liabilities 113,871 409,303 167,309 14,317 -213,401 491,399
Other hedged debt 0 0 0 0 618,294 618,294
CURRENT LIABILITIES 1,538,907 684,807 471,797 257,653 383,753 3,336,918
Liabilities associated with the non current assets held for sale 0 0 0 0 203,042 203,042
Financial Debt 218,572 341,528 95,486 61,375 112,099 829,062
Financial instruments at fair value 0 19,033 1,326 1,015 0 21,375
Trade Accounts Payable 880,389 231,396 226,281 151,916 60,229 1,550,211
Operating Provisions 96,420 5,540 21,599 3,586 93,633 220,778
Other current liabilities 343,526 87,309 127,104 39,761 -85,250 512,450
1Q2017 – Presentation of Results
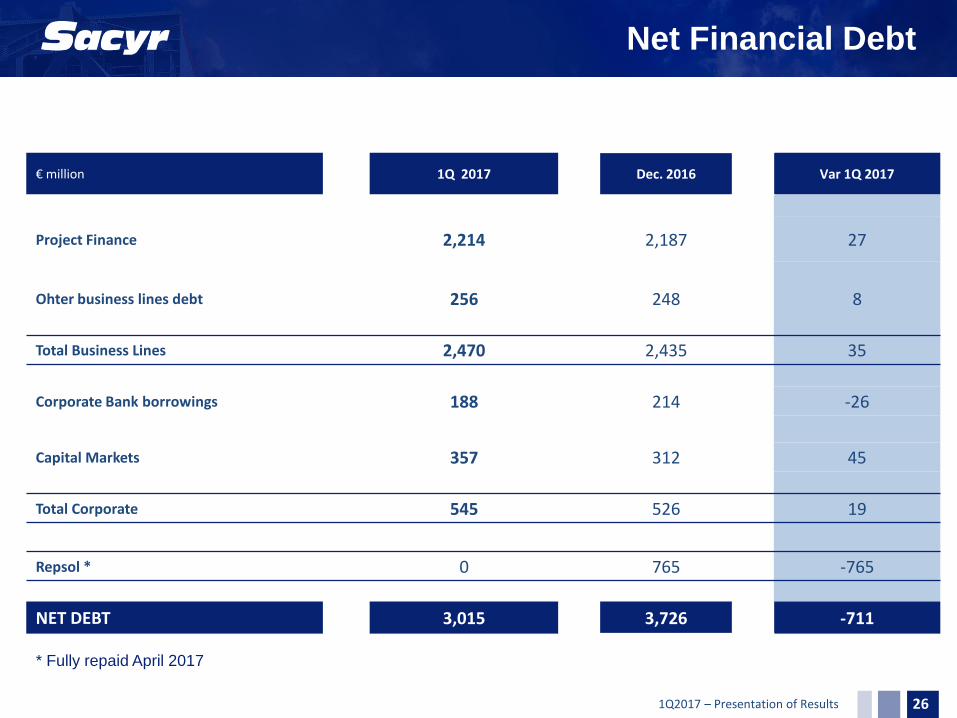
€ million 1Q 2017 Dec. 2016 Var 1Q 2017
Project Finance 2,214 2,187 27
Ohter business lines debt 256 248 8
Total Business Lines 2,470 2,435 35
Corporate Bank borrowings 188 214 -26
Capital Markets 357 312 45
Total Corporate 545 526 19
Repsol * 0 765 -765
NET DEBT 3,015 3,726 -711
* Fully repaid April 2017
Net Financial Debt
26
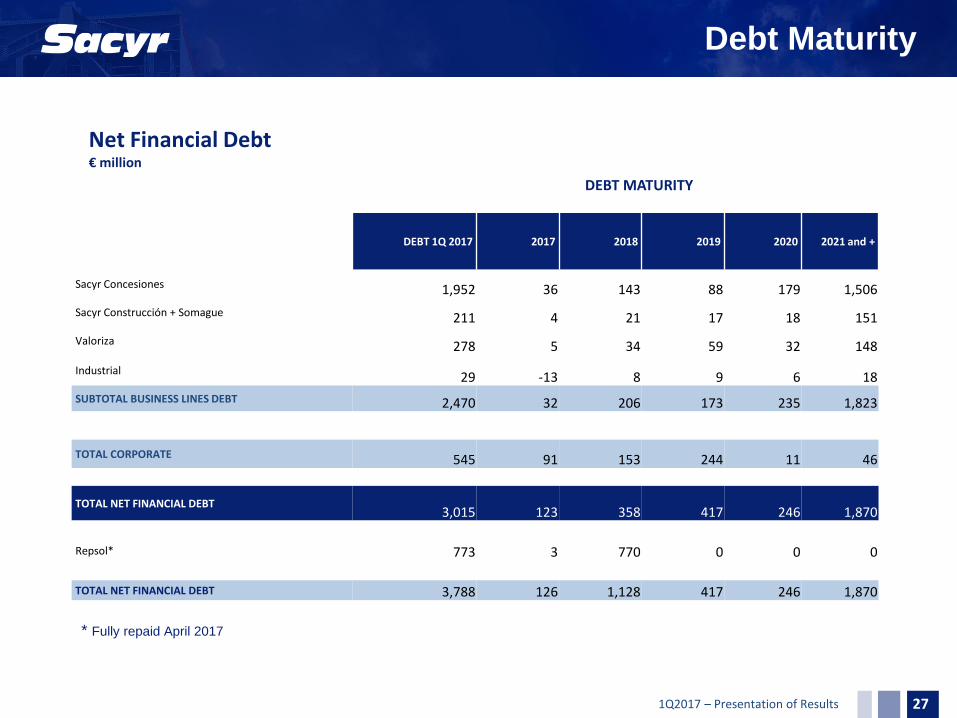
1Q2017 – Presentation of Results
DEBT MATURITY
DEBT 1Q 2017 2017 2018 2019 2020 2021 and +
Sacyr Concesiones 1,952 36 143 88 179 1,506
Sacyr Construcción + Somague 211 4 21 17 18 151
Valoriza 278 5 34 59 32 148
Industrial 29 -13 8 9 6 18
SUBTOTAL BUSINESS LINES DEBT 2,470 32 206 173 235 1,823
TOTAL CORPORATE 545 91 153 244 11 46
TOTAL NET FINANCIAL DEBT 3,015 123 358 417 246 1,870
Repsol* 773 3 770 0 0 0
TOTAL NET FINANCIAL DEBT 3,788 126 1,128 417 246 1,870
Net Financial Debt € million
Debt Maturity
* Fully repaid April 2017
27
1Q2017 – Presentation of Results
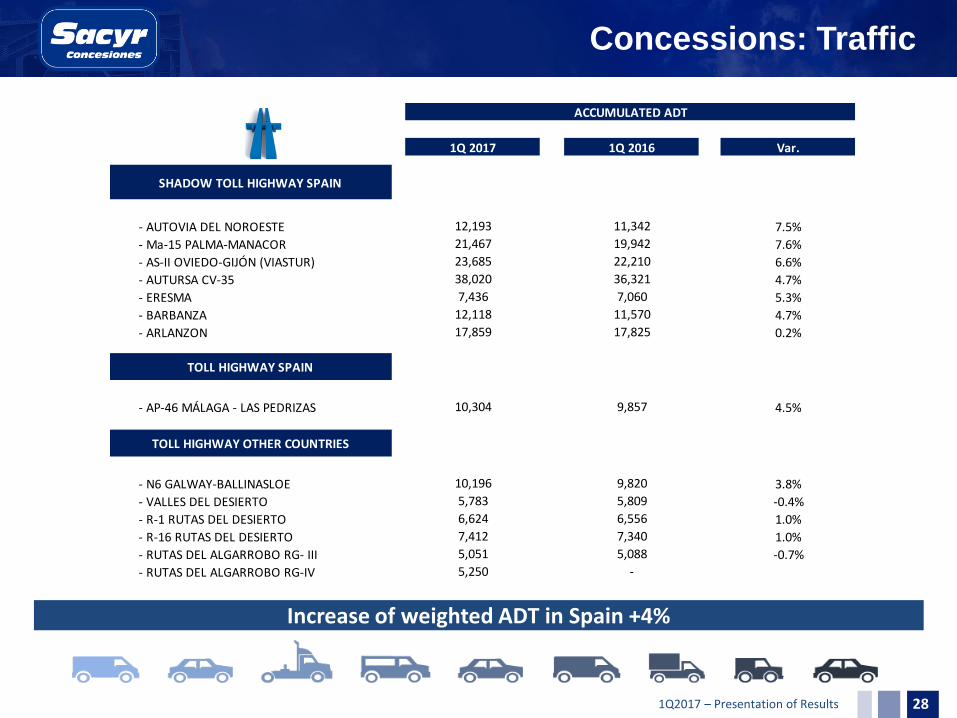
SHADOW TOLL HIGHWAY SPAIN
- AUTOVIA DEL NOROESTE
- Ma-15 PALMA-MANACOR
- AS-II OVIEDO-GIJÓN (VIASTUR)
- AUTURSA CV-35
- ERESMA
- BARBANZA
- ARLANZON
TOLL HIGHWAY SPAIN
- AP-46 MÁLAGA - LAS PEDRIZAS
TOLL HIGHWAY OTHER COUNTRIES
- N6 GALWAY-BALLINASLOE
- VALLES DEL DESIERTO
- R-1 RUTAS DEL DESIERTO
- R-16 RUTAS DEL DESIERTO
- RUTAS DEL ALGARROBO RG- III
- RUTAS DEL ALGARROBO RG-IV
21,467 19,942 7.6%23,685 22,210 6.6%
ACCUMULATED ADT
1Q 2017 1Q 2016 Var.
12,193 11,342 7.5%
12,118 11,570 4.7%17,859 17,825 0.2%
38,020 36,321 4.7%
7,436 7,060 5.3%
5,783 5,809 -0.4%6,624 6,556 1.0%
10,304 9,857 4.5%
10,196 9,820 3.8%
5,250 -
7,412 7,340 1.0%5,051 5,088 -0.7%
Increase of weighted ADT in Spain +4%
Concessions: Traffic
28
1Q2017 – Presentation of Results
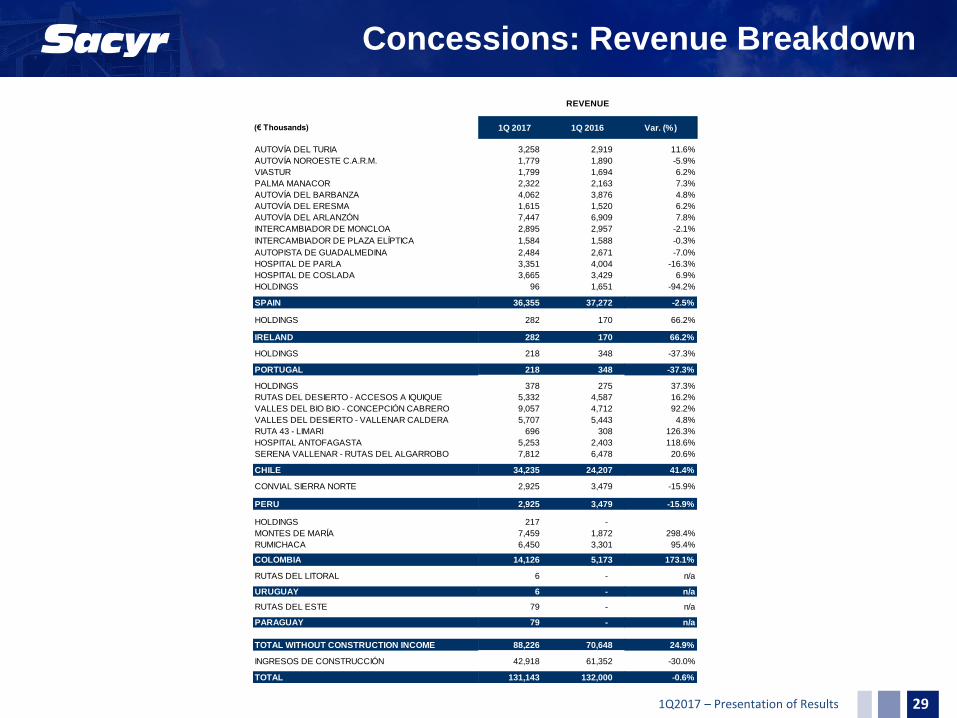
Concessions: Revenue Breakdown
29
(€ Thousands) 1Q 2017 1Q 2016 Var. (%)
AUTOVÍA DEL TURIA 3,258 2,919 11.6%
AUTOVÍA NOROESTE C.A.R.M. 1,779 1,890 -5.9%
VIASTUR 1,799 1,694 6.2%
PALMA MANACOR 2,322 2,163 7.3%
AUTOVÍA DEL BARBANZA 4,062 3,876 4.8%
AUTOVÍA DEL ERESMA 1,615 1,520 6.2%
AUTOVÍA DEL ARLANZÓN 7,447 6,909 7.8%
INTERCAMBIADOR DE MONCLOA 2,895 2,957 -2.1%
INTERCAMBIADOR DE PLAZA ELÍPTICA 1,584 1,588 -0.3%
AUTOPISTA DE GUADALMEDINA 2,484 2,671 -7.0%
HOSPITAL DE PARLA 3,351 4,004 -16.3%
HOSPITAL DE COSLADA 3,665 3,429 6.9%
HOLDINGS 96 1,651 -94.2%AEROPUERTO DE MURCIA CONCESIONARIA -1
SPAIN 36,355 37,272 -2.5%
HOLDINGS 282 170 66.2%
IRELAND 282 170 66.2%
HOLDINGS 218 348 -37.3%
PORTUGAL 218 348 -37.3%
HOLDINGS 378 275 37.3%
RUTAS DEL DESIERTO - ACCESOS A IQUIQUE 5,332 4,587 16.2%
VALLES DEL BIO BIO - CONCEPCIÓN CABRERO 9,057 4,712 92.2%
VALLES DEL DESIERTO - VALLENAR CALDERA 5,707 5,443 4.8%
RUTA 43 - LIMARI 696 308 126.3%
HOSPITAL ANTOFAGASTA 5,253 2,403 118.6%
SERENA VALLENAR - RUTAS DEL ALGARROBO 7,812 6,478 20.6%
CHILE 34,235 24,207 41.4%
CONVIAL SIERRA NORTE 2,925 3,479 -15.9%
PERU 2,925 3,479 -15.9%
HOLDINGS 217 -
MONTES DE MARÍA 7,459 1,872 298.4%
RUMICHACA 6,450 3,301 95.4%
COLOMBIA 14,126 5,173 173.1%
RUTAS DEL LITORAL 6 - n/a
URUGUAY 6 - n/a
RUTAS DEL ESTE 79 - n/a
PARAGUAY 79 - n/a
TOTAL WITHOUT CONSTRUCTION INCOME 88,226 70,648 24.9%
INGRESOS DE CONSTRUCCIÓN 42,918 61,352 -30.0%
TOTAL 131,143 132,000 -0.6%
REVENUE
1Q2017 – Presentation of Results
Alternative Performance Measures
30
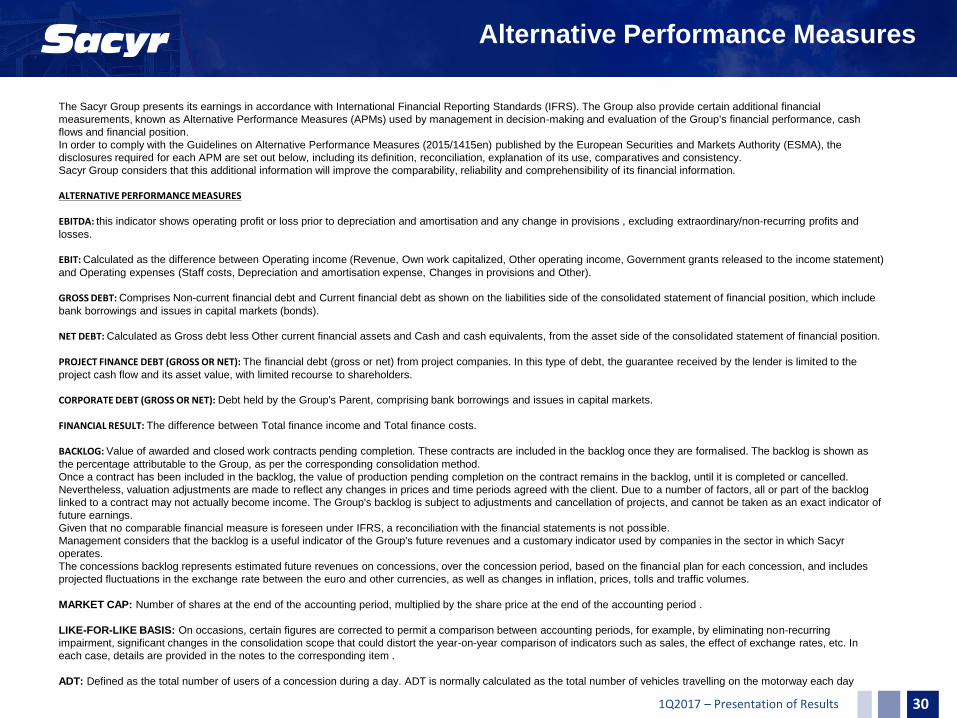
The Sacyr Group presents its earnings in accordance with International Financial Reporting Standards (IFRS). The Group also provide certain additional financial
measurements, known as Alternative Performance Measures (APMs) used by management in decision-making and evaluation of the Group's financial performance, cash
flows and financial position.
In order to comply with the Guidelines on Alternative Performance Measures (2015/1415en) published by the European Securities and Markets Authority (ESMA), the
disclosures required for each APM are set out below, including its definition, reconciliation, explanation of its use, comparatives and consistency.
Sacyr Group considers that this additional information will improve the comparability, reliability and comprehensibility of its financial information. ALTERNATIVE PERFORMANCE MEASURES EBITDA: this indicator shows operating profit or loss prior to depreciation and amortisation and any change in provisions , excluding extraordinary/non-recurring profits and
losses.
EBIT: Calculated as the difference between Operating income (Revenue, Own work capitalized, Other operating income, Government grants released to the income statement)
and Operating expenses (Staff costs, Depreciation and amortisation expense, Changes in provisions and Other). GROSS DEBT: Comprises Non-current financial debt and Current financial debt as shown on the liabilities side of the consolidated statement of financial position, which include
bank borrowings and issues in capital markets (bonds). NET DEBT: Calculated as Gross debt less Other current financial assets and Cash and cash equivalents, from the asset side of the consolidated statement of financial position.
PROJECT FINANCE DEBT (GROSS OR NET): The financial debt (gross or net) from project companies. In this type of debt, the guarantee received by the lender is limited to the
project cash flow and its asset value, with limited recourse to shareholders. CORPORATE DEBT (GROSS OR NET): Debt held by the Group's Parent, comprising bank borrowings and issues in capital markets.
FINANCIAL RESULT: The difference between Total finance income and Total finance costs.
BACKLOG: Value of awarded and closed work contracts pending completion. These contracts are included in the backlog once they are formalised. The backlog is shown as
the percentage attributable to the Group, as per the corresponding consolidation method.
Once a contract has been included in the backlog, the value of production pending completion on the contract remains in the backlog, until it is completed or cancelled.
Nevertheless, valuation adjustments are made to reflect any changes in prices and time periods agreed with the client. Due to a number of factors, all or part of the backlog
linked to a contract may not actually become income. The Group's backlog is subject to adjustments and cancellation of projects, and cannot be taken as an exact indicator of
future earnings.
Given that no comparable financial measure is foreseen under IFRS, a reconciliation with the financial statements is not possible.
Management considers that the backlog is a useful indicator of the Group's future revenues and a customary indicator used by companies in the sector in which Sacyr
operates.
The concessions backlog represents estimated future revenues on concessions, over the concession period, based on the financial plan for each concession, and includes
projected fluctuations in the exchange rate between the euro and other currencies, as well as changes in inflation, prices, tolls and traffic volumes.
MARKET CAP: Number of shares at the end of the accounting period, multiplied by the share price at the end of the accounting period .
LIKE-FOR-LIKE BASIS: On occasions, certain figures are corrected to permit a comparison between accounting periods, for example, by eliminating non-recurring
impairment, significant changes in the consolidation scope that could distort the year-on-year comparison of indicators such as sales, the effect of exchange rates, etc. In
each case, details are provided in the notes to the corresponding item .
ADT: Defined as the total number of users of a concession during a day. ADT is normally calculated as the total number of vehicles travelling on the motorway each day
1Q2017 – Presentation of Results
NOTE: The financial information contained in this document is drafted according to the International Financial Reporting
Standards. This information has not been audited and therefore may be modified in the future. This document is not a offer,
invitation or recommendation to buy, sell or exchange shares or make any kind of investment. Sacyr does not assume any
type of damages or losses as a result of the use of this document or its content.
In addition, the Group uses Alternative Performance Measures to provide with additional information which enhances the
comparability and comprehension of its financial information and facilitate the decision-making and the evaluation of the
group´s performance.
To comply with the Directives (2015/1415es) of European Securities and Markets Authority (ESMA) on APMs, this
document comprises the more outstanding APMs used in the preparation of this document (Annex).