presentación conference bpi - tubacex h1 2017_… · 1. tubacex group 2. recent evolution 3. 2017...
TRANSCRIPT
2017
Analyst Presentation
1. TUBACEX GROUP
2. RECENT EVOLUTION
3. 2017 OUTLOOK & HALF YEAR RESULTS
4. STRATEGIC PLAN 2016 -2020
Index
PROPUESTA DE ACUERDOS
1
TUBACEX GROUP
4Analyst Presentation 2017
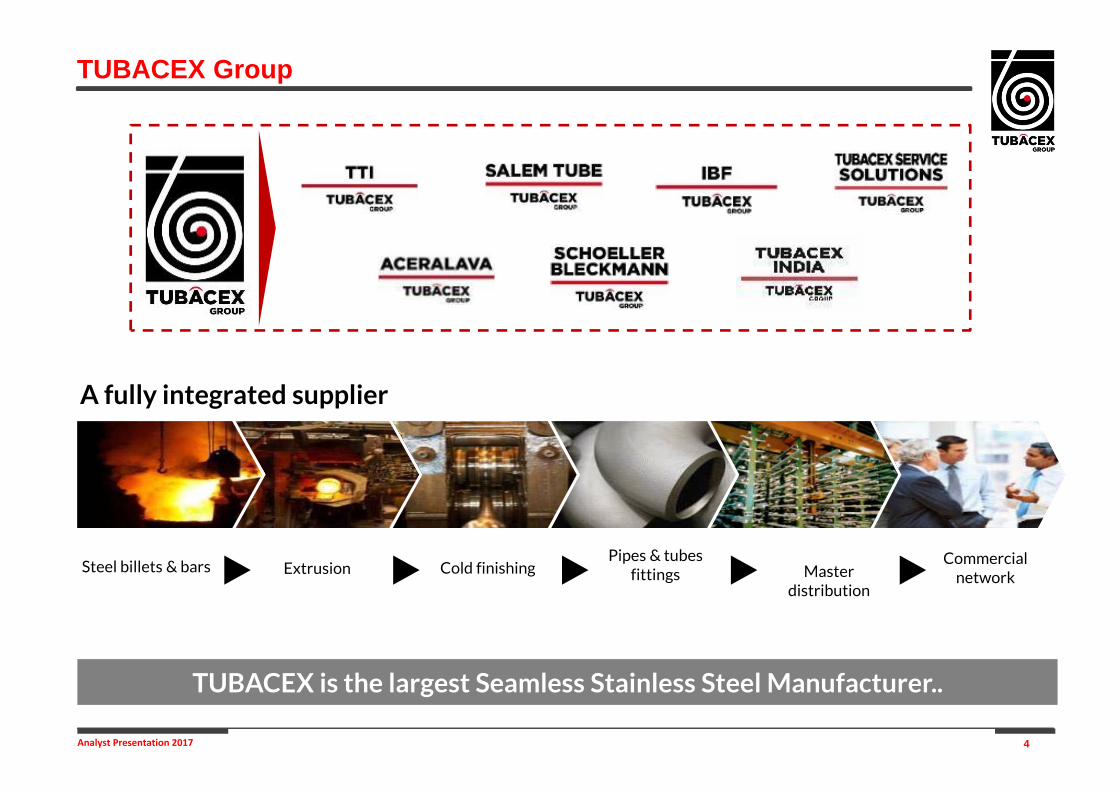
Pipes & tubesfittings Master
distribution
Commercial network
Steel billets & bars Extrusion Cold finishing
A fully integrated supplier
TUBACEX Group
TUBACEX is the largest Seamless Stainless Steel Manufacturer..
5Analyst Presentation 2017
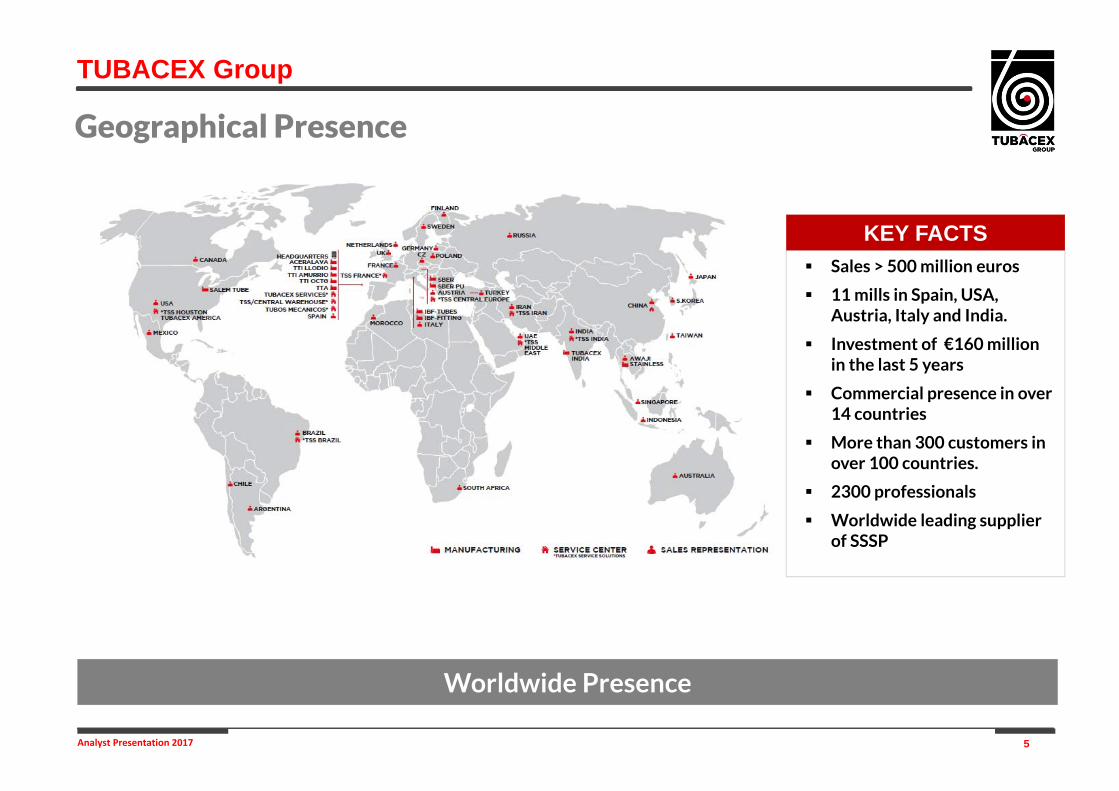
Sales > 500 million euros
11 mills in Spain, USA, Austria, Italy and India.
Investment of €160 million in the last 5 years
Commercial presence in over 14 countries
More than 300 customers in over 100 countries.
2300 professionals
Worldwide leading supplier of SSSP
KEY FACTS
TUBACEX Group
Geographical Presence
Worldwide Presence

6Analyst Presentation 2017
HeatExchangers
High Alloys
Nuclear
Urea
Umbilicals
Off-shore
Std Boilers
OCTG
Precision
StdDownstream
linepipe
Bar
Furnaces
SC Boilers
Mar
ket
Gro
wth
-
+
Profitability
The size indicates the volume of each segment, measured in Euros (not in tonnes)
Traditional Products Higher Added Value Products
- +
TUBACEX Group
Business Strategy
Changing successfully our former positioning
Focus on customer service and delivery excellence
Continue our technological development with new products and services
7Analyst Presentation 2017
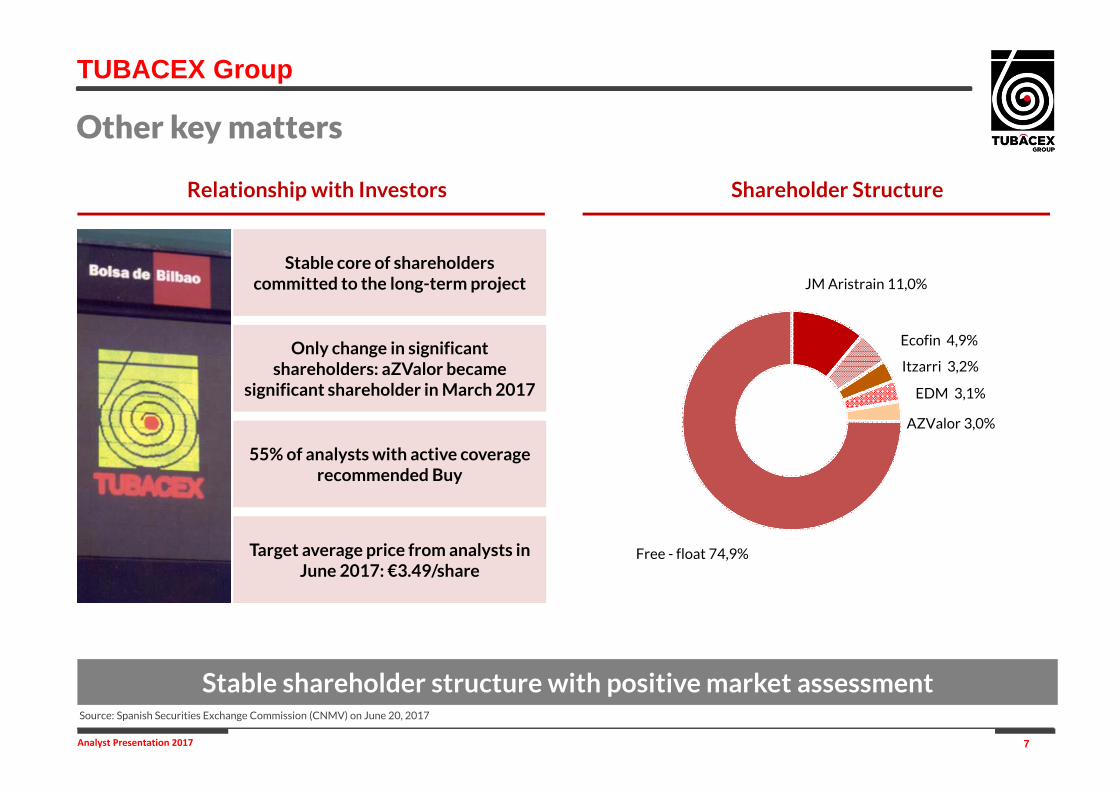
Other key matters
Stable shareholder structure with positive market assessment Source: Spanish Securities Exchange Commission (CNMV) on June 20, 2017
Shareholder StructureRelationship with Investors
Stable core of shareholders committed to the long-term project
Only change in significantshareholders: aZValor became
significant shareholder in March 2017
55% of analysts with active coveragerecommended Buy
Target average price from analysts in June 2017: €3.49/share
JM Aristrain 11,0%
Ecofin 4,9%
Itzarri 3,2%
EDM 3,1%
AZValor 3,0%
Free - float 74,9%
TUBACEX Group

RECENT EVOLUTION
2
9Analyst Presentation 2017
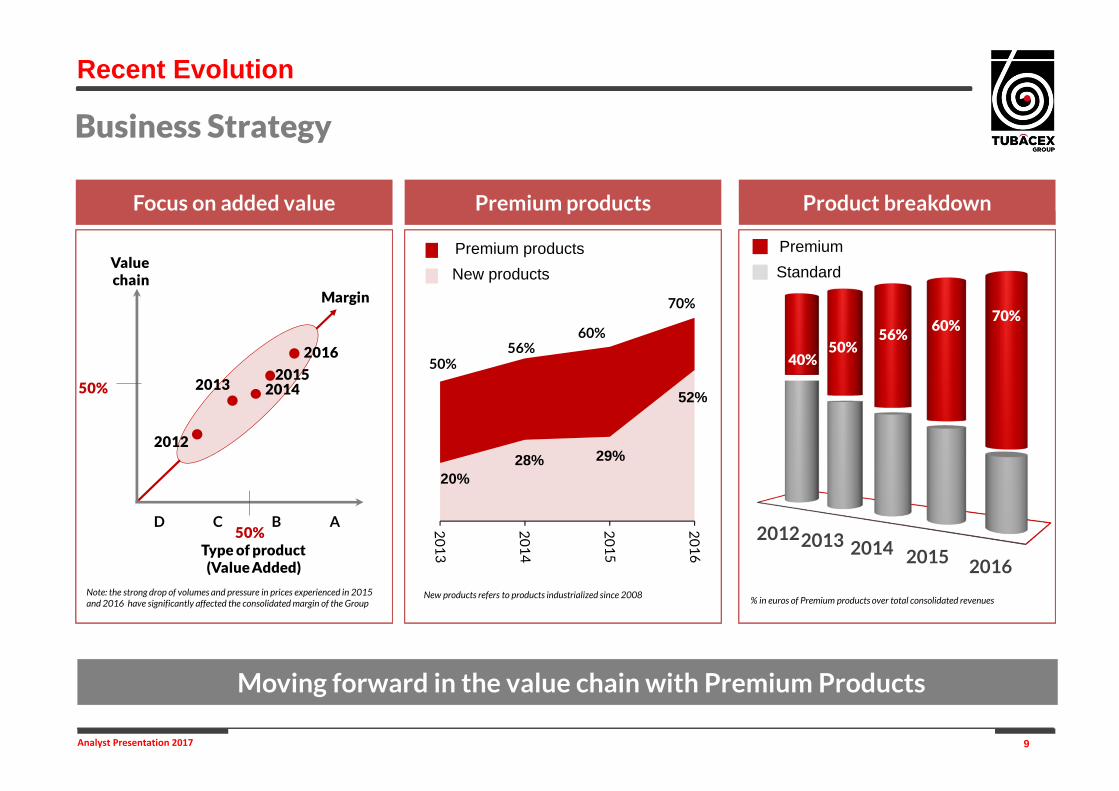
Business Strategy
Moving forward in the value chain with Premium Products
50% 53%
Product breakdown
20122013 2014 2015 2016
40%50%
56%
PremiumStandard
Premium productsNew products
Premium productsFocus on added value
60%
% in euros of Premium products over total consolidated revenuesNote: the strong drop of volumes and pressure in prices experienced in 2015 and 2016 have significantly affected the consolidated margin of the Group
Recent Evolution
New products refers to products industrialized since 2008
70%
Type of product(Value Added)
Valuechain
Margin
D C B A
2012
20132015
50%
201450%
2016
20%28% 29%
52%
50%56%
60%
70%
10Analyst Presentation 2017
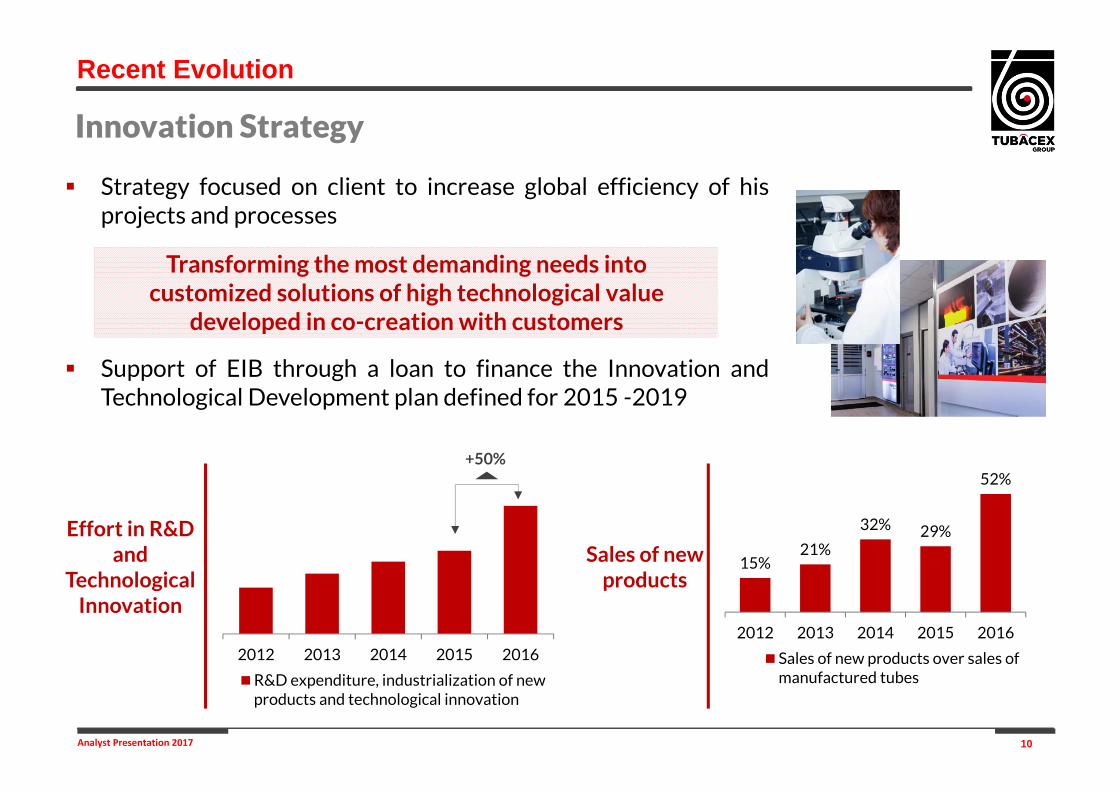
Strategy focused on client to increase global efficiency of hisprojects and processes
Support of EIB through a loan to finance the Innovation andTechnological Development plan defined for 2015 -2019
Transforming the most demanding needs into customized solutions of high technological value
developed in co-creation with customers
Effort in R&D and
Technological Innovation
2012 2013 2014 2015 2016
R&D expenditure, industrialization of newproducts and technological innovation
+50%
Sales of new products
15%21%
32% 29%
52%
2012 2013 2014 2015 2016
Sales of new products over sales ofmanufactured tubes
Innovation Strategy
Recent Evolution

11Analyst Presentation 2017
Significant improvement of results until Oil crash
Revenues (€M)*
532
575
612
554 557
2012 2013 2014 2015 2016
Main figures evolution
46 5164
4935
5,7%9,3%
11,7%
9,2%7,1%
2012 2013 2014 2015 2016
EBITDA Margin
+15% +40%
EBITDA (€M) EBIT (€M)
27 3244
162
5,0%
5,7%8,0%
2,9% 0,5%
2012 2013 2014 2015 2016
EBIT Margin
+65%
Net Profit (€M)
12,015,0
24,0
8,4
0,52,2% 2,7%4,3%
1,6%0,1%
2012 2013 2014 2015 2016
Bº Neto Margin
x2
NFD (€M)
* Revenues figure assuming nickel stable
262195
152
221 207
2012 2013 2014 2015 2016
* Acquisition of two Companies (IBF and Prakash)
*
Recent Evolution
12Analyst Presentation 2017
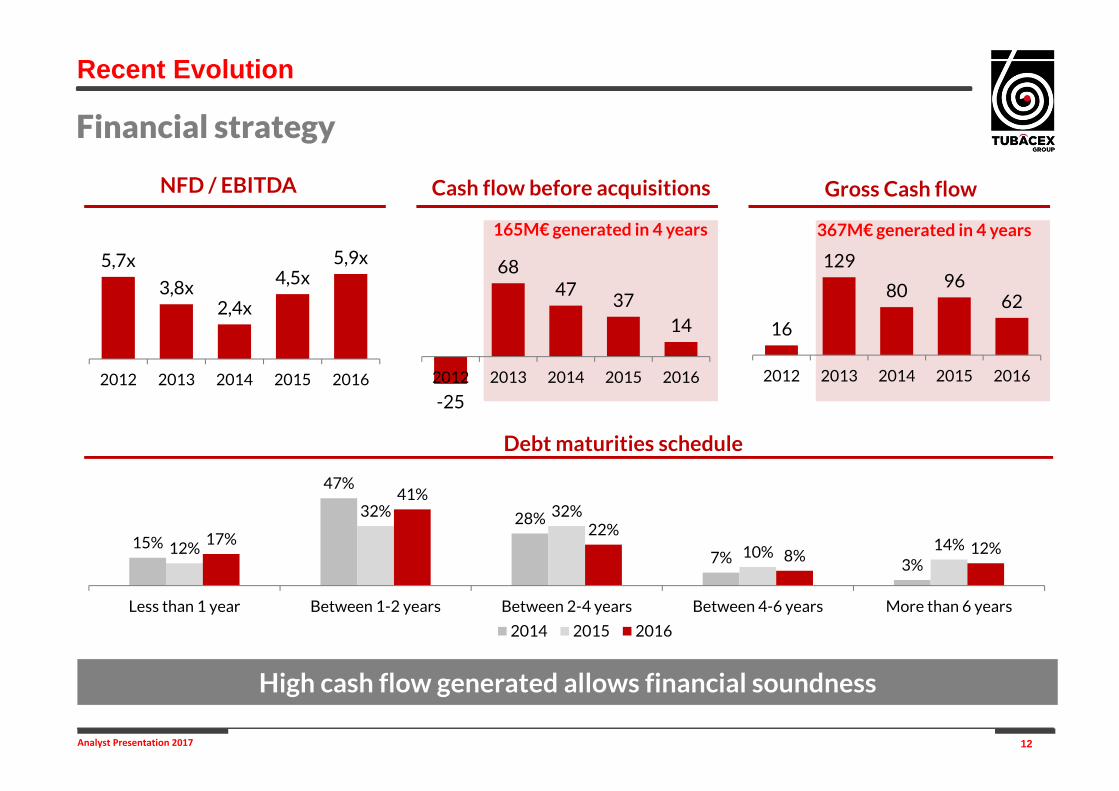
16
129
80 9662
2012 2013 2014 2015 2016
-25
6847
3714
2012 2013 2014 2015 2016
Financial strategy
High cash flow generated allows financial soundness
5,7x
3,8x2,4x
4,5x5,9x
2012 2013 2014 2015 2016
165M€ generated in 4 years
NFD / EBITDA Gross Cash flow
15%
47%
28%
7% 3%12%
32% 32%
10% 14%17%
41%
22%
8% 12%
Less than 1 year Between 1-2 years Between 2-4 years Between 4-6 years More than 6 years
2014 2015 2016
367M€ generated in 4 years
Debt maturities schedule
Cash flow before acquisitions
Recent Evolution
13Analyst Presentation 2017
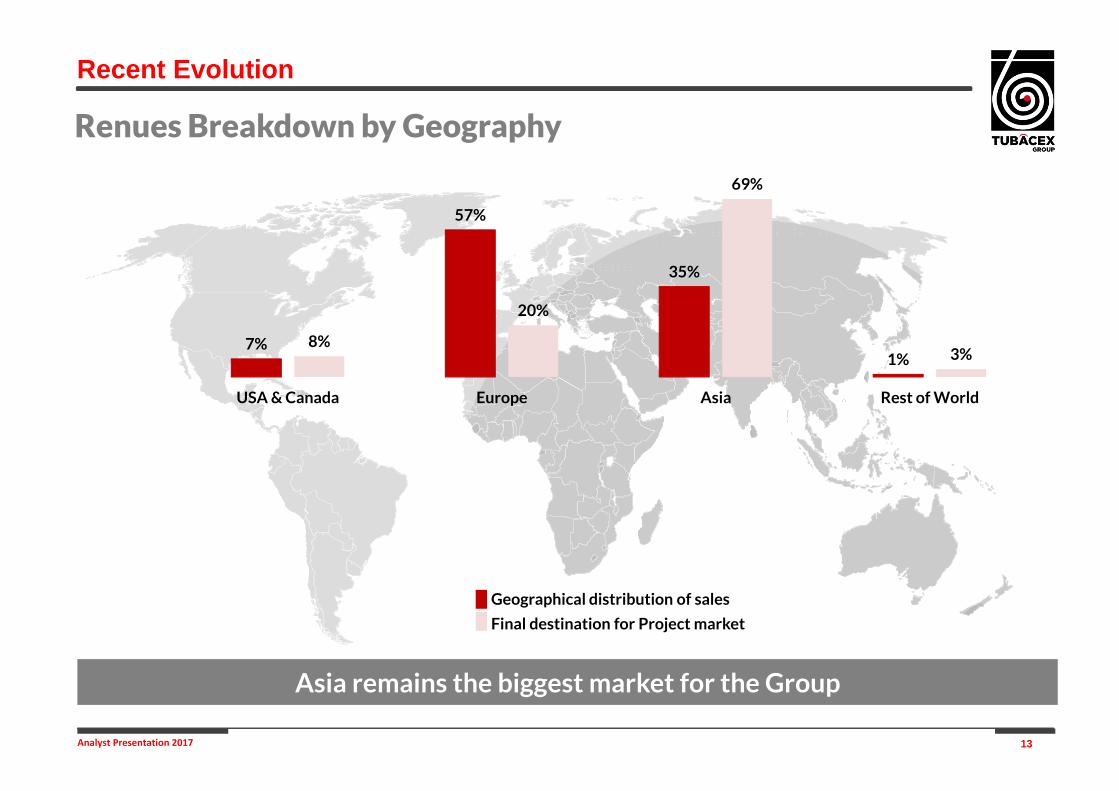
Renues Breakdown by Geography
7%
57%
35%
1%8%
20%
69%
3%
USA & Canada Europe Asia Rest of World
Geographical distribution of sales
Final destination for Project market
Asia remains the biggest market for the Group
Recent Evolution

14Analyst Presentation 2017
Offsetting the crisis in today's market
Tubacex Action Plan
Market environment TUBACEX
Deterioration of the mix, volumes, prices and
marginsResilience to the crisis
Raw Materials: continuing low prices
Oil&Gas Sector: investment cuts anddelays in the implementation of projects.
Worldwide Growth: Low worldwidegrowth and worsening expectations.
Prices: prices at historically low levels.
Important change in the product mixdemanded and the value chain
Diversification: of sectors, productsand markets.
Cost Control: Adjustment plan in allexpenditure items
Competitiveness: Focus on Leancompany, operational improvements,reduced lead-time, etc.
Financial Strategy: reduction of costs,extending the maturity and diversificationof the sources of funding
Concentration on cash generation
We are not stopping our strategicprojects
Recent Evolution

15Analyst Presentation 2017
Concept design Product design Manufacture Logistics Installation & Maintenance
Growing in the complete Value Chain to become the best supplier for integrated solution
New servicesNew Products New Tecnologies
Key issues in 2016
Providing the best solution by…
• Co-development with customers• New grades and materials• Offer of new dimensions and
applications• Design of customized solutions• Complementary products
• Lean manufacturing practices
• New production processes
• Additional treatments and finishes
• Optimized logistics centers / Time to market
• Assistance at plants and maintenance
Recent Evolution

16Analyst Presentation 2017
Concentration on cash generation and defending the Balance Sheet
Continuation of the projects launched in 2015
Focus on the plan to reduce overheads
Growth from the increased market share in strategic products and marketsand entry into new sectors other than Oil&Gas
Improved market positioning with End-user and EPCs
Development of new products, grades and technologies
Rapid evolution towards Supplier of comprehensive Solutions
We will not stop important strategic investments
We will emerge stronger from this crisis
Key Aspects
Recent Evolution
17Analyst Presentation 2017
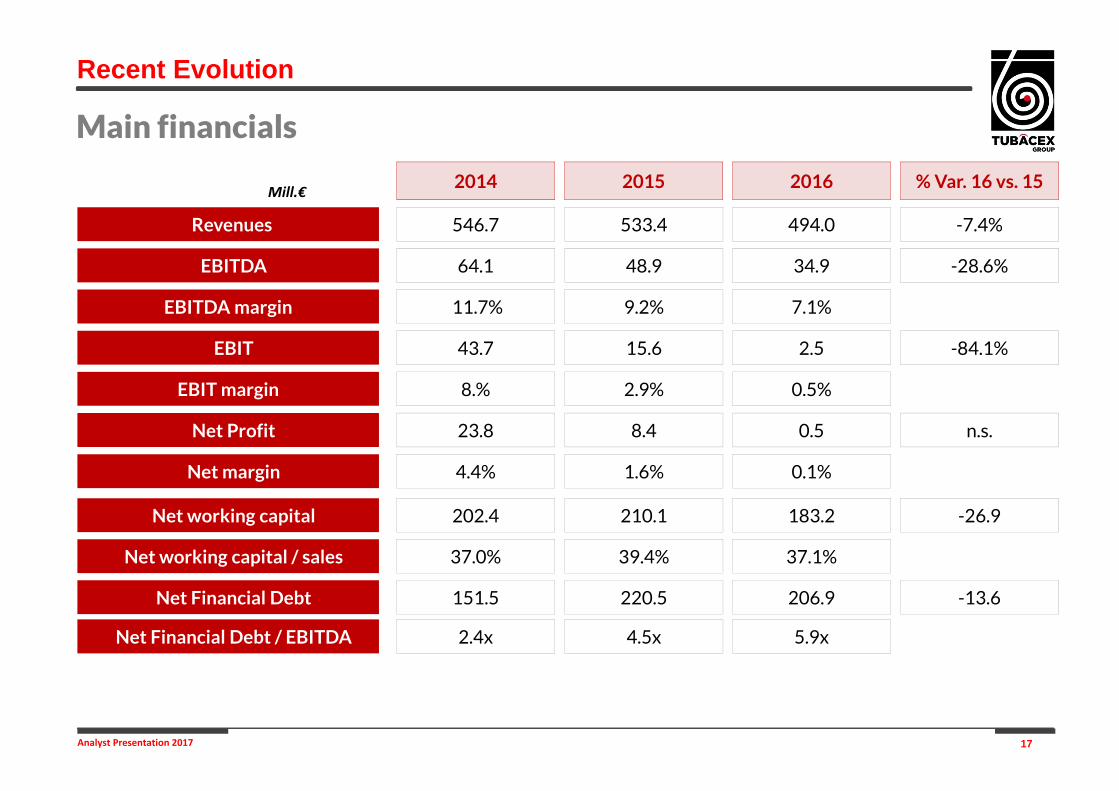
Main financials
Mill.€
Revenues
EBITDA
EBITDA margin
EBIT
EBIT margin
546.7
64.1
11.7%
43.7
8.%
Net Profit
Net margin
23.8
4.4%
533.4
48.9
9.2%
15.6
2.9%
8.4
1.6%
Net working capital 202.4
Net working capital / sales 37.0%
210.1
39.4%
20152014
494.0
34.9
7.1%
2.5
0.5%
0.5
0.1%
183.2
37.1%
2016
Net Financial Debt 151.5 220.5 206.9
Net Financial Debt / EBITDA 2.4x 4.5x 5.9x
-7.4%
-28.6%
-84.1%
n.s.
-26.9
% Var. 16 vs. 15
-13.6
Recent Evolution
2017 OUTLOOK & HALF YEAR
RESULTS
3

19Analyst Presentation 2017
Oil Sector
Two consecutive years of reduced investments
664.767
492.311
377.065 404.571
2014 2015 2016E 2017E
Sourcte: Barclays Global 2017 E&P Spending Outlook (January 2017)
UpstreamCapex
evolution
($MM)-26%
-23%
+7%
-38% +27%
-37% +9%
-20% +13%
-18% +2%
+8% +3%
-24% -6% -5% +10%
Caída Capex 2016
Caída Capex estimada 2017
Norte América
América Latina
Europa
Oriente Medio
Africa
India + Asia + Australia
Rusia + FSU
Two consecutive years of reduced investment for the first time in 30 years, can have a dramatic impact on thedecline rate of mature assets, thus the global upstream investment is expected to increase in 2017
2017 Outlook & Half Year Results

20Analyst Presentation 2017
A gradual recovery is expected to start from 2017 onwards
0
100
200
300
400
500
600
20
07
20
08
20
09
20
10
20
11
20
12
20
13
20
14
20
15
20
16
20
17
e
20
18
e
20
19
e
20
20
e
20
21
e
Golden Triangle Rest of World
The subsea market has undergone the most significant downturn in recent history
After the bottom in 2016, a gradual recovery is expected to start from 2017 onwards
Source: Wood Mackenzie
SubseaTrees
Orders(#)
Global SubseaCapex
($Bn)
Source: Rystad Energy
0
25000
50000
Subsea Services Subsea Equipment SURF
Oil Sector
2017 Outlook & Half Year Results

21Analyst Presentation 2017
It will take some years to return to the level of new projects launched in2013-2014
Only projects that are sustainable at barrel prices of 50-60 USD will beapproved
Capex level required for similar projects before the crisis will be reducedby 20-30%
Corporate mergers change the decision-making centers
Intermediaries that do not add value will disappear
What we learned from 2016
The sector is being restructured
2017 Outlook & Half Year Results

22Analyst Presentation 2017
Our Response
Real contribution to the optimization of costs and reduction of Capex
We must be proactive, offering the market:
Co-design in the prior phase to optimize costs
Standardization in the design of plants
Multi-year framework contracts offering “just in time” services andbetter prices
Elimination of “non-value” in the whole supply chain
Service in installation and after-sale maintenance
2017 Outlook & Half Year Results
23Analyst Presentation 2017
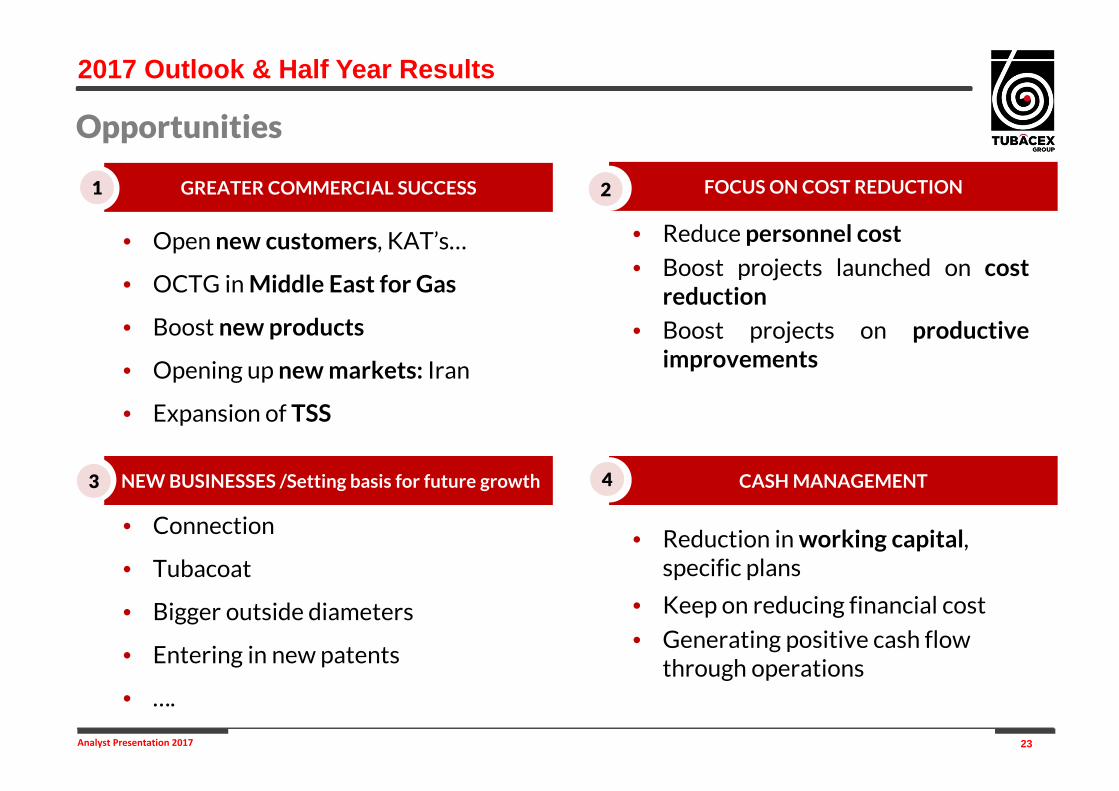
FOCUS ON COST REDUCTION
• Connection
• Tubacoat
• Bigger outside diameters
• Entering in new patents
• ….
• Reduction in working capital, specific plans
• Keep on reducing financial cost
• Generating positive cash flow through operations
• Open new customers, KAT’s…
• OCTG in Middle East for Gas
• Boost new products
• Opening up new markets: Iran
• Expansion of TSS
• Reduce personnel cost
• Boost projects launched on costreduction
• Boost projects on productiveimprovements
GREATER COMMERCIAL SUCCESS
NEW BUSINESSES /Setting basis for future growth CASH MANAGEMENT
Opportunities
2
4
1
3
2017 Outlook & Half Year Results
24Analyst Presentation 2017
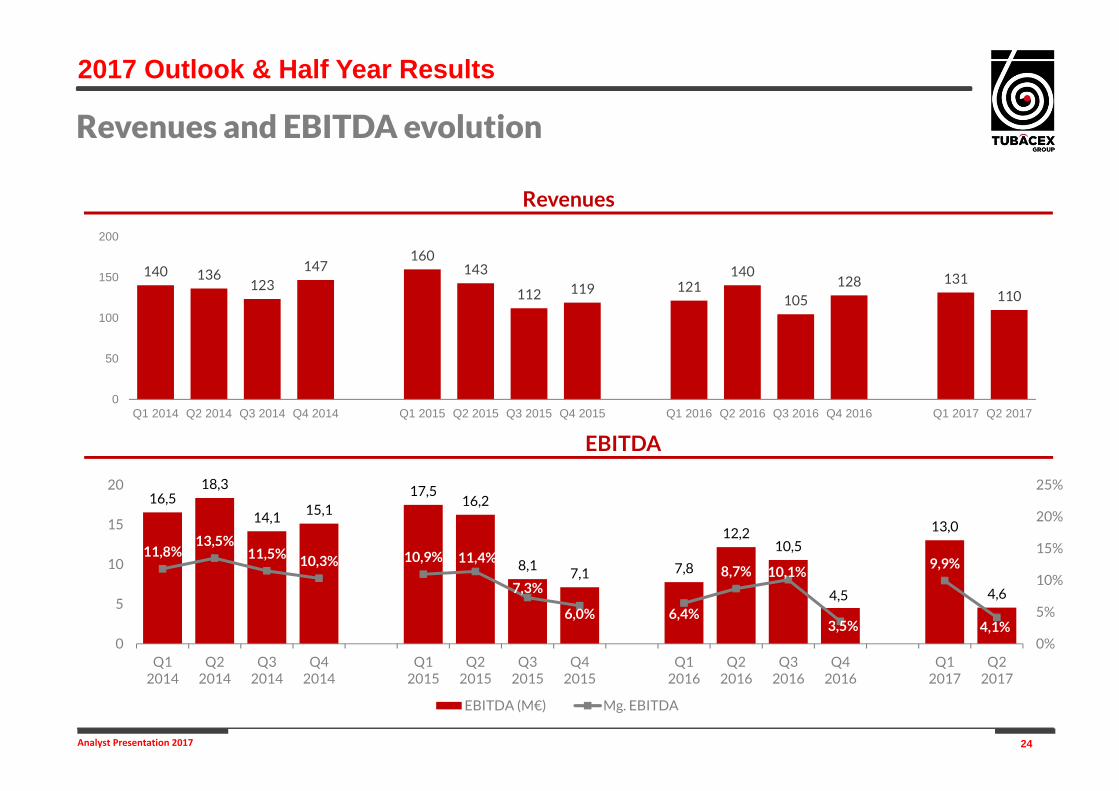
Revenues and EBITDA evolution
EBITDA
Revenues
2017 Outlook & Half Year Results
140 136123
147160
143
112 119 121140
105128 131
110
0
50
100
150
200
Q1 2014 Q2 2014 Q3 2014 Q4 2014 Q1 2015 Q2 2015 Q3 2015 Q4 2015 Q1 2016 Q2 2016 Q3 2016 Q4 2016 Q1 2017 Q2 2017
16,518,3
14,1 15,117,5
16,2
8,17,1 7,8
12,210,5
4,5
13,0
4,6
11,8%13,5%
11,5% 10,3% 10,9% 11,4%
7,3%
6,0% 6,4%
8,7% 10,1%
3,5%
9,9%
4,1%0%
5%
10%
15%
20%
25%
0
5
10
15
20
Q12014
Q22014
Q32014
Q42014
Q12015
Q22015
Q32015
Q42015
Q12016
Q22016
Q32016
Q42016
Q12017
Q22017
EBITDA (M€) Mg. EBITDA
25Analyst Presentation 2017
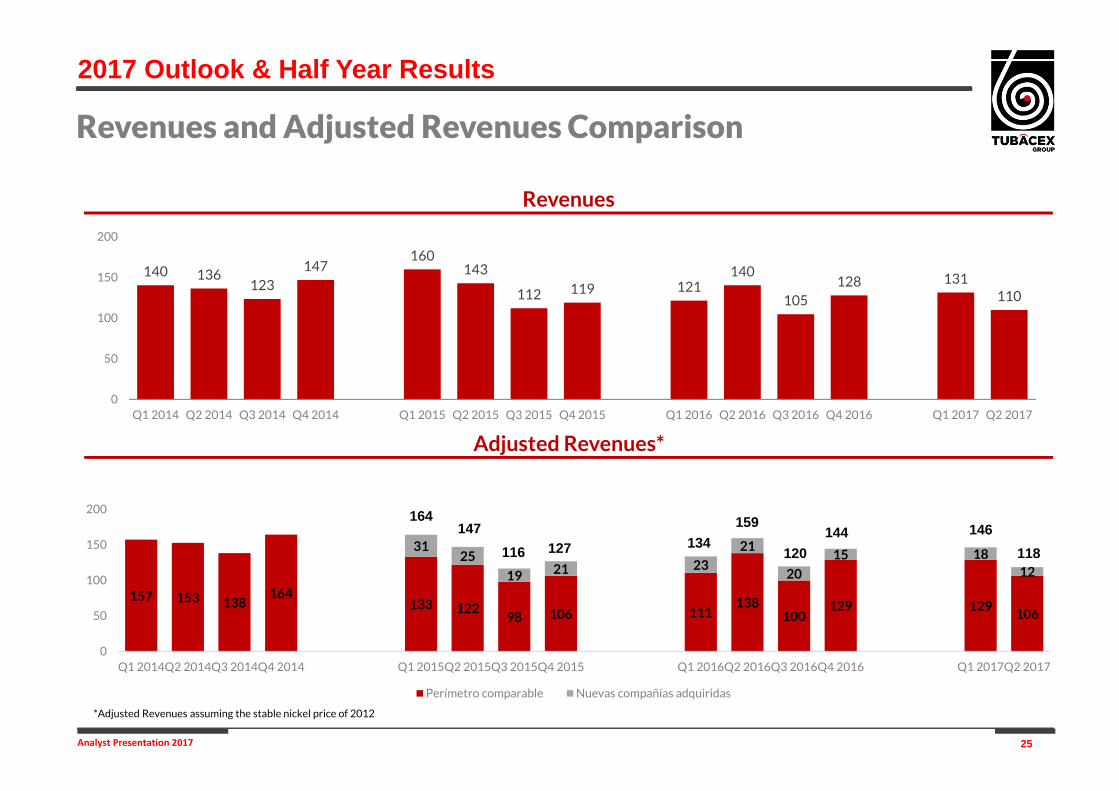
Revenues and Adjusted Revenues Comparison
Adjusted Revenues*
Revenues
*Adjusted Revenues assuming the stable nickel price of 2012
2017 Outlook & Half Year Results
140 136123
147160
143
112 119 121140
105128 131
110
0
50
100
150
200
Q1 2014 Q2 2014 Q3 2014 Q4 2014 Q1 2015 Q2 2015 Q3 2015 Q4 2015 Q1 2016 Q2 2016 Q3 2016 Q4 2016 Q1 2017 Q2 2017
157 153 138164
133 12298 106 111
138100
129 129106
3125
19 21 23
21
20
15 1812
0
50
100
150
200
Q1 2014Q2 2014Q3 2014Q4 2014 Q1 2015Q2 2015Q3 2015Q4 2015 Q1 2016Q2 2016Q3 2016Q4 2016 Q1 2017Q2 2017
Perímetro comparable Nuevas compañías adquiridas
164147
116
159
127 134120
144 146118

26Analyst Presentation 2017
Main financials
Mill.€
Revenues
EBITDA
EBITDA margin
EBIT
EBIT margin
261.5
19.9
7.6%
3.1
1.2%
Net Profit
Net margin
1.7
0.7%
241.4
17.6
7.3%
0.8
0.3%
1.9
0.8%
Net working capital 183.2
Net working capital / sales 37.1%
211.7
44.7%
H1 2017H1 2016
Net Financial Debt 206.9 243.9
Net Financial Debt / EBITDA 5.9x 7.5x
-7.7%
-11.7%
-73.7%
9.0%
+28.5
% Var.
+37.0
H1 2017FY 2016 Var.
2017 Outlook & Half Year Results
140.2
12.2
8.7%
3.7
2.7%.
2.2
1.6%
110.1
4.6
4.1%
-3.8
neg.
-0.9
neg.
Q2 2017Q2 2016
-21.5%
-62.5%
n.m.
n.m.
% Var.
neg.: negativen.m.: not meaningful

27Analyst Presentation 2017
2015 2016 H1 2017
26% 24% 31%
30%
16%
26%
26%48%
28%
13%11% 13%
5% 1% 2%
E&P Oil&Gas Refining
Power Gen Chem & Petrochem.
Others
Sales breakdown by sector*
* Direct sales to engineering firms and end-users
Strong positioning in Oil&Gas and Energy
56%
E&P Oil & Gas:– Despite the cuts in the Capex of oil companies
some specific big projects awarded that helped the gradual increase
– Better relative performance of the gas sector
Power Generation:– After two years of record sales of tubes for boilers
at power stations with supercritical technology, some decrease due to new regulations
– Integral tubular solutions thanks to the incorporation of IBF and the development of new grades and technologies
Downstream:– Downward trend during the last quarters, but
some big projects in Far East to be awarded– Sales to the LNG sector can be highlighted
Other alloys– Diversifying effort– Incorporation of new grades in the product
portfolio– Gradual increase of fertilizer orders
40%
57%
2017 Outlook & Quarterly Results
PROPUESTA DE ACUERDOS
4
STRATEGIC PLAN2016 - 2020

29Analyst Presentation 2017
Strategic Plan 2013 - 2017
Strategic Plan 2016 - 2020
From tube manufacturer to premium tubular solutions provider
Under normal marketcircumstances, 2015 would havebeen the year for theconsolidation of the StrategicPlan, practically fulfilling theobjective set for 2017
If it were not for the oil crisis, we would have fulfilled our Strategic Plan
We launch a new plan 2016 - 2020

30Analyst Presentation 2017
Reinforce TUBACEX’s positioning as global tubular solutionsprovider
Reduce volatility by diversifying risks
Strategic Plan 2016 – 2020: 4 Objectives
1
Oil&Gas 67,0%Power Gen
14,0%
Petrochem.14,0%
Others 5,0%Oil&Gas
Power Gen
Other energies
Industrial
Revenues 2013 Revenues 2020
2
Strategic Plan 2016 - 2020
31Analyst Presentation 2017
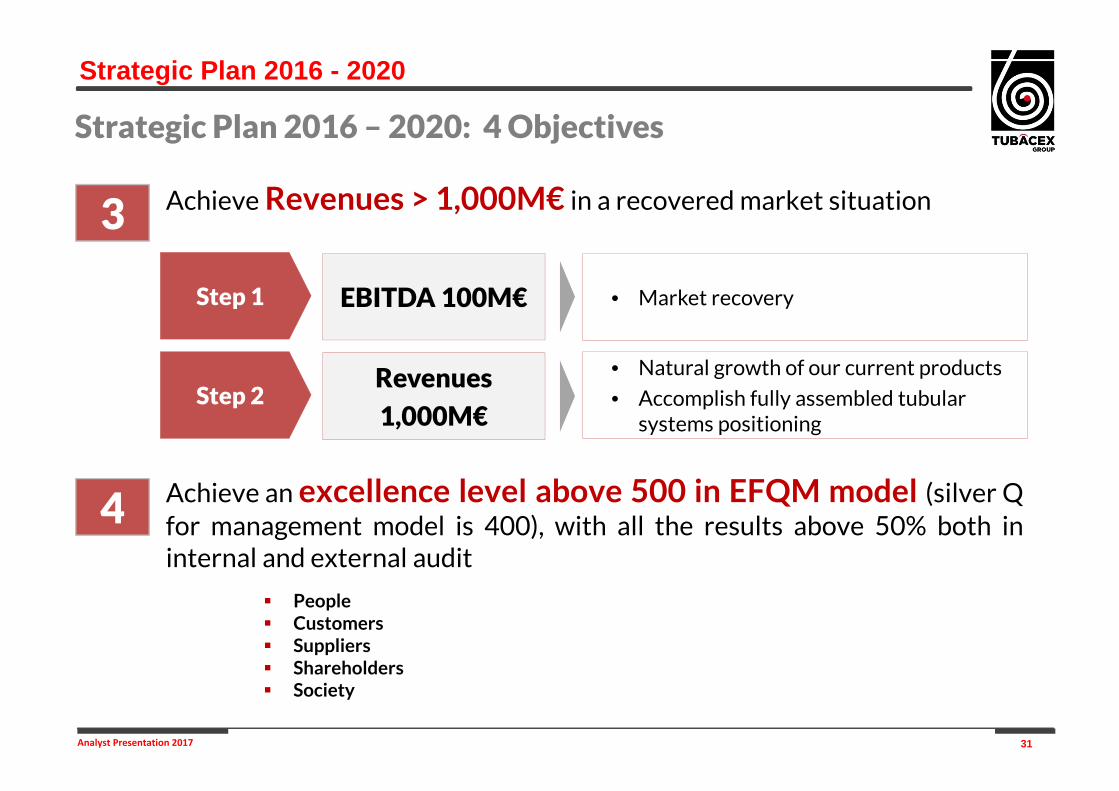
Achieve Revenues > 1,000M€ in a recovered market situation3
Strategic Plan 2016 – 2020: 4 Objectives
EBITDA 100M€
Revenues
1,000M€
Step 1
Step 2
• Market recovery
• Natural growth of our current products
• Accomplish fully assembled tubular systems positioning
Achieve an excellence level above 500 in EFQM model (silver Qfor management model is 400), with all the results above 50% both ininternal and external audit
4
People Customers Suppliers Shareholders Society
Strategic Plan 2016 - 2020
32Analyst Presentation 2017
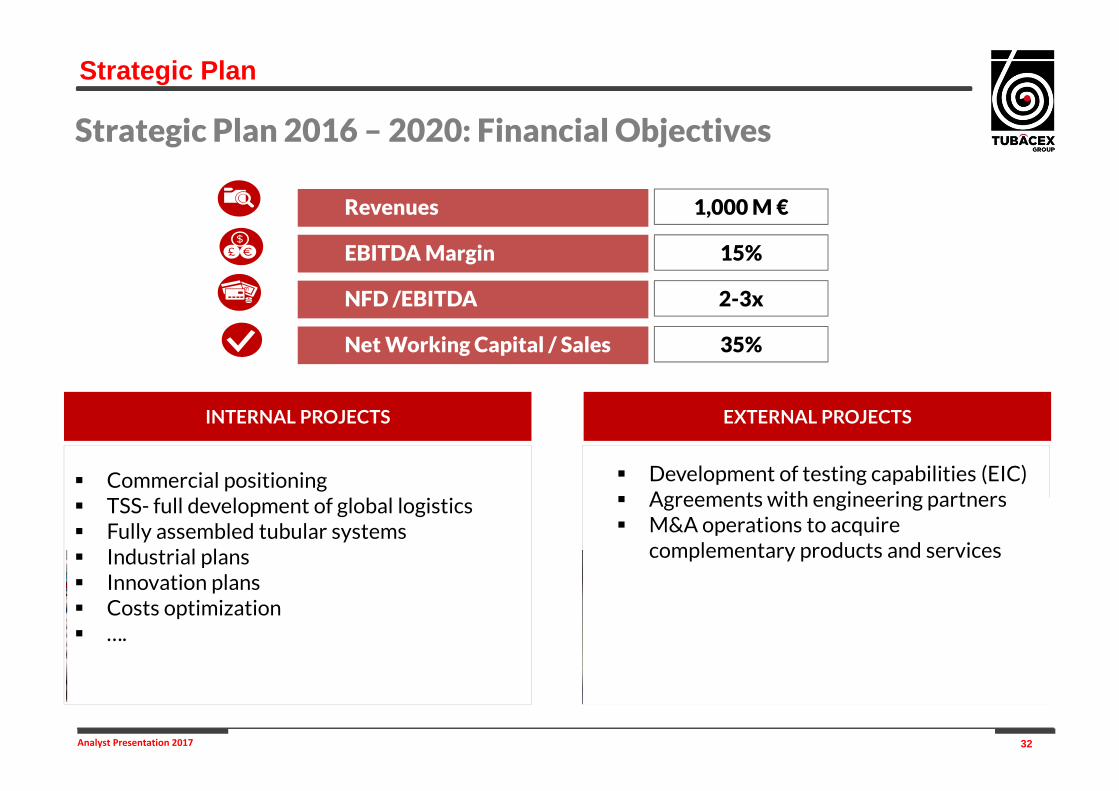
Revenues
NFD /EBITDA
Net Working Capital / Sales
1,000 M €
EBITDA Margin
Commercial positioning TSS- full development of global logistics Fully assembled tubular systems Industrial plans Innovation plans Costs optimization ….
INTERNAL PROJECTS EXTERNAL PROJECTS
Strategic Plan
15%
2-3x
35%
Strategic Plan 2016 – 2020: Financial Objectives
Development of testing capabilities (EIC) Agreements with engineering partners M&A operations to acquire
complementary products and services
33Analyst Presentation 2017WWW.TUBACEX.COM
THANK YOU!
WWW.TUBACEX.COM