presentación de resultados - grupo argos - inversiones … · · 2017-11-15focus on cement, ......
TRANSCRIPT
ResultsPresentation
3Q 2017
IMPORTANT NOTE
This presentation contains certain forward-looking information and statements related to GRUPO ARGOS and its subsidiaries that are based on knowledge of current events,expectations and forecasts, circumstances, and assumptions of future events. Many factors could cause the future results, performance or achievements of GRUPO ARGOS andits subsidiaries to be different to those expressed or assumed herein.
If an unforeseen situation occurs, or the premises or estimations are shown to be incorrect, the future results may be considerably different to those stated herein. The forward-looking statements are made to this date, and GRUPO ARGOS and its subsidiaries do not claim nor assume any obligation to update these forward-looking statements as a resultof new information, future events or any other factor.

3
COHERENCE AND DISCIPLINE IN OUR STARTEGY: LEVERAGE OF EXCELENT RESULTS
STR
ATEG
Y
Simplification and focus Portfolio profitability Profitable growth Efficient capital allocation1 2 3 4
2014✓ 6.3 mm Sura PF
shares divested
2015
✓ Divestment of 300
thousand shares of Sura
PF
✓ Divestment of 5 mm
shares of Bancolombia
Ord
2016
✓ Completed acquisition of 98.6% of
Odinsa
✓ Divestment of 2.2 mm of Sura PF
shares
✓ Divestment of 7.7 mm shares of
Bancolombia Ord
TYPE OF HOLDING: ACTIVE MANAGER
Sept 2017✓ Acquisition of 30% of Opain (Control 65%)
✓ Optimization and simplification of Odinsa´s portfolio
✓ Divestment of Compas
✓ Reached shareholding participation in Odinsa of 99.7%
✓ Close and first debt disbursement for the 4G project Pacifico II
✓ Odinsa issues COP 400bn in bonds (oversubscribed 2.23x)
❖ Intentions to simplify the energy business with the
announcement of Celsia to acquire up to 14% of EPSA and issue
up to 350 mm of shares
❖ Divestment of land parcels with profitability focus3

4
SALE OF COMPAS REAFFIRMS OUR COMMITMENT TO MANAGE EFFICIENTLY OUR INVESTMENT PORTFOLIO
• MúltiplosStrategic rational • MúltiplosAccounting Impact on Grupo Argos
▪ Fulfillment of investment thesis
▪ Exercise role of active holding
▪ Focus on cement, energy and roads
and airports concessions
▪ Financial flexibility to efficiently
manage portfolio
• MúltiplosContribution to the 3Q17 strategy
▪ Accounting effects at the consolidated level will
imply a reduction in profit of -COP 4 bn/ year
on the equity method
COP billionP&L
separate
P&L
consolidated
Revenues from sale of
shares
COP 403 COP 403
Cost of shares COP 182 COP 250
Ebitda of the operation COP 221 COP 153
Cash position 3Q17
COP 267 bn
Change in the debt profile
Amortization: COP 195 bn
Gross debt / adjusted Ebitda 2.2x
STR
ATEG
Y
4
5
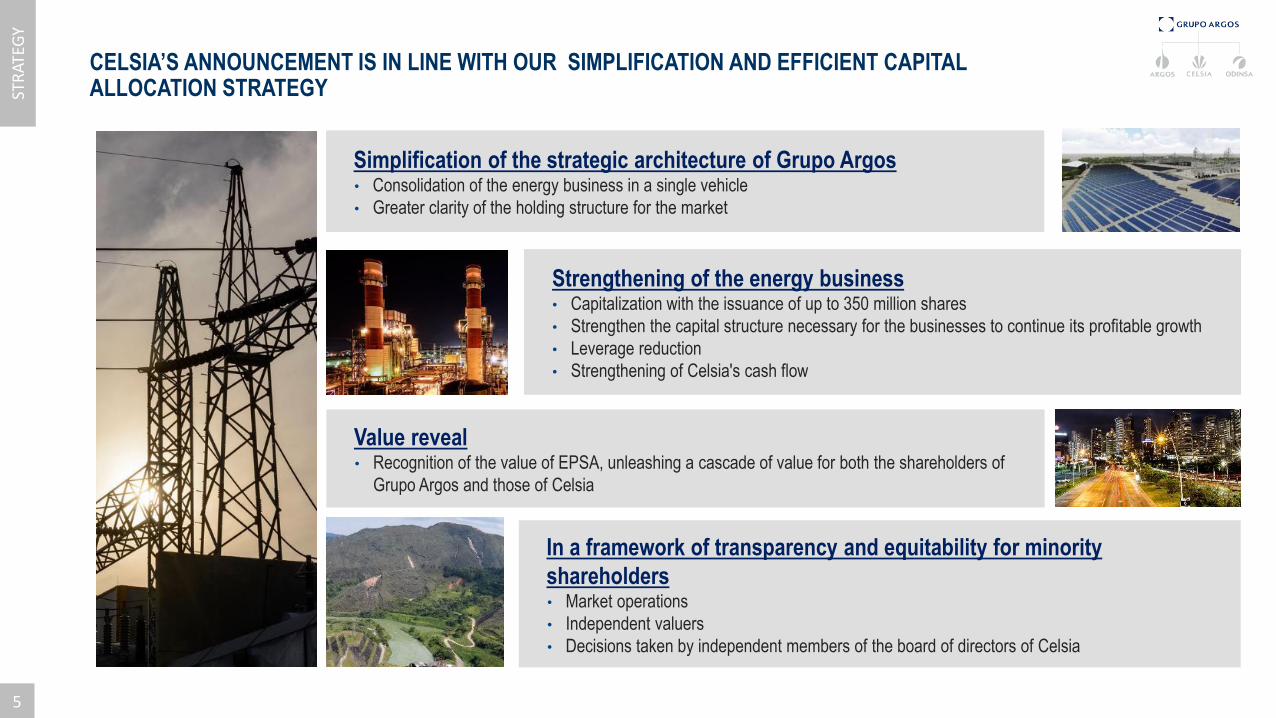
CELSIA’S ANNOUNCEMENT IS IN LINE WITH OUR SIMPLIFICATION AND EFFICIENT CAPITAL ALLOCATION STRATEGY
Simplification of the strategic architecture of Grupo Argos• Consolidation of the energy business in a single vehicle
• Greater clarity of the holding structure for the market
Strengthening of the energy business• Capitalization with the issuance of up to 350 million shares
• Strengthen the capital structure necessary for the businesses to continue its profitable growth
• Leverage reduction
• Strengthening of Celsia's cash flow
In a framework of transparency and equitability for minority
shareholders• Market operations
• Independent valuers
• Decisions taken by independent members of the board of directors of Celsia
5
Value reveal• Recognition of the value of EPSA, unleashing a cascade of value for both the shareholders of
Grupo Argos and those of Celsia
STR
ATEG
Y

6
GRUPO ARGOS AND ITS SUBSIDIARY CEMENTOS ARGOS RECOGNIZED AS GLOBAL LEADERS IN
SUSTAINABILITY
Included for the 5th consecutive year as members of
the Dow Jones Sustainability Global Index
The index evaluated 2,500 companies this year and
selected only 319 to be part of the index
Included in the Dow Jones Sustainability Index Mila
Pacific Alliance, the first of its category for the region
Composed of the 42 issuers from Chile, Colombia,
Mexico and Peru with the highest sustainability ratings
Sustainability as the axis of our strategy
✓ Strengthens trust with our groups of interest
✓ Allows investors to identify opportunities that generate long-term sustainable value
✓ Seeks to promote ESG criteria (environmental, social, government) for investment strategies in the MILA
STR
ATEG
Y
6

Grupo Argos
8
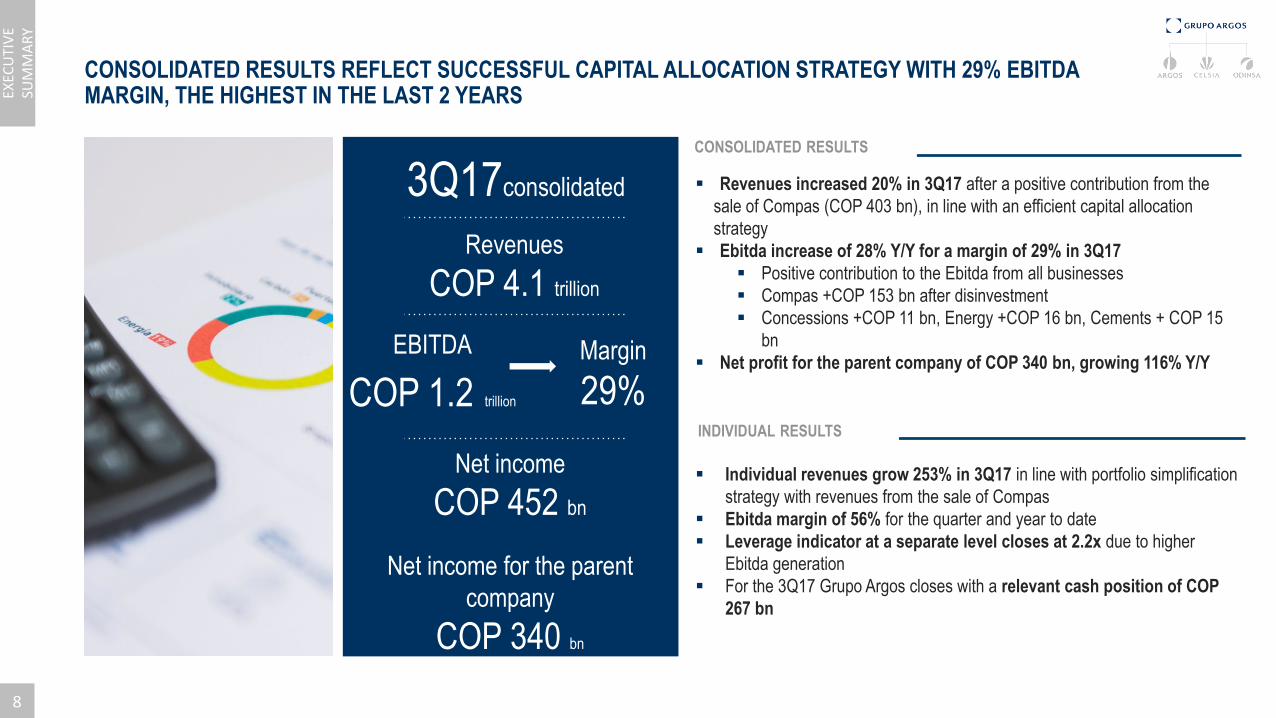
CONSOLIDATED RESULTS REFLECT SUCCESSFUL CAPITAL ALLOCATION STRATEGY WITH 29% EBITDA MARGIN, THE HIGHEST IN THE LAST 2 YEARS
Revenues
COP 4.1 trillion
EBITDA
COP 1.2 trillion
Margin
29%
Net income
COP 452 bn
Net income for the parent
company
COP 340 bn
3Q17consolidated
EXEC
UTI
VE
SUM
MA
RY
CONSOLIDATED RESULTS
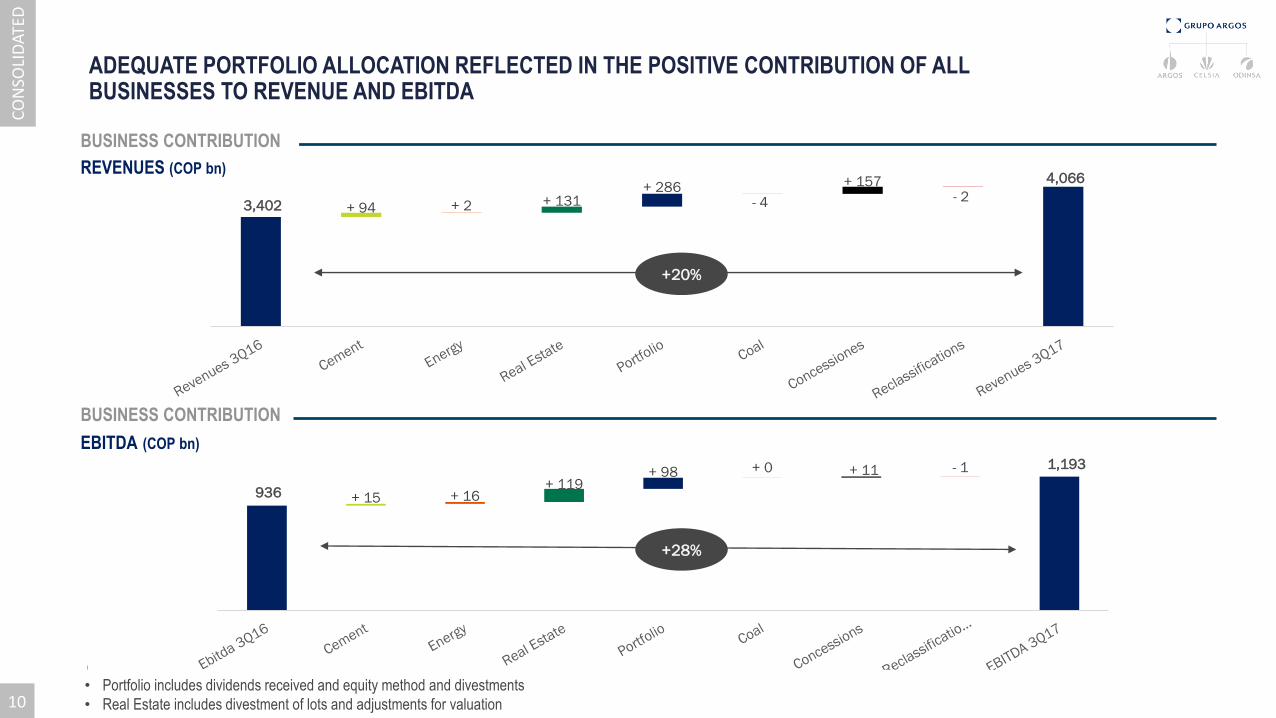
▪ Revenues increased 20% in 3Q17 after a positive contribution from the
sale of Compas (COP 403 bn), in line with an efficient capital allocation
strategy
▪ Ebitda increase of 28% Y/Y for a margin of 29% in 3Q17
▪ Positive contribution to the Ebitda from all businesses
▪ Compas +COP 153 bn after disinvestment
▪ Concessions +COP 11 bn, Energy +COP 16 bn, Cements + COP 15
bn
▪ Net profit for the parent company of COP 340 bn, growing 116% Y/Y
▪ Individual revenues grow 253% in 3Q17 in line with portfolio simplification
strategy with revenues from the sale of Compas
▪ Ebitda margin of 56% for the quarter and year to date
▪ Leverage indicator at a separate level closes at 2.2x due to higher
Ebitda generation
▪ For the 3Q17 Grupo Argos closes with a relevant cash position of COP
267 bn
INDIVIDUAL RESULTS
8

9
RESULTS AT CONSOLIDATED LEVEL WITH GROWTH IN ALL LINES. POSITIVE CONTRIBUTION OF THE CEMENT BUSINESS FOR THE FIRST TIME IN 2017
1
2
COP bn 3Q2017 3Q2016 YoY Sept 17 Sept 16 YoY
Revenue 4,066 3,402 19.5% 10,988 10,829 1.5%
Cost, Expenses
and other income3,237 2,738 18.3% 9,107 8,915 2.2%
Operating Profit 829 664 24.8% 1,881 1,914 -1.7%
EBITDA 1,193 936 27.5% 2,932 2,780 5.5%
EBITDA Margin (%) 29.3% 27.5% 180 pb 26.7% 25.7% 100 pb
Net Income 452 328 37.6% 812 912 -11.0%
Net Margin 11.1% 9.6% 140 pb 7.4% 8.4% 100 pb
Controlling Net
Income340 158 115.7% 566 410 38.2%
Controlling Net
Margin8.4% 4.6% 380 pb 5.2% 3.8% 140 pb
✓ Positive contribution from the cement and energy businesses for the first time in
2017
✓ Includes the divestment of Compas with a contribution of COP 403 bn
✓ Increase in the contributions of the concessions mainly due to the consolidation of
Opain
1
✓ Positive contribution from Cement business due to stabilization of prices in
Colombia and positive environment in the US in line with the change in trend observed
in June
✓ Increase from Energy business contribution due to lower generation cost given the
normalization of water conditions
✓ Positive contribution from divestment of Compas COP 153 bn
2
✓ Growth in net financial expenses (+ 7% YoY) and taxes (+ 8% YoY) below growth
in Ebitda (+ 28% YoY)
✓ Growth in financial expenses from: bridge loan for the acquisition of Martinsburg,
consolidation of ADN and BTA in the Dominican Republic and consolidation of Opain
✓ Net profit of the controller accumulated year to date grows 116% YoY
3
3
CO
NSO
LID
ATED
NOTESRELEVANT FIGURESConsolidated income statement
9
936 + 15 + 16 + 119
+ 98 + 0 + 11 - 1 1,193
3,402 + 94 + 2 + 131 + 286
- 4
+ 157 - 2
4,066
ADEQUATE PORTFOLIO ALLOCATION REFLECTED IN THE POSITIVE CONTRIBUTION OF ALL BUSINESSES TO REVENUE AND EBITDA
62%
38%
+28%
+20%
CO
NSO
LID
ATED
BUSINESS CONTRIBUTION
REVENUES (COP bn)
BUSINESS CONTRIBUTION
EBITDA (COP bn)
10• Portfolio includes dividends received and equity method and divestments
• Real Estate includes divestment of lots and adjustments for valuation
11
1
2
1
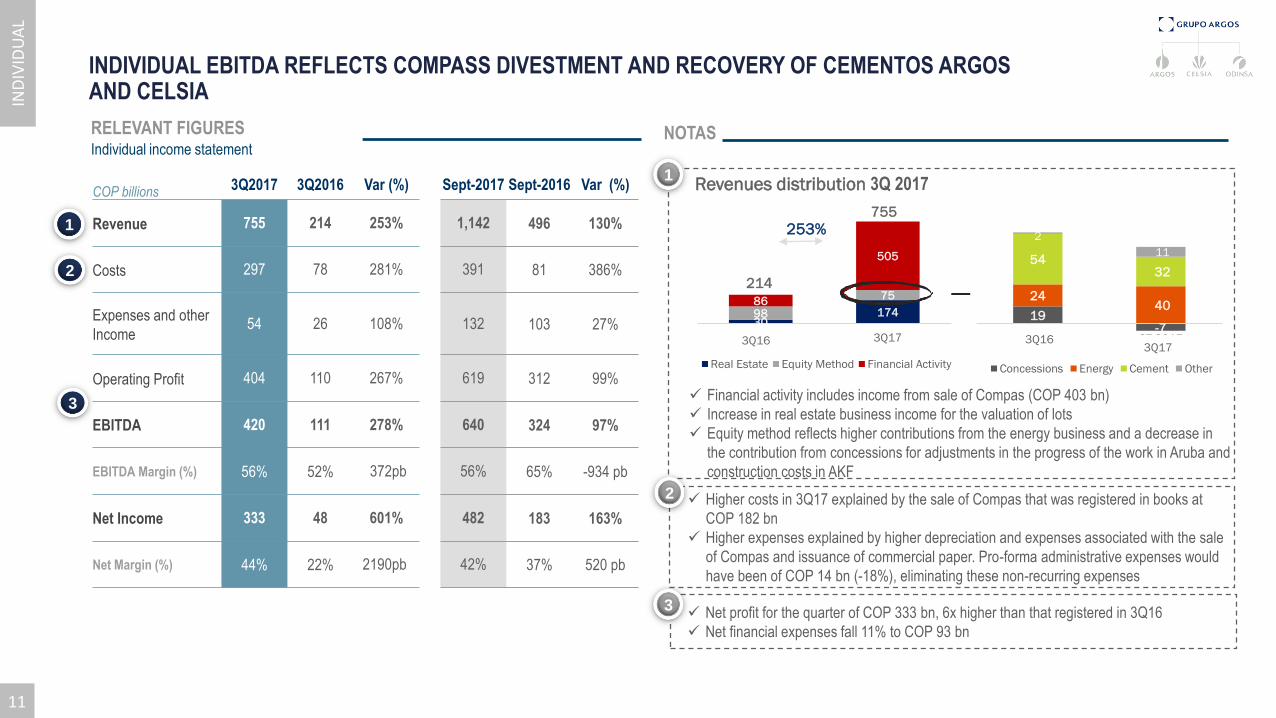
✓ Higher costs in 3Q17 explained by the sale of Compas that was registered in books at
COP 182 bn
✓ Higher expenses explained by higher depreciation and expenses associated with the sale
of Compas and issuance of commercial paper. Pro-forma administrative expenses would
have been of COP 14 bn (-18%), eliminating these non-recurring expenses
COP billions 3Q2017 3Q2016 Var (%) Sept-2017 Sept-2016 Var (%)
Revenue 755 214 253% 1,142 496 130%
Costs 297 78 281% 391 81 386%
Expenses and other
Income54 26 108% 132 103 27%
Operating Profit 404 110 267% 619 312 99%
EBITDA 420 111 278% 640 324 97%
EBITDA Margin (%) 56% 52% 372pb 56% 65% -934 pb
Net Income 333 48 601% 482 183 163%
Net Margin (%) 44% 22% 2190pb 42% 37% 520 pb
Revenues distribution 3Q 2017
✓ Financial activity includes income from sale of Compas (COP 403 bn)
✓ Increase in real estate business income for the valuation of lots
✓ Equity method reflects higher contributions from the energy business and a decrease in
the contribution from concessions for adjustments in the progress of the work in Aruba and
construction costs in AKF
2
IND
IVID
UA
L
NOTASRELEVANT FIGURESIndividual income statement
INDIVIDUAL EBITDA REFLECTS COMPASS DIVESTMENT AND RECOVERY OF CEMENTOS ARGOS AND CELSIA
✓ Net profit for the quarter of COP 333 bn, 6x higher than that registered in 3Q16
✓ Net financial expenses fall 11% to COP 93 bn
3
3
11
3017498
7586
505
3T-2016 3T-2017
Real Estate Equity Method Financial Activity
214
755
253%
19-7
2440
5432
2
11
3T-2016 3T-2017
Concessions Energy Cement Other
3Q16 3Q163Q173Q17
38% 29%
62%49%
22%
Sep-16 Sep-17
PapelesComerciales
Bonos COP
Bancosnacionales
273
185115
254
390350
2017 2018 2019 2020 2021 2022 2023 2024 2025 2026 2027 2028 2029
Crédito LP Bonos Ordinarios Papeles Comerciales
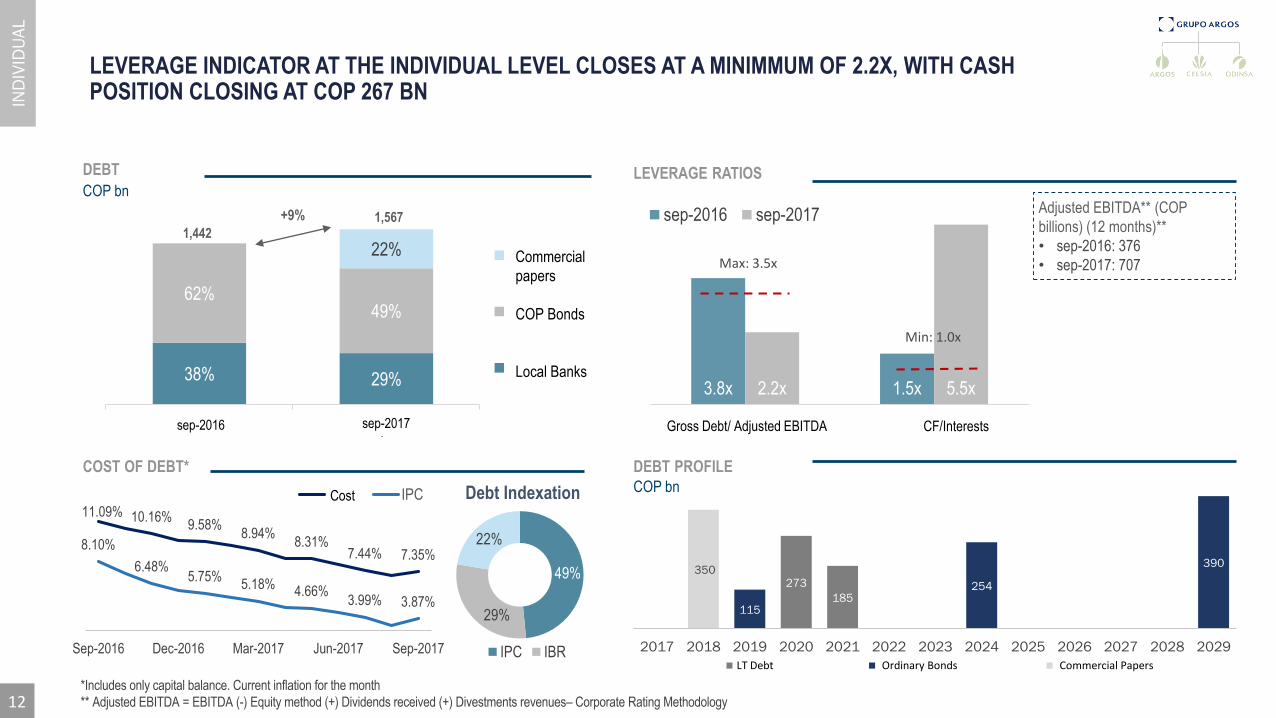
3.8x 1.5x 5.4x2.2x 5.5x 3.7x
Deuda / EBITDA ajustado FCO / Intereses Deuda neta / Dividendos
sep-2016 sep-2017
Debt/EBITDA
LEVERAGE RATIOSDEBT
COP bn
COST OF DEBT* DEBT PROFILE
COP bn
+9%
1,4421,567
Max: 3.5x
Min: 1.0x
49%
29%
22%
Indexación
IPC IBR
11.09% 10.16%9.58%
8.94%8.31%
7.44% 7.35%8.10%
6.48%5.75%
5.18%4.66%
3.99% 3.87%
3.00%
4.00%
5.00%
6.00%
7.00%
8.00%
9.00%
10.00%
11.00%
12.00%
Sep-2016 Dec-2016 Mar-2017 Jun-2017 Sep-2017
Costo IPC
*Includes only capital balance. Current inflation for the month
** Adjusted EBITDA = EBITDA (-) Equity method (+) Dividends received (+) Divestments revenues– Corporate Rating Methodology
sep-2017sep-2016
LEVERAGE INDICATOR AT THE INDIVIDUAL LEVEL CLOSES AT A MINIMMUM OF 2.2X, WITH CASH POSITION CLOSING AT COP 267 BN
Adjusted EBITDA** (COP
billions) (12 months)**
• sep-2016: 376
• sep-2017: 707
IND
IVID
UA
L
12
Gross Debt/ Adjusted EBITDA CF/Interests
Commercial
papers
COP Bonds
Local Banks
Cost
Ordinary BondsLT Debt Commercial Papers
Debt Indexation
Concession
Business

14
MARKET CONFIDENCE IN A ROBUST PORTFOLIO WITH STRATEGIC FOCUS
Autopistas del Nordeste
Revenues
COP 200 bn
Margin
36%
Net income for the parent
company
COP 2 bn
3Q17consolidated
EBITDA
COP 73bn
HIGHLIGHT OF THE QUARTER
14
EXEC
UTI
VE
SUM
MA
RY
▪ Issuance of Odinsa bonds for COP 400 bn with an overdemand of
2.32x, which shows confidence in the strategy of the company
▪ First issuer of the real sector in the last 10 years in going to
market with a AA- rating
▪ Technical price for a AA- issuance of 150 pbs of spread over
financial AAA, Odinsa achieved 95bp of spread
▪ Increase in the average life of the debt in ~ 1.5 years
▪ Odinsa funding costs decrease by ~ 170 bp
▪ First disbursement of Pacifico II financing, with great support
from the national and international financial system, essential to
achieve the viability of the 4G projects
▪ Total value of financing = USD 250 mm + COP 510 bn
▪ Itaú achieved syndication of credit in dollars with five
recognized international financial institutions
15
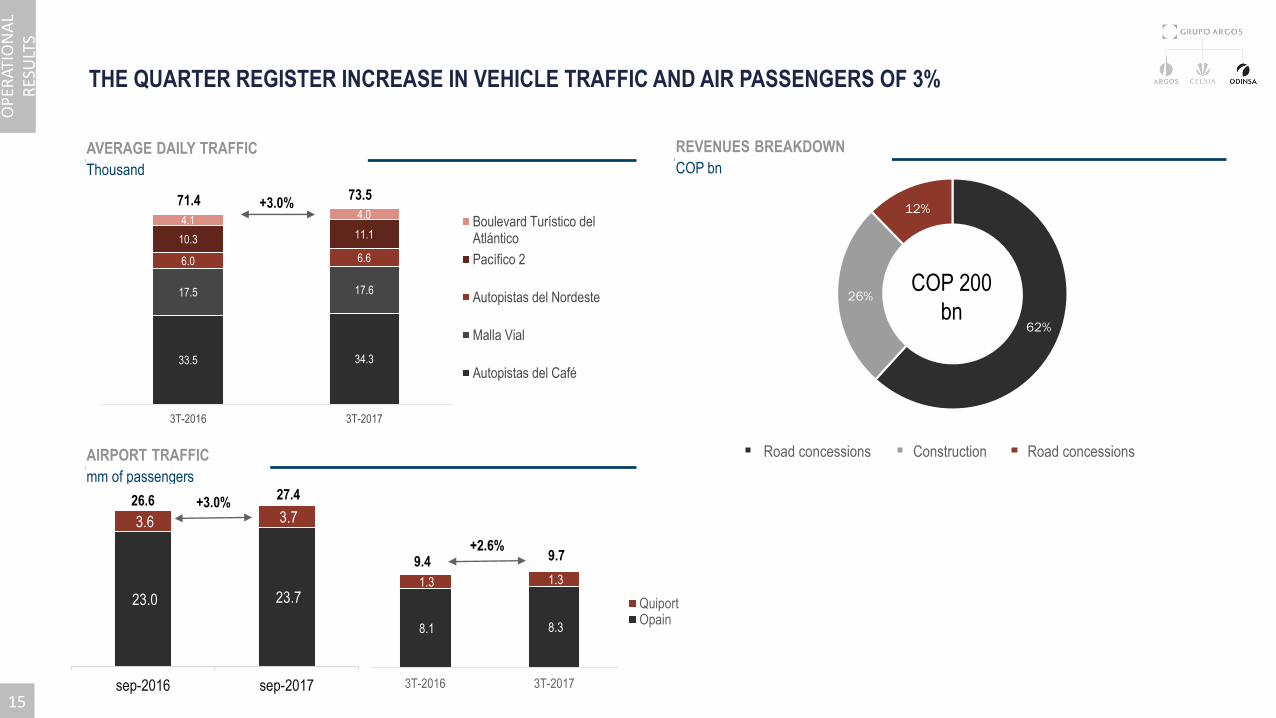
8.1 8.3
1.3 1.3
3T-2016 3T-2017
QuiportOpain
33.5 34.3
17.5 17.6
6.0 6.6
10.3 11.1
4.14.0
3T-2016 3T-2017
Boulevard Turístico delAtlántico
Pacífico 2
Autopistas del Nordeste
Malla Vial
Autopistas del Café
62%
26%
12%
Concesiones viales Construcción Concesión aeropuertos
THE QUARTER REGISTER INCREASE IN VEHICLE TRAFFIC AND AIR PASSENGERS OF 3%
71.4 73.5+3.0%
COP 200
bn
AVERAGE DAILY TRAFFIC
Thousand
REVENUES BREAKDOWN
COP bn
AIRPORT TRAFFIC
mm of passengers
OP
ERAT
ION
AL
RES
ULT
S
23.0 23.7
3.6 3.7
sep-2016 sep-2017
+2.6%9.4 9.7
+3.0%26.6 27.4
15
Road concessions Construction Road concessions

16
103 135
81
134
84
73
2016 2017
189 174
132 203
183
200
2016 2017
1T 2T 3T
EBITDA FOR THE QUARTER AFFECTED BY NON-RECURRING EXPENSE IN AKF'S WORK. ACCUMULATED EBITDA GROWS 28% Y / Y
✓ Ebitda and Ebitda margin for 3Q affected by a refund for non-execution of works in the AKF Concession of COP 33 bn. Without considering the extraordinary
item attributed to Autopistas del Café, Ebitda would have registered a growth of 40%, for an EBITDA figure of COP 375 bn year to date.
✓ Year to date Ebitda margin higher than the previous year (59% vs. 53%) after consolidation of DNA and BTA
✓ Net income closes the quarter with 94% decrease to COP 2 bn due to mentioned adjustment.
-8%
+9%
14%
+31%
-14%
28%
+53%
504
577
+66%
268
342
EBITDA
COP bn
REVENUES
COP bn
EBITDA MARGIN
78%
55%
66%
61%
36%
46%
2017
2016
FIN
AN
CIA
L R
ESU
LTS
16
Cement Business

18
IMPROVEMENT IN OPERATIONAL RESULTS DESPITE ADVERSE CLIMATIC CONDITIONS IN THE USA AND THE CARIBBEAN
Flandes, Colombia
REVENUES
COP 2.1 tr
3Q2017
EBITDA*
COP 407bn
Margin
19%
Net Income
COP 65 bn
HIGHLIGHT OF THE QUARTER
▪ Improvement in operating results is highlighted despite the
hurricane season in the US and the Caribbean that affected the
economic dynamics
▪ Materialization of the BEST efficiency program in the operating
results for 3Q17, reflected in a better Ebitda
▪ USD10 / TM reduction in costs in Colombia very close to the
target of USD12 / TM
▪ Adjusted EBITDA of COP 428 bn for 3Q17- eliminating
payments for dismissals and early retirement
▪ Net result of COP 65 bn, the highest reached so far during 2017
* Ebitda adjusted for non-recurrent expenses associated with the Best efficiency program of COP 428 bn for an Ebitda margin of 19.5%18
EXEC
UTI
VE
SUM
MA
RY

19
3,557 + 22 + 72
+500 4,151
3T2016 Colombia Caribe + Exp. EEUU 3T2017
2,840 - 67 + 2 - 109 2,666
3T2016 Colombia Caribe + Exp. EEUU 3T2017
28%
4%68%
Colombia
Caribe
EEUU
32%
31%
37%Colombia
Caribe y CA (incl.
Exportaciones)
EEUU
GROWTH IN CEMENT VOLUMES TROUGH ALL REGIONS
4,151
M TM
2,666
M m3
+2% Y/Y +6% Y/Y+49% Y/Y
-8% Y/Y +2% Y/Y
+17%
-6%
-6% Y/Y
CEMENT VOLUME
(TMT)
READY MIX VOLUME
(TCM)
CEMENT VOLUMES
3Q17
READY MIX SALES
3Q17
19
OP
ERAT
ION
AL
RES
ULT
S
20
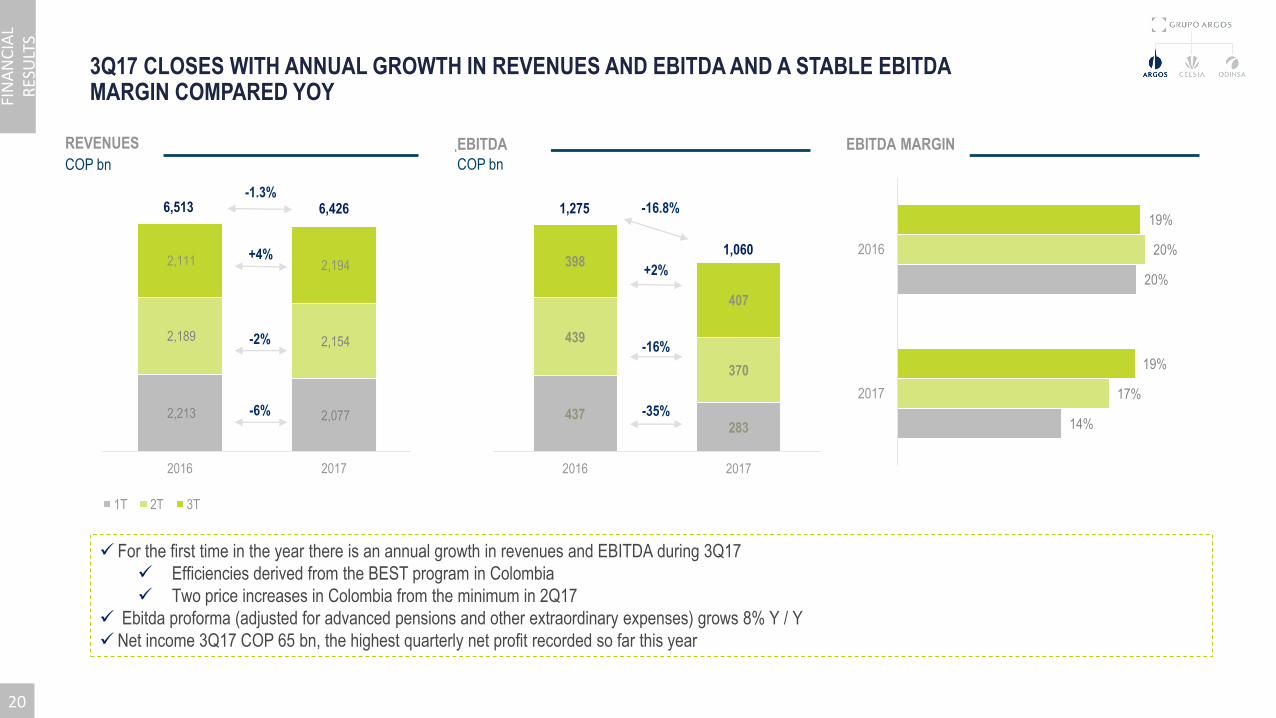
14%
20%
17%
20%
19%
19%
2017
2016
2,213 2,077
2,189 2,154
2,111 2,194
2016 2017
1T 2T 3T
437283
439
370
398
407
2016 2017
3Q17 CLOSES WITH ANNUAL GROWTH IN REVENUES AND EBITDA AND A STABLE EBITDA MARGIN COMPARED YOY
-6%
+4%
-1.3%
-35%
-16.8%6,513 6,426 1,275
1,060
✓ For the first time in the year there is an annual growth in revenues and EBITDA during 3Q17
✓ Efficiencies derived from the BEST program in Colombia
✓ Two price increases in Colombia from the minimum in 2Q17
✓ Ebitda proforma (adjusted for advanced pensions and other extraordinary expenses) grows 8% Y / Y
✓ Net income 3Q17 COP 65 bn, the highest quarterly net profit recorded so far this year
-2%-16%
+2%
20
EBITDA
COP bn
REVENUES
COP bn
EBITDA MARGIN
FIN
AN
CIA
L R
ESU
LTS
Energy Business
22
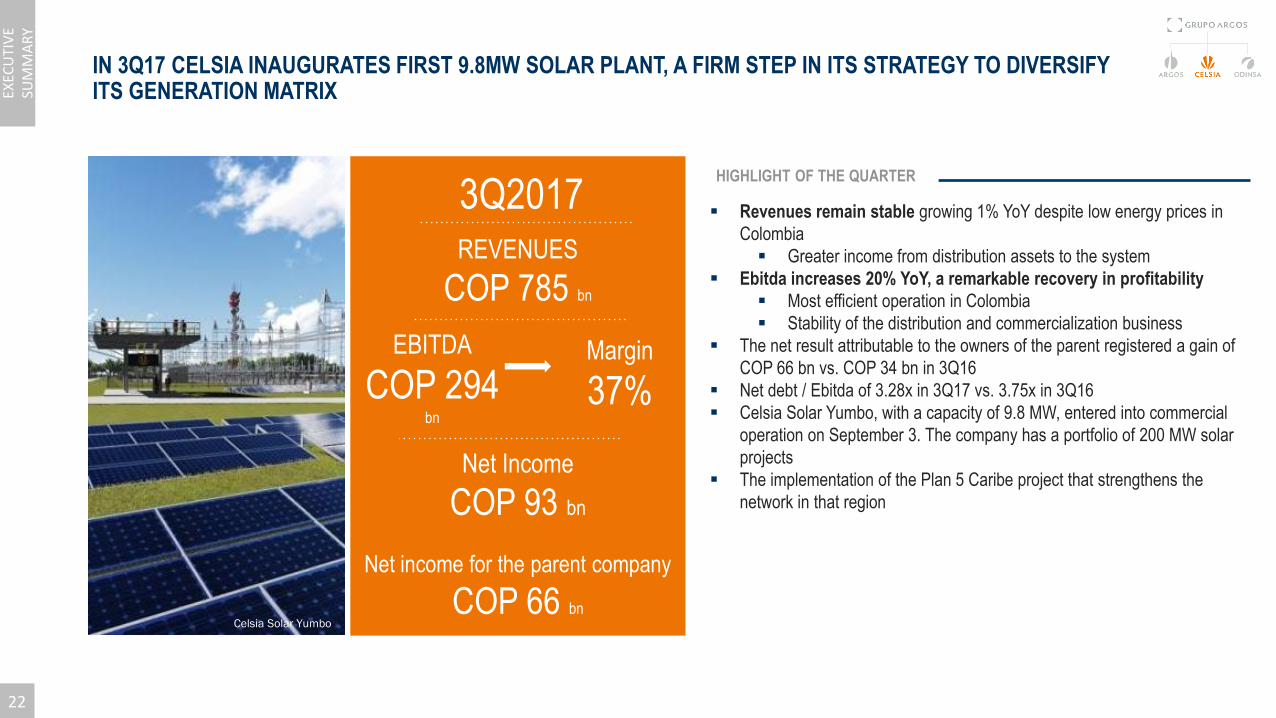
IN 3Q17 CELSIA INAUGURATES FIRST 9.8MW SOLAR PLANT, A FIRM STEP IN ITS STRATEGY TO DIVERSIFY ITS GENERATION MATRIX
▪ Revenues remain stable growing 1% YoY despite low energy prices in
Colombia
▪ Greater income from distribution assets to the system
▪ Ebitda increases 20% YoY, a remarkable recovery in profitability
▪ Most efficient operation in Colombia
▪ Stability of the distribution and commercialization business
▪ The net result attributable to the owners of the parent registered a gain of
COP 66 bn vs. COP 34 bn in 3Q16
▪ Net debt / Ebitda of 3.28x in 3Q17 vs. 3.75x in 3Q16
▪ Celsia Solar Yumbo, with a capacity of 9.8 MW, entered into commercial
operation on September 3. The company has a portfolio of 200 MW solar
projects
▪ The implementation of the Plan 5 Caribe project that strengthens the
network in that region
REVENUES
COP 785 bn
3Q2017
EBITDA
COP 294bn
Margin
37%
Net Income
COP 93 bn
Net income for the parent company
COP 66 bnCelsia Solar Yumbo
22
EXEC
UTI
VE
SUM
MA
RY
HIGHLIGHT OF THE QUARTER
23
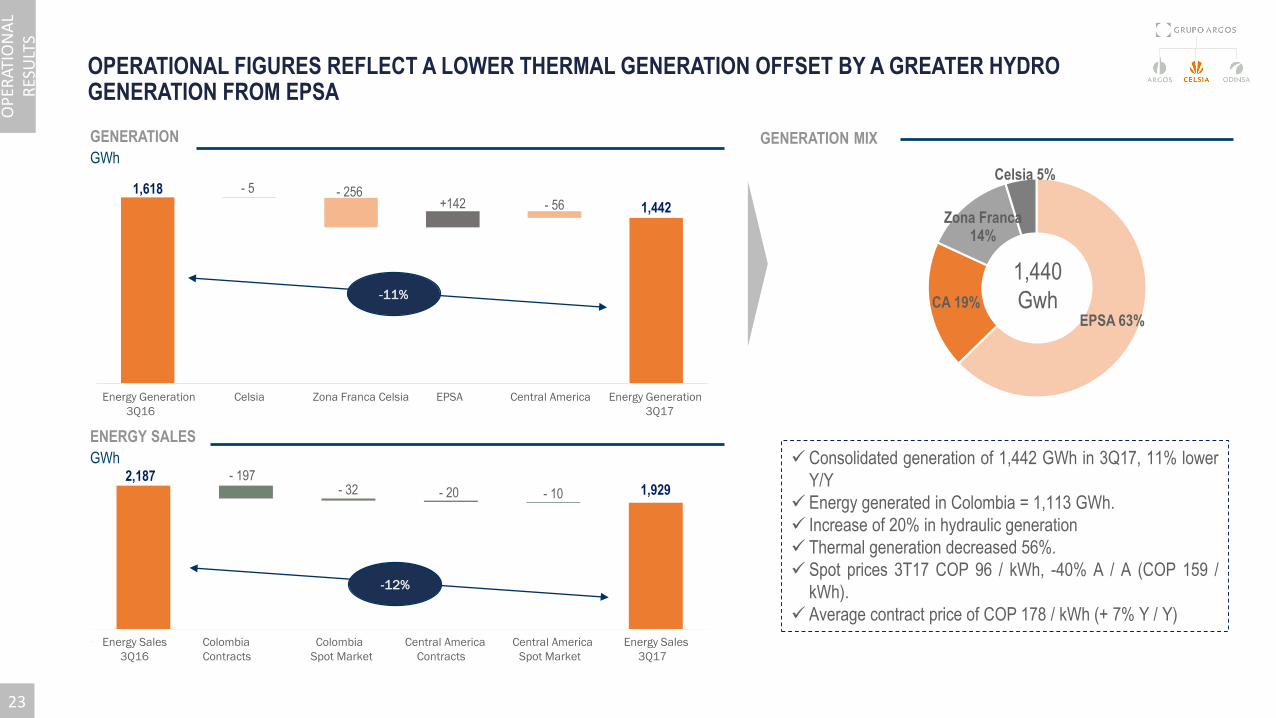
1,618 - 5 - 256 +142 - 56 1,442
Generación 3T16 Celsia Zona Franca EPSA Centroamérica Generación 3T17
OPERATIONAL FIGURES REFLECT A LOWER THERMAL GENERATION OFFSET BY A GREATER HYDRO GENERATION FROM EPSA
-11%
GENERATION
GWh
ENERGY SALES
GWh2,187 - 197
- 32 - 20 - 10 1,929
Ventas energía 3T16 Contratos Colombia Bolsa Colombia ContratosCentroamérica
Bolsa CentroaméricaVentas energía 3T17
-12%
EPSA 63%CA 19%
Zona Franca14%
Celsia 5%
1,440
Gwh
GENERATION MIX
✓ Consolidated generation of 1,442 GWh in 3Q17, 11% lower
Y/Y
✓ Energy generated in Colombia = 1,113 GWh.
✓ Increase of 20% in hydraulic generation
✓ Thermal generation decreased 56%.
✓ Spot prices 3T17 COP 96 / kWh, -40% A / A (COP 159 /
kWh).
✓ Average contract price of COP 178 / kWh (+ 7% Y / Y)
23
OP
ERAT
ION
AL
RES
ULT
S
Energy Generation Celsia Zona Franca Celsia EPSA Central America Energy Generation
3Q16 3Q17
Energy Sales Colombia Colombia Central America Central America Energy Sales
3Q16 Contracts Spot Market Contracts Spot Market 3Q17
24
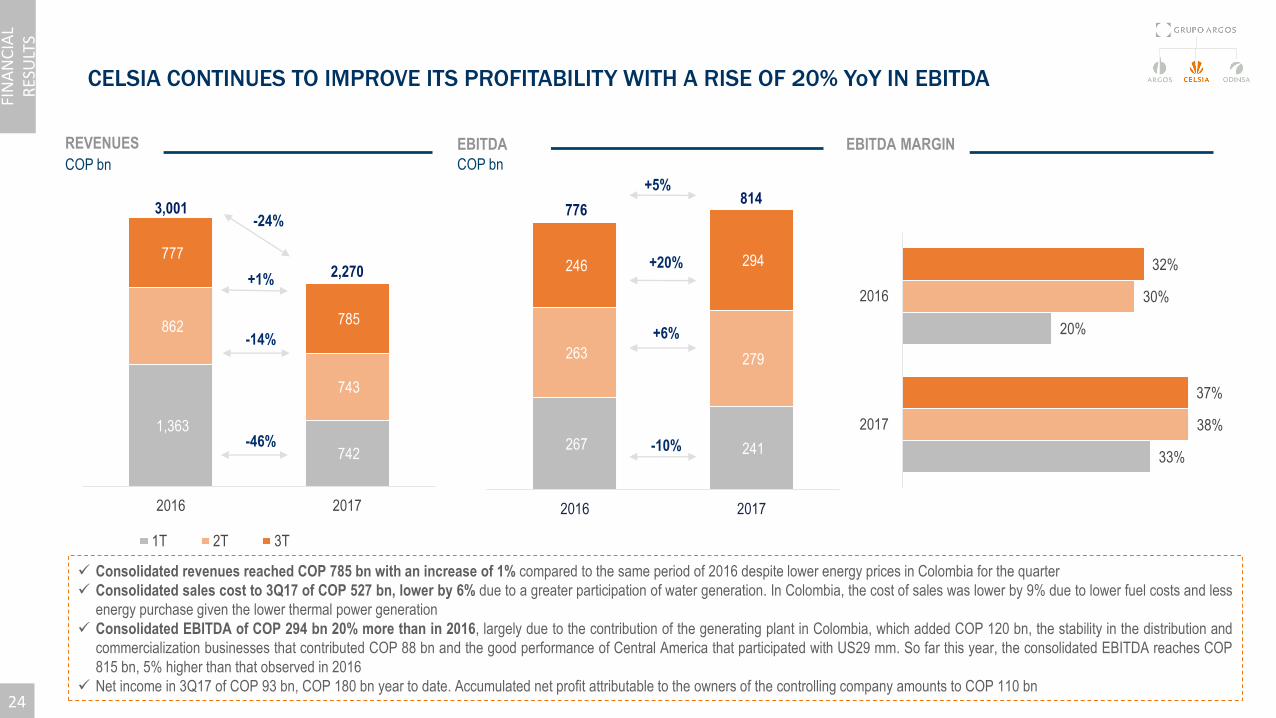
CELSIA CONTINUES TO IMPROVE ITS PROFITABILITY WITH A RISE OF 20% YoY IN EBITDA
✓ Consolidated revenues reached COP 785 bn with an increase of 1% compared to the same period of 2016 despite lower energy prices in Colombia for the quarter
✓ Consolidated sales cost to 3Q17 of COP 527 bn, lower by 6% due to a greater participation of water generation. In Colombia, the cost of sales was lower by 9% due to lower fuel costs and less
energy purchase given the lower thermal power generation
✓ Consolidated EBITDA of COP 294 bn 20% more than in 2016, largely due to the contribution of the generating plant in Colombia, which added COP 120 bn, the stability in the distribution and
commercialization businesses that contributed COP 88 bn and the good performance of Central America that participated with US29 mm. So far this year, the consolidated EBITDA reaches COP
815 bn, 5% higher than that observed in 2016
✓ Net income in 3Q17 of COP 93 bn, COP 180 bn year to date. Accumulated net profit attributable to the owners of the controlling company amounts to COP 110 bn
33%
20%
38%
30%
37%
32%
2017
2016
267 241
263 279
246 294
2016 2017
1,363
742
862
743
777
785
2016 2017
1T 2T 3T
-46%
+1%
-24%
-10%
+20%
+5%
3,001
2,270
-14% +6%
776814
24
EBITDA
COP bn
REVENUES
COP bn
EBITDA MARGIN
FIN
AN
CIA
L R
ESU
LTS
Real Estate Business
26
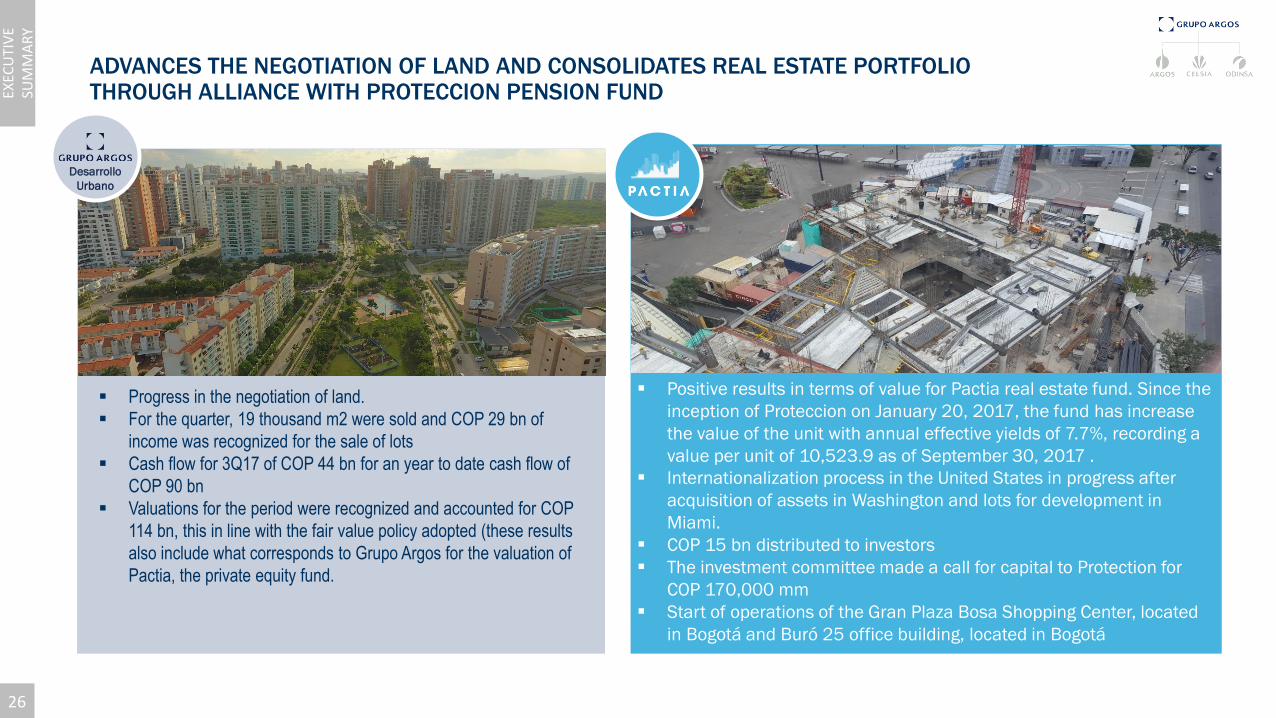
ADVANCES THE NEGOTIATION OF LAND AND CONSOLIDATES REAL ESTATE PORTFOLIO THROUGH ALLIANCE WITH PROTECCION PENSION FUND
▪ Progress in the negotiation of land.
▪ For the quarter, 19 thousand m2 were sold and COP 29 bn of
income was recognized for the sale of lots
▪ Cash flow for 3Q17 of COP 44 bn for an year to date cash flow of
COP 90 bn
▪ Valuations for the period were recognized and accounted for COP
114 bn, this in line with the fair value policy adopted (these results
also include what corresponds to Grupo Argos for the valuation of
Pactia, the private equity fund.
▪ Positive results in terms of value for Pactia real estate fund. Since the
inception of Proteccion on January 20, 2017, the fund has increase
the value of the unit with annual effective yields of 7.7%, recording a
value per unit of 10,523.9 as of September 30, 2017 .
▪ Internationalization process in the United States in progress after
acquisition of assets in Washington and lots for development in
Miami.
▪ COP 15 bn distributed to investors
▪ The investment committee made a call for capital to Protection for
COP 170,000 mm
▪ Start of operations of the Gran Plaza Bosa Shopping Center, located
in Bogotá and Buró 25 office building, located in Bogotá
Desarrollo
Urbano
26
EXEC
UTI
VE
SUM
MA
RY
27
55%
20%
17%
5% 4%
Comercio
Industria
Oficinas
Hoteles
Auto almacenamiento
40%
34%
20%
2%
4%
Comercio
Industria
Oficinas
Hoteles
Auto almacenamiento
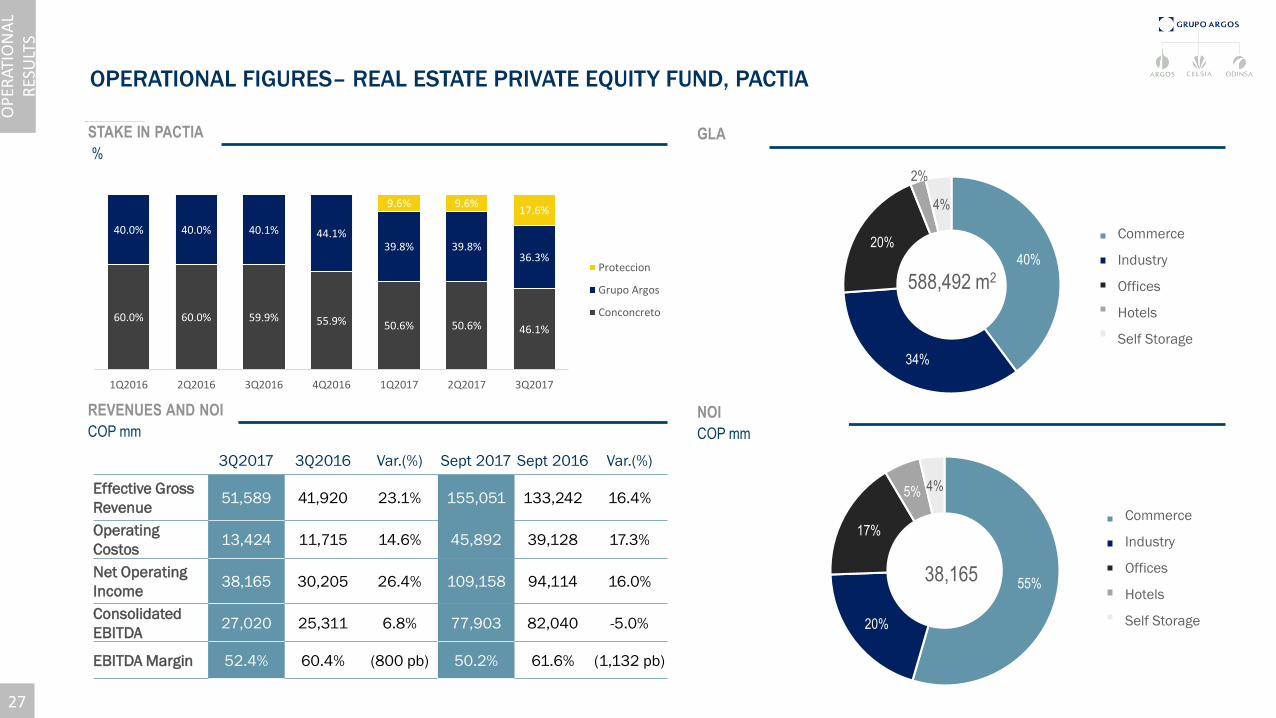
OPERATIONAL FIGURES– REAL ESTATE PRIVATE EQUITY FUND, PACTIA
3Q2017 3Q2016 Var.(%) Sept 2017 Sept 2016 Var.(%)
Effective Gross
Revenue51,589 41,920 23.1% 155,051 133,242 16.4%
Operating
Costos13,424 11,715 14.6% 45,892 39,128 17.3%
Net Operating
Income38,165 30,205 26.4% 109,158 94,114 16.0%
Consolidated
EBITDA 27,020 25,311 6.8% 77,903 82,040 -5.0%
EBITDA Margin 52.4% 60.4% (800 pb) 50.2% 61.6% (1,132 pb)
GLA
NOI
COP mm
60.0% 60.0% 59.9% 55.9% 50.6% 50.6% 46.1%
40.0% 40.0% 40.1% 44.1%39.8% 39.8%
36.3%
9.6% 9.6%17.6%
1Q2016 2Q2016 3Q2016 4Q2016 1Q2017 2Q2017 3Q2017
Proteccion
Grupo Argos
Conconcreto
STAKE IN PACTIA
%
REVENUES AND NOI
COP mm
588,492 m2
38,165
27
OP
ERAT
ION
AL
RES
ULT
S
Commerce
Industry
Offices
Hotels
Self Storage
Commerce
Industry
Offices
Hotels
Self Storage
