presentación de powerpoint - grupobimbo.com committee this is how we reach ... bank loans (1) the...
TRANSCRIPT
Investor PresentationThird Quarter 2017
2
2
A Global Consumer Food Company,
Leader in the Baking Industry and a
Relevant Participant in Snacks
2
3
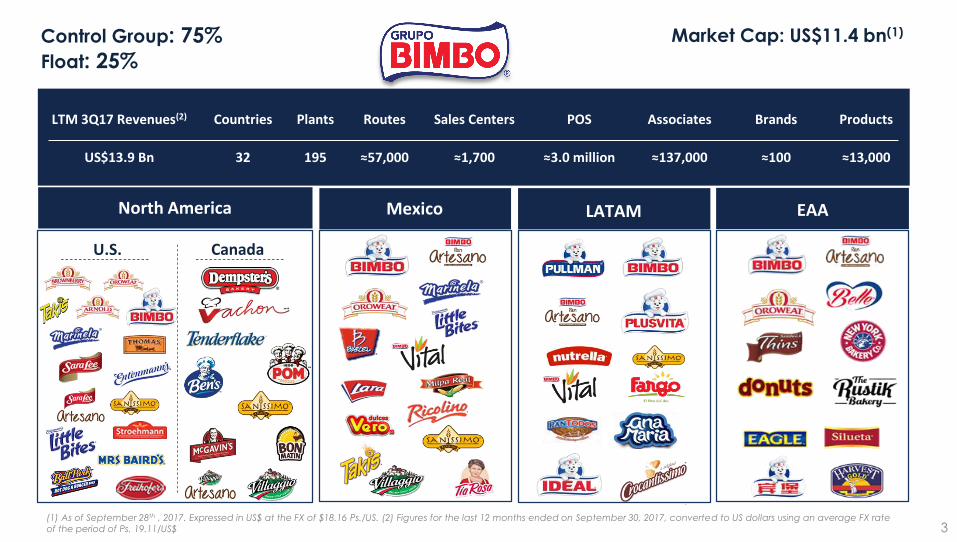
LTM 3Q17 Revenues(2) Countries Plants Routes Sales Centers POS Associates Brands Products
US$13.9 Bn 32 195 ≈57,000 ≈1,700 ≈3.0 million ≈137,000 ≈100 ≈13,000
U.S. Canada
Market Cap: US$11.4 bn(1)Control Group: 75%
Float: 25%
(1) As of September 28th , 2017. Expressed in US$ at the FX of $18.16 Ps./US. (2) Figures for the last 12 months ended on September 30, 2017, converted to US dollars using an average FX rate
of the period of Ps. 19.11/US$ 3
North America Mexico LATAM EAA

44
1945
2009
2011
2014
00s90s
60s 70s80s
50s
2015
2016Frozen Argentina
2017
40+ acquisitionsin the last 10 years
Successful Growth Story

A Well Balanced Business Mix…
Source: Nielsen, IRi and Company filings
(1) Information for the last 12 months as of September 30, 2017, with the exception of East Balt Bakeries which includes figures for the last 12 months ended in June 30, 2017
of US $420 million. (2) Figures do not include East Balt Bakeries. (3) EAA region includes operations in Europe, Asia and Africa.
Note: Eliminations between the regions have been subtracted from the results of Mexico 5
EAA
Latin America
Mexico
North America
Developed Markets(58% of sales)
Emerging Markets(1)
(42% of sales)
Grupo Bimbo Sales & EBITDA Split
31%
52%
11%
6%
57%
45%
1%
-3%
Net Sales
US $13.9 Bn(2)
Adj. EBITDA
US $1.5 Bn(2)
North America(1)
Mexico
Latin America
EAA(3)

6
…with Strong Leadership Position Across Markets
Mexico
U.S.
Canada
Latin America(3)
EAA(3)
____________Source: Euromonitor, IRi and Company Information(1) Excludes Ecuador and Peru, where GB is #2. (2) Excludes Peru, where GB is #1. (3) Market share position for the countries where GB participates in each category. (4) Excludes China and India. (5) Excludes U.K., Portugal (GB #2)and India. (6) Excludes China, Morocco and U.K. (7) Excludes Spain
#1
#1
#2
#1
#1(4)
#1
#1
#1#2 #1 #1
#2 #2
#1 #1#1
#1 #1(1) #2(2)
#1(5) #2 #1(6)
#2 #3
#1 #1
#1 #2
Sliced
BreadBuns &
RollsBagels
English
MuffinsCookies Cakes Pastries Tortillas
Salty
SnacksConfectionery
∙ ∙
GB market share not within top 3 in ranking
∙∙ ∙
∙ ∙
∙#1(7) ∙
∙ ∙∙
∙
∙
#2 #2

OUR MISSION
7
88
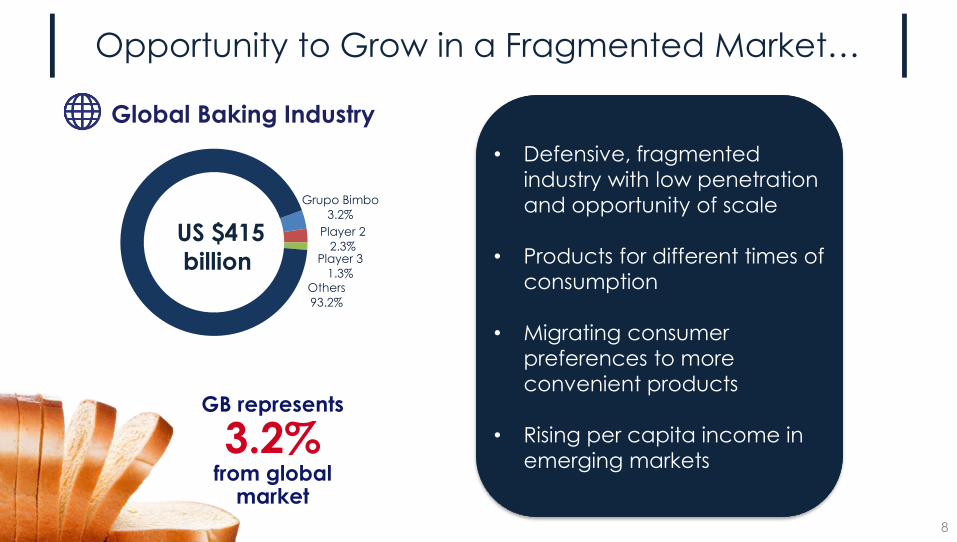
Opportunity to Grow in a Fragmented Market…
Global Baking Industry
GB represents
3.2%from global
market
Grupo Bimbo
3.2%
Player 2
2.3%Player 3
1.3%Others
93.2%
US $415
billion
• Defensive, fragmented
industry with low penetration
and opportunity of scale
• Products for different times of
consumption
• Migrating consumer
preferences to more
convenient products
• Rising per capita income in
emerging markets
99
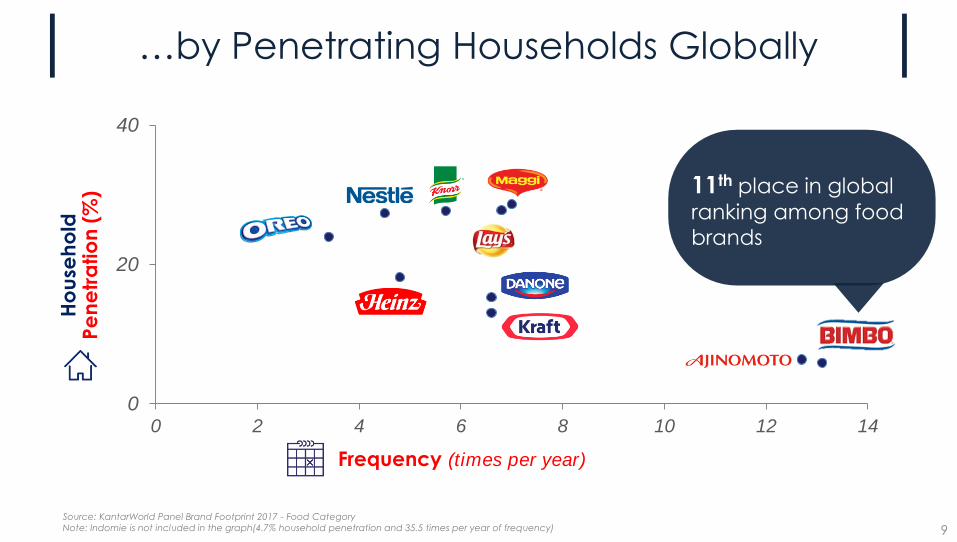
…by Penetrating Households GloballyH
ou
seh
old
P
en
etr
atio
n (
%)
Source: KantarWorld Panel Brand Footprint 2017 - Food Category
Note: Indomie is not included in the graph(4.7% household penetration and 35.5 times per year of frequency)
0
20
40
0 2 4 6 8 10 12 14
Frequency (times per year)
11th place in global
ranking among food
brands
10
OUR VISION
10

11
1
2
3
4
5
KEY CAPABILITIES
11

12
The Management Team has Positioned Grupo Bimbo as a Global Market Leader
• Named “One of the most ethical companies in the world” in 2017 by
the Ethisphere Institute
• Ranked among the most respected companies in the world(1)
• Recognized as “The company with the best corporate reputation in
Mexico in 2017” by Merco. “Its reputation has been built on a strong
corporate identity and brand image”
• Social Responsibility Program as a key component of corporate
identity
• Complies with the global strategy of the World Health Organization
on diet, physical activity and health
Top Management
Outstanding Corporate Governance
Focused on Social Responsibility
• Track record of stability and sustainable growth
• Successfully completed and integrated over 40 acquisitions over the
last 10 years
• Corporate Governance aligned with shareholders’ interest
• 35% of board members are independent
• 3 corporate committees
12
Daniel ServitjeChairman of the Board
Daniel ServitjeCEO
Finance & Planning Committee (6 members, 1 independent)
Results and Evaluation Committee (5 members, 1 independent)
Audit Committee and Corporate Practices (5 independent members)
Note: Years of experience at Grupo Bimbo
(1) According to the Reputation Institute
José Gabriel CalderónChief Global
Auditing Officer
7 years
Raúl ObregónChief Global
Transformation
15 years
Alfred PennyBBU President
36 years
Javier A. González Executive VP of Grupo Bimbo
39 years
Diego GaxiolaCFO
<1 year
Pablo ElizondoExecutive VP of Grupo Bimbo
39 years
Gabino GómezExecutive VP of Grupo Bimbo
35 years
Raúl ArgüellesChief HR and
Corporate Affairs
5 years
Reynaldo ReynaChief Global Services
15 years
1313
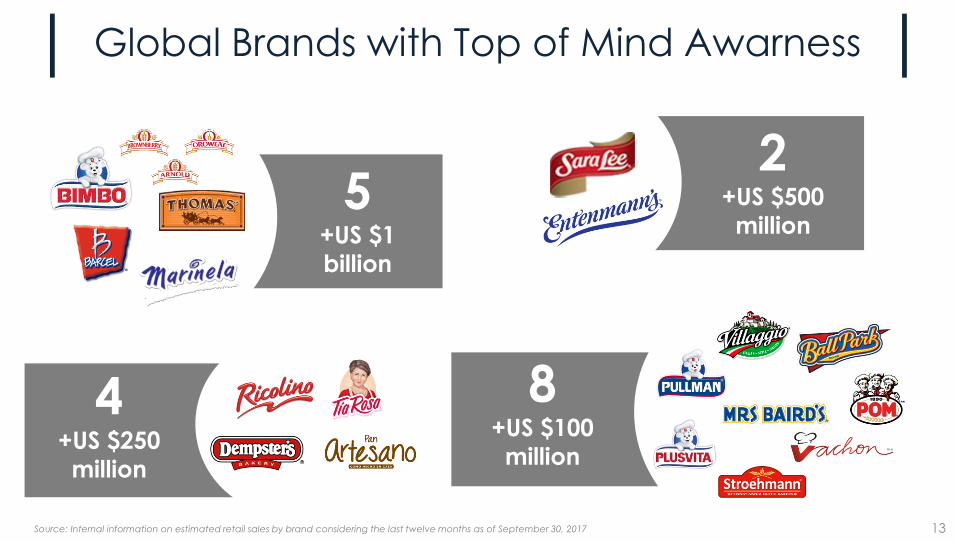
Global Brands with Top of Mind Awarness
8+US $100
million
2 +US $500
million
8 +US $100
million
4+US $250
million
5 +US $1
billion
Source: Internal information on estimated retail sales by brand considering the last twelve months as of September 30, 2017
1414
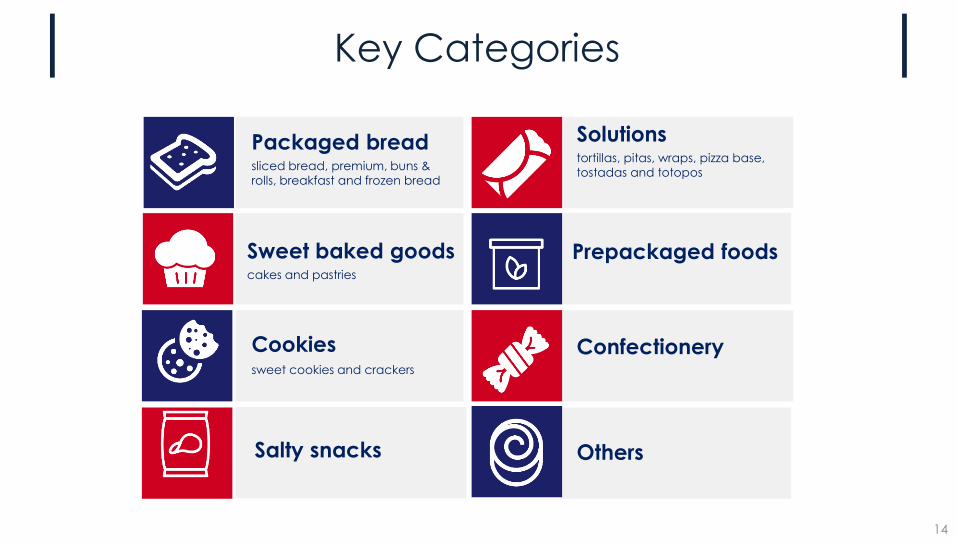
Key Categories
Packaged breadsliced bread, premium, buns & rolls, breakfast and frozen bread
Sweet baked goodscakes and pastries
Cookiessweet cookies and crackers
Salty snacks
Solutionstortillas, pitas, wraps, pizza base, tostadas and totopos
Prepackaged foods
Confectionery
Others

1515
1616
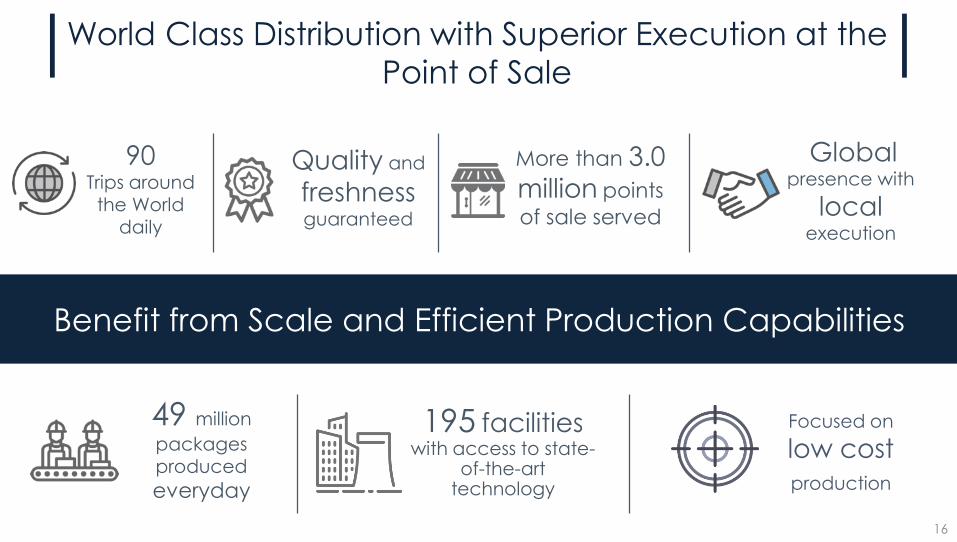
World Class Distribution with Superior Execution at the
Point of Sale
90Trips around
the World daily
49 million
packages produced
everyday
Quality and
freshness guaranteed
More than 3.0
million points
of sale served
Globalpresence with
local execution
195 facilitieswith access to state-
of-the-art technology
Focused on
low cost
production
Benefit from Scale and Efficient Production Capabilities

1717
Continue to Invest in Innovation
We are developing products and categories that follow new megatrends
17
DonutsEntenmann’s on the path
for market leadership in
the US
Expansion
OpportunitiesBreakthrough Innovation
award for Takis in US, since
2014
Tasty Benefits
The unique baked corn
product with chia and rice
Bread SnacksBread expertise to
reinvent “snackification”
Portion ControlLittle Bites is the #1 brand
in the US as an option for
kids’ lunch
Our Core BusinessSuccessful cross-
market sharing
products
1818
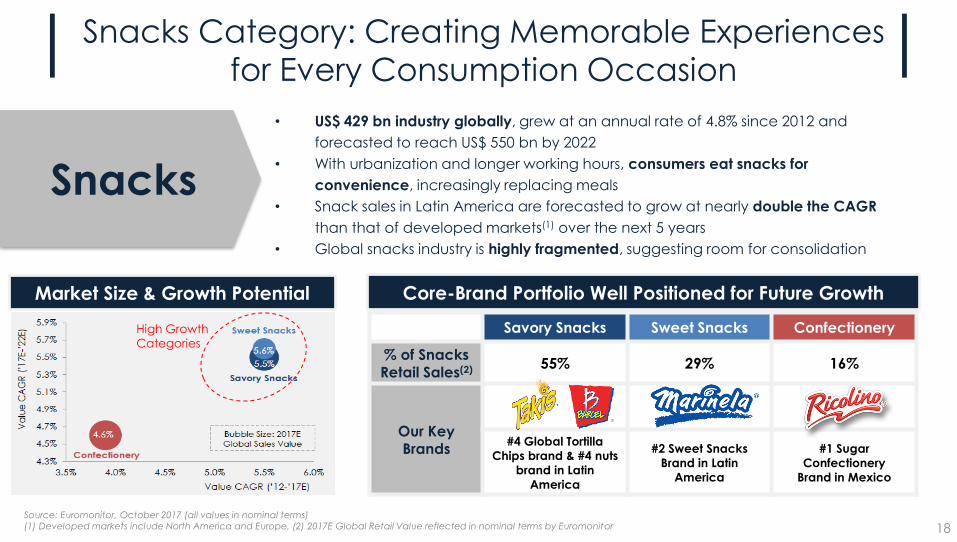
Snacks Category: Creating Memorable Experiences
for Every Consumption Occasion
Snacks
• US$ 429 bn industry globally, grew at an annual rate of 4.8% since 2012 and
forecasted to reach US$ 550 bn by 2022
• With urbanization and longer working hours, consumers eat snacks for
convenience, increasingly replacing meals
• Snack sales in Latin America are forecasted to grow at nearly double the CAGR
than that of developed markets(1) over the next 5 years
• Global snacks industry is highly fragmented, suggesting room for consolidation
Market Size & Growth Potential
Source: Euromonitor, October 2017 (all values in nominal terms)
(1) Developed markets include North America and Europe. (2) 2017E Global Retail Value reflected in nominal terms by Euromonitor
Core-Brand Portfolio Well Positioned for Future Growth
High Growth
Categories
Savory Snacks Sweet Snacks Confectionery
% of Snacks Retail Sales(2) 55% 29% 16%
Our Key Brands
#4 Global Tortilla
Chips brand & #4 nuts
brand in Latin
America
#2 Sweet Snacks
Brand in Latin
America
#1 Sugar
Confectionery
Brand in Mexico
1919
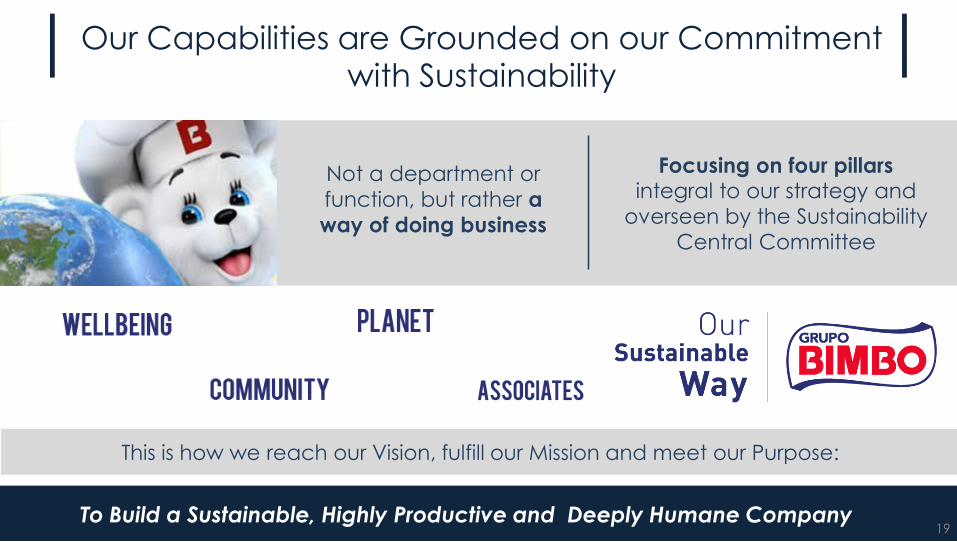
Our Capabilities are Grounded on our Commitment with Sustainability
To Build a Sustainable, Highly Productive and Deeply Humane Company19
Not a department or
function, but rather a
way of doing business
Focusing on four pillars integral to our strategy and
overseen by the Sustainability
Central Committee
This is how we reach our Vision, fulfill our Mission and meet our Purpose:

20
8.1
9.8 9.8 10.7
11.6
10.7
CAGR(2)
: 9.2% CAGR(2): 15.6%
(1) Figures in millions of Mexican pesos. (2)CAGR: Compound Annual Growth Rate in millions of Mexican pesos, using a 4.75 year period for the past figures. (3) Eliminations have been removed from
Mexico’s results.
13.8%
-1.1%
6.4%
Mexico
Latin America
EAA -8.7%
15.8%
0.7%
7.3%
-3.8%
16.7%
3.9%
6.2%
-0.9%
17.6%
2.1%
8.3%
-4.4%
18.7%
1.0%
9.4%
2.7%
18.4%
1.0%
9.3%
-5.6%
North America
Sustained Growth with Focus on Profitability
Sa
les
Sp
lit(3
)
173,139 176,041 187,053
219,186
252,141 265,446
2012 2013 2014 2015 2016 LTM 3Q17
14,07617,326 18,420
23,369
29,298 28,398
2012 2013 2014 2015 2016 LTM 3Q17
20
31%
40%
69%
60%2012
LTM
3Q
17
Mexico
Mexico
International
International
Net sales(1)
Adj. EBITDA(1)
& margins by region

21
Responsible Financial Policies
Dividend HistoryMXN millions
Extraordinary Dividends
Ordinary Dividends
(1) Dividend yield calculated with the stock price of the day the dividends were paid. (2)Dividends paid in advance for 2014 and 2015
*FX rates of the day the dividends were paid
470541 541 588 647 706 776
- -
1,129
1,364
1,646(2)
2007 2008 2009 2010 2011 2012 2013 2014 2015 2016 2017
21
• Commitment to a strong Balance Sheet
• Efficient working capital management
• Focused on reinvestment
• Conservative dividend payout
• Conservative risk management, aligned with
the Company´s strategy
• Investments aimed at improving productivity
to be a low cost producer
• Financial flexibility
• US$2.5 billion in committed revolvingcredit facilities
• Strong liquidity, ample cash balanceand FCF generation
22
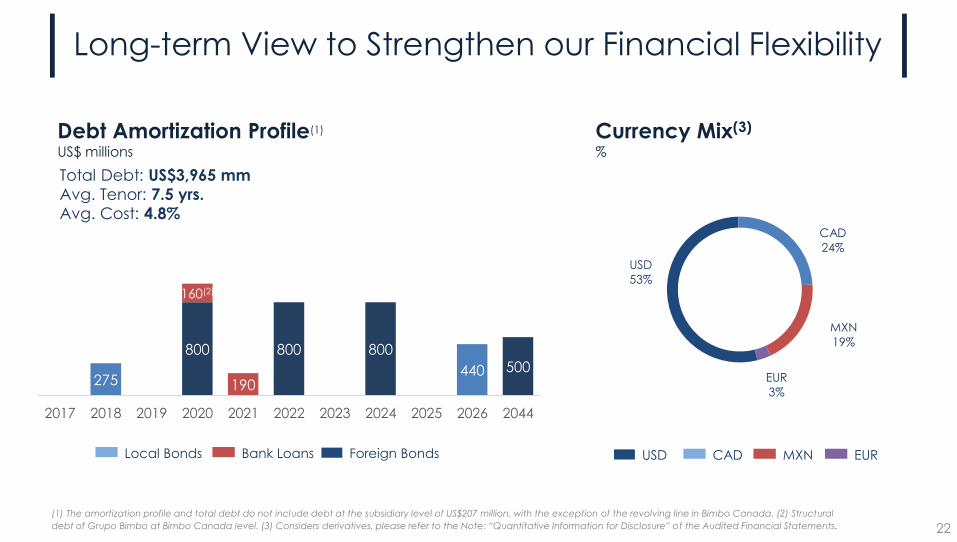
Long-term View to Strengthen our Financial Flexibility
Debt Amortization Profile(1)
US$ millions
Currency Mix(3)
%
Foreign BondsLocal Bonds
Total Debt: US$3,965 mm
Avg. Tenor: 7.5 yrs.
Avg. Cost: 4.8%
Bank Loans
(1) The amortization profile and total debt do not include debt at the subsidiary level of US$207 million, with the exception of the revolving line in Bimbo Canada. (2) Structural
debt of Grupo Bimbo at Bimbo Canada level. (3) Considers derivatives, please refer to the Note: “Quantitative Information for Disclosure” of the Audited Financial Statements. 22
USD MXN EURCAD
USD
53%
CAD
24%
MXN
19%
EUR
3%275
800
190
800 800
440 500
160(2)
2017 2018 2019 2020 2021 2022 2023 2024 2025 2026 2044

The Leading Supplier to the Global QSR Industry
Traditional Buns and Muffins
Product Portfolio
Rolls, Tortillas,
Bagels, Artisanal, Frozen, among others
Main Customers
(1)CAGR: Compound average growth rate from 2013 to LTM June’17. (2)Purchase price free of cash and debt
Leading foodservice-focused company that supplies baked goods to Quick Service
Restaurants (“QSR”) across the world
Operates 21 bakeries in 11 countries
Sales
EBITDA
EBITDA Margin
Purchase Price(2)
≈US$420 million
≈ US$70 million
≈ 16.7%
US$650 million
3.6%
7.4%
-
-
LTM June’17 5yr. CAGR(1)
Financials
23
Excellence in food safety and quality assurance
Produces and ships 13 mm baked goods to 10k+ stores

2424
Positions Grupo Bimbo as a Leading Player in the QSR Industry
A leading player in the QSR industry
Traditional
Channel“Mom & pops”
FoodserviceQSR, schools,
hospitals, restaurants,
among others
Modern ChannelSupermarkets,
convenience stores,
among others
OthersVending machines,
wholesale, among
others
1 2 3 4
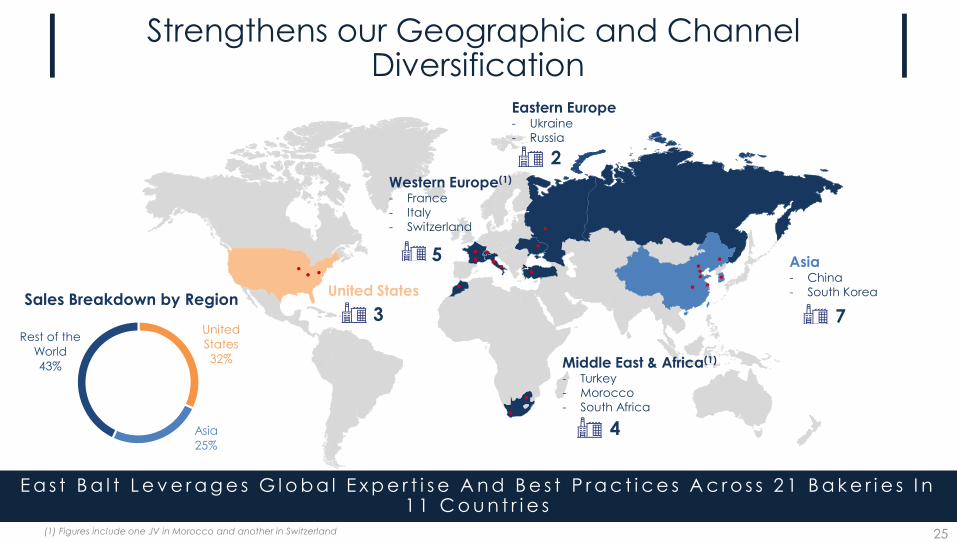
United States
Western Europe(1)
- France
- Italy
- Switzerland
Asia- China
- South Korea
Eastern Europe- Ukraine
- Russia
Middle East & Africa(1)
- Turkey
- Morocco
- South Africa
5
3
2
4
7
(1) Figures include one JV in Morocco and another in Switzerland
Sales Breakdown by Region
E a s t B a l t L e v e r a g e s G l o b a l E x p e r t i s e A n d B e s t P r a c t i c e s A c r o s s 2 1 B a k e r i e s I n 1 1 C o u n t r i e s
25
United
States
32%
Asia
25%
Rest of the
World
43%
Strengthens our Geographic and ChannelDiversification
26
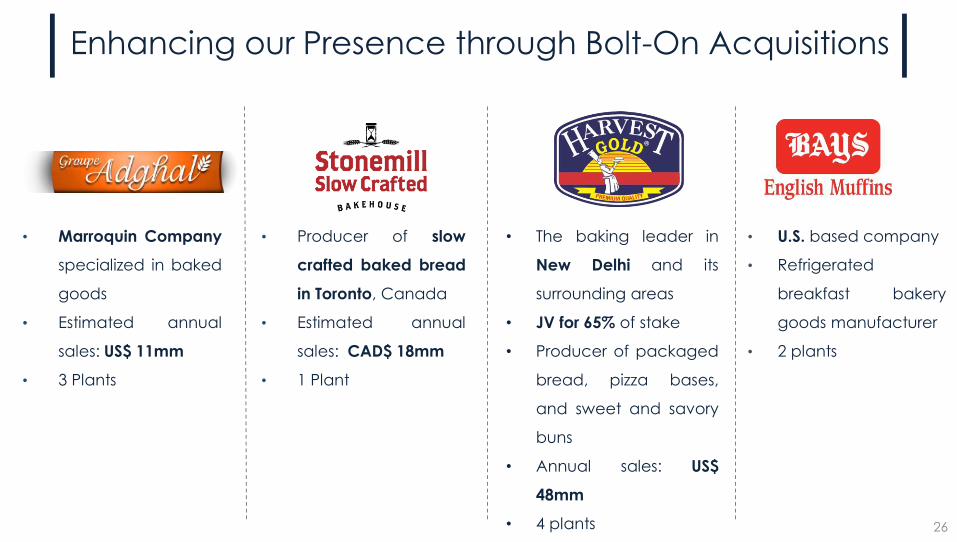
• Marroquin Company
specialized in baked
goods
• Estimated annual
sales: US$ 11mm
• 3 Plants
26
• Producer of slow
crafted baked bread
in Toronto, Canada
• Estimated annual
sales: CAD$ 18mm
• 1 Plant
• The baking leader in
New Delhi and its
surrounding areas
• JV for 65% of stake
• Producer of packaged
bread, pizza bases,
and sweet and savory
buns
• Annual sales: US$
48mm
• 4 plants
Enhancing our Presence through Bolt-On Acquisitions
• U.S. based company
• Refrigerated
breakfast bakery
goods manufacturer
• 2 plants
28
The information contained herein has been prepared by Grupo Bimbo, S.A.B. de C.V. (the “Company") solely for use at this
presentation. This presentation does not purport to contain all of the information that may be required to evaluate any investment
in the Company or any of its securities and should not be relied upon to form the basis of, or be relied on in connection with, any
contract or commitment or investment decision whatsoever. No representation or warranty, either express or implied, is made as to
the accuracy, reliability or completeness of the information presented herein. This presentation has been prepared solely for
informational purposes and should not be construed as containing any offer, invitation or recommendation to purchase, sell or
subscribe for any securities in any jurisdiction and neither the issue of the information nor anything contained herein shall form the
basis of or be relied upon in connection with, or act as an inducement to enter into, any investment activity. This presentation
should not be regarded by recipients as a substitute for the exercise of their own judgment in connection with any investment
activity. The merit and suitability of an investment in the Company should be independently evaluated and any person considering
such an investment in the Company is advised to obtain independent advice as to the legal, tax, accounting, financial, credit and
other related advice prior to making an investment.
Any opinion expressed herein is subject to change without notice, and the Company is under no obligation to update or keep
current the information herein. The Company accepts no liability whatsoever for any loss or damage of any kind arising out of the
use of all or any part of this presentation. This presentation includes forward-looking statements. Such forward-looking statements
are based on certain assumptions and current expectations and projections about future events and trends that may affect the
Company’s business and are not guarantees of future performance. Investors are cautioned that any such forward-looking
statements are and will be, as the case may be, subject to many risks, uncertainties and other unknown factors, including those
relating to the operations and business of the Company. These and various other factors may adversely affect the estimates and
assumptions on which these forward-looking statements are based, many of which are beyond our control. Forward-looking
statements speak only as of the date on which they are made. The Company expressly disclaims any obligation or undertaking to
update or revise any forward-looking statement, whether as a result of new information, future events or otherwise. The Company’s
independent public auditors have neither examined nor compiled this presentation and, accordingly, do not provide any
assurance with respect to any information included herein. In light of the risks and uncertainties described above, the future events
and circumstances discussed in this presentation might not occur and are not guarantees of future performance. Neither this
presentation nor anything contained herein shall form the basis of any contract or commitment whatsoever. The information
included in this presentation may not be reproduced or redistributed, passed on, or the contents otherwise divulged, directly or
indirectly, to any other person or published in whole or in part for any purpose or under any circumstances without the Company’s
prior written consent.