present law and background relating to … · present law and background relating to the individual...
TRANSCRIPT

PRESENT LAW AND BACKGROUND RELATING TO THE INDIVIDUAL ALTERNATIVE MINIMUM TAX
Scheduled for a Public Hearing before the
SENATE COMMITTEE ON FINANCE on June 27, 2007
Prepared by the Staff
of the JOINT COMMITTEE ON TAXATION
June 25, 2007 JCX-38-07

i
CONTENTS
Page
INTRODUCTION .......................................................................................................................... 1
I. INDIVIDUAL ALTERNATIVE MINIMUM TAX.................................................................... 2
A. Present Law and Legislative Background........................................................................... 2
II. DATA AND DISCUSSION OF ISSUES................................................................................. 7
A. Data ..................................................................................................................................... 7
B. Discussion of Issues.......................................................................................................... 19

1
INTRODUCTION
The Senate Committee on Finance scheduled a public hearing for June 27, 2007, on the individual alternative minimum tax. This document,1 prepared by the staff of the Joint Committee on Taxation, provides a description of present law and background relating to the individual alternative minimum tax.
1 This document may be cited as follows: Joint Committee on Taxation, “Present Law and
Background Relating to the Individual Alternative Minimum Tax” (JCX-38-07), June 25, 2007. This document can also be found on the web at www.house.gov/jct.

2
I. INDIVIDUAL ALTERNATIVE MINIMUM TAX
A. Present Law and Legislative Background
In general
An alternative minimum tax (“AMT”) is imposed on an individual, estate, or trust in an amount by which the tentative minimum tax exceeds the regular income tax for the taxable year.2 The tentative minimum tax is the sum of (1) 26 percent of so much of the taxable excess as does not exceed $175,000 ($87,500 in the case of a married individual filing a separate return) and (2) 28 percent of the remaining taxable excess. The taxable excess is so much of the alternative minimum taxable income (“AMTI”) as exceeds the exemption amount. The maximum tax rates on net capital gain and dividends used in computing the regular tax are used in computing the tentative minimum tax.
The exemption amounts are: (1) $62,550 for taxable years beginning in 2006 and $45,000 for taxable years beginning thereafter in the case of married individuals filing a joint return and surviving spouses; (2) $42,500 for taxable years beginning in 2006 and $33,750 for taxable years beginning thereafter in the case of other unmarried individuals; (3) $31,275 for taxable years beginning in 2006 and $22,500 in taxable years beginning thereafter in the case of married individuals filing separate returns; and (4) $22,500 in the case of an estate or trust. The exemption amounts are phased out by an amount equal to 25 percent of the amount by which the individual’s AMTI exceeds (1) $150,000 in the case of married individuals filing a joint return and surviving spouses, (2) $112,500 in the case of other unmarried individuals, and (3) $75,000 in the case of married individuals filing separate returns or an estate or a trust. These amounts are not indexed for inflation.
Alternative minimum taxable income is the individual’s regular taxable income increased by certain adjustments and preference items. In the case of items that involve the timing of deductions, the AMTI treatment negates the deferral of income resulting from the regular tax treatment of these items.
Adjustments and preferences
The adjustments and preferences3 that individuals must take into account to compute AMTI are:
1. Depreciation on property placed in service after 1986 and before January 1, 1999, is computed by using the generally longer class lives prescribed by the alternative depreciation system of section 168(g) and either (a) the straight-line method in the case of property subject to the straight-line method under the regular tax or (b) the
2 There is also a corporate alternative minimum tax, which is not the subject of this document.
3 “Adjustments” is the term used for those items listed in section 56 of the Code and “preferences” is the term used for those listed in section 57 of the Code.

3
150-percent declining balance method in the case of other property. Depreciation on property placed in service after December 31, 1998, is computed by using the regular tax recovery periods and the AMT methods described in the previous sentence. Depreciation on property acquired after September 10, 2001, and before January 1, 2005 (January 1, 2006, for certain property), which is allowed an additional allowance under section 168(k) for the regular tax, is computed without regard to any AMT adjustments.
2. Mining exploration and development costs are capitalized and amortized over a 10-year period.
3. Taxable income from a long-term contract (other than a home construction contract) is computed using the percentage of completion method of accounting.
4. The amortization deduction allowed for pollution control facilities placed in service before January 1, 1999 (generally determined using 60-month amortization for a portion of the cost of the facility under the regular tax), is calculated under the alternative depreciation system (generally, using longer class lives and the straight-line method). The amortization deduction allowed for pollution control facilities placed in service after December 31, 1998, is calculated using the regular tax recovery periods and the straight-line method.
5. Miscellaneous itemized deductions are not allowed.
6. Deductions for State, local, and foreign real property taxes; State and local personal property taxes; State, local, and foreign income, war profits, and excess profits taxes; and State and local sales taxes are not allowed.
7. Medical expenses are allowed only to the extent they exceed ten percent of the taxpayer’s adjusted gross income.
8. The standard deduction and personal exemptions are not allowed.
9. The amount allowable as a deduction for circulation expenditures are capitalized and amortized over a three-year period.
10. The amount allowable as a deduction for research and experimentation expenditures from passive activities are capitalized and amortized over a 10-year period.
11. The regular tax rules relating to incentive stock options do not apply.
12. The excess of the deduction for percentage depletion over the adjusted basis of each mineral property (other than oil and gas properties) at the end of the taxable year is not allowed.
13. The amount by which excess intangible drilling costs (i.e., expenses in excess of the amount that would have been allowable if amortized over a 10-year period) exceed 65 percent of the net income from oil, gas, and geothermal properties is not allowed.
4
This preference applies to independent producers only to the extent it reduces the producer’s AMTI (determined without regard to this preference and the net operating loss deduction) by more than 40 percent)
14. Tax-exempt interest income on private activity bonds (other than qualified 501(c)(3) bonds) issued after August 7, 1986, is included in AMTI.
15. Accelerated depreciation or amortization on certain property placed in service before January 1, 1987, is not allowed.
16. Seven percent of the amount excluded from income under section 1202 (relating to gains on the sale of certain small business stock) is included in AMTI.
17. Losses from any tax shelter farm activity or passive activities are not taken into account in computing AMTI.
Other rules
Net operating loss deduction
The taxpayer’s net operating loss deduction cannot reduce the taxpayer’s AMTI by more than 90 percent of the AMTI (determined without the net operating loss deduction).
Nonrefundable tax credits
Except as otherwise described below, nonrefundable tax credits may not exceed the excess of the individual’s regular tax liability over the tentative minimum tax, meaning they are not allowed against the alternative minimum tax. Thus, credits such as the general business credit,4 the alternative motor vehicle credit, and the alternative fuel vehicle refueling credit generally are not allowed against the AMT.
Several exceptions apply to the general rule denying credits against the AMT.
The alternative minimum tax foreign tax credit reduces the tentative minimum tax.
For taxable years beginning before 2007, the nonrefundable personal credits (i.e., the dependent care credit, the credit for the elderly and disabled, the adoption credit, the child tax credit,5 the credit for interest on certain home mortgages, the HOPE Scholarship and Lifetime Learning credits, the saver’s credit, the D.C. homebuyer’s credit, the nonbusiness energy credit, and the residential energy efficient property credit) are allowed to the extent of the entire amount of the individual’s regular tax and alternative minimum tax.
4 Exceptions apply to certain employment and energy credits.
5 A portion of the child credit may be refundable.

5
For taxable years beginning after 2006, the nonrefundable personal credits (other than the adoption credit, child credit and saver’s credit) are allowed only to the extent that the individual’s regular income tax liability exceeds the individual’s tentative minimum tax (determined without regard to the minimum tax foreign tax credit). The adoption credit, child credit, and saver’s credit are allowed to the full extent of the individual’s regular tax (reduced by the other nonrefundable personal credits) and alternative minimum tax.6
If an individual is subject to AMT in any year, the amount of tax exceeding the taxpayer’s regular tax liability is allowed as a credit (the “AMT credit”) in any subsequent taxable year to the extent the taxpayer’s regular tax liability exceeds his or her tentative minimum tax liability in such subsequent year. For individuals, the AMT credit is allowed only to the extent that the taxpayer’s AMT liability is the result of adjustments that are timing in nature. The individual AMT adjustments relating to itemized deductions and personal exemptions are not timing in nature, and no minimum tax credit is allowed with respect to these items. For taxable years beginning before 2013, individuals with minimum tax credits more than three years old are allowed a portion of these credits each year as a refundable credit.
Legislative Background
The Tax Equity and Fiscal Responsibility Act of 1982 enacted the first comprehensive individual AMT.7 According to the legislative history of that Act, “the committee has amended the present minimum tax provisions applying to individuals with one overriding objective: no taxpayer with substantial economic income should be able to avoid all tax liability by using exclusions, deductions, and credits.”8 The AMT provisions enacted in 1982 are the foundation for the present law individual AMT. Under the 1982 Act, in computing AMTI, the deduction for State and local taxes, the deduction for personal exemptions, the standard deduction, and the deduction for interest on home equity loans were not allowed. Incentive stock option gain was included in AMTI. These remain the principal preferences and adjustments under present law. A rate of 20 percent applied to AMTI in excess of an exemption amount of $40,000 ($30,000 for unmarried taxpayers). The exemption amounts were not indexed for inflation, even though the regular rates were scheduled to be indexed for inflation in future years. Nonrefundable credits (other than the foreign tax credit) were not allowed against the AMT.
The Tax Reform Act of 1986 largely retained the structure of the prior-law AMT, except that deferral preferences were properly adjusted over time and a minimum tax credit was added.
6 The rule applicable to the adoption credit and child credit is subject to the sunset provision of
the Economic Growth and Tax Relief Reconciliation Act of 2001.
7 An add-on minimum tax was first enacted by the Tax Reform Act of 1969. The add-on minimum tax was repealed by the 1982 Act. The add-on minimum tax, as originally enacted, generally was a tax at a 10-percent rate on the sum of the specified tax preferences in excess of the sum of $30,000 plus the taxpayer’s regular tax.
8 Tax Equity and Fiscal Responsibility Act of 1982, S. Rpt. No. 97-494 Vol. 1, at 108 (July 12, 1982).

6
Preferences were added for interest on private activity bonds and for appreciation on charitable contributions (later repealed). The tax rate was increased from 20 to 21 percent, and the exemption amount was phased-out for individuals with AMTI in excess of $150,000 (112,500 for unmarried taxpayers). The prior-law preferences were retained. Net operating losses were allowed to offset only 90 percent of AMTI and the foreign tax credit was not allowed to reduce the tentative minimum tax by more than 90 percent.
Since 1986, several changes have been made to the computation of the individual AMT. The principal changes are set forth below:
Adjustments and preferences.–The principal changes made in the determination of AMTI were to repeal the preference for charitable contributions of appreciated property; repeal the preference for percentage depletion on oil and gas wells; substantially reduce the amount of the preference for intangible drilling expenses; and repeal the requirement that alternative depreciation lives be used in computing the deduction for ACRS depreciation.
Rates.–The Omnibus Budget Reconciliation Act of 1990 increased the individual AMT tax rate from 21 percent to 24 percent (when the maximum regular tax rate was increased from 28 percent to 31 percent) and the rate was further increased by the Omnibus Budget Reconciliation Act of 1993 to the 26- and 28-percent rate structure of present law (when the maximum regular tax rate was increased from 31 percent to 39.6 percent).
The Revenue Reconciliation Act of 1997 conformed the AMT capital gain rates to the lower capital gain rates adopted for the regular tax. The Jobs and Growth Tax Relief Reconciliation Act of 2003 conformed the AMT rates for dividends to the lower rates adopted for the regular tax.
Exemption amounts.–The Omnibus Budget Reconciliation Act of 1993 increased the AMT exemption amounts to $45,000 ($33,750 for unmarried taxpayers). The AMT exemption amounts were temporarily increased to $49,000 ($35,750 for unmarried individuals) for 2001 and 2002, further increased to $58,000 ($40,250 for unmarried individuals) for 2003, 2004, and 2005, and further increased to $62,550 ($42,500 for unmarried individuals) for 2006.
Credits.–For 1998 and subsequent years, the nonrefundable personal credits have been allowed on a temporary basis to offset the AMT. The last extension, through 2006, was enacted by the Tax Increase Prevention and Reconciliation Act of 2005. The Economic Growth and Tax Relief Reconciliation Act of 2001 (“EGTRRA”) provided that the child tax credit, the adoption credit, and the saver’s credit may offset the AMT (subject to the sunset provisions of that Act). The American Jobs Creation Act of 2004 provided that the foreign tax credit may offset the entire tentative minimum tax. The Tax Relief and Health Care Act of 2006 allowed the minimum tax credit for individuals to be refundable in part.
7
II. DATA AND DISCUSSION OF ISSUES
A. Data
Data on taxpayers affected by the AMT
A taxpayer has an alternative minimum tax liability only when his tentative minimum tax exceeds his regular tax liability. However, under present law, for taxable years after 2006, nonrefundable personal credits (with certain exceptions as described above) may not reduce regular tax liability below the tentative minimum tax. Thus, a taxpayer may be affected by the AMT without technically having an AMT liability if the taxpayer’s regular tax exceeds the tentative minimum tax by an amount that is less than the credits. In this case, the taxpayer may reduce his or her regular tax liability to the tentative minimum tax amount, but cannot use the full amount of credits because the credits cannot be used to reduce tax liability below that of the tentative minimum tax. Because the number of taxpayers affected by the AMT through lost credits or with actual AMT liability is determined by an interaction with the regular tax system, in general reductions in regular tax liability, whether from decreases in regular tax rates or from expansions of credits and deductions, will increase the number of taxpayers impacted by the AMT. Similarly, increases in regular tax liability will decrease the number of taxpayers impacted by the AMT.
Figure 1, below, shows the number of taxpayers with AMT liability and the aggregate amount of such liabilities from 1987 through 2004,9 together with projections for 2006 through 2017. Figure 2 presents projected data on individual taxpayers affected by the individual AMT for 2006 through 2017.10 These data show that there will be a sharp increase in the number of taxpayers affected by the AMT in 2007. The principal reason for this increase is that, beginning in 2007, the AMT exemption levels revert to the levels in effect prior to 2001 and certain nonrefundable personal credits are no longer allowed against the AMT. The number of taxpayers affected by the AMT continues to rise through 2010 as a result of the fact that the AMT exemption levels are not indexed for inflation while the regular income tax is indexed for inflation. By 2010, almost 31 million individual income tax returns will have AMT liability and/or restricted use of credits totaling approximately $119 billion. The number of taxpayers affected by the AMT declines in 2011 as a result of the expiration of the provisions of
9 2005 data are not yet available, and Joint Committee on Taxation models do not make
projections for years prior to the immediately preceding year.
10 The figures and tables in this pamphlet define taxpayers affected by the AMT as those who have an AMT liability or who have restricted use of credits as a result of the AMT. There are some other ways in which taxpayers can be affected by the AMT that do not show up in this definition. For example, some taxpayers may choose to itemize deductions, even when the standard deduction would be higher, because certain itemized deductions are allowed on the AMT while the standard deduction is not. Such a taxpayer could then have a regular tax liability in excess of their AMT liability and not show up in the tables as a return “affected by the AMT,” even though in the absence of the AMT they would have chosen to take the standard deduction in order to further reduce their tax liability.

8
EGTRRA.11 The expiration of EGTRRA raises regular income tax liability and thus causes fewer taxpayers to be affected by the AMT. After a one-time decline in the number of taxpayers affected by the AMT in 2011, the number will resume rising because the AMT exemption amounts are not indexed for inflation.
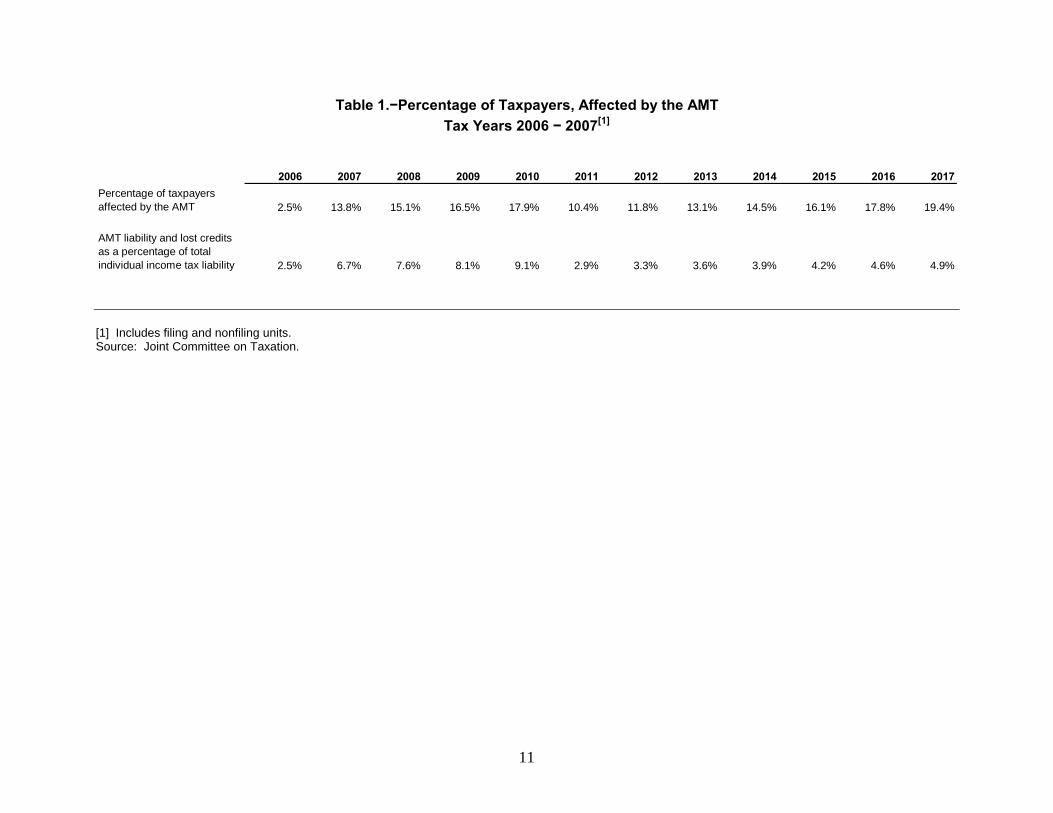
Table 1, below, shows the percentage of taxpayers affected by the AMT for years 2006 through 2017, together with the total amount of AMT liability and lost credits as a percentage of total individual income tax liability.
11 The principal provisions that expire and reduce the number of taxpayers affected by the AMT
include the expiration of the reduced regular income tax rates, the elimination of the phaseouts of personal exemptions and itemized deductions, and the marriage penalty relief for the standard deduction and the 15-percent bracket.

9
Figure 1.–Individual Alternative Minimum Tax1987 – 2017
140 114 117 132 244 287 335 369 414 478 618 853 1,018 1,304 1,1201,911 2,349
3,0964,005
22,184
24,156
26,684
29,356
13,611
16,300
18,957
21,587
24,798
28,194
31,427
4,088$1,675 $1,028 $831 $830 $1,213 $1,357 $2,053 $2,212 $2,291 $2,813
$4,005 $5,015$6,478
$9,601
$6,757 $6,854$9,465
$13,029
$17,421$19,773
$65,784
$78,212
$89,327
$107,703
$32,779
$39,445
$46,901
$54,674
$64,513
$75,578
$87,966
0
10,000
20,000
30,000
40,000
50,000
60,00019
87
1988
1989
1990
1991
1992
1993
1994
1995
1996
1997
1998
1999
2000
2001
2002
2003
2004
2005
2006
2007
2008
2009
2010
2011
2012
2013
2014
2015
2016
2017
Num
ber o
f AM
T Ta
xpay
ers
(in th
ousa
nds)
-$10,000
$10,000
$30,000
$50,000
$70,000
$90,000
$110,000
AM
T Li
abili
ty (i
n $
mill
ions
)
Number of AMT taxpayers
AMT LiabilityProjections: 2006-2017
Source: SOI Historical data and JCT projections.

10
Figure 2.−Taxpayers Affected by the AMTProjections: 2006 − 2017
4,237
23,194
25,674
28,275
30,914
18,171
20,732
23,330
26,009
29,245
32,716
35,875
$24,949
$73,311
$88,053
$100,079
$119,463
$46,305
$54,516
$63,201
$71,977
$82,772
$94,962
$108,214
0
10,000
20,000
30,000
40,000
50,000
60,000
2006 2007 2008 2009 2010 2011 2012 2013 2014 2015 2016 2017
Num
ber o
f tax
paye
rs (i
n th
ousa
nds)
0
20,000
40,000
60,000
80,000
100,000
120,000
Am
ount
(in
$ m
illio
ns)
Number of taxpayers affectedAMT liability and lost credits
Source: Joint Committee on Taxation
11
2006 2007 2008 2009 2010 2011 2012 2013 2014 2015 2016 2017Percentage of taxpayers affected by the AMT 2.5% 13.8% 15.1% 16.5% 17.9% 10.4% 11.8% 13.1% 14.5% 16.1% 17.8% 19.4%
AMT liability and lost credits as a percentage of total individual income tax liability 2.5% 6.7% 7.6% 8.1% 9.1% 2.9% 3.3% 3.6% 3.9% 4.2% 4.6% 4.9%
Table 1.−Percentage of Taxpayers, Affected by the AMTTax Years 2006 − 2007[1]
[1] Includes filing and nonfiling units. Source: Joint Committee on Taxation.
12
Figure 3, below, shows the projected number of taxpayers affected by the AMT under the assumption that the principal tax rate provisions of EGTRRA are extended beyond their expiration under current law. These include the extension of the lower regular income tax rates including the establishment of the 10 percent bracket, the elimination of the phaseouts of personal exemptions and itemized deductions, and the marriage penalty relief for the standard deduction and the 15-percent bracket. Under these assumptions, the number of taxpayers affected by the AMT rises to 35.3 million in 2011 rather than dropping to 8.2 million, and rises to 51 million in 2017 rather than 35.9 million under present law. Similarly, as shown in Figure 4, below, aggregate AMT liabilities and lost credits rise to $136.9 billion in 2011 rather than dropping to $46.3 billion, and they rise to $256.9 billion in 2017 rather than rising to $108.2 billion in 2017.
Table 2, below, shows the projected distribution of individual taxpayers affected by the AMT for 2006, 2007, and 2010 for all taxpayers and by filing status. While the upper income groups are most heavily affected by the AMT, those with the highest incomes within this category are less likely to be affected by the AMT since most of their income is taxed at the highest rate under the regular income tax, 35 percent, which exceeds the rates imposed under the AMT and thus such taxpayers tend to have a regular tax liability that exceeds their AMT liability. Note that while, in 2010, 31.5 percent of taxpayers with incomes over $1,000,000 will be affected by the AMT, over 98 percent of those with incomes between $200,000 and $500,000 will be affected.
Table 2 demonstrates that the individual AMT will affect significantly more taxpayers in 2007 than in 2006, and will extend its reach further down the income distribution. For example, in tax year 2006, only 170,000 taxpayers, or 1.6 percent of taxpayers with adjusted gross income between $75,000 and $100,000, are estimated to be affected by the AMT and have an AMT liability or lost credits totaling $290 million. However, by 2007 almost half of such taxpayers in this income group, nearly 5.7 million taxpayers, would be affected by the AMT and experience AMT liabilities or lost credits totaling $6.3 billion. As noted above, the principal reason for this increase is the reversion of the AMT exemption levels to the levels in effect prior to 2001. Also, while the initial decline in the AMT exemption levels will cause a substantial spike in the numbers of taxpayers affected by the AMT, more taxpayers at ever lower income levels will gradually be affected by the AMT with each passing year because the AMT exemption levels are not indexed for inflation while the regular income tax generally is indexed for inflation.
With respect to the variation in the impact of the AMT by filing status, various observations may be made from Table 2 but care must be taken in drawing firm conclusions with respect to factors driving these observations. For example, Table 2 shows that married taxpayers with children are the most likely to be affected by the AMT in all years. Some of this effect is certainly driven by the inability to claim personal exemptions against AMTI, but some of the effect is also likely to be driven by the fact that married taxpayers tend to have higher incomes, and the AMT still principally affects upper income taxpayers. Note too that, while married taxpayers with children are more likely to be affected by the AMT than married taxpayers without children, this is not true in any year at incomes above $500,000. Because there is nothing inherent in the structure of the AMT that can cause this (indeed, it can only cause the opposite effect due to the treatment of personal exemptions) this anomalous result may stem from differences in the within-group distribution of income between married taxpayers with children

13
and those without, or perhaps it may be the case that, for whatever reason, there is a correlation between not having children and having other AMT preferences at these income levels.

14
Tax Year 2006
Adjusted Gross Income ReturnsAMT + lost
credits
Percentage of taxpayers
affected by the AMT Returns
AMT + lost credits
Percentage of taxpayers affected by
the AMT ReturnsAMT + lost
credits
Percentage of taxpayers affected by
the AMT ReturnsAMT + lost
credits
Percentage of taxpayers affected by
the AMT ReturnsAMT + lost
credits
Percentage of taxpayers affected by the AMT
Less than $20,000 25 $294 0.0% 22 $69 0.0% 1 $138 0.0% 2 $81 0.1% 0 $7 0.0%$20,000 - $40,000 7 $18 0.0% 6 $9 0.0% 0 $1 0.0% 0 $3 0.0% 0 $5 0.0%$40,000 - $50,000 17 $27 0.2% 3 $8 0.1% 5 $16 0.2% 5 $3 0.2% 4 $1 0.2%$50,000 - $75,000 96 $140 0.5% 28 $45 0.5% 13 $14 0.2% 16 $30 0.3% 39 $50 2.1%$75,000 - $100,000 177 $290 1.6% 29 $59 1.4% 35 $70 0.9% 48 $85 1.0% 65 $76 11.0%$100,000 - $200,000 1,259 $3,295 10.2% 202 $602 13.3% 225 $882 4.8% 690 $1,457 11.8% 142 $353 40.2%$200,000 - $500,000 2,302 $13,224 74.0% 261 $1,741 67.8% 733 $4,369 63.9% 1,252 $6,769 82.6% 56 $345 90.3%$500,000 - $1,000,000 275 $3,782 47.3% 32 $394 44.4% 123 $1,679 52.3% 116 $1,627 44.1% 4 $82 36.4%$1,000,000 and above 80 $3,880 23.1% 13 $550 28.9% 41 $1,765 28.5% 24 $1,495 15.9% 2 $70 28.6%
Total 4,237 $24,949 2.5% 595 $3,476 0.7% 1,175 $8,935 4.0% 2,153 $11,549 7.4% 314 $989 1.5%
Tax Year 2007
Adjusted Gross Income ReturnsAMT + lost
credits
Percentage of taxpayers
affected by the AMT Returns
AMT + lost credits
Percentage of taxpayers affected by
the AMT ReturnsAMT + lost
credits
Percentage of taxpayers affected by
the AMT ReturnsAMT + lost
credits
Percentage of taxpayers affected by
the AMT ReturnsAMT + lost
credits
Percentage of taxpayers affected by the AMT
Less than $20,000 24 $298 0.0% 20 $70 0.0% 1 $141 0.0% 2 $80 0.1% 0 $7 0.0%$20,000 - $40,000 169 $80 0.5% 13 $10 0.1% 33 $9 0.7% 46 $37 1.0% 77 $24 1.0%$40,000 - $50,000 443 $264 4.0% 32 $33 0.7% 118 $72 5.2% 73 $61 3.4% 221 $99 13.0%$50,000 - $75,000 2,477 $1,812 12.5% 177 $211 2.8% 296 $214 5.2% 1,019 $618 17.8% 986 $769 46.0%$75,000 - $100,000 5,670 $6,301 49.0% 185 $297 8.5% 1,772 $1,402 42.3% 3,230 $3,928 70.8% 483 $674 75.5%$100,000 - $200,000 10,794 $28,158 81.0% 601 $1,581 35.9% 3,776 $7,134 75.2% 6,051 $18,354 97.0% 367 $1,088 92.7%$200,000 - $500,000 3,236 $28,098 95.3% 324 $2,394 80.6% 1,214 $9,759 96.4% 1,635 $15,438 98.1% 62 $507 93.9%$500,000 - $1,000,000 303 $4,178 49.8% 32 $416 43.2% 132 $1,823 54.1% 133 $1,847 47.7% 5 $91 41.7%$1,000,000 and above 81 $4,122 22.3% 12 $567 26.7% 42 $1,904 27.8% 25 $1,580 15.5% 2 $71 28.6%
Total 23,197 $73,311 13.8% 1,396 $5,579 1.6% 7,384 $22,459 25.1% 12,214 $41,942 41.8% 2,202 $3,331 10.5%
Tax Year 2010
Adjusted Gross Income ReturnsAMT + lost
credits
Percentage of taxpayers
affected by the AMT Returns
AMT + lost credits
Percentage of taxpayers affected by
the AMT ReturnsAMT + lost
credits
Percentage of taxpayers affected by
the AMT ReturnsAMT + lost
credits
Percentage of taxpayers affected by
the AMT ReturnsAMT + lost
credits
Percentage of taxpayers affected by the AMT
Less than $20,000 26 $341 0.0% 22 $81 0.0% 2 $152 0.0% 2 $100 0.1% 0 $9 0.0%$20,000 - $40,000 188 $78 0.6% 10 $11 0.1% 42 $11 0.9% 51 $29 1.2% 85 $27 1.0%$40,000 - $50,000 635 $428 5.5% 53 $54 1.0% 134 $78 6.6% 74 $82 3.6% 375 $213 19.8%$50,000 - $75,000 3,649 $3,128 17.4% 265 $331 3.4% 587 $387 10.5% 1,307 $1,036 26.2% 1,491 $1,374 57.6%$75,000 - $100,000 6,973 $9,929 52.9% 250 $411 8.0% 2,348 $2,183 51.4% 3,535 $6,048 78.7% 840 $1,287 85.9%$100,000 - $200,000 14,447 $43,817 85.6% 954 $2,452 41.8% 5,454 $12,021 85.4% 7,491 $27,513 98.2% 549 $1,831 94.2%$200,000 - $500,000 4,326 $46,747 98.1% 487 $3,838 90.4% 1,601 $15,866 98.5% 2,153 $26,152 99.5% 85 $892 98.8%$500,000 - $1,000,000 537 $8,061 70.9% 49 $724 54.4% 222 $3,410 73.5% 256 $3,793 73.4% 9 $135 56.3%$1,000,000 and above 138 $6,934 31.5% 20 $934 35.7% 67 $3,252 36.6% 49 $2,629 25.8% 2 $120 25.0%
Total 30,920 $119,463 17.9% 2,109 $8,835 2.3% 10,456 $37,358 34.4% 14,919 $67,381 50.5% 3,436 $5,889 15.7%
Source: Joint Committee on Taxation.
Head of HouseholdAll Taxpayers Single Taxpayers Married Taxpayers with no Children Married Taxpayers with Children
Head of Household
All Taxpayers Single Taxpayers Married Taxpayers with no Children Married Taxpayers with Children
All Taxpayers Single Taxpayers Married Taxpayers with no Children Married Taxpayers with Children
[Retuns in Thousands, Dollars in Millions]
Table 2.−The Distribution of Taxpayers Affected by the AMT by Filing StatusProjections for Tax Years 2006, 2007, and 2010
Head of Household

15
Figure 3.−Projected Number of Taxpayers Affected by the AMT UnderPresent Law and with the Extension of EGTRRA Rates(1)
4,237
23,194
25,674
28,275
30,914
35,282
38,143
40,619
43,030
45,802
48,381
50,986
4,237
23,194
25,674
28,275
30,914
18,171
20,732
23,330
26,009
29,245
32,716
35,875
0
10,000
20,000
30,000
40,000
50,000
60,000
2006 2007 2008 2009 2010 2011 2012 2013 2014 2015 2016 2017
Years
Ret
urns
in th
ousa
nds
Extension of EGTRRA RatesPresent law
[1] This includes the extension of regular income tax rates, the elimination of the personal exemption and itemized deduction phaseouts, and the marriage penalty relief for the standard deduction and the 15-percent bracket. Source: Joint Committee on Taxation.

16
Figure 4.−Projected AMT Liability and Lost CreditsUnder Present Law and with the Extension of EGTRRA Rates(1)
$24,949
$73,311
$88,053
$100,079
$119,463
$136,908
$155,222
$173,177
$190,976
$211,419
$233,456
$256,940
$24,949
$73,311
$88,053
$100,079
$119,463
$46,305$54,516
$63,201
$71,977
$82,772
$94,962
$108,214
$0
$50,000
$100,000
$150,000
$200,000
$250,000
$300,000
2006 2007 2008 2009 2010 2011 2012 2013 2014 2015 2016 2017
Years
Am
ount
in $
mill
ions
Extension of EGTRRA RatesPresent law
[1] This includes the extension of regular income tax rates, the elimination of the personal exemption and itemized deduction phaseouts, and the marriage penalty relief for the standard deduction and the 15-percent bracket. Source: Joint Committee on Taxation.

17
Table 2 also shows that when the higher exemption levels of 2006 expire and revert to the pre-2001 levels, the overall impact on married taxpayers with children, married taxpayers without children, and head of household filers is of a similar magnitude, while the impact on single taxpayers is substantially less. The percentage of taxpayers affected by the AMT increases six- to seven-fold for married taxpayers with no children (4.0 percent to 25.1 percent), for married taxpayers with children (7.4 percent to 41.8 percent), and for head of household filers (1.5 percent to 10.5 percent). The percentage of single taxpayers affected by the AMT increases only about two-fold, from 0.7 percent to 1.6 percent. The difference in the effect on single taxpayers versus married taxpayers may reflect the larger drop in the magnitude of the exemption for married taxpayers as compared to unmarried taxpayers. The difference in the effect on single taxpayers versus head of household filers would not be the result of differences in the amount of the drop in the AMT exemption amount because the exemption level for these two groups is the same, but likely is a reflection of the differences in the regular tax treatment of single versus head of household filers, especially over the lower income ranges that did not have positive AMTI until the drop in the AMT exemption levels.
Table 3, below, shows the number of returns with selected AMT preferences and adjustments for 2006, 2007, 2010 and 2017. Table 4, below, shows the same selected AMT preferences as a percentage of all AMT preferences for the same years. The tables show that State and local taxes and personal exemptions are the largest preferences by a substantial margin. They also show that while the State and local tax deduction preference is nearly three times as large as the personal exemptions preference in 2006, after 2006 the personal exemptions become equally important and grow to become more important by 2017. The reason for the increased importance of personal exemptions is that the decline in the real value of the AMT exemption over time causes the AMT to extend further down the income distribution. At lower income levels the amount of State and local tax deductions tend to be less than the value of personal exemptions, because State and local taxes are highly correlated with income, while personal exemptions are not.

18
AMT Preferences and Adjustments Returns Dollars Returns Dollars Returns Dollars Returns Dollars
State and local tax deduction 4,025 $90,943 19,845 $237,116 26,874 $332,910 29,547 $368,457Personal exemptions 4,208 $32,563 23,167 $229,542 30,888 $333,532 35,231 $445,802Miscellaneous itemized expenses deduction 1,248 $16,484 5,206 $39,158 6,474 $51,150 7,796 $64,447Standard deduction 207 $1,756 3,344 $33,850 3,694 $39,258 5,893 $63,895Medical expense deduction 206 $723 1,589 $3,788 2,591 $6,973 3,950 $11,206Refund of taxes 2,092 -$5,104 10,290 -$13,960 13,157 -$19,637 13,926 -$22,459All other preferences and adjustments 1,225 $7,736 1,740 $8,583 1,971 $6,361 1,639 $6,709Total 4,237 $145,101 23,197 $538,077 30,920 $750,547 35,907 $938,057
Table 3.−Taxpayer Affected by the AMT
Projected AMT Preferences, Selected Years
2006 2007 2010 2017
[Returns in Thousands, Dollars in Millions]
AMT Preferences and Adjustments 2006 2007 2010 2017State and local tax deduction 62.7% 44.1% 44.4% 39.3%Personal exemptions 22.4% 42.7% 44.4% 47.5%Miscellaneous itemized expenses deduction 11.4% 7.3% 6.8% 6.9%Standard deduction 1.2% 6.3% 5.2% 6.8%Medical expense deduction 0.5% 0.7% 0.9% 1.2%Refund of taxes -3.5% -2.6% -2.6% -2.4%All other preferences and adjustments 5.3% 1.6% 0.8% 0.7%Total 94.7% 98.4% 99.2% 99.3%
Table 4.−Taxpayers Affected by the AMT
Selected AMT Preferences and AdjustmentsPercentage of Total AMT Preferences and Adjustments
Projections for Selected Years
Source: Joint Committee on Taxation.

19
B. Discussion of Issues
The individual AMT is in some sense a separate tax system within the individual income tax system that applies a more compressed rate structure to a broader base of income. However, the AMT should be analyzed in terms of equity, efficiency, and growth by how it interacts with the regular tax system in determining overall Federal income tax liabilities and how it affects individuals’ marginal tax rates. In terms of its affect on the simplicity of the tax system, it is unambiguous that a separate calculation of tax liability under alternative rules is a complication to the individual complying with his tax obligation and the IRS in administering it.
Equity
In practice, the AMT has the effect of requiring more taxpayers to remit at least some funds to the Federal Treasury every year than would be the case if only the regular income taxes applied. This occurs if (1) the taxpayer’s tentative minimum tax exceeds his or her regular tax liability, or (2) the use of tax credits allowed under the regular tax is limited by the taxpayer’s tentative minimum tax. To the extent that taxpayers who outwardly appear to have the ability to pay taxes indeed do pay taxes, some observers conclude that the AMT increases the perceived fairness of the income tax system.
Indeed, the rationale for enacting the original individual minimum tax in 1969 and revising it later was that some taxpayers were able to avoid paying tax on relatively large incomes. Minimum tax legislation targeted those deductions, exemptions, exclusions, accounting methods, and tax credits that were considered to have contributed to such results. Some of the enacted AMT preferences and adjustments relate to business or investment income (e.g., the depreciation adjustment and the private activity tax-free bond preference) while others relate to regular-tax items that are more personal in nature (e.g., the denial of personal exemptions and certain itemized deductions).
The AMT raises particular equity issues with respect to preference items that are personal in nature. For example, some believe that it is fair that families with many dependents pay less tax than families with fewer dependents and support the regular-tax allowance of personal exemptions and child credits to further this goal. Additionally, many believe that the regular tax permits a deduction for State and local taxes because such payments impact ability to pay Federal income tax, and therefore they believe a similar deduction for AMT purposes should be allowed.12 The AMT, in disallowing these exemptions, deductions, and credits, may frustrate this view of fairness. Also, under present law, as a result of the lack of indexing the AMT exemption levels, the reach of the AMT will increasingly extend further down the income distribution and thus make the tax system less progressive (see discussion above relating to Table 2).
12 Others believe that the deduction for State and local taxes should not be permitted under either
the regular tax or the AMT, as they believe such a deduction subsidizes public expenditure at the State and local level.

20
To assess whether the AMT promotes the overall equity of the tax system, it is necessary to look beyond who remits tax payments to the Federal Treasury to who bears the burden of the AMT. Regarding the individual income tax, while economists generally believe that income taxes on wages are borne by taxpayers who supply labor, there is disagreement concerning the incidence of taxes that affect the returns earned by capital such as the taxation of interest, dividends, capital gains, and business income from pass-through entities. Economists generally believe that businesses do not bear the burden of the tax (including the individual AMT), but rather individuals bear the burden of the tax. There is disagreement, however, over which individuals bear the burden of a business income tax, whether it is customers in the form of higher prices, workers in the form of reduced wages, owners of all capital in the form of lower after-tax returns on investment, or some combination of these individuals.
The uncertainty regarding the incidence of income taxes on the returns to capital makes it difficult to assess the effect the AMT has on the equity of the burden of the income tax system. The AMT raises average tax rates for affected taxpayers. That is, the AMT increases the amount of the affected taxpayer’s tax liability as a percentage of his or her income. At the individual level, higher-income taxpayers are more likely to be AMT taxpayers than are lower-income taxpayers (see Table 2, above). If the burden of the taxes were to rest with the affected taxpayers, the individual AMT might increase the overall progressivity of the income tax system.
Some analysts argue that certain of the business and capital income related aspects of the AMT promote horizontal equity by taxing more equally taxpayers who have the same economic capacity but choose to engage in different patterns of tax-favored activities. Other analysts note that in a market economy, investment by taxpayers would be expected to equilibrate risk-adjusted, after-tax returns. As a consequence, the prices of tax-favored investments would be bid up (or their quantity increase) and the prices of tax-disfavored investments would fall (or their quantity decrease). In equilibrium, the pre-tax returns of tax-favored and tax-disfavored investments would differ, but their after-tax returns would be the same. For example, tax-exempt private activity bonds trade at interest rates lower than otherwise comparable taxable bonds. This is because the tax-exempt borrower does not have to offer as great an interest rate to the lender to provide the lender with a competitive after-tax return. If after-tax returns equilibrate, analysts may question whether a horizontal inequity even exists for the AMT to correct.
Efficiency and growth
A tax system is efficient if it does not distort the choices that would be made in the absence of the tax system. No tax system can be fully efficient. Whether the AMT contributes to the efficiency of the United States tax system depends on the extent to which it reduces other inefficiencies in the tax system and the extent to which it creates new inefficiencies. As an income tax, the AMT reduces the return to work (labor income is taxed) and saving (investment income is taxed). As such, the AMT may distort decisions to supply labor and capital. The size of the marginal tax rate is one of the primary determinants of the size of any distortion created.13
13 For a more detailed discussion of marginal tax rates and possible distortions of labor supply
and saving under an income tax see Joint Committee on Taxation, Overview of Present Law and
21
However, the degree of additional distortion, if any, created by the AMT depends upon the tax rates of the AMT compared to those of the regular income tax. In this regard, it is useful to distinguish the effect on labor income from the effect on investment income.
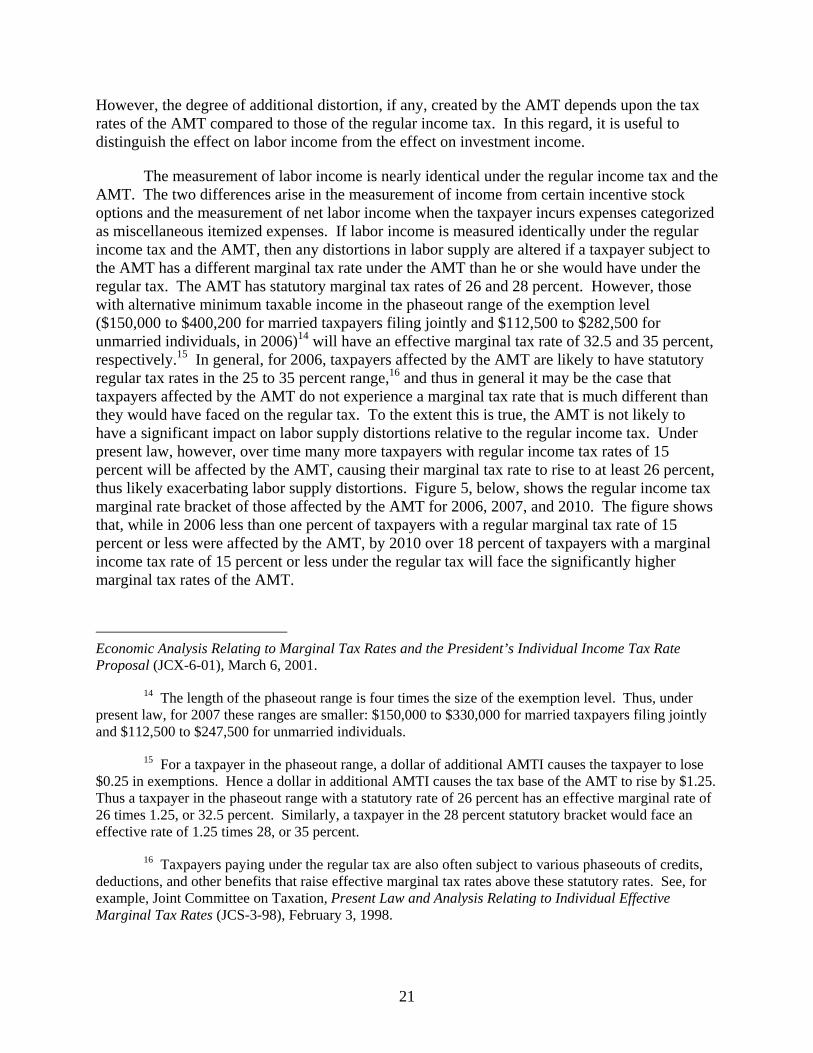
The measurement of labor income is nearly identical under the regular income tax and the AMT. The two differences arise in the measurement of income from certain incentive stock options and the measurement of net labor income when the taxpayer incurs expenses categorized as miscellaneous itemized expenses. If labor income is measured identically under the regular income tax and the AMT, then any distortions in labor supply are altered if a taxpayer subject to the AMT has a different marginal tax rate under the AMT than he or she would have under the regular tax. The AMT has statutory marginal tax rates of 26 and 28 percent. However, those with alternative minimum taxable income in the phaseout range of the exemption level ($150,000 to $400,200 for married taxpayers filing jointly and $112,500 to $282,500 for unmarried individuals, in 2006)14 will have an effective marginal tax rate of 32.5 and 35 percent, respectively.15 In general, for 2006, taxpayers affected by the AMT are likely to have statutory regular tax rates in the 25 to 35 percent range,16 and thus in general it may be the case that taxpayers affected by the AMT do not experience a marginal tax rate that is much different than they would have faced on the regular tax. To the extent this is true, the AMT is not likely to have a significant impact on labor supply distortions relative to the regular income tax. Under present law, however, over time many more taxpayers with regular income tax rates of 15 percent will be affected by the AMT, causing their marginal tax rate to rise to at least 26 percent, thus likely exacerbating labor supply distortions. Figure 5, below, shows the regular income tax marginal rate bracket of those affected by the AMT for 2006, 2007, and 2010. The figure shows that, while in 2006 less than one percent of taxpayers with a regular marginal tax rate of 15 percent or less were affected by the AMT, by 2010 over 18 percent of taxpayers with a marginal income tax rate of 15 percent or less under the regular tax will face the significantly higher marginal tax rates of the AMT.
Economic Analysis Relating to Marginal Tax Rates and the President’s Individual Income Tax Rate Proposal (JCX-6-01), March 6, 2001.
14 The length of the phaseout range is four times the size of the exemption level. Thus, under present law, for 2007 these ranges are smaller: $150,000 to $330,000 for married taxpayers filing jointly and $112,500 to $247,500 for unmarried individuals.
15 For a taxpayer in the phaseout range, a dollar of additional AMTI causes the taxpayer to lose $0.25 in exemptions. Hence a dollar in additional AMTI causes the tax base of the AMT to rise by $1.25. Thus a taxpayer in the phaseout range with a statutory rate of 26 percent has an effective marginal rate of 26 times 1.25, or 32.5 percent. Similarly, a taxpayer in the 28 percent statutory bracket would face an effective rate of 1.25 times 28, or 35 percent.
16 Taxpayers paying under the regular tax are also often subject to various phaseouts of credits, deductions, and other benefits that raise effective marginal tax rates above these statutory rates. See, for example, Joint Committee on Taxation, Present Law and Analysis Relating to Individual Effective Marginal Tax Rates (JCS-3-98), February 3, 1998.

22
In the two cases where labor income is measured differently under the regular income tax and the AMT, the AMT may increase the rate of tax on such forms of labor income, thereby seemingly increasing distortions in labor supply. However, by discouraging taxpayers from structuring their compensation to receive tax-favored remuneration, efficiency may be increased.
A caveat to this discussion is warranted. For the AMT to mitigate or exacerbate a distortion under the regular tax, the taxpayer must know that he or she will be subject to the AMT. If a taxpayer is uncertain whether the tax rates of the AMT or the regular tax will apply it is difficult to assess the taxpayer’s behavioral response. In general, if a taxpayer subject to the AMT views himself or herself as only temporarily subject to the AMT, he or she is less likely to view the AMT tax rates as the relevant tax rates upon which to plan labor supply decisions.

23
Figure 5.--Percentage of Taxpayers Affected by the AMTBy Regular Income Tax Rate Bracket
0.1% 0.1% 0.6%
3.7%
27.3%
75.3%
39.0%
0.2% 0.4%
11.9%
46.7%
72.0%
96.2%
41.0%
0.2% 0.5%
17.8%
52.4%
77.0%
98.3%
54.8%
0%
10%
20%
30%
40%
50%
60%
70%
80%
90%
100%
0% 10% 15% 25% 28% 33% 35%
Regular Income Tax Rate Bracket
Perc
enta
ge o
f Tax
paye
rs A
ffect
ed
2006 2007 2010
Source: Joint Committee on Taxation.

24
The same general analysis of comparing the possible distorting effects of the difference in marginal tax rates under the regular income tax and the AMT applies to taxpayer’s decisions to save (to supply capital) in response to tax rates on investment income. There are several more cases where investment income is measured differently under the AMT than under the regular income tax than was the case with the measurement of labor income. By discouraging some taxpayers from undertaking what are otherwise tax-favored investments, efficiency may be increased to the extent that inefficient investment distortions that would otherwise have been caused by the tax-favored treatment under the regular tax are reversed. However, the AMT generally does not eliminate tax-favored treatment of certain activities or investments, but rather limits which taxpayers may take full advantage of the tax-favored treatment provided by the regular income tax. In addition, limiting which taxpayers can profitably undertake tax-favored activities could lead to more efficient investors finding the activity unprofitable, while less efficient investors find the activity profitable. Moreover, some tax-favored activities may be permitted as part of the regular income tax as a way to reduce some other inefficiency in the economy. These arguments might suggest that efficiency could be better improved by changes in the regular income taxes. The aggregate effect of the AMT on the efficient allocation of capital across various investment opportunities may be modest. Since the Taxpayer Relief Act of 1997 conformed depreciation recovery periods for both the regular income tax and the AMT, the number of investment opportunities on which the income might subject a taxpayer to the AMT rather than the regular tax has been modest in comparison to aggregate investment in the United States. Note that on Table 3, above, these adjustments for depreciation would be a portion of “All other preferences and adjustments,” which itself at $7.7 billion in 2006 is not one of the major adjustment items for the AMT.
However, because of the increasing number of taxpayers subject to the AMT, there is another avenue by which the AMT may affect the level of investment in the United States and thereby affect economic growth. By increasing average tax rates (the total tax paid by certain taxpayers), the AMT may reduce the cash flow of potential investors. If, as some analysts believe, investors’ cash flows are important to investment decisions, the AMT may reduce aggregate investment. Further, the effect of the AMT on effective marginal tax rates, and thereby on the cost of capital, may change the incentive to undertake marginal investment projects and thereby affect the level of aggregate investment.
Some specific preferences and adjustments within the AMT seem inconsistent with other parts of the AMT and thus may lead to inefficiencies. For example, it is often presumed that one goal of the AMT is to apply tax to a better measure of economic income, relative to the regular tax. It is generally conceded that in measuring economic income, deductions should be allowed for expenses incurred in the production of income. However, the AMT disallows the deduction of miscellaneous itemized deductions–including un-reimbursed employee business expenses and investment expenses that relate to the production of income. The disallowance of such deductions may lead to inefficiencies as taxpayers may be discouraged from certain otherwise profitable investments or activities, or encouraged to rearrange their affairs to secure AMT deductions for such costs (e.g., by attempting to move such deductions “above-the-line”).

25
Simplicity and compliance
The AMT requires a calculation of a second income tax base and computation of a tax on that base, so the present tax system, with an AMT, is not as simple to administer or comply with as would be the same system without an AMT. However, some might argue that the availability and widespread use of tax preparation software substantially reduces the compliance costs of the AMT.
As detailed above, relatively few taxpayers currently are subject to the AMT (see Tables 1 and 2, above). However, this observation understates the extent to which the AMT imposes a compliance burden on taxpayers. Many taxpayers must undertake the AMT calculation to determine whether, in fact, they are liable or whether the utilization of certain credits is limited. There are no studies that specifically measure compliance costs arising from the individual AMT. Figure 2, above, indicates that many more individuals will become affected by the AMT in the future.
Selected reform options
In order to reduce the burden of the individual AMT, the tax could be amended in a number of ways. The exemption amounts could be indexed or increased so as to reduce the number of individuals subject to the AMT; the deduction for personal exemptions and the standard deduction could be allowed in computing AMTI; State and local taxes could be permitted against AMTI; the minimum tax rates could be reduced; the phaseout of the minimum tax exemption could be eliminated; all nonrefundable personal credits could be allowed to offset the minimum tax after 2006; or the AMT could be repealed.
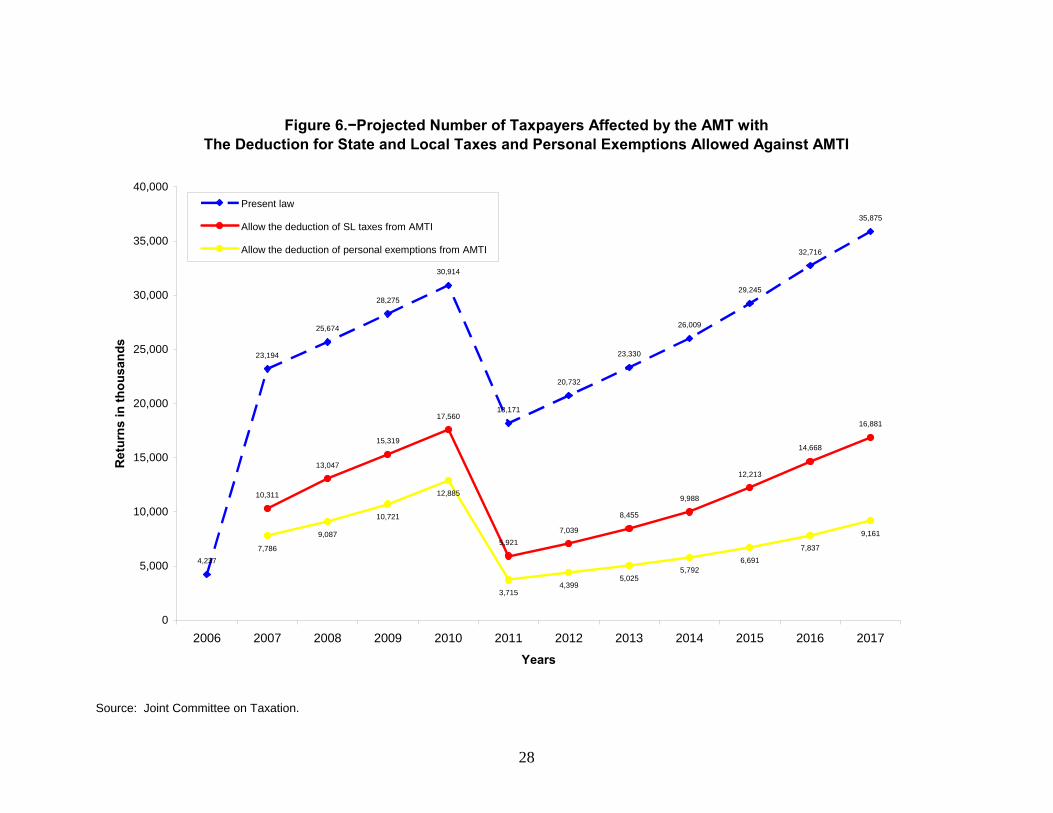
Table 5, below, shows the revenue costs for 2007 through 2017 for various changes to the AMT. Figure 6 and 7, below, show the impact of two of such options (allowing the deduction for state and local taxes and allowing personal exemptions against AMTI ) on the number of taxpayers who would be affected by the AMT and the amount of AMT liabilities and lost credits, respectively. Together, Figure 6 and Figure 7 show that allowing the personal exemptions against AMTI removes more taxpayers from being affected by the AMT than does allowing the deduction for state and local taxes against AMTI, and it does so at a lower revenue cost. Table 6, below, shows the distribution of the number of taxpayers affected by the AMT and the amount of the AMT plus lost credits for the same two options above plus the option of extending the 2006 AMT exemption levels to 2007. The table shows that, with respect to reducing the number of taxpayers affected by the AMT and AMT liability and lost credits, the State and local tax option has a relatively greater effect at the upper ends of the income distribution, while the personal exemption option has the relatively greater effect at the middle and lower end of the distribution.
Figure 8 and 9, below, show the projected number of taxpayers affected by the AMT and the amount of AMT liability and lost credits had the AMT exemption levels been indexed for inflation since 1987, following the Tax Reform Act of 1986. Had the exemption levels been indexed for inflation since 1987, such amounts in 2006 would be $53,000 for unmarried individuals and $70,650 for married taxpayers filing jointly.

26
Effective 2008 2009 2010 2011 2012 2013 2014 2015 2016 2017 2007-12 2007-17
Permit the deduction for state and local taxes for purposes of computing AMTI tyba 12/31/06 -75.7 -62.1 -70.2 -58.5 -34.8 -40.9 -47.4 -54.3 -62.2 -70.6 -301.2 -576.5
Permit a deduction for personal exemptions for purposes of computing AMTI tyba 12/31/06 -58.9 -50.9 -59.6 -51.0 -31.1 -37.2 -43.5 -50.5 -58.9 -68.1 -251.6 -509.8
Permit the deduction for miscellaneous itemized deductions for purposes of computing AMTI tyba 12/31/06 -12.4 -9.8 -10.6 -10.3 -9.4 -10.4 -11.3 -12.2 -13.2 -14.3 -52.5 -114.0
Permit a deduction for the standard deduction for purposes of computing AMTI tyba 12/31/06 -10.8 -9.9 -12.0 -9.9 -5.2 -6.4 -7.7 -9.1 -11.0 -13.1 -47.9 -95.2
Permit deductions for the state and local taxes, miscellaneous itemized deductions, personal exemptions, and the standard deduction for purposes of computing AMTI tyba 12/31/06 -100.5 -86.4 -101.2 -84.0 -45.1 -53.3 -62.1 -71.7 -83.3 -96.2 -417.2 -783.7
Repeal the AMT tyba 12/31/06 -113.1 -96.3 -112.2 -93.9 -51.4 -60.2 -69.4 -79.5 -91.5 -104.8 -466.9 -872.3
Table 5: Estimated Revenue Effects of Selected AMT Reforms
Federal Fiscal Years[Billions of Dollars]
Source: Joint Committee on Taxation.

27
Adjusted Gross Income Returns
AMT + lost
credits
Percentage of taxpayers affected by
the AMT Returns
AMT + lost
credits
Percentage of taxpayers affected by
the AMT Returns
AMT + lost
credits
Percentage of taxpayers affected by the AMT Returns
AMT + lost
credits
Percentage of taxpayers affected by the AMT
Less than $20,000 24 298 0.03% 22 266 0.03% 24 286 0.03% 24 284 0.03%$20,000 - $40,000 169 80 0.53% 127 56 0.40% 12 24 0.04% 7 21 0.02%$40,000 - $50,000 443 264 4.01% 283 164 2.56% 27 52 0.24% 22 37 0.20%$50,000 - $75,000 2,477 1,812 12.52% 1,444 871 7.30% 239 271 1.21% 159 170 0.80%$75,000 - $100,000 5,670 6,301 49.04% 2,360 2,118 20.41% 588 713 5.09% 297 422 2.57%$100,000 - $200,000 10,794 28,158 80.98% 3,828 6,074 28.72% 3,463 6,844 25.98% 1,778 4,241 13.34%$200,000 - $500,000 3,236 28,098 95.34% 2,085 7,786 61.43% 3,067 20,541 90.37% 2,763 16,543 81.41%$500,000 - $1,000,000 303 4,178 49.75% 130 1,891 21.35% 287 3,925 47.13% 302 4,168 49.59%$1,000,000 and above 81 4,122 22.25% 42 2,424 11.54% 79 4,063 21.70% 81 4,124 22.25%
Total 23,197 73,311 13.79% 10,321 21,650 6.14% 7,786 36,721 4.63% 5,432 30,012 3.23%
Table 6.−The Distribution of Taxpayers Affected by the AMTUnder Selected Policy Proposals
Tax Year 2007
Present LawPermit deduction for State and
local taxes from AMTIPermit deduction for personal
exemptions from AMTI
Set the AMT exemption amount to $42,500 ($62,550 for joint
filers)
[Returns in Thousands, Dollars in Millions]
Source: Joint Committee on Taxation.
28
Figure 6.−Projected Number of Taxpayers Affected by the AMT withThe Deduction for State and Local Taxes and Personal Exemptions Allowed Against AMTI
4,237
23,194
25,674
28,275
30,914
18,171
20,732
23,330
26,009
29,245
32,716
35,875
10,311
13,047
15,319
17,560
5,9217,039
8,455
9,988
12,213
14,668
16,881
7,786
9,087
10,721
12,885
3,7154,399
5,0255,792
6,6917,837
9,161
0
5,000
10,000
15,000
20,000
25,000
30,000
35,000
40,000
2006 2007 2008 2009 2010 2011 2012 2013 2014 2015 2016 2017
Years
Ret
urns
in th
ousa
nds
Present law
Allow the deduction of SL taxes from AMTI
Allow the deduction of personal exemptions from AMTI
Source: Joint Committee on Taxation.

29
Figure 7.−Projected AMT Liability and Lost Credits withThe Deduction of State and Local Taxes and Personal Exemptions Allowed Against AMTI
$24,949
$73,311
$88,053
$100,079
$119,463
$46,305
$54,516
$63,201
$71,977
$82,772
$94,962
$108,214
$21,644
$28,747
$33,591
$43,412
$13,804$16,123
$18,336$20,666
$23,816
$27,803
$32,284
$36,717
$43,192
$48,285
$58,282
$19,182$21,977
$24,624$27,611
$30,957$34,846
$39,335
$0
$20,000
$40,000
$60,000
$80,000
$100,000
$120,000
$140,000
2006 2007 2008 2009 2010 2011 2012 2013 2014 2015 2016 2017
Years
Am
ount
in $
mill
ions
Present law
Allow the deduction of SL taxes from AMTI
Allow the deduction of personal exemptions fromAMTI
Source: Joint Committee on Taxation.

30
Figure 8.−Projected Number of Taxpayers Affected by the AMT AMT Exemption Amount Indexed from 1987
4,237
23,194
25,674
28,275
30,914
18,171
20,732
23,330
26,009
29,245
32,716
35,875
2,517 2,720 3,158 3,3403,860
777 863 916 954 1,010 1,081 1,148
0
5,000
10,000
15,000
20,000
25,000
30,000
35,000
40,000
2006 2007 2008 2009 2010 2011 2012 2013 2014 2015 2016 2017
Years
Ret
urns
in th
ousa
nds
Present lawExemption amount indexed from 1987
Source: Joint Committee on Taxation.

31
Figure 9.−Projected AMT Liability and Lost CreditsAMT Exemption Amount Indexed from 1987
$24,949
$73,311
$88,053
$100,079
$119,463
$46,305
$54,516
$63,201
$71,977
$82,772
$94,962
$108,214
$19,067$20,758
$25,801 $27,334
$34,871
$10,662 $11,650 $12,371 $13,074 $13,797 $14,552 $15,415
$0
$20,000
$40,000
$60,000
$80,000
$100,000
$120,000
$140,000
2006 2007 2008 2009 2010 2011 2012 2013 2014 2015 2016 2017
Years
Am
ount
in $
mill
ions
Present law
Exemption amount indexed from 1987
Source: Joint Committee on Taxation.