presence-only modelling for indicator species distribution
TRANSCRIPT

HAL Id: hal-00558859https://hal.archives-ouvertes.fr/hal-00558859
Submitted on 24 Jan 2011
HAL is a multi-disciplinary open accessarchive for the deposit and dissemination of sci-entific research documents, whether they are pub-lished or not. The documents may come fromteaching and research institutions in France orabroad, or from public or private research centers.
L’archive ouverte pluridisciplinaire HAL, estdestinée au dépôt et à la diffusion de documentsscientifiques de niveau recherche, publiés ou non,émanant des établissements d’enseignement et derecherche français ou étrangers, des laboratoirespublics ou privés.
Presence-only modelling for indicator speciesdistribution: biodiversity monitoring in the French Alps
M. Redon, S. Luque
To cite this version:M. Redon, S. Luque. Presence-only modelling for indicator species distribution: biodiversity monitor-ing in the French Alps. 6th Spatial Analysis and Geomatics international conference (SAGEO 2010),Nov 2010, Toulouse, France. p. 42 - p. 55. �hal-00558859�

42 SAGEO 2010 Toulouse
Presence-only modelling for indicator
species distribution:
Biodiversity monitoring in the French Alps
Mathilde Redon (1)
& Sandra Luque (1)
(1) Cemagref, Institute for Agricultural and Environmental Engineering Research,
Grenoble, France. [email protected]
ABSTRACT The problem in biodiversity monitoring and conservation is that usually exist vast gaps in
available information on the spatial distribution of biodiversity that poses a major challenge
for the development of biodiversity indicators and regional conservation planning.
Within this context, models that establish relationships between environmental variables and
species occurrence have been developed to predict species distribution over large areas. We
present an example using two indicator bird species, Tengmalm owl (Aegolius funereus) and
Pygmy owl (Glaucidium passerinum). Maximum entropy (Maxent), a presence-only
modelling approach, is used to model the distribution of these two species within a large study
area in the French Alps. Despite biased sampling design, this method performs very well in
predicting spatial distribution of the two owl species and brings useful information to help
decision-making concerning the protection of valuable habitats.
RESUME Le problème actuel dans les domaines de la gestion et de la conservation de la biodiversité
est que les informations disponibles sur la distribution spatiale de la biodiversité sont souvent
incomplètes. Dans ce contexte, des modèles qui établissent des relations entre des variables
environnementales et des observations d’espèces ont été développés pour prédire la
distribution des espèces à grande échelle. Nous présentons un exemple basé sur deux espèces
emblématiques : la chouette de Tengmalm (Aegolius funereus) et la chevêchette d’Europe
(Glaucidium passerinum). Le Maximum d’entropie (Maxent), une méthode de modélisation
basée uniquement sur des données de présence, a été utilisée pour modéliser la distribution
de ces deux espèces de chouettes sur une grande zone d’étude dans les Alpes françaises.
Malgré un échantillonnage biaisé, cette méthode donne un très bon résultat pour la
répartition potentielle des deux espèces et apporte des informations très utiles pour aider à la
prise de décision concernant la protection des habitats à forte valeur écologique.
KEY WORDS Maxent, distribution modelling, conservation planning, biodiversity indicators, cavity-nesting
owls, French Alps
MOTS CLES Maxent, modélisation de la répartition d’espèces, planification de la conservation,
indicateurs de biodiversité, chouettes cavernicoles, Alpes françaises
Biodiversity monitoring in the French Alps 43
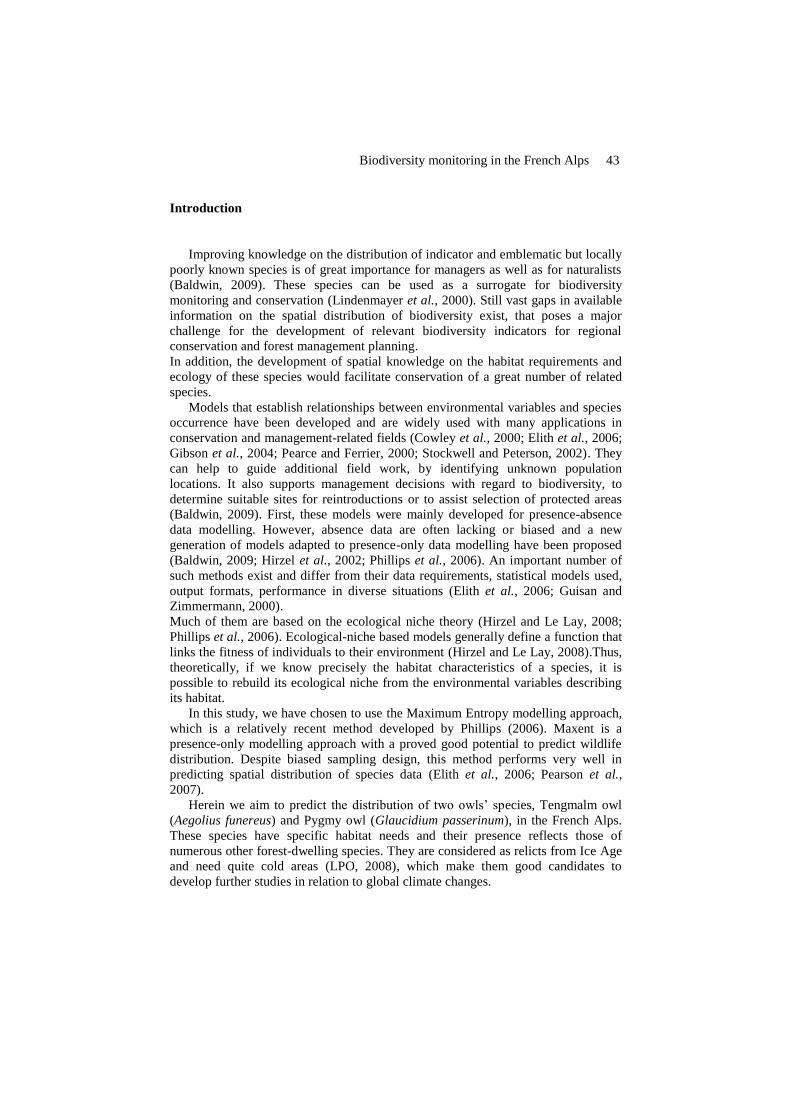
Introduction
Improving knowledge on the distribution of indicator and emblematic but locally
poorly known species is of great importance for managers as well as for naturalists
(Baldwin, 2009). These species can be used as a surrogate for biodiversity
monitoring and conservation (Lindenmayer et al., 2000). Still vast gaps in available
information on the spatial distribution of biodiversity exist, that poses a major
challenge for the development of relevant biodiversity indicators for regional
conservation and forest management planning.
In addition, the development of spatial knowledge on the habitat requirements and
ecology of these species would facilitate conservation of a great number of related
species.
Models that establish relationships between environmental variables and species
occurrence have been developed and are widely used with many applications in
conservation and management-related fields (Cowley et al., 2000; Elith et al., 2006;
Gibson et al., 2004; Pearce and Ferrier, 2000; Stockwell and Peterson, 2002). They
can help to guide additional field work, by identifying unknown population
locations. It also supports management decisions with regard to biodiversity, to
determine suitable sites for reintroductions or to assist selection of protected areas
(Baldwin, 2009). First, these models were mainly developed for presence-absence
data modelling. However, absence data are often lacking or biased and a new
generation of models adapted to presence-only data modelling have been proposed
(Baldwin, 2009; Hirzel et al., 2002; Phillips et al., 2006). An important number of
such methods exist and differ from their data requirements, statistical models used,
output formats, performance in diverse situations (Elith et al., 2006; Guisan and
Zimmermann, 2000).
Much of them are based on the ecological niche theory (Hirzel and Le Lay, 2008;
Phillips et al., 2006). Ecological-niche based models generally define a function that
links the fitness of individuals to their environment (Hirzel and Le Lay, 2008).Thus,
theoretically, if we know precisely the habitat characteristics of a species, it is
possible to rebuild its ecological niche from the environmental variables describing
its habitat.
In this study, we have chosen to use the Maximum Entropy modelling approach,
which is a relatively recent method developed by Phillips (2006). Maxent is a
presence-only modelling approach with a proved good potential to predict wildlife
distribution. Despite biased sampling design, this method performs very well in
predicting spatial distribution of species data (Elith et al., 2006; Pearson et al.,
2007).
Herein we aim to predict the distribution of two owls‟ species, Tengmalm owl
(Aegolius funereus) and Pygmy owl (Glaucidium passerinum), in the French Alps.
These species have specific habitat needs and their presence reflects those of
numerous other forest-dwelling species. They are considered as relicts from Ice Age
and need quite cold areas (LPO, 2008), which make them good candidates to
develop further studies in relation to global climate changes.

44 SAGEO 2010 Toulouse
In addition, their distributions are poorly known and their protection statuses are not
well defined (Loose et al., 2003). It is also important to denote that Pygmy owl
populations in the Vercors Mountains area (Alps range) represent the occidental
limit of the European range of the species (Anonyme, 2007). It represents also an
additional stake to learn more about distribution and habitat structure of this species
at the limit of its range.
Requirements and distribution of Tengmalm owl are less well known because this
species is nocturnal and discreet (Hakkarainen et al., 2008); therefore census data
are difficult to gather. Modelling its potential distribution will allow to improve
knowledge on its habitat and ecological needs. Several local surveys efforts took
place in order to develop a census of the populations within the “Vercors” region.
But these works are limited to very small areas, and a distribution model which
covers the entire mountain region would be very useful to help to define adequate
surveys efforts for the future while at the same time will provide an overview of the
likely distribution of the two species.
1. Material and methods
1.1 Case study area and species occurrence data
This work was conducted within the Vercors‟ Natural Regional Park (VNRP),
located at the frontier between northern and southern French Alps (Figure 1;
http://parc-du-vercors.fr). It covers 206 000 hectares with 139 000 hectares of
forests. Approximately a half of these forests are Public (State and municipalities
forests) and the rest is in the hands of private stakeholders. The main tree species are
Silver Fir (Abies alba), Norway Spruce (Picea abies) and European Beech (Fagus
sylvatica).
We used Tengmalm owl (Aegolius funereus) and Pygmy owl (Glaucidium
passerinum) point counts data from several surveys conducted in the „Hauts
Plateaux du Vercors‟ Natural Reserve (HPVNR), which is located within the VNRP.
The Reserve is mainly composed of three main forest types: i) mixed uneven-aged
beech/spruce/fir forests, ii) pure quite sparse even-aged or uneven-aged spruce
forests and at high elevation, iii) pure sparse naturally even-aged Mountain Pine
forests. The bigger State forest in the Reserve has recently been classified as an
Integral Biological Reserve (IBR).
All local surveys have take place in this State forest and mainly in the IBR. The
two owls‟ species are from the North European boreal forests and the cold sparse
spruce Reserve forests look-like their original habitat. Therefore, local people
generally thought that the range of the two species is limited to these particular
forests in the Vercors.
In this part of the Alps, Pygmy owl depends on cavities carved by the Great
spotted woodpecker (Dendrocopus major) and Tengmalm owl by the Black
Woodpecker (Dryocopus martius) for breeding.

Biodiversity monitoring in the French Alps 45
These cavity providers favour respectively spruce and beech trees to breed. It
implies that the presence of the woodpeckers and their host trees are likely to be
important habitat variables for the two owls.
Figure 1. Study area localisation
The point counts data come from the observation network of the National Forest
Office and the “Ligue de Protection des Oiseaux” (Bird protection organisation), an
NGO which aims to improve knowledge on the local fauna species.
These data are a combination of visual and eared bird contacts in addition to nests
locations. Each contact point is located with a Global Positioning System (GPS).
The reliability of these data is very heterogeneous because each data source has its
own sampling design and its own database system. We therefore harmonize data
before integration into a common database.
It is important to denote that despite the low precision of visual and eared
occurrence data we include them into our database since these are owl‟s activity
centres within their territory. Gathering of all available point counts gives 95 points
for Pygmy owl and 76 for Tengmalm owl.
The resulted dataset is composed of presence points represented as
latitude/longitude coordinates, and then no absence points are considered. This is a
common issue when someone works with wildlife surveys data (Anderson et al.,

46 SAGEO 2010 Toulouse
2003; Chefaoui and Lobo, 2008). Therefore the interest of models like Maxent, as
aforementioned, is the use of presence data only for the computation of the habitat
modelling.
1.2 Modelling algorithm
Maxent was first developed to make predictions or inferences from incomplete
information in many different fields (Phillips et al., 2006). Since recently it has been
widely used as a general approach for presence-only modelling of species
distribution. It estimates the less constrained distribution of training points compare
to random background locations with environmental data layers defining constrains
(Baldwin, 2009). The results show how well the model fits the location data as
compared to a random distribution (Phillips et al., 2006; Phillips et al., 2004).
An increasing number of comparisons with others modelling methods show that
Maxent performs better than much of them (Ortega-Huerta and Peterson, 2008;
Ward, 2007; Yun-sheng et al., 2007). This performance is due to the numerous
advantages of the method. For example, it can be run with very few occurrence data
(Hernandez et al., 2006; Pearson et al., 2007), it manages with different kind of
environmental data, as continuous and discrete datasets, without any transformation
(Ortega-Huerta and Peterson, 2008) and it includes a parameter to avoid over-fitting
(Phillips et al., 2006). The strategy to manage with lack of absence data, based on
random pseudo-absence, performs better than other ways such as those of ENFA
(Hirzel et al., 2002) or BIOCLIM (Busby, 1991) (Wisz and Guisan, 2009). It also
shows percentage variable contributions to the final model and response curves for
each variable, which allows targeting those which can be deleted to improve model
performance and to detect variable correlations (Baldwin, 2009). The output is
continuous that allows a great flexibility in threshold choice and results
representation. Resulting maps can be very easily exported in a GIS database
(Phillips et al., 2006). Outputs are also easy to interpret from an ecological point of
view.
Maxent presents also some drawbacks, the main is linked to the exponential
model for probability which can give very large predicted values for environmental
conditions outside the range present in the study area. The method can have
therefore some difficulties to extrapolate to other study area (Peterson et al., 2007;
Phillips et al., 2006).
1.3 GIS environmental data and model implementation
We used a set of environmental data based on the knowledge of the species
ecology and factors affecting distribution of the species within the entire study area
(Array 1).
These data are represented as raster layers with a 50 m resolution, which is those of
the most restrictive raster included in the analysis. We used ArcGIS 9.3 to prepare
the different data layers.

Biodiversity monitoring in the French Alps 47
Implementation of Maxent requires that rasters were perfectly overlapping and have
exactly the same number of cells. A single raster mask delimiting the study area was
therefore used to assure that all raster layers have the same dimensions.
For the two species, we used 25% randomly selected occurrence data for cross-
validation, leaving the remaining 75 % for analysis, as done by (Ward, 2007).
We implemented the model with freeware Maxent developed by (Phillips et al.,
2005). It is friendly use, as species occurrence training and test files and
environmental data layers are automatically recognize by the application.
We used simultaneously continuous and discrete data. We let almost all default
parameters, but we set the regularization value to 1 for the two species. To evaluate
the relative contribution of each variable to the model we first chose to see the
jackknife test of variable importance. It shows how each variable contributes to the
model by testing variation of model gain with and without including each variable
separately. We also analyzed the response curves which show the response of each
variable to presence probability.
We first include all the environmental variables in the model. We then delete
those which did not show any significant contribution to the model.
Six variables were finally selected for Pygmy owl: elevation, topography, land
cover, mean annual temperature, forest / non-forest map and presence of Norway
Spruce; and five for Tengmalm owl: Land cover, elevation, slope, forest/non-forest
map and European Beech presence. Fifty model replicates were run for each species
and we select the best among the 50. The contribution of each variable can be
visualized through jakknife tests of variable importance and calculation of variables
percentage contributions.
GIS layer Data source Pygmy
owl
Tengmalm
owl
Elevation* French DEM (French
National Geographic
Institute)
× ×
Aspect × ×
Slope° × ×
Topography+ × ×
Forest habitats (Alpine
National Botanic
Conservatory (ANBC))
Natural habitats map
from ANBC × ×
Dendrocopus major presence Data from the Ligue de
Protection des Oiseaux
×
Dryocopus martius presence
×
Land cover* CORINE LAND
COVER 2006 (level 3) × ×
Mean annual temperature+
AURHELY model from
Météo France × ×
Norway Spruce presence+
Database from ANBC ×
European Beech presence°
×
Forest / non forest* Join Research Center
JRC × ×

48 SAGEO 2010 Toulouse
Array 1. Environmental variables used in Maxent modelling, by owl species.
(*significant contribution to the two species’ models; +significant contribution to
Pygmy owl model; °significant contribution to Tengmalm owl model).
Maxent provides three output formats. We select the logistic output as generally
recommended. The result is a continuous value between 0 and 100. Each resulting
raster pixel contains a value reflecting how well the predictive conditions for each
pixel are.
We then export results into ArcGIS 9.3 in order to apply a threshold value to
produce the occurrence map. Applying a threshold is the last step of many species
modelling approaches. It is necessary to transform the probability map in
presence/absence data. Many methods exist to determine the presence threshold.
Objective thresholds seem to be more effective than subjective ones (Liu et al.,
2005). We used 10 percentile training presence (threshold 0.345 for Pygmy owl and
0.259 for Tengmalm owl) as suggested by (Phillips and Dudík, 2008). This
threshold value provides a better ecologically significant result when compared with
more restricted thresholds values. Therefore, the use of only one threshold value
gives a very narrow overview of the species distribution. In addition, for
conservation purpose it is more useful to have a presence gradient which is more
realistic and easier to validate with expert knowledge. Hence, we produce output
maps with four ranges of presence probability: 0-25% as unsuitable habitat, 25-50%
as acceptable habitat, 50-75% as quite suitable and > 75% as suitable habitat.
2. Model evaluation
To evaluate model results, the best method would have been to use an
independent data set. However, for the two owl‟s species, observation data are
spatially aggregated and it would have had no sense to use data located in the same
place than the training data to evaluate the performance of the model.
We test models performance with several other tools.
Maxent calculates the AUC (Area Under the receiver operating Curve) for each
run. It is a standard, threshold-independent method for model evaluation. This
method was initially developed for presence-absence data. In Maxent, absence data
are replaced by random points (Phillips et al., 2006). AUC tests if a prediction is
better than random for any possible presence threshold. It varies between 0.5 when
the result is not better than a random selection and 1 when the result is significantly
better than random.
Another evaluation method lies in the analysis of the two types of prediction
errors provided by all presence/absence models: false negatives (omission error) and
false positives (commission error) (Ward, 2007). Maxent algorithm calculates an
omission rate for training and test data. Omission rate indicates the percentage of
test localities that falls into pixels not predicted as suitable for the species (Phillips et
al., 2006). It should be low for a good model performance. With presence-only

Biodiversity monitoring in the French Alps 49
modelling, is it very difficult to calculate commission errors as no absence date is
available and commission error often increases with omission decreasing
(Hernandez et al., 2006). We therefore use different evaluation tools to overcome
this difficulty.
AUC and omission rate were nevertheless used to select the best model among
fifty replicates for the two species. Models with the lowest training and test omission
rates and with the highest AUC were chosen, as generally done by Maxent users.
We also verify if all training points where predicted with a high probability.
In addition, expert knowledge was included in the validation process. We
compare models results with a mental map drawn by an expert of the two owl
species on the Vercors Mountains. We also gather a group of forest managers with
good naturalist skills to validate the results.
3. Results and discussion
Despite the aggregation patterns of the training data, Maxent modelling method
has successfully predicted owl‟s presence on a large range in the Vercors Mountains
(Figure 2). Results show that the approach has a good capability to capture the
intrinsic species-habitat relationships and to reconstruct the ecological niche even in
sites were any data were available.
Moreover, this method performed very well in predicting potential spatial
distribution of the two owl species. Test omission rates are null at minimum training
presence threshold for training and test datasets (rate = 0.000 for Pygmy owl and
Tengmalm owl) and low at 10 percentile training presence threshold (Tengmalm
owl: 0.093 for training data and 0.000 for test data and Pygmy owl: 0.095 for
training data and 0.000 for test data).
For the two species, models show an AUC value very close to 1 for test data ( 0.992
for Tengmalm owl and 0.996 for Pygmy owl), which generally proves good model
performance. However, when species have a narrow range (or training data are
spatially aggregated), AUC is often overestimated (Phillips and Dudík, 2008), which
is certainly the case here. The high AUC values are therefore not sufficient to
evaluate model performance in this study.
Mean training data predictive rate is 0.65 (SD = 0.21) for Pygmy owl and 0.63 (SD
= 0.20) for Tengmalm owl. The model predictive capacity seems to be good then
based on the well predicted calibration points. In addition, for the two species, the
resulting presence/absence maps overlap very well with the expert mental map and
are in accordance with manager‟s knowledge.

50 SAGEO 2010 Toulouse
a)
b)
Figure 2 . Results of Maxent model on Vercors Mountains a) Tengmalm owl and b)
Pygmy owl, with four ranges of presence probability.

Biodiversity monitoring in the French Alps 51
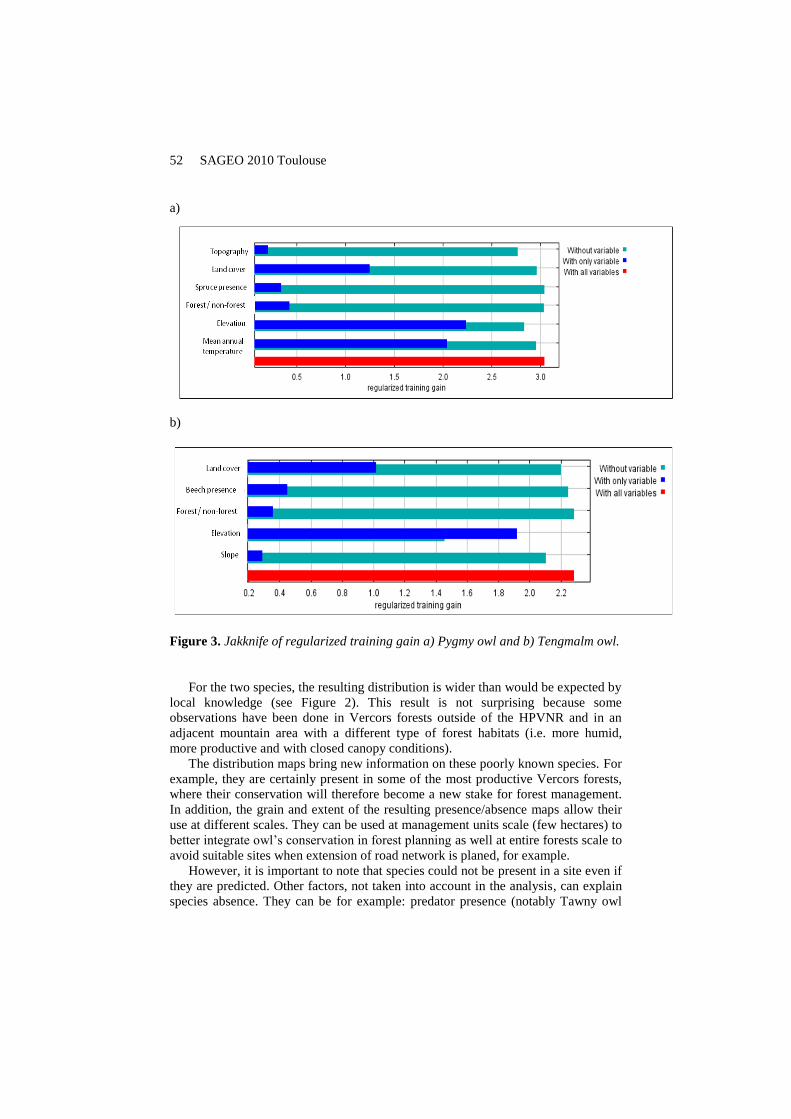
For Pygmy owl, the environmental variable with highest gain when used in
isolation is elevation (Figure 3a), which therefore seems to contain the most useful
information by itself. It is supported by local expert knowledge and literature where
this species is linked with a quite narrow altitudinal range (between 1100 and 2200
meters). Mean annual temperature brings also high gain to the model. These two
variables could be considered as very correlated, as temperature generally decreases
with elevation, but omission of one of the two variables decreases model
performance. This is not the case for Tengmalm owl, where removal of mean annual
temperature increases elevation gain as it captures the gain deleted by removal of
temperature.
The environmental variable that contains the most information that is not present in
the other variable is topography (called “altitopo”), because it decreases the gain the
most when is omitted (Figure 3a). As for mean annual temperature, this variable
seems to be quite correlated with elevation, but removal of one of them decreases
also model performance.
The environmental variable with highest gain for Tengmalm owl is elevation
which is also the variable that decreases the most the gain when it is omitted (Figure
3b). Elevation brings therefore the most useful information by itself and contains the
most information that is not represented by the other variables.
The linkage of the two owl‟s species with elevation can be due to the fact that they
are dependent of particular tree species to breed, these trees themselves growing in
limited altitudinal ranges. They also need quite cold conditions, that are often linked
with high elevation or soil depressions, which are frequent in limestone soils as
present in the Vercors Mountains.
52 SAGEO 2010 Toulouse
a)
b)
Figure 3. Jakknife of regularized training gain a) Pygmy owl and b) Tengmalm owl.
For the two species, the resulting distribution is wider than would be expected by
local knowledge (see Figure 2). This result is not surprising because some
observations have been done in Vercors forests outside of the HPVNR and in an
adjacent mountain area with a different type of forest habitats (i.e. more humid,
more productive and with closed canopy conditions).
The distribution maps bring new information on these poorly known species. For
example, they are certainly present in some of the most productive Vercors forests,
where their conservation will therefore become a new stake for forest management.
In addition, the grain and extent of the resulting presence/absence maps allow their
use at different scales. They can be used at management units scale (few hectares) to
better integrate owl‟s conservation in forest planning as well at entire forests scale to
avoid suitable sites when extension of road network is planed, for example.
However, it is important to note that species could not be present in a site even if
they are predicted. Other factors, not taken into account in the analysis, can explain
species absence. They can be for example: predator presence (notably Tawny owl
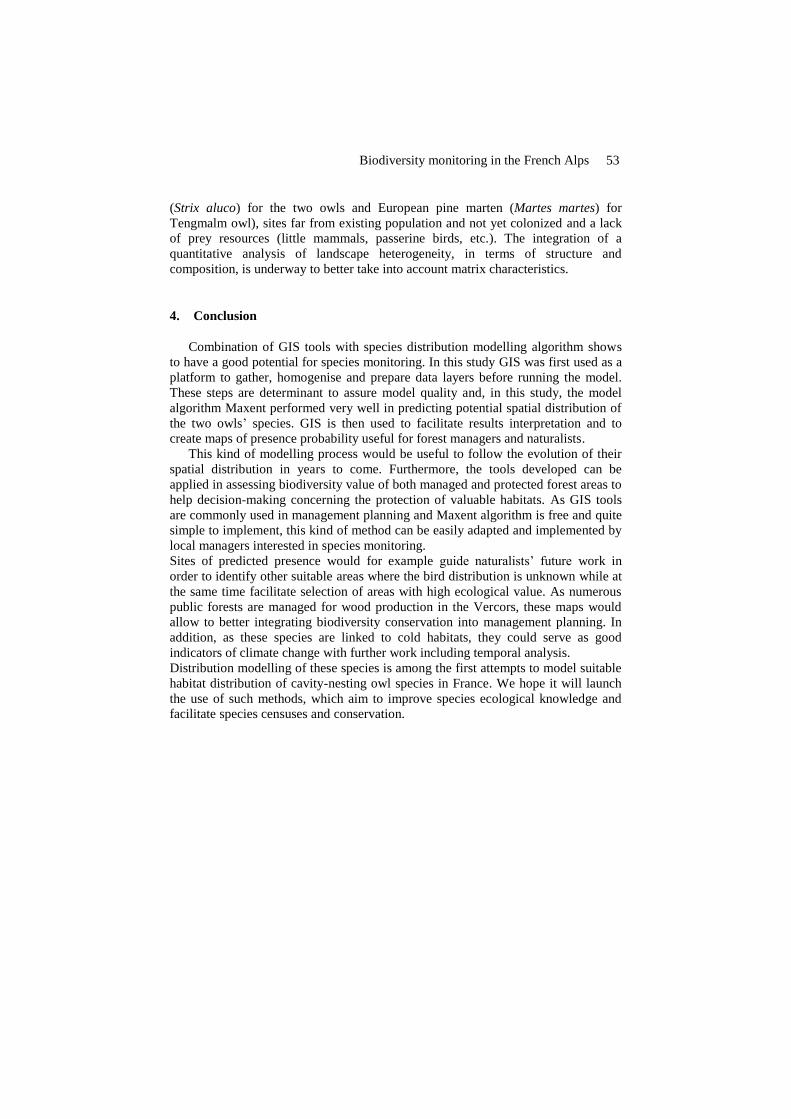
Biodiversity monitoring in the French Alps 53
(Strix aluco) for the two owls and European pine marten (Martes martes) for
Tengmalm owl), sites far from existing population and not yet colonized and a lack
of prey resources (little mammals, passerine birds, etc.). The integration of a
quantitative analysis of landscape heterogeneity, in terms of structure and
composition, is underway to better take into account matrix characteristics.
4. Conclusion
Combination of GIS tools with species distribution modelling algorithm shows
to have a good potential for species monitoring. In this study GIS was first used as a
platform to gather, homogenise and prepare data layers before running the model.
These steps are determinant to assure model quality and, in this study, the model
algorithm Maxent performed very well in predicting potential spatial distribution of
the two owls‟ species. GIS is then used to facilitate results interpretation and to
create maps of presence probability useful for forest managers and naturalists.
This kind of modelling process would be useful to follow the evolution of their
spatial distribution in years to come. Furthermore, the tools developed can be
applied in assessing biodiversity value of both managed and protected forest areas to
help decision-making concerning the protection of valuable habitats. As GIS tools
are commonly used in management planning and Maxent algorithm is free and quite
simple to implement, this kind of method can be easily adapted and implemented by
local managers interested in species monitoring.
Sites of predicted presence would for example guide naturalists‟ future work in
order to identify other suitable areas where the bird distribution is unknown while at
the same time facilitate selection of areas with high ecological value. As numerous
public forests are managed for wood production in the Vercors, these maps would
allow to better integrating biodiversity conservation into management planning. In
addition, as these species are linked to cold habitats, they could serve as good
indicators of climate change with further work including temporal analysis.
Distribution modelling of these species is among the first attempts to model suitable
habitat distribution of cavity-nesting owl species in France. We hope it will launch
the use of such methods, which aim to improve species ecological knowledge and
facilitate species censuses and conservation.

54 SAGEO 2010 Toulouse
References
ANDERSON, R.P., LEW, D. AND PETERSON, A.T., 2003. Evaluating predictive models of species'
distributions: criteria for selecting optimal models. Ecological Modelling, 162(3): 211-232.
ANONYME, 2007. La Chevêchette d'Europe, Association Le Petit Entremont, Saint-Pierre
d'Entremont
BALDWIN, R.A., 2009. Use of Maximum Entropy Modeling in Wildlife Research. Entropy, 11:
854-866.
BUSBY, J.R., 1991. BIOCLIM: A bioclimate analysis and prediction system. In: C.R. Margules,
Austin, M. P. C. (Editor), Nature Conservation: Cost effective Biological surveys and data
analysis. CSIRO, Australia, pp. 64-68.
CHEFAOUI, R.M. AND LOBO, J.M., 2008. Assessing the effects of pseudo-absences on predictive
distribution model performance. Ecological Modelling, 210: 478-486.
COWLEY, M.J.R, WILSON, R.J., LEON-CORTÉS, J.L., GUTIÉRREZ, J.L., BULMAN, C.R. AND THOMAS,
C.D., 2000. Habitat-based statistical models for predicting the spatial distribution of
butterflies and day-flying moths in a fragmented landscape. Journal of Applied Ecology, 37:
60-72.
ELITH, J. et al., 2006. Novel methods improve prediction of species‟ distributions from occurrence
data. Ecography, 29: 129-151.
GIBSON, L.A., WILSON, B.A., CAHILL, D.M. AND HILL, J., 2004. Spatial prediction of rufous
bristlebird habitat in a coastal heathland: a GIS-based approach. Journal of Applied Ecology,
41: 213-223.
GUISAN, A. AND ZIMMERMANN, N.E., 2000. Predictive habitat distribution models in ecology.
Ecological Modelling, 135(2-3): 147-186.
HAKKARAINEN, H., KORPIMÄKI, E., LAAKSONEN, T., NIKULA, A. and SUORSA, P., 2008. Survival
of male Tengmalm‟s owls increases with cover of old forest in their territory. Oecologia, 155:
479-486.
HERNANDEZ, P.A., GRAHAM, C.H., MASTER, L.L. AND ALBERT, D.L., 2006. The effect of sample
size and species characteristics on performance of different species distribution modeling
methods. Ecography, 29: 773-785.
HIRZEL, A.H., HAUSSER, J., CHESSEL, D. AND PERRIN, N., 2002. Ecological-niche Factor Analysis :
How to compute habitat-suitability maps without absence data ? Ecology, 83(7): 2027-2036.
HIRZEL, A.H. AND LE LAY, G., 2008. Habitat suitability modelling and niche theory. Journal of
Applied Ecology, 45: 1372-1381.
LINDENMAYER, D.B., MARGULES, C.R. AND BOTKIN, D.B., 2000. Indicators of Biodiversity for
Ecologically Sustainable Forest Management. Conservation Biology, 14(4): 941-950.
LIU, C., BERRY, P.M., DAWSON, T.P. AND PEARSON, R.G., 2005. Selecting thresholds of
occurrence in the prediction of species distributions. Ecography, 28: 385-393.

Biodiversity monitoring in the French Alps 55
LOOSE, D., BRUNEAU, G. and ADESTRO, J., 2003. La Chevêchette d'Europe (Glaucidium
passerinum) sur la Réserve naturelle des Hauts-plateaux du Vercors, Centre Ornithologique
Rhône-Alpes Isère, RN Hauts-plateaux Vercors, Grenoble.
LPO, 2008. Cahier technique Chevêchette et Tengmalm, Mission Rapace.
ORTEGA-HUERTA, M.A. AND PETERSON, A.T., 2008. Modeling ecological niches and predicting
geographic distributions: a test of six presence-only methods. Revista Mexicana de
Biodiversidad, 79: 205-216.
PEARCE, J. AND FERRIER, S., 2000. An evaluation of alternative algorithms for fitting species
distribution models using logistic regression. Ecological Modelling, 128(2-3): 127-147.
PEARSON, R.G., RAXWORTHY, C.J., NAKAMURA, M. AND PETERSON, A.T., 2007. Predicting species
distributions from small numbers of occurrence records : a test case using cryptic geckos in
Madagascar. Journal of Biogeography, 34: 102-117.
PETERSON, A.T., PAPES, M. AND EATON, M., 2007. Transferability and model evaluation in
ecological niche modeling: a comparison of GARP and Maxent. Ecography, 30: 550-560.
PHILLIPS, S.J., ANDERSON, R.P. AND SCHAPIRE, R.E., 2006. Maximum entropy modeling of species
geographic distributions. Ecological Modelling, 190: 231-259.
PHILLIPS, S.J., DUDÍK, M. AND SCHAPIRE, R.E., 2004. A Maximum Entropy Approach to Species
Distribution Modeling, Proceedings of the 21st International Conference on Machine
Learning, Banff, Canada.
PHILLIPS, S.J. AND DUDÍK, M., 2008. Modeling of species distributions with Maxent: new
extensions and a comprehensive evaluation. Ecography, 31: 161-175.
STOCKWELL, D.R.B. AND PETERSON, A.T., 2002. Effects of sample size on accuracy of species
distribution models. Ecological Modelling, 148(1): 1-13.
WARD, D.F., 2007. Modelling the potential geographic distribution of invasive ant species in New
Zealand. Biological Invasions, 9: 723-735.
WISZ, M.S. AND GUISAN, A., 2009. Do pseudo-absence selection strategies influence species
distribution models and their predictions? An information-theoretic approach based on
simulated data. BMC Ecology, 9(8): 1-13.
YUN-SHENG, W., BING-YAN, X., FANG-HAO, W., QI-MING, X. AND LIANG-YING, D., 2007. The
Potential Geographic Distribution of Radopholus similis in China. Agricultural Sciences in
China, 6(12): 1444-1449.