preprocessing and time-frequency analysis of ... - … · preprocessing and time-frequency analysis...
TRANSCRIPT
Preprocessing andTime-Frequency Analysis ofNewborn EEG SeizuresAdaptive Algorithms for Removing Artifacts Provide aClearer Signal for Improved Analysis
Neurological disease or dysfunction innewborn infants is often first mani-
fested by seizures. Prolonged seizurescan result in impaired neurodevelopmentor even death [1]. In adults, the clinicalsigns of seizures are well defined andeasily recognized. In newborns, how-ever, the clinical signs are subtle and maybe absent or easily missed without con-stant close observation.
This article describes the use ofadaptive signal processing techniquesfor removing artifacts from newbornelectroencephalogram (EEG) signals.Three adaptive algorithms have been de-signed in the context of EEG signals. Thispreprocessing is necessary before at-tempting a fine time-frequency analysisof EEG rhythmical activities, such aselectrical seizures, corrupted by high am-plitude signals.
After an overview of newborn EEGsignals, we describe the data acquisitionset-up. We then introduce the basic physi-ological concepts related to normal andabnormal newborn EEGs and discuss thethree adaptive algorithms for artifact re-moval. We also present time-frequencyrepresentations (TFRs) of seizure signalsand discuss the estimation and modelingof the instantaneous frequency related tothe main ridge of the TFR.
The Newborn EEG SignalThe EEG has proven superior to clini-
cal examination in newborns for the earlydetection and prognosis of brain dysfunc-tion [2]. It is an important measure ofquality of the brain function in critically illneonates. More than at any other age, theEEG of the newborn was shown to corre-late with long-term neurodevelopmentoutcome, and automatic detection of pre-
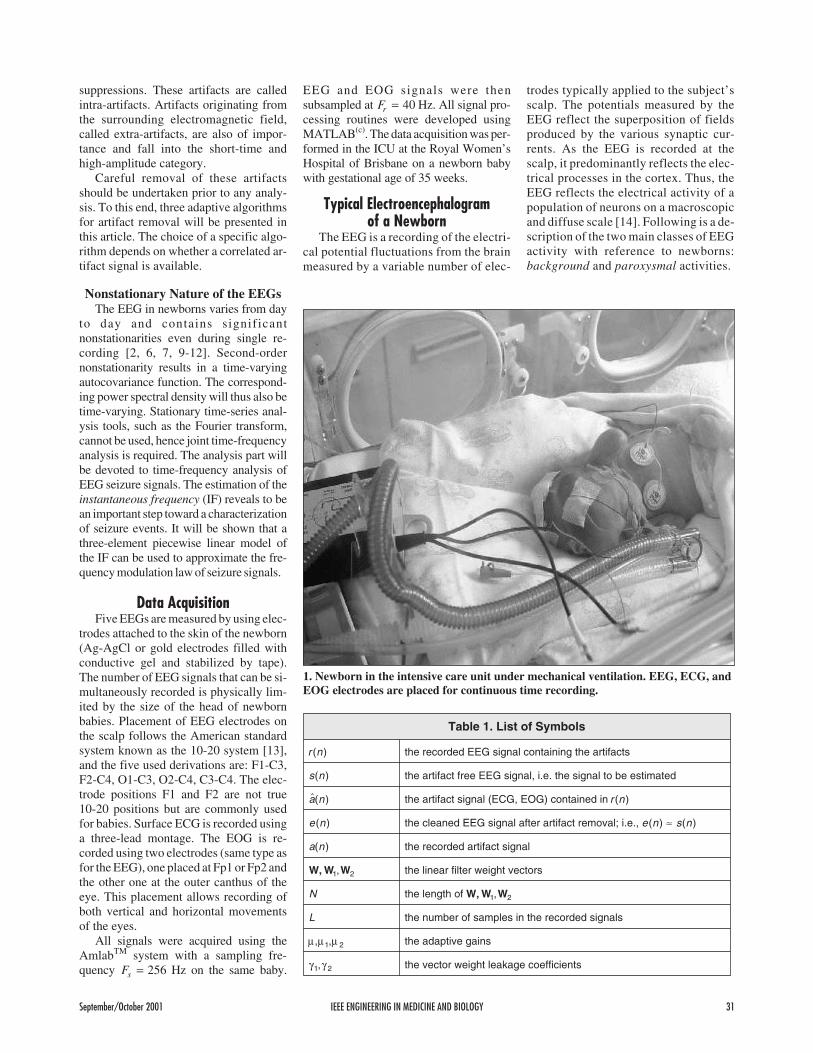
scribed patterns in the EEG have been in-vestigated [3-7]. Beyond the automaticdetection is the analysis of EEG seizuresin newborns for prognosis. Such analysisis routinely done by a neurologist by vi-sual inspection. A set-up for recordingEEGs from newborns in the intensive careunit (ICU) is shown in Fig. 1.
Artifacts in the EEGsThe EEG alone is insufficient for a
neurologist to make a firm diagnosis onthe presence or absence of seizures innewborns. It also requires the examina-tion of the ECG (electrocardiogram) andthe EOG (electro-oculogram) signals, andpossibly the EMG (electromyogram),along with patient observation records.This is because interference of the ECG,EOG, and EMG signals with the EEGhave a masking effect on seizure patterns.Electrodes used to measure EEG signalsare sensitive to the heart electrical activ-ity, which is present throughout the bodyand is often displayed as an artifact com-ponent in EEG signals [8]. The EOG sig-nal monitors eye movements that occureither with the opening and closing of theeyes, or with movements of the eyeballthat occur in rapid eye movement (REM)sleep. Eye movements also produce elec-trical activity on the scalp due to musclefiring and also interfere with the EEG. Onone hand, this interference in EEG signalscan mask relevant features in the EEG andmust be removed [8]. On the other hand,the EOG signal is also expected to con-tribute to a measure of physiological re-sponses to seizures (ocular fixation,REM, etc.) and be used to determine thestate of the baby. Other sources of con-tamination are short-time and high-ampli-tude EEG activities such as burst
30 IEEE ENGINEERING IN MEDICINE AND BIOLOGY September/October 2001
©19
89-9
7T
EC
HP
OO
LS
TU
DIO
S,I
NC
.
Patrick Celka1, Boualem Boashash1,Paul Colditz2
1Signal Processing Research Centre,Queensland University of Technology
2Perinatal Research Centre,University of Queensland, Royal Women’s Hospital
0739-5175/01/$10.00©2001IEEE
suppressions. These artifacts are calledintra-artifacts. Artifacts originating fromthe surrounding electromagnetic field,called extra-artifacts, are also of impor-tance and fall into the short-time andhigh-amplitude category.
Careful removal of these artifactsshould be undertaken prior to any analy-sis. To this end, three adaptive algorithmsfor artifact removal will be presented inthis article. The choice of a specific algo-rithm depends on whether a correlated ar-tifact signal is available.
Nonstationary Nature of the EEGsThe EEG in newborns varies from day
to day and contains significantnonstationarities even during single re-cording [2, 6, 7, 9-12]. Second-ordernonstationarity results in a time-varyingautocovariance function. The correspond-ing power spectral density will thus also betime-varying. Stationary time-series anal-ysis tools, such as the Fourier transform,cannot be used, hence joint time-frequencyanalysis is required. The analysis part willbe devoted to time-frequency analysis ofEEG seizure signals. The estimation of theinstantaneous frequency (IF) reveals to bean important step toward a characterizationof seizure events. It will be shown that athree-element piecewise linear model ofthe IF can be used to approximate the fre-quency modulation law of seizure signals.
Data AcquisitionFive EEGs are measured by using elec-
trodes attached to the skin of the newborn(Ag-AgCl or gold electrodes filled withconductive gel and stabilized by tape).The number of EEG signals that can be si-multaneously recorded is physically lim-ited by the size of the head of newbornbabies. Placement of EEG electrodes onthe scalp follows the American standardsystem known as the 10-20 system [13],and the five used derivations are: F1-C3,F2-C4, O1-C3, O2-C4, C3-C4. The elec-trode positions F1 and F2 are not true10-20 positions but are commonly usedfor babies. Surface ECG is recorded usinga three-lead montage. The EOG is re-corded using two electrodes (same type asfor the EEG), one placed at Fp1 or Fp2 andthe other one at the outer canthus of theeye. This placement allows recording ofboth vertical and horizontal movementsof the eyes.
All signals were acquired using theAmlabTM system with a sampling fre-quency Fs = 256 Hz on the same baby.
EEG and EOG signals were thensubsampled at Fr = 40 Hz. All signal pro-cessing routines were developed usingMATLAB(c). The data acquisition was per-formed in the ICU at the Royal Women’sHospital of Brisbane on a newborn babywith gestational age of 35 weeks.
Typical Electroencephalogramof a Newborn
The EEG is a recording of the electri-cal potential fluctuations from the brainmeasured by a variable number of elec-
trodes typically applied to the subject’sscalp. The potentials measured by theEEG reflect the superposition of fieldsproduced by the various synaptic cur-rents. As the EEG is recorded at thescalp, it predominantly reflects the elec-trical processes in the cortex. Thus, theEEG reflects the electrical activity of apopulation of neurons on a macroscopicand diffuse scale [14]. Following is a de-scription of the two main classes of EEGactivity with reference to newborns:background and paroxysmal activities.
September/October 2001 IEEE ENGINEERING IN MEDICINE AND BIOLOGY 31
1. Newborn in the intensive care unit under mechanical ventilation. EEG, ECG, andEOG electrodes are placed for continuous time recording.
Table 1. List of Symbols
r n( ) the recorded EEG signal containing the artifacts
s n( ) the artifact free EEG signal, i.e. the signal to be estimated
$( )a n the artifact signal (ECG, EOG) contained in r n( )
e n( ) the cleaned EEG signal after artifact removal; i.e., e n s n( ) ( )≈
a n( ) the recorded artifact signal
W, W W1 2, the linear filter weight vectors
N the length of W, W W1 2,
L the number of samples in the recorded signals
µ µ µ, ,1 2 the adaptive gains
γ γ1 2, the vector weight leakage coefficients
The BackgroundActivity in Newborns
The rhythms of the EEG are classifiedinto five main groups depending on thepredominant frequency contents. Delta
(δ) rhythm (<4 Hz), theta (θ) rhythm (4-8Hz), alpha (α) rhythm (8-13 Hz), beta (β)rhythm (13-30 Hz), and Gamma (γ) activ-ity (> 30 Hz). All these waves composethe normal background activity and ap-
pear at no precise time location or fre-quency [15].
The background consists of continu-ous and discontinuous patterns. A contin-uous background refers to a backgroundwhere there are no distinct changes in fre-quency or amplitude of waves. Discontin-uous patterns, found especially inpremature infants of 22-32 weeks gesta-tional age, refer to distinct changes in am-plitude and frequency, which primarilyoccur during quiet or non-REM sleep innewborns. In the following, we will as-sume that the background activity can bemodeled by a Gaussian stochastic process(while non-Gaussian background activityis usually reported, we use the Gaussianassumption to design our signal process-ing techniques).
Paroxysmal Activity andDefinition of Seizure in Newborns
Abnormal waves in the EEG are pre-dominantly of two types: slow wavessuch as the δ waves in the awake adult,and paroxysmal events [1, 2]. Slowwaves appear when brain cells have beendamaged. Paroxysmal events are suddenelectrical explosions and refer to patternsof electrical activity occurring with asudden onset and termination. Adult par-oxysmal patterns show higher ampli-tudes than the background, which is notalways the case in newborns.
In this work, paroxysmal waves are ofprimary concern and are often related toepileptic seizure, in which case they arereferred to as ictal. The situation for new-borns is much more complicated than foradults and children, and no definite classi-fication has been established yet. Abnor-mal discharge patterns are generallycharacterized by a rhythmic activitysomewhere appearing in conjunction withseizures [16,17]. EEG seizures may occurwithout behavioral signs and vice versa,and they may exhibit differences in pat-terns at different times during one clinicalevent or from one to the next. Based on theabove discussion, and for the purpose ofthis study, we consider that a seizure in anewborn is an ictal discharge pattern that:
� is either very focal or multifocal;
� manifests rhythmical sharp burst-like activity;
� may vary in frequency, amplitude,morphology, and duration; and
� has a duration of at least 10 s (cases ofbrief ictal rhythmic discharges arealso well documented [2]).
32 IEEE ENGINEERING IN MEDICINE AND BIOLOGY September/October 2001
r = EEG Artifacts = s a+ + ∧
Θ ∋
s = EEG∧
Θ ∋
a = Artifacts
−
+ e = EEG
W
µ
(a)
r = EEG
Artifacts+
µ γ1 1,e1 +
−
W1
z−1
W2
µ γ2 2,e2 −
+
−+
(b)
(c)
µ γ1 1,e1 +
−
W1z−1
r = EEG
Artifacts+
MorphologicalFilter
Artifacts
X
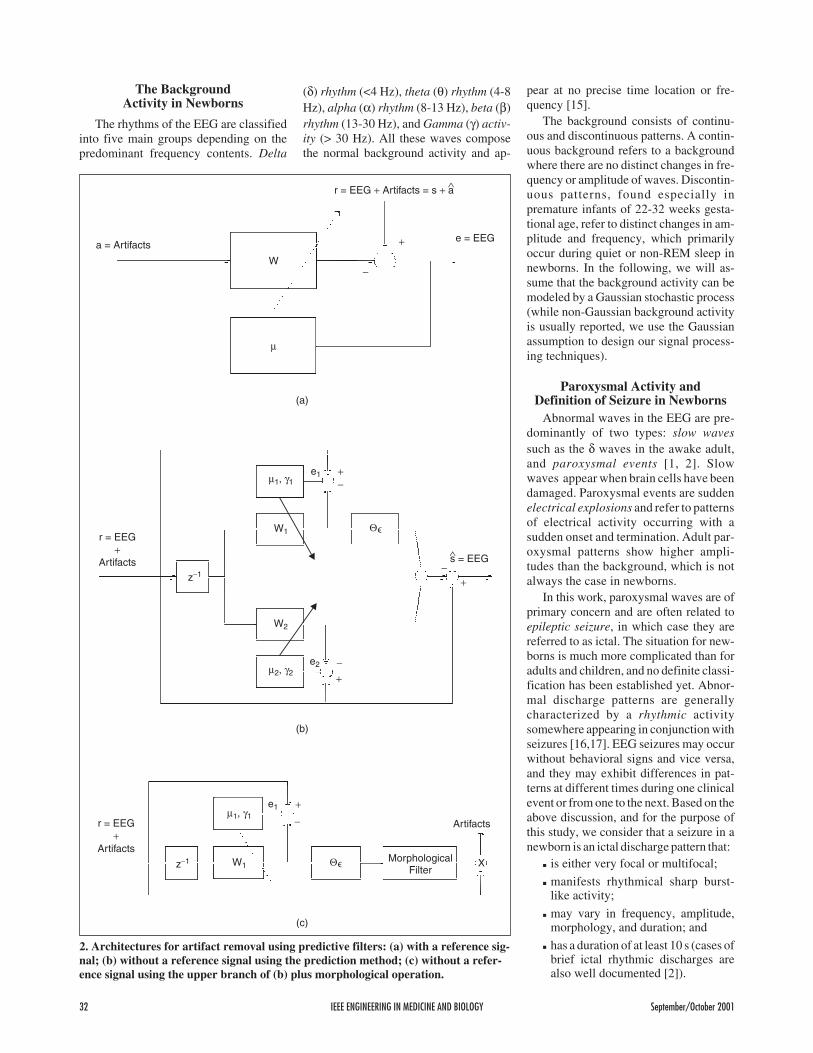
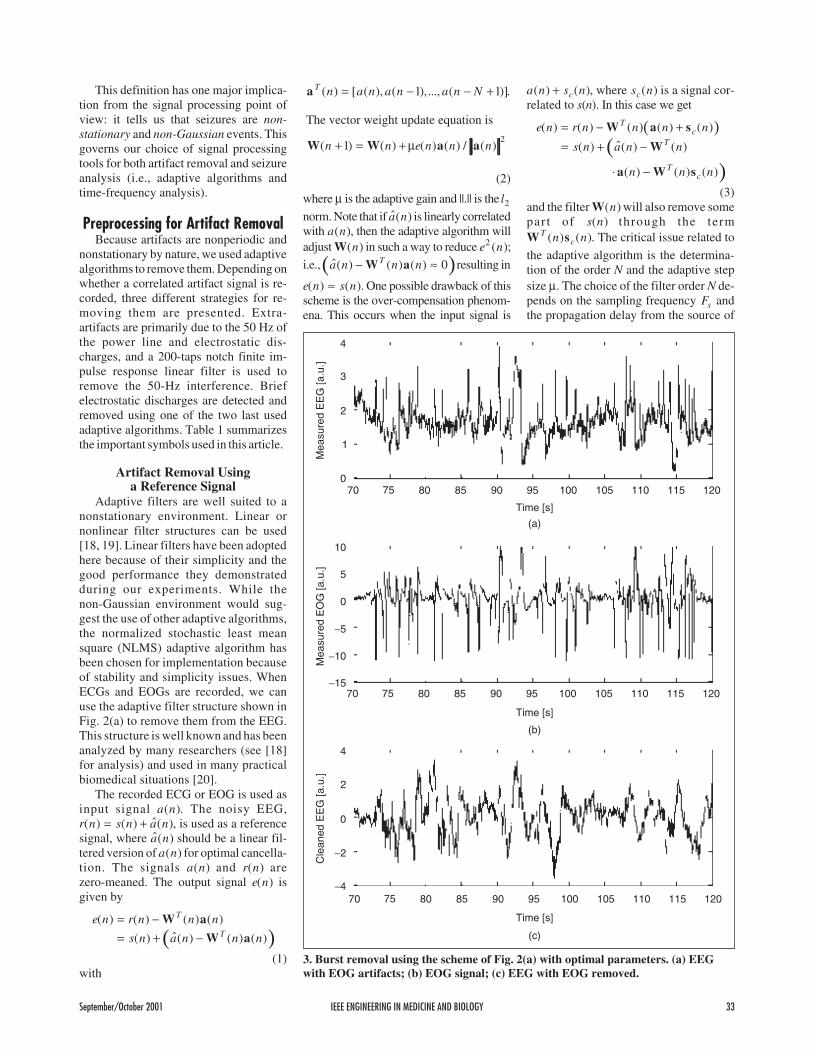
2. Architectures for artifact removal using predictive filters: (a) with a reference sig-nal; (b) without a reference signal using the prediction method; (c) without a refer-ence signal using the upper branch of (b) plus morphological operation.
This definition has one major implica-tion from the signal processing point ofview: it tells us that seizures are non-stationary and non-Gaussian events. Thisgoverns our choice of signal processingtools for both artifact removal and seizureanalysis (i.e., adaptive algorithms andtime-frequency analysis).
Preprocessing for Artifact RemovalBecause artifacts are nonperiodic and
nonstationary by nature, we used adaptivealgorithms to remove them. Depending onwhether a correlated artifact signal is re-corded, three different strategies for re-moving them are presented. Extra-artifacts are primarily due to the 50 Hz ofthe power line and electrostatic dis-charges, and a 200-taps notch finite im-pulse response linear filter is used toremove the 50-Hz interference. Briefelectrostatic discharges are detected andremoved using one of the two last usedadaptive algorithms. Table 1 summarizesthe important symbols used in this article.
Artifact Removal Usinga Reference Signal
Adaptive filters are well suited to anonstationary environment. Linear ornonlinear filter structures can be used[18, 19]. Linear filters have been adoptedhere because of their simplicity and thegood performance they demonstratedduring our experiments. While thenon-Gaussian environment would sug-gest the use of other adaptive algorithms,the normalized stochastic least meansquare (NLMS) adaptive algorithm hasbeen chosen for implementation becauseof stability and simplicity issues. WhenECGs and EOGs are recorded, we canuse the adaptive filter structure shown inFig. 2(a) to remove them from the EEG.This structure is well known and has beenanalyzed by many researchers (see [18]for analysis) and used in many practicalbiomedical situations [20].
The recorded ECG or EOG is used asinput signal a n( ). The noisy EEG,r n s n a n( ) ( ) $( )= + , is used as a referencesignal, where $( )a n should be a linear fil-tered version of a n( ) for optimal cancella-tion. The signals a n( ) and r n( ) arezero-meaned. The output signal e n( ) isgiven by
( )e n r n n n
s n a n n n
T
T
( ) ( ) ( ) ( )
( ) $( ) ( ) ( )
= −= + −
W a
W a
(1)with
a T n a n a n a n N( ) [ ( ), ( ),..., ( )]= − − +1 1 .
The vector weight update equation is
W W a a( ) ( ) ( ) ( ) / ( )n n e n n n+ = +12µ
(2)
where µ is the adaptive gain and ||.|| is the l2
norm. Note that if $( )a n is linearly correlatedwith a n( ), then the adaptive algorithm willadjust W( )n in such a way to reduce e n2 ( );
i.e.,( )$( ) ( ) ( )a n n nT− ≈W a 0 resulting in
e n s n( ) ( )≈ . One possible drawback of thisscheme is the over-compensation phenom-ena. This occurs when the input signal is
a n s nc( ) ( )+ , where s nc( ) is a signal cor-related to s(n). In this case we get
( )(
e n r n n n n
s n a n n
n
Tc
T
T
( ) ( ) ( ) ( ) ( )
( ) $( ) ( )
( )
= − += + −
⋅ −
W a s
W
a W )( ) ( )n ncs
(3)and the filter W( )n will also remove somepart of s n( ) through the termW sT
cn n( ) ( ). The critical issue related to
the adaptive algorithm is the determina-tion of the order N and the adaptive stepsize µ. The choice of the filter order N de-pends on the sampling frequency Fs andthe propagation delay from the source of
September/October 2001 IEEE ENGINEERING IN MEDICINE AND BIOLOGY 33
Mea
sure
d E
EG
[a.u
.]M
easu
red
EO
G [a
.u.]
Cle
aned
EE
G [a
.u.]
4
3
2
1
80
80
80
90
90
90
75
75
75
70
70
70
095
95
95
100
100
100
105
105
105
110
110
110
115
115
115
120
120
120
85
85
85
Time [s]
Time [s]
Time [s]
10
5
0
−5
−10
−15
4
2
0
−2
−4
(a)
(b)
(c)
3. Burst removal using the scheme of Fig. 2(a) with optimal parameters. (a) EEGwith EOG artifacts; (b) EOG signal; (c) EEG with EOG removed.
the artifact to the EEG recording elec-trode. In newborns, the electrodes that re-cord EOGs are very close to those ofEEGs and the propagation delay is almostnegligible. For ECGs, the propagation de-lay could be more important. Since EEGtime series are nonstationary, the selec-tion of a proper value for N is quite com-plicated. This well-known model-orderselection problem has found satisfactorysolutions for stationary time series[21-23] but is yet to be solved for non-stationary ones. We have proposed an op-timization procedure [24] and found thefollowing optimal parameters: N * = 55 andan adaptive gain ofµ* .= 0 0133. These op-
timal values are quite independent to theEEG, while fine tuning can always improvethe final results.
Figure 3 shows an example of artifactremoval using the adaptive filter of Fig.2(a) and the optimal parameters N * andµ*. Figure 3(a) shows the signal r n( ), Fig.
3(b) shows the signal a n( ), and Fig. 3(c)shows the cleaned EEG signal e n( ) wherethe spiky EOG activity has been removed.
Artifact Removal Without aReference Signal: First Approach
When the ECG and EOG are not re-corded, we can use the adaptive filterstructure shown in Fig. 2(b). This struc-ture is based on two parallel fixed-weightleakage normalized stochastic least meanfourth (NLMF) algorithms in a predictormode. A similar approach was used byCampbell [25] while using only the lowerbranch in Fig. 2(b) and a weight leakageLMS algorithm. The reason for using theLMF is that the EEG signals corrupted byhigh-amplitude artifacts are non-Gaussi-an. The LMF algorithm has been provento be efficient in non-Gaussian environ-ment, but its stability analysis is muchmore complicated than those of LMS.The input signal r n s n a n( ) ( ) $( )= + is thezero-meaned noisy EEG. The filterW1 1 1 1
TNn w n w n( ) [ ( ),..., ( )], ,= detects
abrupt patterns with a poor prediction abil-ity, while W2 2 1 2
TNn w n w n( ) [ ( ),..., ( )], ,=
performs a more accurate prediction. Letus define Θε ε( ) | |x x= >1 if andΘε ε( ) | |x x= <0 if . The function Θε ap-plied to W r1 1T n n( ) ( )− , where r T n( )− =1
[ ( ),..., ( )]r n r n N− −1 provides partial lo-cation of the artifact. The productΘε( ( ) ( ))W r1 1T n n − W r2 1T n n( ) ( )− gives
the predicted artifact, and $( ) ( )s n r n= −Θε( ( ) ( )) ( )W r W1 21T Tn n n− r( )n −1 is the
34 IEEE ENGINEERING IN MEDICINE AND BIOLOGY September/October 2001
Mea
sure
d E
EG
[a.u
.]C
lean
ed E
EG
[a.u
.]4
4
2
2
0
0
−2
−2
−4
−4
200
200
250
250
350
350
400
400
300
300
Time [s]
Time [s]
(a)
(b)
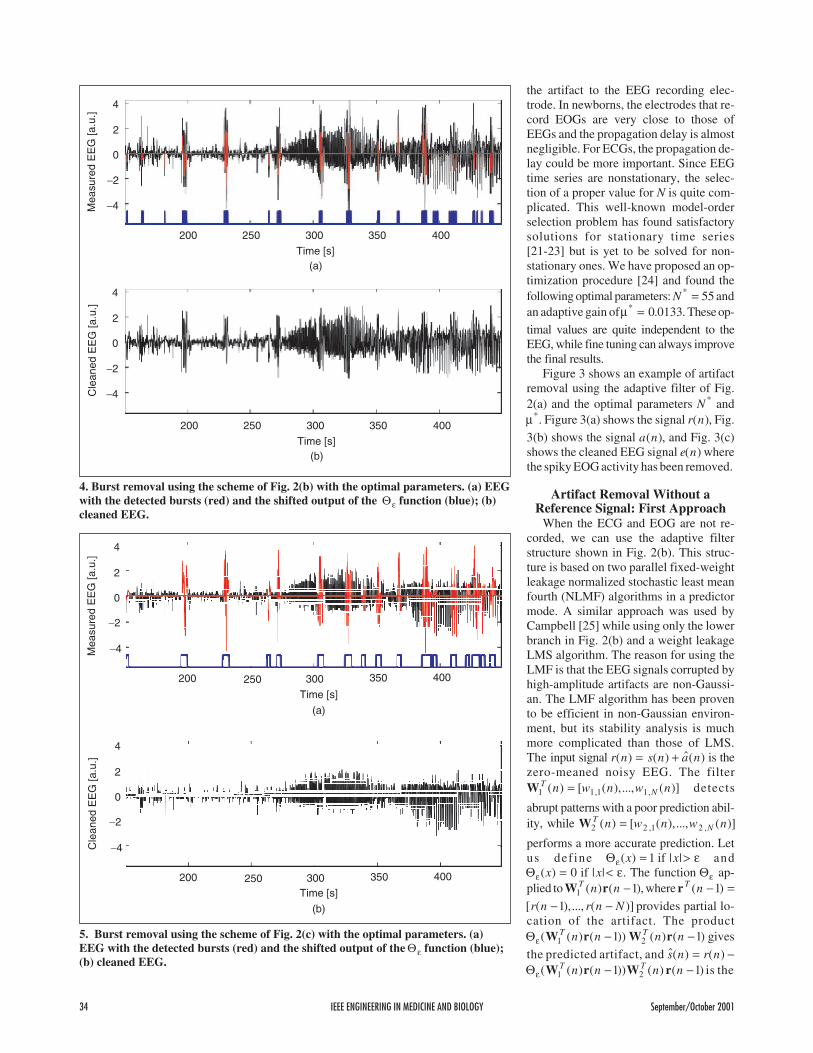
4. Burst removal using the scheme of Fig. 2(b) with the optimal parameters. (a) EEGwith the detected bursts (red) and the shifted output of the Θε function (blue); (b)cleaned EEG.
4
4
2
2
0
0
−2
−2
−4
−4
200
200
250
250
300
300
350
350
400
400
Time [s]
Time [s]
Mea
sure
d E
EG
[a.u
.]C
lean
ed E
EG
[a.u
.]
(a)
(b)
5. Burst removal using the scheme of Fig. 2(c) with the optimal parameters. (a)EEG with the detected bursts (red) and the shifted output of the Θε function (blue);(b) cleaned EEG.
cleaned output signal. The threshold is
estimated by ( )ε 2 2
0
1
10==
−
∑r k Lk
L
( ) / . The
recursive equations for W1 and W2 inFig. 2(b) are
W W
r r
W
1 1 1
1 13 2
2
1 1
1 1
1
( ) ( ) ( )
( ) ( ) / ( )
( )
n n
e n n n
n
+ = −
+ − −
+ =
γ
µ
( ) ( )
( ) ( ) / ( )
( ) ( ) (
1
1 1
2 2
2 23 2
1 1
−
+ − −
= −
γ
µ
W
r r
W
n
e n n n
e n r n nT ) ( )
( ) ( ) ( ) ( ).
r
W r
n
e n r n n nT
−
= − −
1
12 2 (4)
The optimization of the five parameters{ , , , , }µ µ γ γ1 2 1 2 N in the NLMF has alsobeen proposed in [24]. The optimal set ofparameters was found to beµ µ γ γ1 2 1 20 03 0 01 01 0* * * * *. ; . ; . , ;= = = = N
= 80. Figure 4 shows an example of burstremoval, when no reference signal is avail-able, using the scheme of Fig. 2(b) and theoptimal set { , , , , }* * * * *µ µ γ γ1 2 1 2 N . The tran-
sient learning of the adaptive scheme canbe seen as the bursts are still present at thebeginning and progressively disappearwith time. We note that the system of Fig.2(b) can also be used for spikes, sharpwaves, and burst detection. The lower tracein Fig. 4(a) shows the signal at the output ofthe threshold functionΘε( )x (with an addi-tional offset for presentation purposes).This signal is composed of 1s and 0s, withpossible “holes” between the 1, and cannotbe used to separate the EEG signal into thetwo sets {Artifacts ∪ Non-Artifacts}. Thesecond approach will solve this problemwith an extra computation step. Thescheme of Fig. 2(b) does not generate arti-
ficial noise: the cleaned time series is ex-actly the same as the original one except onthe detected artifacts. This property is anadvantage compared to the NLMS ap-proach; nevertheless, the scheme of Fig.2(b) does not predict the signal s(n) whereartifacts have occurred.
Artifact Removal Without a Refer-ence Signal: Second ApproachThe scheme of Fig. 2(b) is very effi-
cient for online artifact removal without areference signal because it does not needmultiple sequential processing of the re-corded data: it keeps running online. Themain drawback of this method is that theremoved artifacts from the recorded EEGare replaced by some residual error thatdoes not fit with what should be the trueEEG signal during this period of time. Toovercome this drawback, we have de-signed the adaptive algorithm shown inFig. 2(c). It uses the upper branch of Fig.2(b) with an additional morphologicalpart. The morphological operation is a di-lation that results in a signal composed ofconnected 1s and 0s. The output of the al-gorithm is a signal composed of the ex-tracted artifacts from the recorded EEG.This results in a segmented EEG signalinto {Artifacts ∪ Non-Artifacts}. Thenext step removes the output of the algo-rithm, namely the set {Artifacts}, from therecorded EEG. We now need to find a set{Predicted EEG} to replace {Artifacts}.The first solution would be to obtain atime-dependent model of the segmentpreceding a given Artifact, to predict thebehavior of the true EEG signal duringthat period. However, this would assumethat the time-varying model can extrapo-
late the true behavior during that period;i.e., the time-varying model is still validduring the Artifact period. Another solu-tion would be to perform a time-varyingindependent component analysis to sepa-rate the true EEG from the Artifact foreach Artifact. This solution assumes a lin-ear mixing of the true EEG and Artifact,which is far from being obvious. As-suming local temporal stationarity of thesignals, we could use a linear or a nonlin-ear predictive model, based on samplesoccurring before and/or after the artifact,to produce a good candidate for {Pre-dicted EEG}. We need a good model ofseizure as well as background activities.This task is not easy, as demonstrated byValdes et al. [26].
In order to avoid these complex model-ing problems, we have chosen to use thefollowing approach. First we estimate the
P-parameter vector $ξ of an autoregressive
September/October 2001 IEEE ENGINEERING IN MEDICINE AND BIOLOGY 35
Fs=10Hz L=855Time-res=9
Fs=10Hz L=801Time-res=8
Tim
e (s
)
Tim
e (s
)
8080
7070
6060
5050
40 40
30 30
20 20
10 10
0.5 0.51 11.5 1.52 22.5 2.53 33.5 3.54 44.5 4.55
Frequency (Hz) Frequency (Hz)
(a) (b)
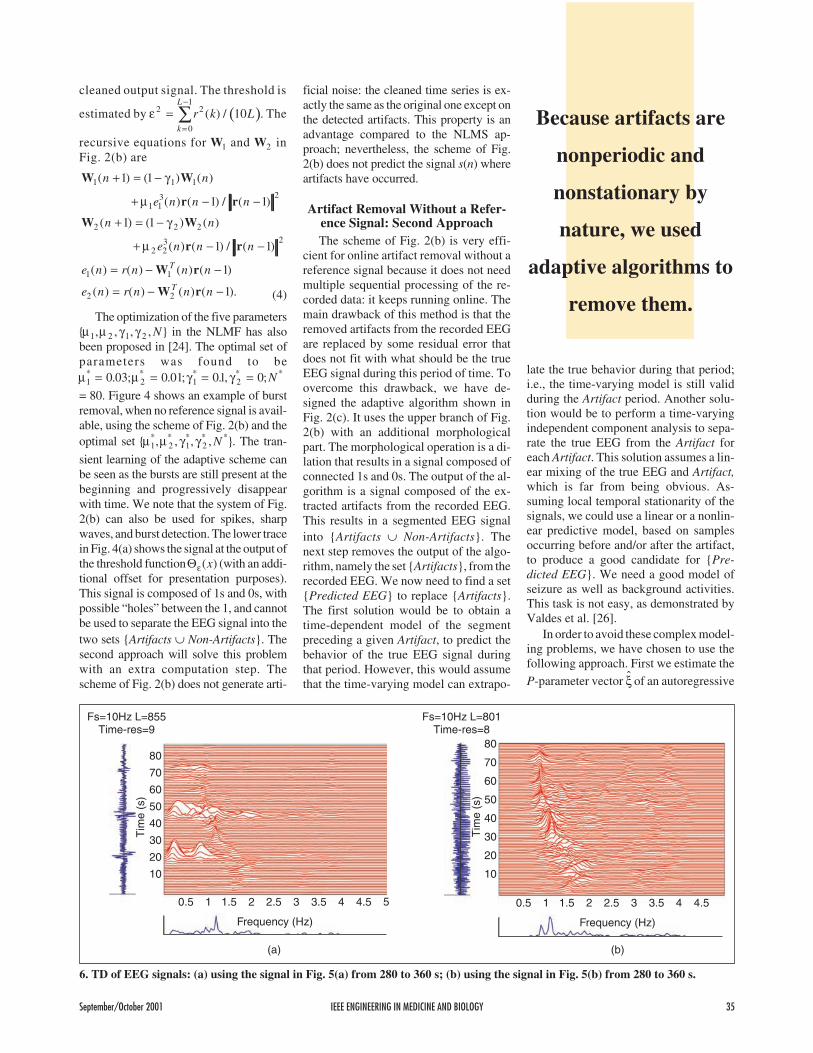
6. TD of EEG signals: (a) using the signal in Fig. 5(a) from 280 to 360 s; (b) using the signal in Fig. 5(b) from 280 to 360 s.
Because artifacts are
nonperiodic and
nonstationary by
nature, we used
adaptive algorithms to
remove them.
model of a signal segment y n( ) precedingthe Artifact signal $( )a n , and we computethe residual error ε y pn y n y n( ) ( ) ( )= −
where y n i y n ipi
P
( ) $( ) ( )+ = −=
−
∑10
1
ξ . Sec-
ond, we estimate the background noise ac-tivity e na ( ) of $( )a n using a principalcomponent analysis and model selectionmethod [21, 23, 27-29]. This assumes thatthe high-amplitude artifacts result from asuperposition of a stochastic low-ampli-tude part from deeper neuronal sourcesand high-amplitude deterministic neuronactivity from less deeper sources. Thirdwe regenerate the {Predicted EEG} using
s n i s n i np pi
P
s( ) $( ) ( ) ( )+ = − + +=
−
∑1 10
1
ξ ε
where ε s n( ) is a scaled version ofε y an e n( ) ( )+ . The result is a signal sp(n),which is our {Predicted EEG} and resem-bles y n( ). As we used the residual errorε s n( ) to generate s np( ), the selection ofthe order P is not of great importance inthis case, and we have fixed it to 4.
Figure 5(a) shows the original EEGsignal together with the output of the mor-phologically filtered output from thethreshold function Θε( )x (with an addi-tional offset for presentation purposes) in-dicating the artifact locations. The sameparameters { , }* *µ γ1 1 as in the previous sec-
tion have been used. Figure 5(b) shows thecleaned EEG with the linear predictivemodel method. Time-frequency analysis ofboth the original and cleaned EEG will re-veal the usefulness of the cleaning method.
Time-FrequencyRepresentation of Seizures
Nonstationary signals can be analyzedusing parametric or nonparametric meth-ods. In particular, TFR methods havebeen proposed for EEG, EMG, and EGGsignals analysis [6, 9-12, 20, 30-32]. Theparametric approach is based on a time-varying linear predictive model of thedata. Autoregressive (AR) and auto-regressive moving average (ARMA) in-puts have been used [10, 20, 30, 31].Nonparametric methods such as reducedinterference quadratic distributions [6, 11,12, 32, 33] and matching-pursuit-basedapproaches [9] have been used. Thechoice of one particular TFR is applica-tion dependent. We have used two differ-ent TFRs: 1) a time-only Kernel-basedquadratic distribution (TD) [34] and 2) atime-varying AR (TVAR) adaptive pre-dictive model [20]. TD is a reduced inter-ference distribution with one freeadjustable parameter β. The choice of βdepends on the signal at hand. For theTVAR, we have used the NLMS withadaptive gain λ and order q [20, 31]. Aparticular choice of λ and q depends onthe signal and also on the features wewant to extract. At each time instant t, wecompute the parametric power spectrumestimate P t fAR( , ) from the AR model pa-rameters [20].
The Usefulness of the PreprocessingThe main purpose of the adaptive pre-
processing of EEG signals is to enhancethe analysis of these signals. Removingartifacts and short-time high-amplitude
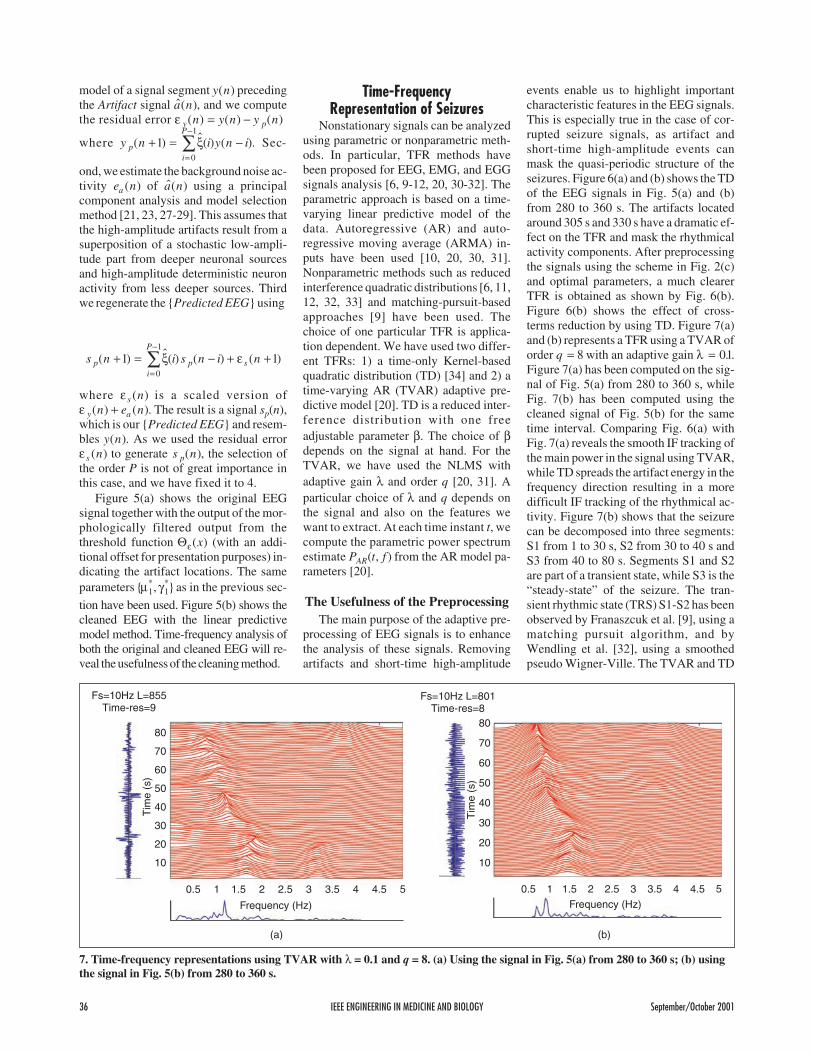
events enable us to highlight importantcharacteristic features in the EEG signals.This is especially true in the case of cor-rupted seizure signals, as artifact andshort-time high-amplitude events canmask the quasi-periodic structure of theseizures. Figure 6(a) and (b) shows the TDof the EEG signals in Fig. 5(a) and (b)from 280 to 360 s. The artifacts locatedaround 305 s and 330 s have a dramatic ef-fect on the TFR and mask the rhythmicalactivity components. After preprocessingthe signals using the scheme in Fig. 2(c)and optimal parameters, a much clearerTFR is obtained as shown by Fig. 6(b).Figure 6(b) shows the effect of cross-terms reduction by using TD. Figure 7(a)and (b) represents a TFR using a TVAR oforder q = 8 with an adaptive gain λ = 01. .Figure 7(a) has been computed on the sig-nal of Fig. 5(a) from 280 to 360 s, whileFig. 7(b) has been computed using thecleaned signal of Fig. 5(b) for the sametime interval. Comparing Fig. 6(a) withFig. 7(a) reveals the smooth IF tracking ofthe main power in the signal using TVAR,while TD spreads the artifact energy in thefrequency direction resulting in a moredifficult IF tracking of the rhythmical ac-tivity. Figure 7(b) shows that the seizurecan be decomposed into three segments:S1 from 1 to 30 s, S2 from 30 to 40 s andS3 from 40 to 80 s. Segments S1 and S2are part of a transient state, while S3 is the“steady-state” of the seizure. The tran-sient rhythmic state (TRS) S1-S2 has beenobserved by Franaszcuk et al. [9], using amatching pursuit algorithm, and byWendling et al. [32], using a smoothedpseudo Wigner-Ville. The TVAR and TD
36 IEEE ENGINEERING IN MEDICINE AND BIOLOGY September/October 2001
Fs=10Hz L=855Time-res=9
Fs=10Hz L=801Time-res=8
Tim
e (s
)
Tim
e (s
)
8080
7070
6060
50 50
40 40
30 30
20 20
10 10
0.5 0.51 11.5 1.52 22.5 2.53 33.5 3.54 44.5 4.55 5
Frequency (Hz) Frequency (Hz)
(a) (b)
7. Time-frequency representations using TVAR with λ = 0.1 and q = 8. (a) Using the signal in Fig. 5(a) from 280 to 360 s; (b) usingthe signal in Fig. 5(b) from 280 to 360 s.
also show an increase and sudden de-crease of the main frequency peak in theTFR. The monotonic decline in the fre-quency content of seizures was reportedin [9-12, 32, 33] and confirmed by S3.Comparing both Franaszcuk et al.’s andWendling et al.’s results with TVAR re-veals that: 1) TVAR provides a clear TFRwith much less algorithmic complexitythan the matching pursuit approach; 2)TVAR allows for an easy IF trackingcompared to TD, while matching pursuitis also an excellent candidate for IF esti-mation; and 3) TVAR and TD need thetuning of two parameters: gain λ and orderq for TVAR, and β and time-windowlength for TD, while the matching pursuitdoes not require such a tuning. Selecting asmall value of q in TVAR results in a se-lection of the principal component in theTFR; i.e., the ridge that contains most ofthe signal power. On the other hand, in-creasing q progressively reveals othercomponents in the time-frequency plane.
Instantaneous FrequencyEstimation and Modeling
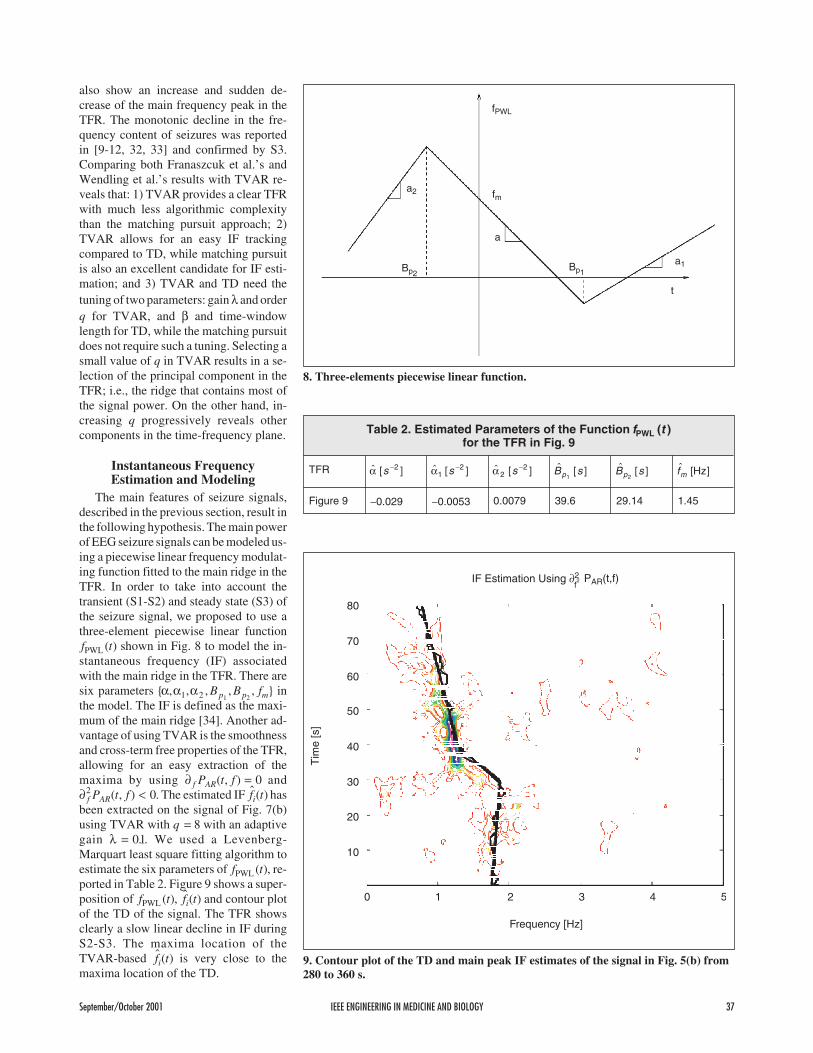
The main features of seizure signals,described in the previous section, result inthe following hypothesis. The main powerof EEG seizure signals can be modeled us-ing a piecewise linear frequency modulat-ing function fitted to the main ridge in theTFR. In order to take into account thetransient (S1-S2) and steady state (S3) ofthe seizure signal, we proposed to use athree-element piecewise linear functionf tPWL ( ) shown in Fig. 8 to model the in-stantaneous frequency (IF) associatedwith the main ridge in the TFR. There aresix parameters { , , , , , }α α α1 2 1 2
B B fp p m inthe model. The IF is defined as the maxi-mum of the main ridge [34]. Another ad-vantage of using TVAR is the smoothnessand cross-term free properties of the TFR,allowing for an easy extraction of themaxima by using ∂ =f ARP t f( , ) 0 and∂ <f ARP t f2 0( , ) . The estimated IF $ ( )f ti hasbeen extracted on the signal of Fig. 7(b)using TVAR with q = 8 with an adaptivegain λ = 01. . We used a Levenberg-Marquart least square fitting algorithm toestimate the six parameters of f tPWL ( ), re-ported in Table 2. Figure 9 shows a super-position of f tPWL ( ), $ ( )f ti and contour plotof the TD of the signal. The TFR showsclearly a slow linear decline in IF duringS2-S3. The maxima location of theTVAR-based $ ( )f ti is very close to themaxima location of the TD.
September/October 2001 IEEE ENGINEERING IN MEDICINE AND BIOLOGY 37
fPWL
a2
Bp2Bp1
a
fm
a1
t
8. Three-elements piecewise linear function.
Tim
e [s
]
80
70
60
50
40
30
20
10
0 1 2 3 4 5
Frequency [Hz]
IF Estimation Using ∂2 P (t,f)AR2f
9. Contour plot of the TD and main peak IF estimates of the signal in Fig. 5(b) from280 to 360 s.
Table 2. Estimated Parameters of the Function f tPWL ( )for the TFR in Fig. 9
TFR $ [ ]α s −2 $ [ ]α12s − $ [ ]α 2
2s − $ [ ]B sp1
$ [ ]B sp2
$ [ ]fm Hz
Figure 9 −0.029 −0.0053 0.0079 39.6 29.14 1.45
Two Characteristic Features ofSeizure Signals Extracted from
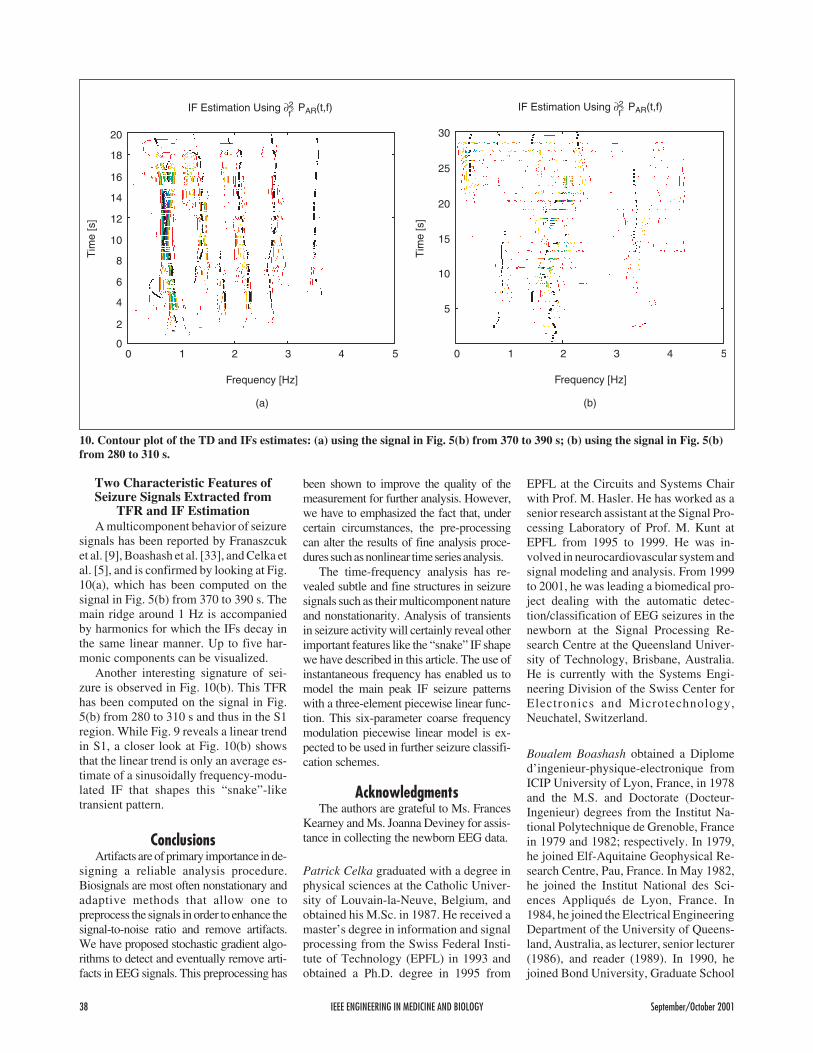
TFR and IF EstimationA multicomponent behavior of seizure
signals has been reported by Franaszcuket al. [9], Boashash et al. [33], and Celka etal. [5], and is confirmed by looking at Fig.10(a), which has been computed on thesignal in Fig. 5(b) from 370 to 390 s. Themain ridge around 1 Hz is accompaniedby harmonics for which the IFs decay inthe same linear manner. Up to five har-monic components can be visualized.
Another interesting signature of sei-zure is observed in Fig. 10(b). This TFRhas been computed on the signal in Fig.5(b) from 280 to 310 s and thus in the S1region. While Fig. 9 reveals a linear trendin S1, a closer look at Fig. 10(b) showsthat the linear trend is only an average es-timate of a sinusoidally frequency-modu-lated IF that shapes this “snake”-liketransient pattern.
ConclusionsArtifacts are of primary importance in de-
signing a reliable analysis procedure.Biosignals are most often nonstationary andadaptive methods that allow one topreprocess the signals in order to enhance thesignal-to-noise ratio and remove artifacts.We have proposed stochastic gradient algo-rithms to detect and eventually remove arti-facts in EEG signals. This preprocessing has
been shown to improve the quality of themeasurement for further analysis. However,we have to emphasized the fact that, undercertain circumstances, the pre-processingcan alter the results of fine analysis proce-dures suchasnonlinear timeseriesanalysis.
The time-frequency analysis has re-vealed subtle and fine structures in seizuresignals such as their multicomponent natureand nonstationarity. Analysis of transientsin seizure activity will certainly reveal otherimportant features like the “snake” IF shapewe have described in this article. The use ofinstantaneous frequency has enabled us tomodel the main peak IF seizure patternswith a three-element piecewise linear func-tion. This six-parameter coarse frequencymodulation piecewise linear model is ex-pected to be used in further seizure classifi-cation schemes.
AcknowledgmentsThe authors are grateful to Ms. Frances
Kearney and Ms. Joanna Deviney for assis-tance in collecting the newborn EEG data.
Patrick Celka graduated with a degree inphysical sciences at the Catholic Univer-sity of Louvain-la-Neuve, Belgium, andobtained his M.Sc. in 1987. He received amaster’s degree in information and signalprocessing from the Swiss Federal Insti-tute of Technology (EPFL) in 1993 andobtained a Ph.D. degree in 1995 from
EPFL at the Circuits and Systems Chairwith Prof. M. Hasler. He has worked as asenior research assistant at the Signal Pro-cessing Laboratory of Prof. M. Kunt atEPFL from 1995 to 1999. He was in-volved in neurocardiovascular system andsignal modeling and analysis. From 1999to 2001, he was leading a biomedical pro-ject dealing with the automatic detec-tion/classification of EEG seizures in thenewborn at the Signal Processing Re-search Centre at the Queensland Univer-sity of Technology, Brisbane, Australia.He is currently with the Systems Engi-neering Division of the Swiss Center forElectronics and Microtechnology,Neuchatel, Switzerland.
Boualem Boashash obtained a Diplomed’ingenieur-physique-electronique fromICIP University of Lyon, France, in 1978and the M.S. and Doctorate (Docteur-Ingenieur) degrees from the Institut Na-tional Polytechnique de Grenoble, Francein 1979 and 1982; respectively. In 1979,he joined Elf-Aquitaine Geophysical Re-search Centre, Pau, France. In May 1982,he joined the Institut National des Sci-ences Appliqués de Lyon, France. In1984, he joined the Electrical EngineeringDepartment of the University of Queens-land, Australia, as lecturer, senior lecturer(1986), and reader (1989). In 1990, hejoined Bond University, Graduate School
38 IEEE ENGINEERING IN MEDICINE AND BIOLOGY September/October 2001
Tim
e [s
]
Tim
e [s
]
0 01 12 23 34 45 5
Frequency [Hz] Frequency [Hz]
IF Estimation Using ∂2 P (t,f)AR2f
IF Estimation Using ∂2 P (t,f)AR2f
20
18
16
14
12
10
8
6
4
2
0
(a) (b)
30
25
20
15
10
5
10. Contour plot of the TD and IFs estimates: (a) using the signal in Fig. 5(b) from 370 to 390 s; (b) using the signal in Fig. 5(b)from 280 to 310 s.
of Science and Technology, as professorof electronics. In 1991, he joinedQueensland University of Technology asthe foundation professor of signal pro-cessing and director of the Signal Pro-cessing Research Centre.
Paul Colditz is a professor of perinatalmedicine at University of Queensland anddirector of the Perinatal Research Centreat the Royal Women’s Hospital, Brisbane.He is a specialist pediatrician andneonatologist with a master’s degree inbiomedical engineering and a Ph.D. inphilosophy from Oxford University. Hisinterest in caring for babies and their fami-lies has led to undertaking and fosteringmultidisciplinary research of the eventsbefore, during, and shortly after birth thataffect the health of individuals for the re-mainder of their lives. He directs a re-search program aimed at advancing thehealth of mothers and babies with the cen-tral focus being the development of thebrain and in particular the prevention ofdeath and brain damage in unborn andnewborn babies. Research projects en-compass fetal monitoring, cerebral palsy,birth asphyxia, mental retardation,intraventricular hemorrhage, periventric-ular leucomalacia, and Sudden InfantDeath Syndrome.
Address for Correspondence: PatrickCelka, Swiss Center for Electronics andMicrotechnology, Systems EngineeringDivision, Rue Jaquet-Droz 1, CH-2007Neuchatel, Switzerland. E-mail: [email protected].
References[1] J.J. Volpe, Neurology of the Newborn. Phila-delphia, PA: Saunders, 1987.[2] C.T. Lombroso, “Neonatal EEG polygraphyin normal and abnormal newborns,” in Electroen-cephalography. Basic Principles, Clinical Appli-cations and Related Fields, E. Niedermeyer andF.H. Lopes da Silva, Eds. Baltimore, MD: Wil-liams and Wilkins, pp. 802-875, 1993.[3] B. Boashash, P.S. Barklem, and M. Keir, “De-tection of seizure signals in newborns,” in Proc.ICASSP’99, Phoenix, AZ, USA, 1999, vol. 1, pp.2351-2354.[4] J. Gotman, D. Flanagan, B. Rosenblatt, A.Bye, and E. Mizrahi, “Evaluation of an automaticseizure detection method for the newborn EEG,”Electroencephalogr. Clin. Neurophysiol., vol.103, pp. 363-369, 1997.[5] P. Celka, M. Mesbah, and B. Boashash, “Au-tomatic detection of EEG seizures in newborns: A
subspace approach and performance compari-son,” IEEE Trans. Biomed. Eng., to be published.
[6] H. Carson, B. Boashash, and M. Mesbah, “De-tection of seizures in newborns using time-fre-quency analysis of EEG signals,” in Proc. IEEEWorkshop on Statistical Signal and Array Pro-cessing, Pocono Manor, PA, Aug. 14-16, 2000.
[7] K. Lehnertz, J. Arnhold, P. Grassberger, andC.E. Elger, Chaos in Brain? Singapore: WorldScientific, 2000.
[8] H. Witte, S. Glaser, and M. Rother, “Newspectral detection and elimination test algorithmsof ECG and EOG artefacts in neonatal EEG re-cordings,” Med. Biol. Eng. Comput., vol. 25, pp.127-130, 1987.
[9] P.J. Franaszczuk, G.K. Bergey, P.J. Durka,and H.M. Eisenberg, “Time-frequency analysisusing the matching pursuit algorithm applied toseizure originating from the mesial temporallobe,” Electroencephalogr. Clin. Neurophysiol.,vol. 106, pp. 513-521, 1998.
[10] I. Gath, C. Feuerstein, D.T. Pham, and G.Rondouin, “On the tracking of rapid dynamicchanges in seizure EEG,” IEEE Trans. Biomed.Eng., vol. 39, pp. 952-958, 1992
[11] S. Blanco, S. Kochen, O.A. Rosso, and P.Salgado, “Applying time-frequency analysis toseizure EEG activity,” IEEE Eng. Med. Biol.Mag., vol. 16, pp. 64-71, 1997.
[12] H.P. Zaveri, W.J. Williams, L.D. Iasemidis,and J.C. Sackellares, “Time-frequency represen-tation of electrocorticograms in temporal lobe ep-ilepsy,” IEEE Trans. Biomed. Eng., vol. 39, pp.502-509, 1992.
[13] American Electroencephalographic Society,“American Electroencephalographic Societyguidelines in EEG and evoked potentials 1986,” J.Clin. Neurophysiol. vol. 3 (Supplement 1), pp.1-152, 1986.
[14] E. Speckmann and C.E. Elger, “Introductionto the neurophysiological basis of the EEG andDC potentials,” in Electroencephalography. Ba-sic Principles, Clinical Applications, and RelatedFields, E. Niedermeyer and F.H. Lopes da Silva,Eds. Baltimore, MD: Williams and Wilkins, pp.15-26, 1993.
[15] J.R. Hughes, EEG in Clinical Practice.Boston, MA: Butterworths, 1982.
[16] R.R. Clancy, “Sharp electroencephalographictransients in neonates with seizures,” Ann. Neurol.,vol. 14, pp. 377-378, 1983.
[17] R.R. Clancy, “Interictal sharp EEG transientsin neonatal seizures,” J. Child Neurol., vol. 4, pp.30-38, 1989.
[18] S. Haykin, Adaptive Filter Theory.Englewood Cliffs, NJ: Prentice-Hall, 1991.
[19] S-J Lim and J.G. Harris, “Combined LMS/F al-gorithm,” Electr. Lett., vol. 33, pp. 467-468, 1997.
[20] M. Akay, “Detection and estimation methodsfor biomedical signals,” New York: AcademicPress, 1996.
[21] M. Wax and T. Kailath, “Detection of signalsby information theoretic criteria,” IEEE Trans.Acoustics, Speech, and Signal Processing, vol.33, pp. 387-392, 1985.
[22] R. Vetter, P. Celka, J.M. Vesin, Thonet, E.Pruvot, et al, “Subband modeling of the humancardiovascular system: New insights into cardio-vascular regulation,” Ann. Biomed. Eng., vol. 26,pp. 293-307, 1998.
[23] R. Vetter, “Extraction of efficient and char-acteristic features of multidimensional time se-ries: Application to the human cardiovascularsystem,” Ph.D. dissertation, Swiss Federal Insti-tute of Technology, Lausanne, 1999.
[24] P. Celka, “Adaptive pre-processing of new-born EEG seizures with optimization of algorithmsparameters,” Internal report, QUT/SPRC, 2001.
[25] D.A. Campbell, “Adaptive EEG transientevent discrimination using dynamic LMS filterweight leakage,” in Proc. ISSPA’99, vol. 1, pp.359-362, 1999.
[26] P. Valdes, J. Bosch, J.C. Jimenez, N. Trujillo,R. Biscay, F. Morales, J.L. Hernandez, and P.T.Ozaki, “The statistical identification of nonlinearbrain dynamics: A progress report,” in NonlinearDynamics and Brain Functioning, N. Pradhan,P.E. Rapp, R. Sreenivasan, Eds., Commack, NY:Nova, 1999.
[27] R. Vetter, P. Celka, R. Grueter, J-M Vesin, andU. Scherrer, “Observer of the human cardiac sym-pathetic nerve activity using blind source separa-tion and genetic algorithm optimization,”presented at IEEE EMBS Conference, Chicago,IL, 1997.
[28] R. Vautard, P. Yiou, M. Ghil, “Singular spec-trum analysis: A toolkit for short noisy chaoticsignals,” Physica D, vol. 20, pp. 217-236, 1986.
[29] P. Celka, M. Mostefa, M. Keir, B. Boashash,and P. Colditz, “Time-varying dimension analysisof EEG using adaptive principal component anal-ysis and model selection,” presented at WorldCongress on Medical Physics and Biomedical En-gineering, Chicago, IL, 2000.
[30] J. Chen, J. Vandewalle, W. Sansen, G.Vantrappen, and J. Janssens, “Adaptive spectralanalysis of cutaneous electrogastric signals usingautoregressive modelling,” Med. Biol. Eng.Comput. vol. 28, pp. 531-536, 1990.
[31] J. Duchene and D. Devedeux, “Time-fre-quency distributions applied to uterine EMG:Characterisation and assessment,” in Time Fre-quency and Wavelet in Biomedical Signal Pro-cessing, M. Akay, Ed. Piscataway, NJ: IEEEPress, 1998, pp. 117-146.
[32] F. Wendling, M.B. Shamsollahi, J.M. Badier,and J.J. Bellanger, “Time-frequency matching ofwarped depth-EEG seizure observations,” IEEETrans. Biomed. Eng., vol. 46, pp. 601-605, 1999.
[33] B. Boashash and M. Mesbah, “A time-fre-quency approach for newborn seizure detection,”IEEE Eng. Med. Biol. Mag., vol. 20, no. 5, pp.54-64, 2001.
[34] Z. Hussain and B. Boashash, “Multi-compo-nent IF estimation,” in Proc. Statistical Signal andArray Processing, Pocono Manor, PA, 2000, pp.559-563.
September/October 2001 IEEE ENGINEERING IN MEDICINE AND BIOLOGY 39