preparing the workforce for the automotive technology of 2025 occ/dma/win fall conference november...
TRANSCRIPT

Preparing the Workforce for the Automotive Technology of 2025
OCC/DMA/WINFall Conference
November 8, 2013
Bernard SwieckiCenter for Automotive Research (CAR)

Industry Collaboration & Partnerships
CAR collaborative working groups:
• Automotive Communities Partnership (ACP)• Connected Vehicle Working Group• United Tooling Coalition (UTC)• Program for Automotive Labor and Education (PALE)• Electric Vehicle Working Group• Advanced Automotive Information Technology Solutions Consortia• Coalition for Automotive Light-weighting Materials (CALM)
The Center for Automotive Researchbrings together stakeholders for thought
leadership and industry education.

CAR’s flagship event, August 5-8Now in its 48th year – a “can’t miss” event
More than 900 attendeesSessions on manufacturing, materials, connected vehicles, policy,
sales forecasting, purchasing, strategy, & capital investmentMore information at www.cargroup.org

Name a product … ?
• Which consists of nearly 30,000 parts,• Can be assembled at the rate of 1 per minute,• 16 hours a day, 200 days a year,• Runs for several years, most of the time without
a single manufacturing defect?• Is from the largest manufacturing sector in the
U.S. economy.
This accomplishment by the auto industry to execute mass production has become the norm.

U.S. Light Vehicle SalesPercent Change YTD Through October:
2013 vs. 2012
Passenger Cars
Light Trucks
Total
5.0%
11.8%
8.2%
Source: Automotive News; CAR Research
+ 986,53912,979,521
100.0%
+ 676,0186,419,453
49.5%
+ 310,5216,560,068
50.5%

Nissan
Hyundai-Kia
Honda
Fiat-Chrysler
Toyota
Ford
GM
Units: 1,032,134
Units: 1,057,910
Units: 1,273,550
Units: 1,497,086
Units: 1,867,155
Units: 2,078,939
Units: 2,343,861
8.0%
8.2%
9.8%
11.5%
14.4%
16.0%
18.1%
U.S. Market Share:YTD October 2013
Source: Automotive News; CAR Research

U.S. Light Vehicle Monthly Sales and SAAROctober 2011 – October 2013
200,000.0
400,000.0
600,000.0
800,000.0
1,000,000.0
1,200,000.0
1,400,000.0
1,600,000.0
1,800,000.0
0
2
4
6
8
10
12
14
16
1,021,185.0994,786.0
1,243,784.0
913,284.0
1,149,432.0
1,404,623.0
1,184,567.0
1,334,642.01,285,499.0
1,153,759.0
1,285,292.01,188,899.0
1,092,294.01,141,692.0
1,356,070.0
1,043,192.0
1,192,299.0
1,453,038.0
1,285,446.0
1,443,311.01,403,121.01,313,844.0
1,501,294.0
1,137,206.01,206,182.0
13.313.6 13.614.2
15.114.414.4
13.814.1 14.114.5
14.914.3
15.6 15.415.215.3 15.315.2
15.515.9
15.816.1
15.3 15.2
SALES SAAR
Mon
thly
SA
AR
Source: Automotive News; CAR Research

Big 7 Monthly U.S. Market Share1999 – 2013 YTD (October)
0%
5%
10%
15%
20%
25%
30%
35%
24.7%
16.0%
29.4%
18.0%
15.6%
11.5%
6.4%
9.8%
1.8%
8.2%
4.0%
8.0%8.7%
14.4%
Ford GM Chrysler Honda Hyundai-Kia Nissan Toyota
Year
Perc
ent o
f U.S
. Mar
ket S
ales
Source: Automotive News; CAR Research

Motor Vehicle & Parts Manufacturing Employment1999 – July 2013
1999 2000 2001 2002 2003 2004 2005 2006 2007 2008 2009 2010 2011 2012 July 2013
0
50,000
100,000
150,000
200,000
250,000
300,000
350,000
400,000
0
200,000
400,000
600,000
800,000
1,000,000
1,200,000
316,300
148,500
105,100
70,200
153,500
81,500
1,130,900
681,500
Michigan Indiana Ohio U.S.
Stat
e Le
vel
U.S.
50% change
64% change
53% change
47% change
Source: BLS, U.S. DOL
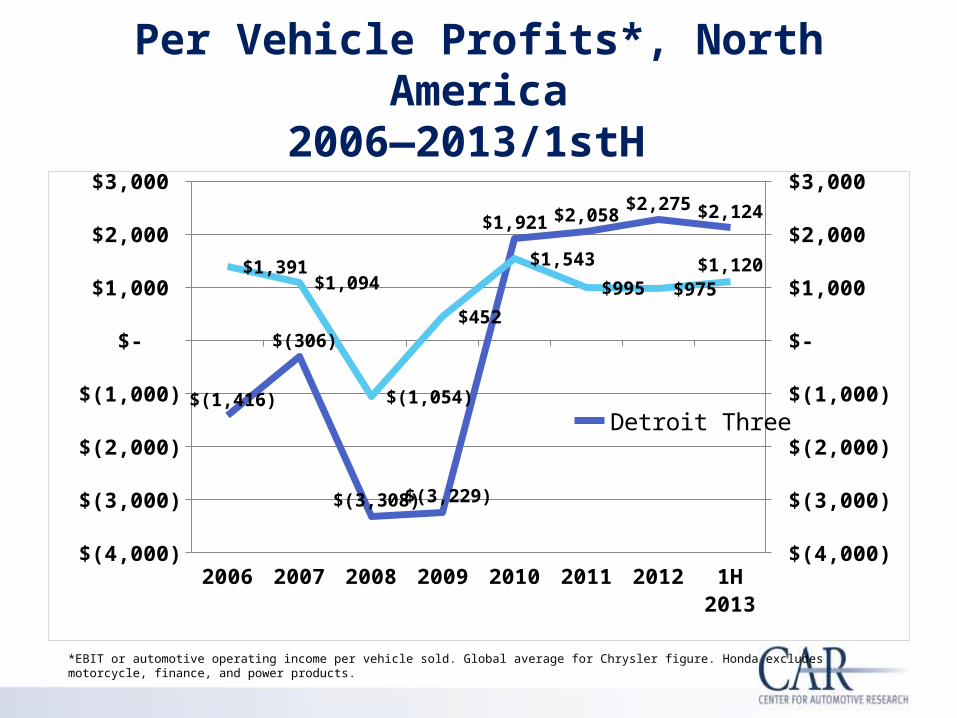
Per Vehicle Profits*, North America2006—2013/1stH
2006 2007 2008 2009 2010 2011 2012 1H 2013 $(4,000)
$(3,000)
$(2,000)
$(1,000)
$-
$1,000
$2,000
$3,000
$(4,000)
$(3,000)
$(2,000)
$(1,000)
$-
$1,000
$2,000
$3,000
$(1,416)
$(306)
$(3,308) $(3,229)
$1,921 $2,058 $2,275 $2,124
$1,391 $1,094
$(1,054)
$452
$1,543
$995 $975 $1,120
Detroit ThreeToyota and Honda
*EBIT or automotive operating income per vehicle sold. Global average for Chrysler figure. Honda excludesmotorcycle, finance, and power products.

Quarterly GDP Growth Rate07/1Q – 13/2Q
1Q 2007
3Q 2007
1Q 2008
3Q 2008
1Q 2009
3Q 2009
1Q 2010
3Q 2010
1Q 2011
3Q 2011
1Q 2012
3Q 2012
1Q 2013-10.0
-8.0
-6.0
-4.0
-2.0
0.0
2.0
4.0
6.0
0.3
3.1 2.71.5
-2.7
2.0
-2.0
-8.3
-5.4
-0.4
1.3
3.9
1.6
3.92.8 2.8
-1.3
3.2
1.4
4.93.7
1.2
2.8
0.11.1
2.5
Source: Bureau of Economic Analysis; Federal Open Market Committee

Auto Sales and Economic Growth are DisconnectedU.S. GDP Growth Rate and Vehicle Sales Growth Rate
1952 – Q2 2013
52535455565758596061626364656667686970717273747576777879808182838485868788899091929394959697989900010203040506070809101112
-4.0
-2.0
0.0
2.0
4.0
6.0
8.0
10.0
12.0
-30
-20
-10
0
10
20
30
40Sales Growth GDP Growth
GD
P G
row
th R
ate
Vehi
cle
Sale
s G
row
th R
ate
Source: Bureau of Economic Analysis

They are Getting Old . . .U.S. Light Vehicle Age and
Scrappage Rate
1997 1998 1999 2000 2001 2002 2003 2004 2005 2006 2007 2008 2009 2010 2011 2012 2013
8.6 8.8 8.8 8.9 8.9 9.0 9.1 9.4 9.5 9.7 9.8 10.0 10.3 10.6 10.9 11.2 11.4
6.78
5.88 5.76
6.746.40 6.19
5.504.76
4.355.03 5.24
5.66
4.12
5.21 4.90
Average Age Scrappage Rate (%)
Source: R.L. Polk

Unemployment RateJanuary 2008 – July 2013
Jan-08
Apr-08Jul-0
8
Oct-08
Jan-09
Apr-09Jul-0
9
Oct-09
Jan-10
Apr-10Jul-1
0
Oct-10
Jan-11
Apr-11Jul-1
1
Oct-11
Jan-12
Apr-12Jul-1
2
Oct-12
Jan-13
Apr-13Jul-1
34%
5%
6%
7%
8%
9%
10%
11%
12%
13%
14%
15%
7.1%
14.2%
10.6%
8.7%
4.7%
10.8%
8.4%
5.7%
10.6%
8.8%
7.2%
5.0%
10.0%
7.4%
Michigan Indiana Ohio U.S.
Source: Bureau of Labor Statistics

U.S. Light VehicleCAR Sales Forecast: 2007-2016
2007 2008 2009 2010 2011 2012 2013 2014 2015 20160
2
4
6
8
10
12
14
16
1816.1
13.2
10.411.6
12.8
14.515.7 16.0 16.2 16.2
Source: CAR Research, Oct. 2012
10.4%
11.6%
13.3%
8.3%

U.S. Vehicle Production & Automotive Employment Forecasts
2013-2016
2011 2012 2013 2014 2015 2016 2011 2012 2013 2014 2015 2016
Vehicle Production
8669700 10375257 11000000 11300000 11500000 11400000
Automotive Employment
603400 647500 670000 688000 700000 695000
1,000,000
3,000,000
5,000,000
7,000,000
9,000,000
11,000,000
13,000,000
550,000
650,000
750,000
Pro
du
cti
on
Em
plo
ym
en
tSource: Automotive News; CAR Research; BLS, July 2013
Employment not growing much:• Third party workers• More imported parts
and components• More overtime and
temporary workers• High productivity rate

Manufacturing Efficiency
Taiichi Ohno: Toyota Production System
Global Supply Chains
Flexible Manufacturing & Industrial Robotics
Global Platforms
Digital Engineering & Manufacturing

20122014
20162018
20202022
2024150
170
190
210
230
250
270
290
310
EPA
Estim
ate
gCO
2/M
ile S
tand
ard
Fuel Economy Regulation Projections
20122014
20162018
20202022
202420
25
30
35
40
45
50
55
60
Equi
vale
nt F
uel E
cono
my
Stan
dard
(MPG
)
Source: EPA and NHTSA
Grams CO2/mile
CAFE mpg 54.5

Fuel Economy & Safety
The most likely dramatic changes for the automotive market through 2025 could
well be a result of mandates by the federal government to improve the fuel economy
performance and vehicle safety

North American Automotive Manufacturing and R&D Clusters, 2011
© Center for Automotive Research, April 2013
Auto:Over 1M U.S. jobs (incl. spinoff)
Over $12B/year private R&D in Michigan

New technologies … what’s coming next ?
Automotive Innovation
• Powertrain
• Materials(Lightweighting and Crashworthiness)
• Electronics• Safety• Road use• Convenience
• Many supportive ones

Power Split
Hybrid
2-Mode H
ybrid
Conversi
on to Diese
l
Integrat
ed St
arter
Generat
or (Belt
/Cran
k)
12V Micr
o-Hybrid
Conversi
on to Adva
nced Dies
el *
Dual Clutch
Tran
smiss
ion
Mate
rial S
ubstitu
tion - 10%
Cylinder D
eacti
vation, O
HV
Turb
ocharg
ing and Downsiz
ing
6/7/8
-Spee
d Auto. T
rans.
with Im
prove
d Inter
nals
Continuously Vari
able Tr
ansm
ission
Cylinder D
eacti
vation, S
OHC *
Discrete
Variable
Valve Lift
SOHC *
Discrete
Variable
Valve Lift
DOHC *
Continuously Vari
able Valv
e Lift *
Discrete
Variable
Valve Lift
OHV *
VVT - Dual C
am Phasin
g *
Impro
ved Auto
. Tran
s. Contro
ls/Ex
ternals
Electr
ic Power
Steeri
ng
Impro
ved Acce
ssorie
s
Low Rollin
g Res
istan
ce Ti
res
Aero Drag
Reducti
on 10%
Stoich
iometric G
asolin
e Dire
ct Injecti
on *
VVT- Coupled
Cam Phas
ing SOHC
VVT - In
take
Cam Phasing
VVT - Coupled
Cam Phas
ing OHV
Engin
e Fric
tion Reduction
Low Fr
iction Lu
bricants
Higher V
oltage
/Impro
ved Alte
rnato
r 0.0%
5.0%
10.0%
15.0%
20.0%
25.0%
30.0%
35.0%
Assessment of Technologies for Improv-ing Light-Duty Vehicle Fuel Economy –
Over 40 Technologies
Perc
ent F
uel C
onsu
mpti
on R
educ
tion
* Preceding Technology Required Source: NAS 2011
High Impact - Strategic
Incremental – Low Risk
22

Average Material Content ofNorth American Light Vehicles
1995 2000 2005 20100.0%
5.0%
10.0%
15.0%
20.0%
25.0%
30.0%
35.0%
40.0%
45.0%
50.0%
Regular (Mild) Steel
High Strength Steel
Plastics & Composites
Aluminum
Iron Castings
Image: Porsche
Data source: Wards

Average Material Content ofNorth American Light Vehicles
1995 2000 2005 20100.0%
5.0%
10.0%
15.0%
20.0%
25.0%
30.0%
35.0%
40.0%
45.0%
50.0%
Regular (Mild) Steel
High Strength Steel
Plastics & Composites
Aluminum
Iron Castings
Image: Porsche
Data source: Wards

Joining Complexity Increasing
JoiningLaser Welding
Fasteners
Adhesives
Resistance Spot Welding

• New body shop for aluminum frame• Carbon fiber hood and roof and interior• Carbon-nano composite underbody panels• Magnesium frame seat• SMC fenders, doors and rear
quarter panels & hatch– Extrusions, castings and sheet
(castings 2mm – 11mm)– Hydro formed tubes
• Magnesium structural chassis components
• Joining: adhesive, laser welding, fasteners, spot welding
2014 Corvette Stingray: A Future Direction for Materials
Photo Source: General Motors

Key Material Trends (Next 10 years)
• Increased use of ultra high strength steel for structural components around the “safety cage” to prevent intrusion
• Aluminum use for chassis and exterior panels is increasing
• Fiber reinforced plastics (glass and carbon) for structural components are still several years away from high volume production
• Joining complexity: more laser welding, fasteners and adhesives
Structural Adhesive

Driver Attention & Connected Vehicles
Top 3 features consumers want:
1. Wireless Communications(bundle of many features)
2. Navigation
3. Automatic Crash Notification
connectivity is increasing
glance sequences

Connected Vehicles Defined• Connected vehicles use any of a number of different
wireless communication technologies to communicate with:– Each other– Roadside infrastructure– The “Cloud”
• Goals for connected vehicles are to enhance– Vehicle and roadway safety– Mobility– Environment (e.g., reduced fuel consumption)

Implications for Investment of Convergence and Self-Driving Vehicles
Crash elimination: Crash-free driving and improved vehicle safety could change the concept of a vehicle as we know it
Travel time dependability: Convergence can substantially reduce uncertainty in travel times via real-time, predictive assessment of travel times on all routes
Productivity improvements: Convergence will allow travelers to make use of travel time productively
Reduced need for new infrastructure: Self-driving can reduce the need for building new infrastructure and reduce maintenance costs
Improved energy efficiency: Reduced energy consumption in at least three ways: more efficient driving; lighter, more fuel-efficient vehicles; and efficient infrastructure
New models for vehicle ownership: Self-driving vehicles could lead to a major redefinition of vehicle ownership and expand opportunities for vehicle sharing
New business models and scenarios: Convergence of technologies may realign industries such that ecosystem participants need to compete and collaborate at the same time
Data challenges: Issues related to data security, privacy, and data analytics and aggregation could crop up due to abundance of data in vehicles

Industry Challenge Severe shortage of technical skills
Chicken-and-egg challenge with many technologies electrification/alternative fuels Materials supply chain Connectivity – retrofitting, infrastructure/automobile
Predictive modeling: CAE Powertrain control systems Materials forming and crash performance
Structures Fabrication (molding, hot forming, stamping AHSS/aluminum,
…) Joining (RSW, laser, adhesives, fasteners)
Greater industry collaboration Standards (material, testing, …)

Center for Automotive Research
Thank You