prepared in cooperation with the louisiana department … · eb-146 eb-1000 eb-827 07378500...
TRANSCRIPT
U.S. Department of the InteriorU.S. Geological Survey
Fact Sheet 2015–3001May 2015
Prepared in cooperation with the Louisiana Department of Transportation and Development
Water Resources of East Baton Rouge Parish, Louisiana
IntroductionInformation concerning the availability, use, and quality
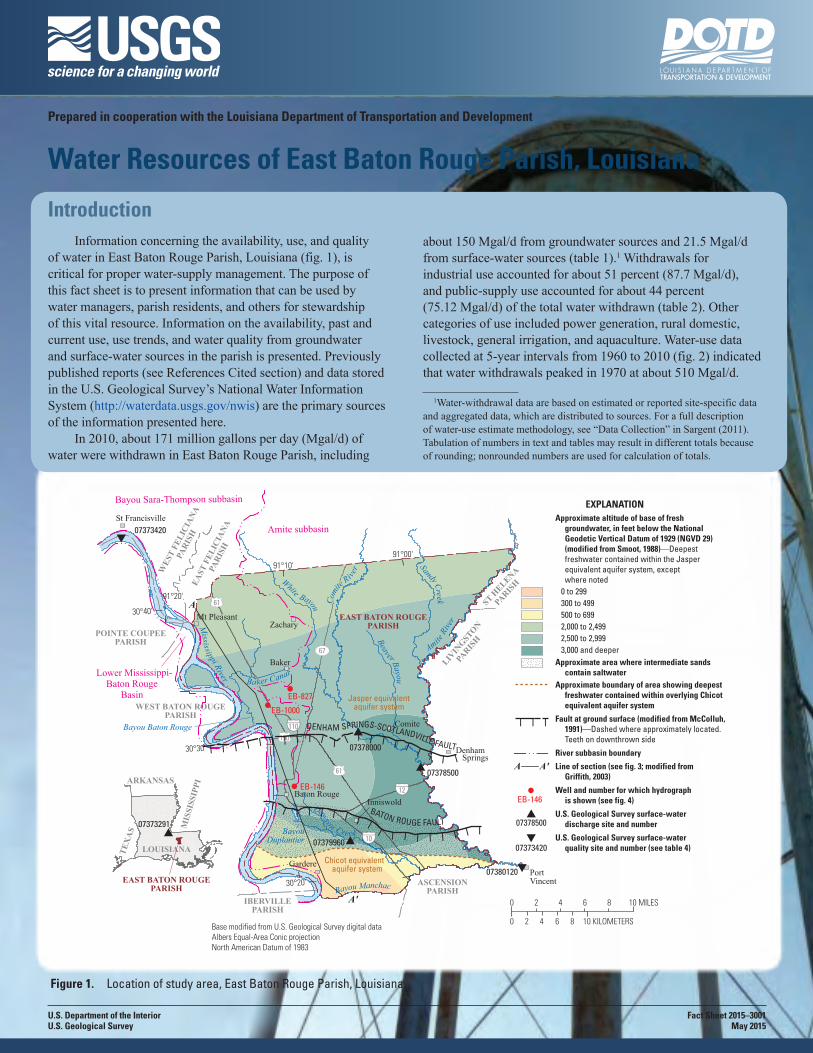
of water in East Baton Rouge Parish, Louisiana (fig. 1), is critical for proper water-supply management. The purpose of this fact sheet is to present information that can be used by water managers, parish residents, and others for stewardship of this vital resource. Information on the availability, past and current use, use trends, and water quality from groundwater and surface-water sources in the parish is presented. Previously published reports (see References Cited section) and data stored in the U.S. Geological Survey’s National Water Information System (http://waterdata.usgs.gov/nwis) are the primary sources of the information presented here.
In 2010, about 171 million gallons per day (Mgal/d) of water were withdrawn in East Baton Rouge Parish, including
about 150 Mgal/d from groundwater sources and 21.5 Mgal/d from surface-water sources (table 1).1 Withdrawals for industrial use accounted for about 51 percent (87.7 Mgal/d), and public-supply use accounted for about 44 percent (75.12 Mgal/d) of the total water withdrawn (table 2). Other categories of use included power generation, rural domestic, livestock, general irrigation, and aquaculture. Water-use data collected at 5-year intervals from 1960 to 2010 (fig. 2) indicated that water withdrawals peaked in 1970 at about 510 Mgal/d.
1Water-withdrawal data are based on estimated or reported site-specific data and aggregated data, which are distributed to sources. For a full description of water-use estimate methodology, see “Data Collection” in Sargent (2011). Tabulation of numbers in text and tables may result in different totals because of rounding; nonrounded numbers are used for calculation of totals.
Bayou Baton Rouge
Dawson Creek
Lower Mississippi-Baton Rouge
Basin
Amite subbasin
Bayou Sara-Thompson subbasin
EAST BATON ROUGEPARISH
EAST
FEL
ICIA
NAPA
RISH
WES
T FE
LICI
ANA
PARI
SH
ST HELENA
PARIS
H
LIVIN
GSTON
PARIS
H
ASCENSIONPARISH
IBERVILLEPARISH
WEST BATON ROUGEPARISH
POINTE COUPEEPARISH
Jasper equivalentaquifer system
Chicot equivalent aquifer system
Comi
te Rive
r
Comi
te Rive
r
Amite R
iver
Bayou Manchac
61
61
190
67
10
110
12
Mt PleasantM
ississippi River
BayouDuplantier
Baker Canal
Beaver Bayou
S andy Creek
White Bayou
Baton Rouge
PortVincent
Baker
Denham Springs
Gardere
Inniswold
Zachary
St Francisville
Comite
BATON ROUGE FAULT
DENHAM SPRINGS-SCOTLANDVILLE FAULT
Base modified from U.S. Geological Survey digital dataAlbers Equal-Area Conic projectionNorth American Datum of 1983
A'
A
C
C
C
O
O
EB-146
EB-1000
EB-827
07378500
07378000
07379960
07380120
07373420
10 KILOMETERS
0
0 2 4 6 8
2 4 6 8 10 MILES
TEX
AS
ARKANSAS
MIS
SISS
IPPI
LOUISIANA
EAST BATON ROUGEPARISH
C07373291
30°30'
30°40'
30°20'
91°20'
91°10'91°00'
OC
EXPLANATIONApproximate altitude of base of fresh groundwater, in feet below the National Geodetic Vertical Datum of 1929 (NGVD 29) (modified from Smoot, 1988)—Deepest freshwater contained within the Jasper equivalent aquifer system, except where noted 0 to 299 300 to 499 500 to 699 2,000 to 2,499 2,500 to 2,999 3,000 and deeperApproximate area where intermediate sands contain saltwaterApproximate boundary of area showing deepest freshwater contained within overlying Chicot equivalent aquifer system
Fault at ground surface (modified from McColluh, 1991)—Dashed where approximately located. Teeth on downthrown side
River subbasin boundary
Line of section (see fig. 3; modified from Griffith, 2003)
Well and number for which hydrograph is shown (see fig. 4)
U.S. Geological Survey surface-water discharge site and number
U.S. Geological Survey surface-water quality site and number (see table 4)
EB-146
A'A
07373420
07378500
Figure 1. Location of study area, East Baton Rouge Parish, Louisiana.

Table 1. Water withdrawals, in million gallons per day, by source in East Baton Rouge Parish, Louisiana, 2010 (Sargent, 2011; B.P. Sargent, unpub. data, 2011).
Aquifer, aquifer system, or surface-water body
GroundwaterSurface water
Mississippi River alluvial aquifer 0.09Chicot equivalent aquifer system 16.44Evangeline equivalent aquifer system 61.04Jasper equivalent aquifer system 72.33Mississippi River 21.51Miscellaneous streams 0.01Total 149.89 21.52
Table 2. Water withdrawals, in million gallons per day, by use category in East Baton Rouge Parish, Louisiana, 2010 (modified from Sargent, 2011).
Use category Groundwater Surface water TotalPublic supply 75.12 0.00 75.12Industrial 66.22 21.51 87.73Power generation 7.79 0.00 7.79Rural domestic 0.28 0.00 0.28Livestock 0.19 0.01 0.21General irrigation 0.25 0.00 0.25Aquaculture 0.04 0.00 0.04Total 149.89 21.52 171.41
0
50
100
150
200
250
300
350
400
450
500
550
1960 1965 1970 1975 1980 1985 1990 1995 2000 2005 2010
Year
GroundwaterSurface water
EXPLANATION
Annu
al w
ithdr
awal
s, in
mill
ion
gallo
ns p
er d
ay
Figure 2. Water withdrawals in East Baton Rouge Parish, Louisiana, 1960–2010 (Sargent, 2011).
Groundwater ResourcesThe primary sources of fresh groundwater (water with a
chloride concentration of 250 milligrams per liter [mg/L] or less) in East Baton Rouge Parish from shallowest to deepest are the
Chicot equivalent, Evangeline equivalent, and Jasper equivalent aquifer systems (table 1, fig. 3). The Mississippi River alluvial aquifer also is present along much of the western edge of the parish but is a minor source of freshwater in East Baton Rouge Parish (table 1) and is not discussed further in this fact sheet. In 2010, groundwater withdrawals totaled about 150 Mgal/d for various use categories including public supply, industrial, power generation, rural domestic, livestock, general irrigation, and aquaculture (tables 1 and 2).
The Chicot, Evangeline, and Jasper equivalent aquifer systems extend across most of southeastern Louisiana and generally consist of silt, sand, and gravel separated by discontinuous layers of clay and sandy clay. The aquifer systems are primarily recharged by precipitation in outcrop areas north of East Baton Rouge Parish in East and West Feliciana Parishes, St. Helena Parish, and southwestern Mississippi (Griffith, 2003). The aquifer systems dip and thicken to the south and contain freshwater to depths of about 3,000 feet (ft) below the National Geodetic Vertical Datum of 1929 (NGVD 29) in East Baton Rouge Parish.
Groundwater in East Baton Rouge Parish generally flows south-southwest in the Chicot equivalent aquifer system, southwest in the Evangeline equivalent aquifer system, southwest in the upper part of the Jasper equivalent aquifer system, and west in the lower part of the Jasper equivalent aquifer system (Martin and others, 1988; Tomaszewski, 2011). Saltwater movement in East Baton Rouge Parish is an issue affecting the availability of fresh groundwater. Generally, the location of the Baton Rouge Fault (fig. 1) coincides with an abrupt change in depths of freshwater (fig. 3). North of the fault, the base of fresh groundwater is present in the Jasper equivalent aquifer system at depths ranging from about 2,000 to 3,000 ft below NGVD 29. Fresh groundwater is present south of the fault in a small area of the “2,000-foot” sand of the Jasper equivalent aquifer system at depths ranging from about 2,500 to 3,000 ft below NGVD 29 in the southeast part of the parish. Fresh groundwater is also present south of the fault in the Chicot equivalent aquifer system at depths ranging from less than 200 ft below NGVD 29 in the southwest part of the parish to about 800 ft below NGVD 29 in the southeast part of the parish. Large groundwater withdrawals in the Baton Rouge area have induced northward encroachment of saltwater across the Baton Rouge Fault into parts of the freshwater aquifer systems (Griffith, 2003).
Table 3 presents a statistical summary of freshwater samples collected from 221 wells screened in the Chicot equivalent aquifer system, 171 wells screened in the Evangeline equivalent aquifer system, and 151 wells screened in the Jasper equivalent aquifer system in East Baton Rouge Parish. Generally, freshwater from these aquifer systems is soft2 and does not exceed the U.S. Environmental Protection Agency’s Secondary Maximum Contaminant Levels (SMCLs)3 for concentrations of iron and dissolved solids. Median values for pH increase as aquifer system depth increases (table 3).
2Hardness ranges, expressed as milligrams per liter of calcium carbonate, are as follows: 0–60, soft; 61–120, moderately hard; 121–180, hard; greater than 180, very hard (Hem, 1985).
3The SMCLs are nonenforceable Federal guidelines regarding cosmetic effects (such as tooth or skin discoloration) or aesthetic effects (such as taste, odor, or color) of drinking water. At high concentrations or values, health implications as well as aesthetic degradation might exist. SMCLs were established as guidelines for the States by the U.S. Environmental Protection Agency (1992).

BATO
N R
OUGE
FAUL
T
DEN
HAM
SPR
INGS
SCOT
LAN
DVIL
LE F
AULT
I-10
BEN
D IN
SECT
ION
BEN
D IN
SECT
ION
BEN
D IN
SECT
ION
?
“2,400-foot”sand
?
?
?
?
?
?
?
?
?
?
?
?
?
?
?
?
?
?
?
?
?
?
?
?
“2,000-foot”sand
“1,500-foot”sand
“1,200-foot”sand
“1,000-foot”sand
“800-foot”sand
“600-foot”sand
“400-foot”sand
Mississippi Riveralluvial aquifer
Shallow sand
“800-foot”sand
“1,200-foot”sand
“1,500-foot”sand
“1,700-foot”sand
“2,000-foot”sand
“2,400-foot”sand
“2,800-foot”sand
Catahoulaaquifer
“2,800-foot”sand
“2,400-foot”sand
“2,000-foot”sand
“2,400-foot”sand
“1,700-foot”sand
“1,700-foot”sand
“1,500-foot”sand
“1,200-foot” sand
“1,000-foot”sand
“600-foot” sand
“400-foot” sandShallow sand
“600-foot”sand
“800-foot” sand
“1,700-foot”sand
“400-foot”sand Shallow sand
Shallow sand
IBE
RV
ILL
EPA
RIS
H
EA
ST B
ATO
NR
OU
GE
PA
RIS
H
EA
ST B
ATO
NR
OU
GE
PA
RIS
H
EA
ST F
EL
ICIA
NA
PAR
ISH
A'SOUTH
ANORTH
?
Jasper equivalent aquifer system
Catahoula aquifer
GENERALIZED SURFACE PROFILE
0
0 10 KILOMETERS
10 MILES
Freshwater in sandSaltwater in sand—Saltwater contains greater
than 250 milligrams per liter chlorideClayLithologic contact—Separates clay and sand
layers. Dashed where approximate. Queried where uncertain
Hydrogeologic contact—Defines boundary between conjoined or merged aquifers
Fault
?
Hydrogeologic contact—Defines boundary between aquifers or aquifer systems
EXPLANATION
Chicot equivalent aquifer system
Evangeline equivalent
aquifer system
VERTICAL SCALE IS GREATLY EXAGGERATEDDatum is National Geodetic Vertical Datum of 1929 (NGVD 29)
FEET200
NGVD 29
-200
-400
-600
-800
-1,000
-1,200
-1,400
-1,600
-1,800
-2,000
-2,200
-2,400
-2,600
-2,800
-3,000
-3,200
FEET200
NGVD 29
-200
-400
-600
-800
-1,000
-1,200
-1,400
-1,600
-1,800
-2,000
-2,200
-2,400
-2,600
-2,800
-3,000
-3,200
Figure 3. Generalized north-to-south hydrogeologic section through East Baton Rouge Parish, Louisiana (modified from Griffith, 2003). Trace of section shown on figure 1.
The Chicot Equivalent Aquifer SystemThe primary aquifers composing the Chicot equivalent
aquifer system in East Baton Rouge Parish from shallowest to deepest are the shallow, “400-foot,” and “600-foot” sands of the Baton Rouge area (Griffith, 2003). The shallow sands of the Baton Rouge area consist of discontinuous sand deposits, which may or may not be hydraulically connected. The “400-foot” and “600-foot” sands underlie the shallow sands or the surficial confining layer and often coalesce into a single layer (fig. 3). The altitude of the base of the Chicot equivalent aquifer system ranges in depth from about 250 ft below NGVD 29 near the north-central parish line to about 950 ft below NGVD 29 near the south-central parish line (Griffith, 2006).
In 2009, water levels in the Chicot equivalent aquifer system in East Baton Rouge Parish ranged from almost 100 ft
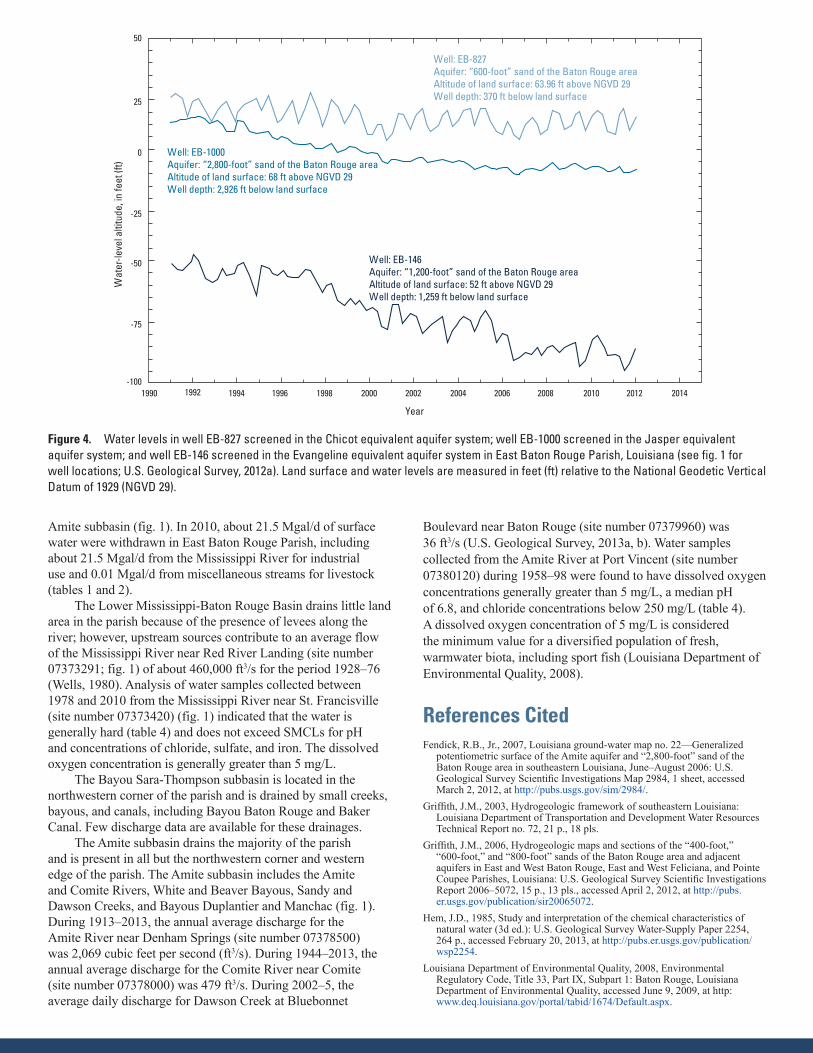
above NGVD 29 along the northern parish line to about 3 ft below NGVD 29 just north of the Baton Rouge Fault (Tomaszewski, 2011). Water levels in the “600-foot” sand at well EB-827, which is located in west-central East Baton Rouge Parish (fig. 1), fluctuated seasonally about 10 ft and declined about 5 ft between 1991 and 2012 (fig. 4).
In 2014, State well-registration records listed 581 active water wells screened in the Chicot equivalent aquifer system in East Baton Rouge Parish, including 371 domestic, 104 irrigation, 65 public supply, and 41 industrial. Well depths ranged from 15 to 980 ft below land surface. Reported yields from wells screened in the Chicot equivalent aquifer system in East Baton Rouge Parish ranged from 4 to 2,334 gallons per minute (gal/min) (Louisiana Department of Natural Resources, 2014).

Table 3. Summary of selected water-quality characteristics for freshwater in the Chicot, Evangeline, and Jasper equivalent aquifer systems in East Baton Rouge Parish, Louisiana (U.S. Geological Survey, 2012b).
[Values are in milligrams per liter, except as noted. °C, degrees Celsius; PCU, platinum cobalt units; µS/cm, microsiemens per centimeter; SU, standard units; CaCO3, calcium carbonate; µg/L, micrograms per liter; <, less than; SMCL, Secondary Maximum Contaminant Level established by the U.S. Environmental Protection Agency (2012); NA, not applicable]
Tempera-ture (°C)
Color (PCU)
Specific con-ductance, field (µS/cm at 25 °C)
pH, field (SU)
Hardness (as CaCO3)
Chloride, filtered (as Cl)
Iron, filtered
(µg/L as Fe)
Manganese, filtered
(µg/L as Mn)
Dissolved solids, filtered
Chicot equivalent aquifer system, 1940–2011 (221 wells)Median 22.0 6 324 7.4 44 13 120 90 24010th percentile 20.0 0 219 6.6 10 4.1 <10 <10 17990th percentile 24.0 40 864 8.1 180 87 1,400 420 507Number of samples 116 68 138 123 179 219 58 53 82Percentage of samples that
do not exceed SMCLsNA 72 NA 93 NA 100 69 36 89
Evangeline equivalent aquifer system, 1939–2011 (171 wells)Median 26.4 10 301 8.0 9 4.5 40 20 20610th percentile 24.0 0 252 7.2 2 2.8 <5 <6 19090th percentile 29.5 31 388 8.8 36 8.4 340 100 237Number of samples 106 59 95 114 132 168 39 34 72Percentage of samples that
do not exceed SMCLsNA 71 NA 75 NA 100 87 71 100
Jasper equivalent aquifer system, 1939–2011 (151 wells)Median 33.0 12 372 8.6 4 4.0 40 <10 24210th percentile 29.5 0 281 7.7 0.4 2.4 <10 0 18490th percentile 35.5 36 640 9.0 16 23 170 84 451Number of samples 93 68 105 93 115 151 44 37 83Percentage of samples that
do not exceed SMCLsNA 53 NA 46 NA 100 93 84 90
SMCLsNA 15 NA 6.5–8.5 NA 250 300 50 500
The Evangeline Equivalent Aquifer System
The aquifers composing the Evangeline equivalent aquifer system in East Baton Rouge Parish are the “800-foot,” “1,000-foot,” “1,200-foot,” “1,500-foot,” and “1,700-foot” sands of the Baton Rouge area (Griffith, 2003; fig. 3). The altitude of the base of the aquifer system ranges from about 800 ft below NGVD 29 near the northern parish line to about 2,400 ft below NGVD 29 near the southern parish line (fig. 3) (Griffith, 2003).
In 2003, water levels in the “1,500-foot” and “1,700-foot” sands north of the Baton Rouge Fault ranged from about 75 ft above NGVD 29 in the extreme northeastern corner of the parish to about 140 ft below NGVD 29 in southwestern East Baton Rouge Parish (Prakken, 2004). Water levels in the “1,200-foot” sand at well EB-146, located in the city of Baton Rouge (fig. 1), generally fluctuated from 5 to 10 ft seasonally and declined about 35 ft between 1991 and 2012 (fig. 4).
In 2014, State well-registration records listed 131 active water wells screened in the Evangeline equivalent aquifer system in East Baton Rouge Parish, including 58 public supply, 36 industrial, 32 domestic, 4 irrigation, and 1 power generation. Well depths ranged from 300 to 2,170 ft below land surface. Reported yields from these wells ranged from about 20 to 3,000 gal/min (Louisiana Department of Natural Resources, 2014).
The Jasper Equivalent Aquifer System
The aquifers composing the Jasper equivalent aquifer system in East Baton Rouge Parish are the “2,000-foot,” “2,400-foot,” and “2,800-foot” sands of the Baton Rouge area (Griffith, 2003;
fig. 3). In East Baton Rouge Parish, the Jasper equivalent aquifer system dips and thickens in a southerly direction toward the Gulf of Mexico. The altitude of the base of the aquifer system is not well defined but probably ranges from about 2,300 ft below NGVD 29 near the northwestern parish line to about 3,000 ft below NGVD 29 at the Baton Rouge Fault (fig. 3) (Griffith, 2003).
In 2006, water levels in the Jasper equivalent aquifer system north of the Baton Rouge Fault ranged from about 40 ft above NGVD 29 in the extreme northeastern corner of the parish to about 49 ft below NGVD 29 in the northwestern corner of the parish near Mt. Pleasant (Fendick, 2007). Water levels in the “2,800-foot” sand at well EB-1000, located in west-central East Baton Rouge Parish (fig. 1), fluctuated less than about 5 ft yearly and declined about 20 ft between 1991 and 2012 (fig. 4).
In 2014, State well-registration records listed 126 active water wells screened in the Jasper equivalent aquifer system in East Baton Rouge Parish, including 65 public supply, 39 industrial, 12 domestic, 7 power generation, and 3 irrigation. Well depths ranged from 1,300 to 2,770 ft below land surface. Reported yields from these wells range from about 5 to 2,503 gal/min (Louisiana Department of Natural Resources, 2014).
Surface-Water Resources Surface-water resources in East Baton Rouge Parish are
found in two regional drainage basins: the Lower Mississippi-Baton Rouge Basin, which runs in a narrow strip along the Mississippi River, and the regional Lake Maurepas Basin. The Lake Maurepas Basin is subdivided into two subbasins in East Baton Rouge Parish: the Bayou Sara-Thompson subbasin and the
Year
1990 1994 1998 2002 2006 20101992 1996 2000 2004 2008 2012 2014
Wat
er-le
vel a
ltitu
de, i
n fe
et (f
t)
-75
-100
-50
-25
0
25
50
Well: EB-146Aquifer: “1,200-foot” sand of the Baton Rouge areaAltitude of land surface: 52 ft above NGVD 29Well depth: 1,259 ft below land surface
Well: EB-1000Aquifer: “2,800-foot” sand of the Baton Rouge areaAltitude of land surface: 68 ft above NGVD 29Well depth: 2,926 ft below land surface
Well: EB-827Aquifer: “600-foot” sand of the Baton Rouge areaAltitude of land surface: 63.96 ft above NGVD 29Well depth: 370 ft below land surface
Figure 4. Water levels in well EB-827 screened in the Chicot equivalent aquifer system; well EB-1000 screened in the Jasper equivalent aquifer system; and well EB-146 screened in the Evangeline equivalent aquifer system in East Baton Rouge Parish, Louisiana (see fig. 1 for well locations; U.S. Geological Survey, 2012a). Land surface and water levels are measured in feet (ft) relative to the National Geodetic Vertical Datum of 1929 (NGVD 29).
Amite subbasin (fig. 1). In 2010, about 21.5 Mgal/d of surface water were withdrawn in East Baton Rouge Parish, including about 21.5 Mgal/d from the Mississippi River for industrial use and 0.01 Mgal/d from miscellaneous streams for livestock (tables 1 and 2).
The Lower Mississippi-Baton Rouge Basin drains little land area in the parish because of the presence of levees along the river; however, upstream sources contribute to an average flow of the Mississippi River near Red River Landing (site number 07373291; fig. 1) of about 460,000 ft3/s for the period 1928–76 (Wells, 1980). Analysis of water samples collected between 1978 and 2010 from the Mississippi River near St. Francisville (site number 07373420) (fig. 1) indicated that the water is generally hard (table 4) and does not exceed SMCLs for pH and concentrations of chloride, sulfate, and iron. The dissolved oxygen concentration is generally greater than 5 mg/L.
The Bayou Sara-Thompson subbasin is located in the northwestern corner of the parish and is drained by small creeks, bayous, and canals, including Bayou Baton Rouge and Baker Canal. Few discharge data are available for these drainages.
The Amite subbasin drains the majority of the parish and is present in all but the northwestern corner and western edge of the parish. The Amite subbasin includes the Amite and Comite Rivers, White and Beaver Bayous, Sandy and Dawson Creeks, and Bayous Duplantier and Manchac (fig. 1). During 1913–2013, the annual average discharge for the Amite River near Denham Springs (site number 07378500) was 2,069 cubic feet per second (ft3/s). During 1944–2013, the annual average discharge for the Comite River near Comite (site number 07378000) was 479 ft3/s. During 2002–5, the average daily discharge for Dawson Creek at Bluebonnet
Boulevard near Baton Rouge (site number 07379960) was 36 ft3/s (U.S. Geological Survey, 2013a, b). Water samples collected from the Amite River at Port Vincent (site number 07380120) during 1958–98 were found to have dissolved oxygen concentrations generally greater than 5 mg/L, a median pH of 6.8, and chloride concentrations below 250 mg/L (table 4). A dissolved oxygen concentration of 5 mg/L is considered the minimum value for a diversified population of fresh, warmwater biota, including sport fish (Louisiana Department of Environmental Quality, 2008).
References Cited Fendick, R.B., Jr., 2007, Louisiana ground-water map no. 22—Generalized
potentiometric surface of the Amite aquifer and “2,800-foot” sand of the Baton Rouge area in southeastern Louisiana, June–August 2006: U.S. Geological Survey Scientific Investigations Map 2984, 1 sheet, accessed March 2, 2012, at http://pubs.usgs.gov/sim/2984/.
Griffith, J.M., 2003, Hydrogeologic framework of southeastern Louisiana: Louisiana Department of Transportation and Development Water Resources Technical Report no. 72, 21 p., 18 pls.
Griffith, J.M., 2006, Hydrogeologic maps and sections of the “400-foot,” “600-foot,” and “800-foot” sands of the Baton Rouge area and adjacent aquifers in East and West Baton Rouge, East and West Feliciana, and Pointe Coupee Parishes, Louisiana: U.S. Geological Survey Scientific Investigations Report 2006–5072, 15 p., 13 pls., accessed April 2, 2012, at http://pubs.er.usgs.gov/publication/sir20065072.
Hem, J.D., 1985, Study and interpretation of the chemical characteristics of natural water (3d ed.): U.S. Geological Survey Water-Supply Paper 2254, 264 p., accessed February 20, 2013, at http://pubs.er.usgs.gov/publication/wsp2254.
Louisiana Department of Environmental Quality, 2008, Environmental Regulatory Code, Title 33, Part IX, Subpart 1: Baton Rouge, Louisiana Department of Environmental Quality, accessed June 9, 2009, at http: www.deq.louisiana.gov/portal/tabid/1674/Default.aspx.

Table 4. Summary of selected water-quality characteristics for the Amite River and Mississippi River near East Baton Rouge Parish, Louisiana (U.S. Geological Survey, 2012b).
[Values are in milligrams per liter, except as noted. SU, standard units; CaCO3, calcium carbonate; µg/L, micrograms per liter; SMCL, Secondary Maximum Contaminant Level established by the U.S. Environmental Protection Agency (2012); NA, not applicable; µS/cm, microsiemens per centimeter; °C, degrees Celsius; <, less than]
Amite River at Port Vincent, 1958–981
Dissolved solids, filtered
Oxygen, dissolved
pH, field (SU)
Hard- ness
(as CaCO3)
Calcium, filtered (as Ca)
Magne-sium,
filtered (as Mg)
Man-ganese, filtered (µg/L)
Chloride, filtered (as Cl)
Sulfate, filtered (as SO4)
Iron, filtered (µg/L as
Fe)Median 76 7.8 6.8 19.2 5 1.8 150 14.5 3.8 27010th percentile 53 5.1 6.1 13 3.4 0.9 55.5 7.05 1.6 15290th percentile 171 9.9 7.3 33.5 9.1 2.7 240 65 7.8 430Number of samples 81 41 83 76 76 76 36 82 81 35Percentage of samples that
do not exceed SMCLs100 NA 69 NA NA NA 8 100 NA 69
SMCLs 500 NA 6.5–8.5 NA NA NA 50 250 NA 300Mississippi River near St. Francisville, 1978–20102
Specific conductance,
field (µS/cm at 25 °C)
Oxygen, dissolved
pH, field (SU)
Hard- ness
(as CaCO3)
Calcium, filtered (as Ca)
Magne-sium,
filtered (as Mg)
Sodium, filtered (as Na)
Chloride, filtered (as Cl)
Sulfate, filtered (as SO4)
Iron, filtered (µg/L as
Fe)Median 380 8.6 7.8 150 38 12 17 20 44 1010th percentile 298 6.5 7.3 110 31 8.7 11 14 32 <1090th percentile 473 11.8 8.0 180 46 16 27 28 66 40Number of samples 412 402 407 400 400 405 346 410 409 393Percentage of samples that
do not exceed SMCLsNA NA 100 NA NA NA NA 100 100 100
SMCLs NA NA 6.5–8.5 NA NA NA NA 250 250 3001Site number 07380120. 2Site number 07373420.
Louisiana Department of Natural Resources, 2014, Strategic Online Natural Resources Information System (SONRIS): Louisiana Department of Natural Resources database, accessed November 5, 2014, at http://sonris.com/.
Martin, Angel, Jr.; Whiteman, C.D., Jr.; and Becnel, M.J., 1988, Generalized potentiometric surfaces of the upper and lower Jasper and equivalent aquifers in Louisiana, 1984: U.S. Geological Survey Water-Resources Investigations Report 87–4139, 2 sheets, accessed February 24, 2012, at http://pubs.er.usgs.gov/publication/wri874139.
McCulloh, R.P., 1991, Surface faults in East Baton Rouge Parish—Baton Rouge, La.: Louisiana Geological Survey Open-File Series 91–02, 25 p.
Prakken, L.B., 2004, Louisiana ground-water map no. 17—Generalized potentiometric surface of the Kentwood aquifer system and the “1,500-foot” and “1,700-foot” sands of the Baton Rouge area in southeastern Louisiana, March–April 2003: U.S. Geological Survey Scientific Investigations Map 2862, 2 sheets, accessed February 24, 2012, at http://pubs.er.usgs.gov/publication/sim2862.
Sargent, B.P., 2011, Water use in Louisiana, 2010: Louisiana Department of Transportation and Development Water Resources Special Report no. 17, 135 p.
Smoot, C.W., 1988, Louisiana hydrologic atlas map no. 3—Altitude of the base of freshwater in Louisiana: U.S. Geological Survey Water-Resources Investigations Report 86–4314, 1 sheet, accessed November 2, 2011, at http://pubs.er.usgs.gov/publication/wri864314.
Tomaszewski, D.J., 2011, Water-level surface in the Chicot equivalent aquifer system in southeastern Louisiana, 2009: U.S. Geological Survey Scientific Investigations Map 3173, 2 pls., accessed February 24, 2012, at http://pubs.usgs.gov/sim/3173/.
U.S. Environmental Protection Agency, 1992, Secondary Drinking Water Regulations—Guidance for nuisance chemicals: U.S. Environmental Protection Agency publication EPA 810/K-92-001, 4 p., accessed September 28, 2011, at http://water.epa.gov/drink/contaminants/secondarystandards.cfm.
U.S. Environmental Protection Agency, 2012, 2012 Edition of the drinking water standards and health advisories: U.S. Environmental Protection Agency publication EPA 822-S-12-001, Office of Water, 12 p., accessed July 27, 2012, at http://water.epa.gov/action/advisories/drinking/upload/dwstandards2012.pdf.
U.S. Geological Survey, 2012a, Groundwater levels for Louisiana: National Water Information System Web Interface, accessed February 18, 2012, at http://nwis.waterdata.usgs.gov/la/nwis/gwlevels.
U.S. Geological Survey, 2012b, Water-quality samples for Louisiana: National Water Information System Web Interface, accessed February 6, 2012, at http://nwis.waterdata.usgs.gov/la/nwis/qwdata/.
U.S. Geological Survey, 2013a, Annual water data reports: Accessed July 2, 2014, at http://wdr.water.usgs.gov/.
U.S. Geological Survey, 2013b, National Water Information System—Web Interface: Accessed July 2, 2014, at http://waterdata.usgs.gov/nwis.
Wells, F.C., 1980, Hydrology and water quality of the lower Mississippi River: Louisiana Department of Transportation and Development, Office of Public Works Water Resources Technical Report no. 21, 83 p.
This fact sheet was published by the U.S. Geological Survey in cooperation with the Louisiana Department of Transportation and Development (DOTD). Thanks are given to Zahir “Bo” Bolourchi, Director, Water Resources Programs, Louisiana DOTD, who contributed to the content of the fact sheet.
By Vincent E. White and Lawrence B. Prakken
For additional information, contact:
Director, USGS Lower Mississippi-Gulf Water Science Center3535 S. Sherwood Forest Blvd., Suite 120Baton Rouge, LA 70816E-mail: [email protected]: (225) 298–5490Telephone: (225) 298–5481Home Page: http://la.water.usgs.gov
ISSN 2327-6916 (print)ISSN 2327-6932 (online)http://dx.doi.org/110.3133/fs20153001